Innovations in Natural Gas Next 20 Years -...
29
Innovations in Natural Gas Turbines … Next 20 Years Steve Bolze President and CEO, GE Power & Water Senior Vice President, GE 2011 Summer Seminar August 2, 2011 © 2011, General Electric Company
Transcript of Innovations in Natural Gas Next 20 Years -...

Innovations in Natural Gas Turbines … Next 20 Years
Steve BolzePresident and CEO, GE Power & Water Senior Vice President, GE
2011 Summer SeminarAugust 2, 2011
© 2011, General Electric Company

2© 2011 Electric Power Research Institute, Inc. All rights reserved.
• Global dynamics favoringgas as a destination fuel
• Efficiency, emissions and flexibility are key
• Tomorrow‟s technologysolutions being developed & deployed today
Innovations in NG Turbines
© 2011 Electric Power Research Institute, Inc. All rights reserved.
Responding to a rapidly evolving industry
© 2011, General Electric Company

3© 2011 Electric Power Research Institute, Inc. All rights reserved.
GE Energy businesses
82,000 employees – $45B ‟11 revenue 25% world‟s electricity from GE technology
© 2011, General Electric Company
• Drilling/production for … land, offshore, subsea
• LNG and pipelines
• Refining/petrochemical
• Industrial power gen
• Complete lifecycle services
Oil & GasEnergy Services
• Thermal power gen
• Renewables
• Gas Engines
• Nuclear
• Gasification
• Water treatment
• Process chemicals
Power & Water
• Maintenance agreements
• Smart Grid
• Field services
• Parts and repairs
• Optimization technologies
• Plant management

4© 2011 Electric Power Research Institute, Inc. All rights reserved.
GE HDGT fleet globally
NA
2,800
Latin America
550
Middle East/Africa
1,300
Europe
1,800
Asia
1,000
Units
9E
6FA
7B
7EA
7FA05
9FA
6B
9FB
50% of world‟s Heavy Duty Gas Turbine installations …
Over 32 Million operating hours for F fleet
© 2011, General Electric Company

5© 2011 Electric Power Research Institute, Inc. All rights reserved.
Technical + service excellence
($ in millions)
J920
7FA Advanced Hot Gas Path2X R&D investment
LMS100
Investing in new power technologies and products
© 2011, General Electric Company

6© 2011 Electric Power Research Institute, Inc. All rights reserved.
Global operations investment
• 3,000 employees
• $150M test facility
• 2,000 employees
• $45M R&D center
Greenville, South Carolina, USA Belfort, France
6© 2011 Electric Power Research Institute, Inc. All rights reserved.
Flexible capacity to meet increasing demand
© 2011, General Electric Company

7© 2011 Electric Power Research Institute, Inc. All rights reserved.
Trends
© 2011, General Electric Company

8© 2011 Electric Power Research Institute, Inc. All rights reserved.
6%
2%
6%
29%
18%
28%
11%
10 year global investment
2,300 GW Wind
Nuclear
Coal
Hydro
Other
Ren.
Solar
Gas/Oil
Diverse power generation mix
Energy independence
Emissions/environment
Resource constraints
Power/Water nexus
Source: GE analysis
© 2011, General Electric Company
Green energy growing … coal still > ¼ of additions

9© 2011 Electric Power Research Institute, Inc. All rights reserved.
Projected reserve margin
Entergy
SPP
MISO
Florida
US supply/demand
US additions by fuel, 2011-20
UncertaintiesMarketplace dynamics
• Federal policy ... no clear timeline or champion
• Coal plants … compliance cost of EPA standards
• Financing … tax equity availability
• Nuclear … new builds and retirements
• Load growth … industrial sector & GDP rate
• Supply … high reserve margins in most regions
• Demand … return to pre-recession levels by 2012
• Regulations … ’15 impact of EPA air/water standards
• Policy … RPS in 29 states
• Fuel … gas forecast stable ~$5-6/mmbtuSource: NERC 2010 Long-term Reliability Assessment, Oxford Economics, Ventyx Velocity Suite, McCoy
Power Reports and GE Energy Analysis; CERA Global Power Projections
Note: *Other includes oil, biomass and hydro
Gas
CoalOther
Solar
Wind
Nuclear
© 2011, General Electric Company

10© 2011 Electric Power Research Institute, Inc. All rights reserved.
Impact of renewable penetration
How do Wind and Solar Power Affect Grid Operations:
The Western Wind and Solar Integration Study
No renewables
10% renewables
Gas generation must:• Ramp faster and more often
• Cycle on/off faster and more often
• Spend more time at part loads
• Provide more short-term reserves
50
40
30
20
10
0Apr 10 Apr 11 Apr 12 Apr 13 Apr 14 Apr 15
50
40
30
20
10
0Apr 10 Apr 11 Apr 12 Apr 13 Apr 14
20% renewables50
40
30
20
10
0Apr 10 Apr 11 Apr 12 Apr 13 Apr 14 Apr 15 Apr 16
Coal
Gas CC
Hydro
Nuclear
Renewables
Renewables
GW
GW
GW
© 2011, General Electric Company
Source: NREL Conference Paper September 2009 – How do Wind and Solar Power Affect Grid
Operations: The Western Wind and Solar Integration Study

11© 2011 Electric Power Research Institute, Inc. All rights reserved.
Moving from “bridge” to “destination” fuel
Natural Gas industry dynamics
+
-
• Growing supplies
• Stable prices
• Cleaner than installed base
of power generation
• Gas generation provides reliable
and flexible power
• Frac water concerns
• Infrastructure challenges with high
gas growth
• Various customer segments
not in consensus
• Competing technologies are not
standing still
NA shale gas production
Bcf per day
Sources: GE Energy Feb ’11 Outlook; CERA
0
5
10
15
20
25
30
35
40
'00 '02 '04 '06 '08 '10 '12 '14 '16 '18 '20
Canadian ShaleEagle fordMarcellusHanysvilleWoodfordFayettvilleBarnettMichiganCERA Outlook
Henry Hub Spot price
Nominal dollar per MMBtu NYMEX HH Futures (Feb-20-'11)
GE Baseline Oct '10 HH Outlook
Henry Hub Spot Price History
2
4
6
8
10
12
'07 '08 '09 '10 '11 '12 '13 '14 '15 '16 '17 '18 '19 '20
© 2011, General Electric Company

12© 2011 Electric Power Research Institute, Inc. All rights reserved.
Russia
flare
S. Africa
shale & CBM
Australian
LNG
CBM to
LNG
Vietnam
offshore
West
AfricaEast
Africa
India
offshore
& shale
Brazil
Assoc
gas
Argentina shale
Amazon
gas
U.S. LNG to
Caribbean
CN LNG
Poland &
EU shale
Israel Iraq
Turkmenistan
U.S. shale
New gas availability
Unconventional gas
CN shale
China
CBM
sour
shale
Indonesia
CBM &
offshore
M.E.
sour
West
Nile
PNG
LNG
Russia
frontier
Russia
LNGTechnology advancements
Source: GE Energy
Unconventional gas …
• Offshore• Shale• Flare/Assoc. Gas• Sour gas
Trends
Infrastructure investment• LNG trains• Pipeline
New gas capacity by ‟15–a)
• U.S.–b) 10.0• UAE/KSA 9.0• Australia 8.3• Russia 6.4• W. Africa 4.3 • Iraq 3.2 • Brazil 1.8
Key opportunities (Bcf per day)
(a- Major projects in development phases
(b- U.S. shale gas only
33%of
new gas
© 2011, General Electric Company
… a global game changer

13© 2011 Electric Power Research Institute, Inc. All rights reserved.
92% 85% 85% 92% 92% 92% 46% 18% 28% 86%
8,400
Btu/kWh
8,400 10,500 6,300 10,100 9,600 N/A N/A N/A 6,120
Relative Cost of Electricity
Cap. Factor
HR (HHV)
$73$87
$105
$59$67
$94
$50
$204
$229
$64
$126
$144
Further reductions
possible with
lower costs and
higher Capacity
Factors
Source: GE Energy
Economics of gas and renewables becoming more attractive
© 2011, General Electric Company

14© 2011 Electric Power Research Institute, Inc. All rights reserved.
Technology
© 2011, General Electric Company

15© 2011 Electric Power Research Institute, Inc. All rights reserved.
Plants spend
relatively little
time in base load
steady state
Steady State AGC
Load
Spinning Reserve
Off- Peak
Turndown
Baseline3% total fuel
27% total
fuel61% total fuel 9% total fuel
How are GTs being used?
Start Reliability98%+ (28 minutes)
Turndownto 40% plant load
Ramp Rate50 MW/min
Part Load Efficiency>60% to 87% plant load
© 2011, General Electric Company

16© 2011 Electric Power Research Institute, Inc. All rights reserved.
60 Hz HD Gas Turbine evolution
225
200
175
150
125
100
75
50
‟84 ‟86 ‟88 ‟90 ‟92 ‟94 ‟96 ‟98 ‟00 ‟02 ‟04 ‟06 ‟08 ‟10 „12
GT
SC
ou
tpu
t (M
W)
Year
7FA.0557.9%* Eff.
7FA.0457.8%* Eff.
7FA.0356.5%* Eff.
7FA.0255.5%* Eff.
7FA.0154%* Eff.
7F.0151%* Eff.
7EA
DLN
Combustion
Material & Coating
Single Crystal
Hot Gas Path
Compressor
Model Yr. MW SC EFF
7A 1970 48 30.5%
7B 1971 52 31.0%
7C 1972 60 32.1%
7E 1972 77 32.9%
* Combined cycle efficiency assumes 207 configuration
© 2011, General Electric Company

17© 2011 Electric Power Research Institute, Inc. All rights reserved.
Improved Performance
Enhanced Durability
Field Proven
Turbine7FA Advanced Hot Gas Path
GE‟s 60 Hz response … evolution of the 7FA
CombustorDLN 2.6
Improved Performance
Enhanced Operability
Improved Maintainability
Advanced CompressorAviation / Heavy Duty
Improved Performance
Low Emissions
Proven combustor
Sound product evolution coupled with thorough validation testing
© 2011, General Electric Company

18© 2011 Electric Power Research Institute, Inc. All rights reserved.
Oakley, California
OAKLEY GENERATING STATION GROUNDBREAKING CEREMONY JULY 12, 2011 - (L to R) - Brian Bertacchi (President and CEO, Radback Energy), Jim Frazier
(Oakley Mayor), Paul Browning (President and CEO, Thermal Products, GE Energy), Michael Peevey (President, California Public Utilities Commission), Senator
Mark DeSaulnier (California), Greg Feere (CEO of Contra Costa Building/Construction Trades Council)
© 2011, General Electric Company

19© 2011 Electric Power Research Institute, Inc. All rights reserved.
510 MW, 50 Hz… 61%+ baseload efficiency
Start-up to full load 28 minutes
Ramp-rate >50 MW/minute
Plant turn-down to 40% load
A new standard in efficiency AND flexibility enabling integration
of more renewable resources onto the power grid
FlexEfficiency* 50 Combined Cycle Power Plant
a product of
ecomagination
* Trademark of General Electric Company
19
© 2011, General Electric Company

20© 2011 Electric Power Research Institute, Inc. All rights reserved.
Responsive and flexible 500MW CCGT block
Base load efficiency > 60%
> 1 point advantage in flex-efficiency
Air-cooled technology
Smaller layout
Meets stringent permittingrequirements
Our next technology steps
50 Hz
60 Hz
Flexible and efficient gas turbines and combined cycles …
enabling greater renewable penetration
© 2011, General Electric Company

21© 2011 Electric Power Research Institute, Inc. All rights reserved.
60 Hz HD Gas Turbine evolution
225
200
175
150
125‟90 ‟94 ‟98 ‟02 ‟06 ‟10 ‟14 ‟18 ‟22 ‟26 ‟30
GT
SC
ou
tpu
t (M
W)
Year
7FA.0557.9%* Eff.
7FA.0457.8%* Eff.
7FA.03
7FA.02
7FA.01
7F.0
1
* Combined cycle efficiency assumes 207 configuration
65%
CC Efficiency
© 2011, General Electric Company

22© 2011 Electric Power Research Institute, Inc. All rights reserved.
Aeroderivative gas turbine highlights
GE LMS100®
Flexible high efficiency power
© 2011, General Electric Company
23© 2011 Electric Power Research Institute, Inc. All rights reserved.
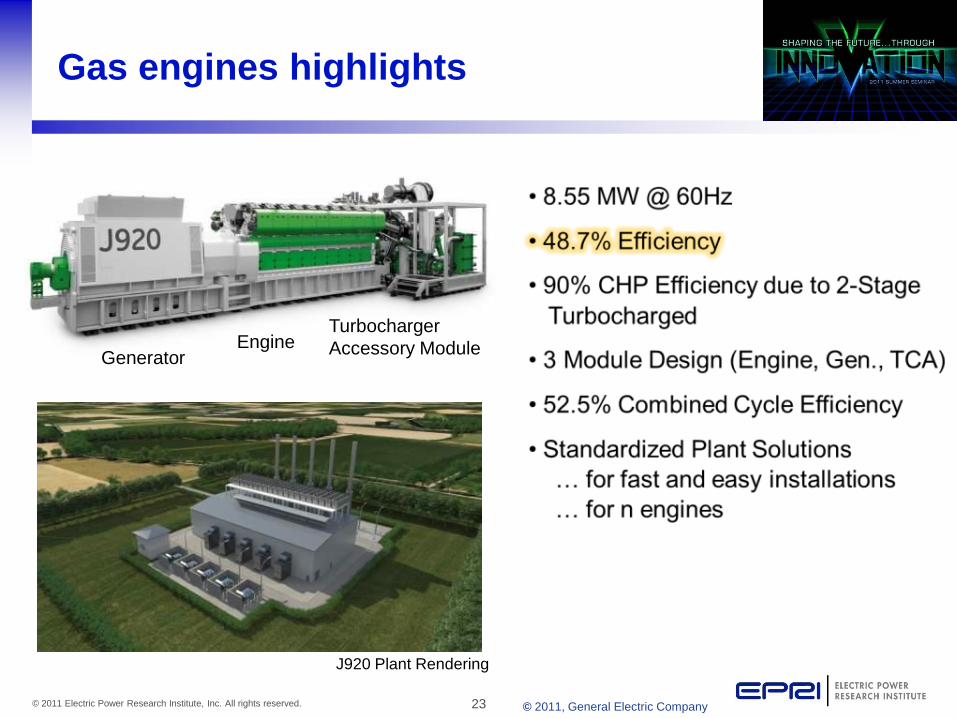
Gas engines highlights
Turbocharger
Accessory ModuleEngineGenerator
J920 Plant Rendering
© 2011, General Electric Company

24© 2011 Electric Power Research Institute, Inc. All rights reserved.
Power Generation Services
Steam Turbine Services
Gas Turbine Services
Generator Services
• Dry Low NOx Combustion System retrofits
• Improved efficiency and output
• Enhanced fuel & operational flexibility
• Real-time remote monitoring & diagnostics center
• Upgrades & life extension
• Industrial applications & uprates
• Improving efficiency … Extending asset life
• Parts repairs and refurbishment
• Outage interval extension, high cyclic duty,
next-generation stator insulation materials
• Preventative maintenance & on-line M&D
• In-situ robotic generator inspection (MAGICTM)
© 2011, General Electric Company

25© 2011 Electric Power Research Institute, Inc. All rights reserved.
What the future holds …
© 2011, General Electric Company

26© 2011 Electric Power Research Institute, Inc. All rights reserved.
Ceramic Matrix Composites+300 F temperature capability vs. superalloys
Advanced Cooling & Sealing
Micro-poreMicro-pore Pulse & Fluidic Film
ConformingAbradable
Thermal
Barrier
Coatings
Temperature
Capability
3000°F
1980s 1990s 2000s 2010s
Porous
DVC
2000°F
Coated CMCs
Thermal
Barrier
Coatings
Thermal
Barrier
Coatings
Temperature
Capability
3000°F
1980s 1990s 2000s 2010s
PorousPorous
DVCDVC
2000°F
Coated CMCsCoated CMCs
Advanced Thermal Coatings
Redefining turbine efficiency
Advanced CombustionAdvanced premixing, axial fuel staging
3-D Compressor Aero
Path toward 65% combined cycle efficiency
© 2011, General Electric Company

27© 2011 Electric Power Research Institute, Inc. All rights reserved.
Future trends in turbine technology
CombustionImproved fuel flexibility and
turndown capability
Energy Storage$160M investment … creating
$1B business for GE
Thin Film SolarThinFilm solar efficiencies
… PrimeStar
Solid Oxide Fuel Cells70% efficiency potential …
integrates well into CO2 capture
eSolarTower based concentrating
solar thermal technology
Pulse TechnologyPulsed detonation results in >
fuel efficiency with same power
GE‟s cutting edge technology … paving the way for future generations
© 2011, General Electric Company27© 2011 Electric Power Research Institute, Inc. All rights reserved.

28© 2011 Electric Power Research Institute, Inc. All rights reserved.
• Provide a clear landscape of future generation needs
• Be a strong voice for shaping meaningful and predictable energy policy
• Help develop robust models that evaluate flexibility in generation decisions
How the industry can help?
© 2011, General Electric Company

Innovations in Natural Gas Turbines … Next 20 Years
Steve BolzePresident and CEO, GE Power & Water Senior Vice President, GE
2011 Summer SeminarAugust 2, 2011