Advances in Dry Cooling Deployed at South African Power...
19
Steve Lennon Divisional Executive Eskom 2011 Summer Seminar August 1, 2011 Advances in Dry Cooling Deployed at South African Power Stations
Transcript of Advances in Dry Cooling Deployed at South African Power...

Steve LennonDivisional ExecutiveEskom
2011 Summer SeminarAugust 1, 2011
Advances in Dry Cooling Deployed at South African Power Stations
3© 2011 Electric Power Research Institute, Inc. All rights reserved.
Eskom’s Move to Dry-Cooling
• Eskom historically utilized wet-cooled power stations
• In 1966 it was decided to extend Grootvlei Power Station –3 factors had to be considered:
– Growing demand for electrical power
– Opportunity to exploit coal fields
– Obligation to optimize the utilization of water
• Eskom strategy:
– Add generation capacity without increase in water consumption
– Gain experience in dry-cooling

4© 2011 Electric Power Research Institute, Inc. All rights reserved.
Eskom’s Pioneer: Grootvlei PS
• Grootvlei Unit 5 and 6 added – dry-cooled
• Unit 5: Indirect system with spray condenser and dry cooling tower
• Unit 6: Indirect system with surface condenser and dry cooling tower
Largest dry-cooling units in the world at the time
5© 2011 Electric Power Research Institute, Inc. All rights reserved.
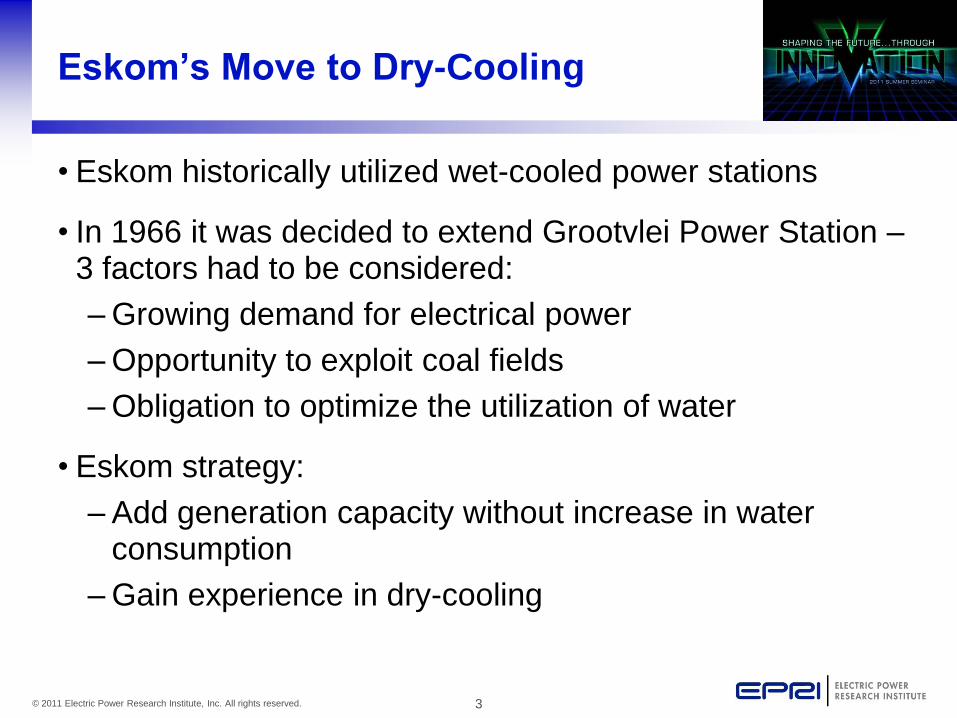
Matimba Power Station (6 x 665 MW)
• Design: Known turbine characteristics, energy output was maximized over given ambient temperature range
• Average back pressure: 18.6 kPa
• LP turbine protection: 65 kPa
• Average steam velocity 80 m/s at 18.6 kPa
• Station orientated with prevailing wind direction towards boiler
• 2 x 5 m exhaust ducts
• ACC details per unit
– 48 fans, 10 m diameter
– 8 streets with 6 fans per street
– Street length 70.8 m
– 12 MW auxiliary power consumption
• Total platform footprint 35 700 m2

6© 2011 Electric Power Research Institute, Inc. All rights reserved.
Matimba Power Station Finned-Tubes
• Oval tube and rectangular fin design
• 2.5 and 4mm fin pitch in 2-row staggered bundles
• Carbon steel tubes with carbon steel punched fins, then hot dip galvanized
7© 2011 Electric Power Research Institute, Inc. All rights reserved.
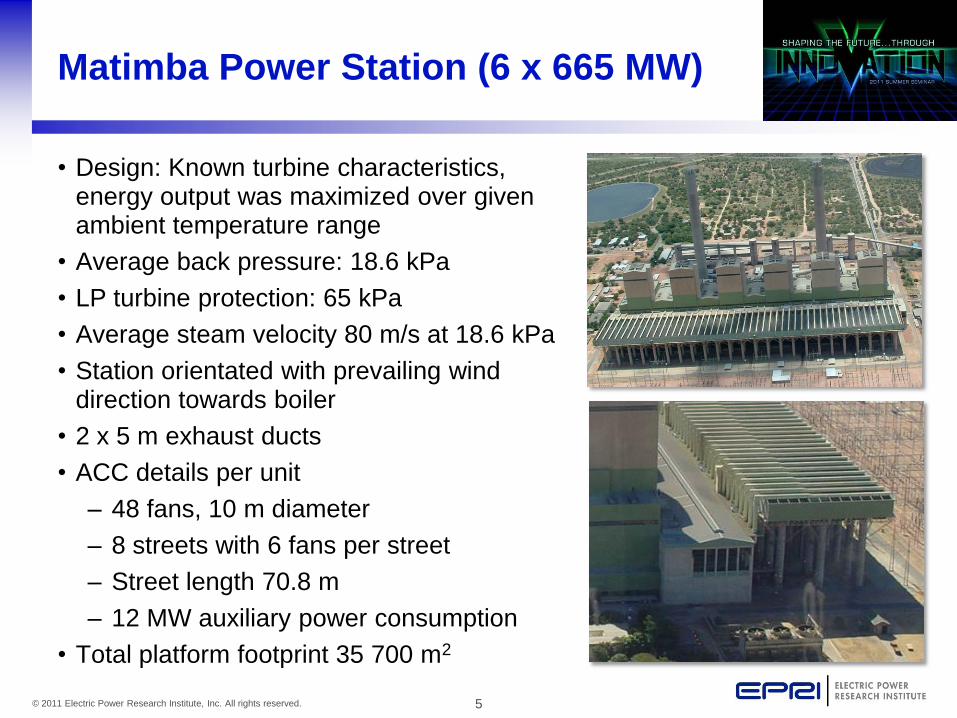
Kendal Power Station (6 x 686 MW)
• Surface condenser with SS tubes
• Circulating water flow: 16.8 m3/s
• Galvanised heat exchanger tubes
– 11 sectors which can be individually isolated
– Total of 1 980 km of finned tube/tower
– Horizontal, radial arrangement
• Tower dimensions
– Diameter at tower base 144 m
– Total height 165 m
• Thermal design
– Known turbine characteristics, energy output was maximized over given ambient temperature range
• 3.4 MW auxiliary power consumption/unit
8© 2011 Electric Power Research Institute, Inc. All rights reserved.
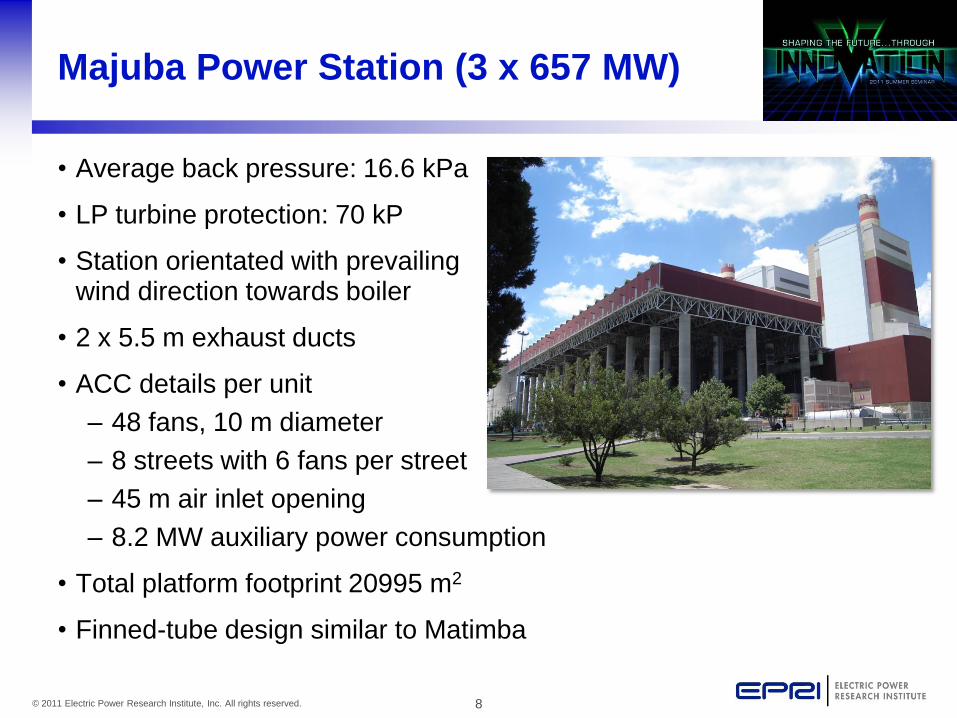
Majuba Power Station (3 x 657 MW)
• Average back pressure: 16.6 kPa
• LP turbine protection: 70 kP
• Station orientated with prevailing wind direction towards boiler
• 2 x 5.5 m exhaust ducts
• ACC details per unit
– 48 fans, 10 m diameter
– 8 streets with 6 fans per street
– 45 m air inlet opening
– 8.2 MW auxiliary power consumption
• Total platform footprint 20995 m2
• Finned-tube design similar to Matimba
9© 2011 Electric Power Research Institute, Inc. All rights reserved.
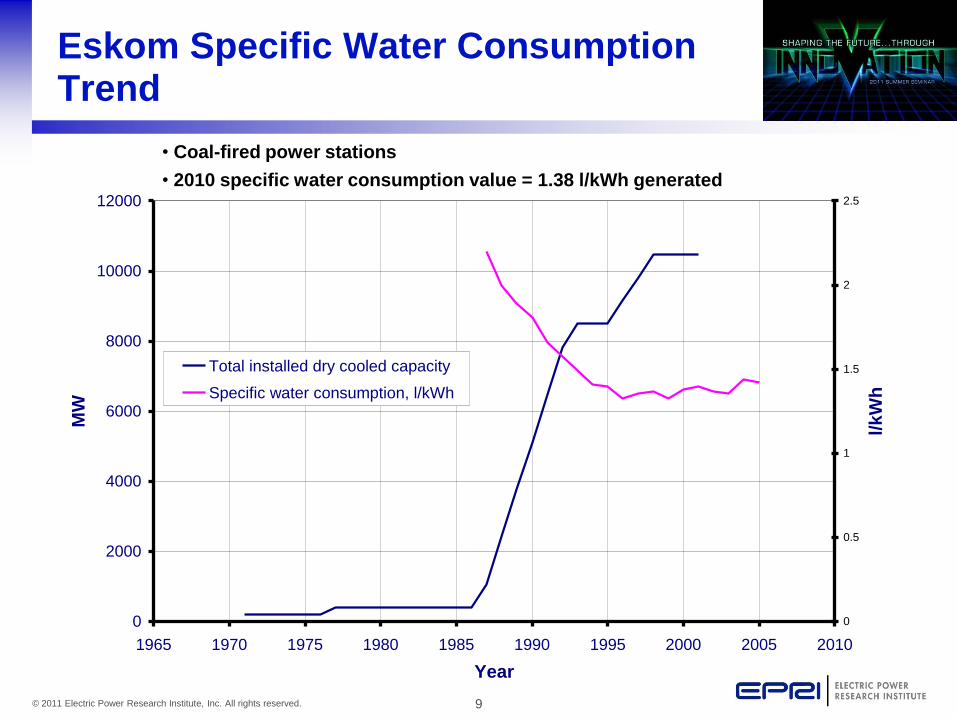
Eskom Specific Water Consumption Trend
0
2000
4000
6000
8000
10000
12000
1965 1970 1975 1980 1985 1990 1995 2000 2005 2010
Year
MW
0
0.5
1
1.5
2
2.5
l/k
Wh
Total installed dry cooled capacity
Specific water consumption, l/kWh
• Coal-fired power stations
• 2010 specific water consumption value = 1.38 l/kWh generated

10© 2011 Electric Power Research Institute, Inc. All rights reserved.
Design Efficiency of Eskom Power Stations
30%
32%
34%
36%
38%
40%
42%
Dry Cooled Wet Cooled Dry and Wet Cooled
11© 2011 Electric Power Research Institute, Inc. All rights reserved.
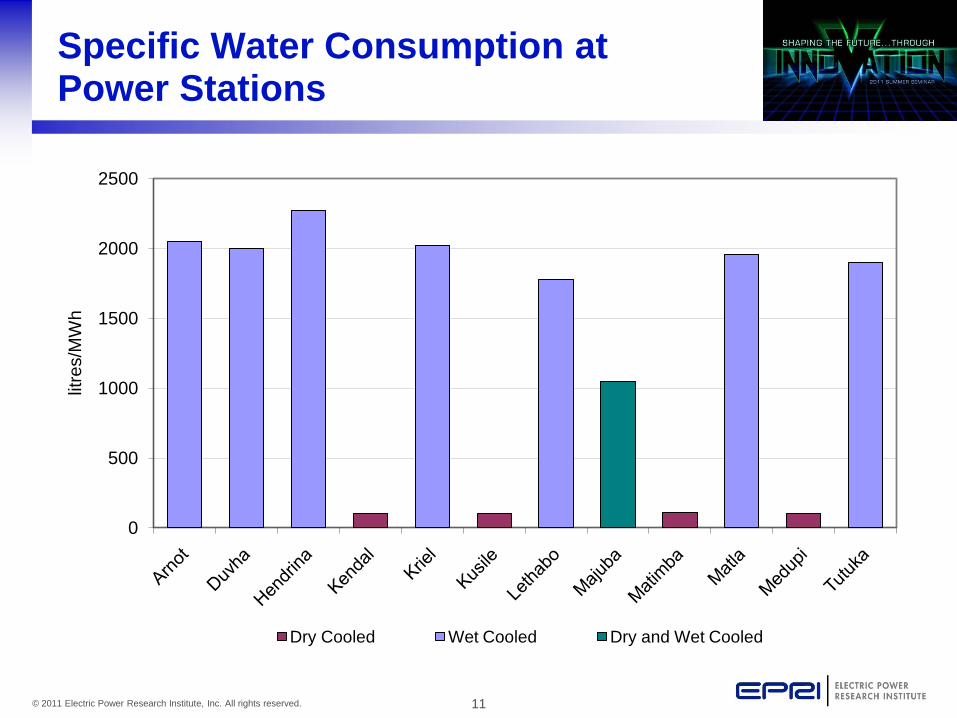
Specific Water Consumption at Power Stations
0
500
1000
1500
2000
2500
litre
s/M
Wh
Dry Cooled Wet Cooled Dry and Wet Cooled

12© 2011 Electric Power Research Institute, Inc. All rights reserved.
Cost of Dry vs. Wet Cooling
• Cooling system choice to be based on life cycle costing including capital, O&M, plant output and cost of water
• Relative costs for wet and dry indirect cooling systems in 1996:
– Capital cost of dry system was approximately 170% of wet system cost (surface condenser)
– More than 1% reduction in average unit output for dry system
• Footprint of dry natural draft cooling towers is typically 300% of that of a wet cooling tower of comparable size
• Challenge for retrofitting dry cooling systems is capital costs

13© 2011 Electric Power Research Institute, Inc. All rights reserved.
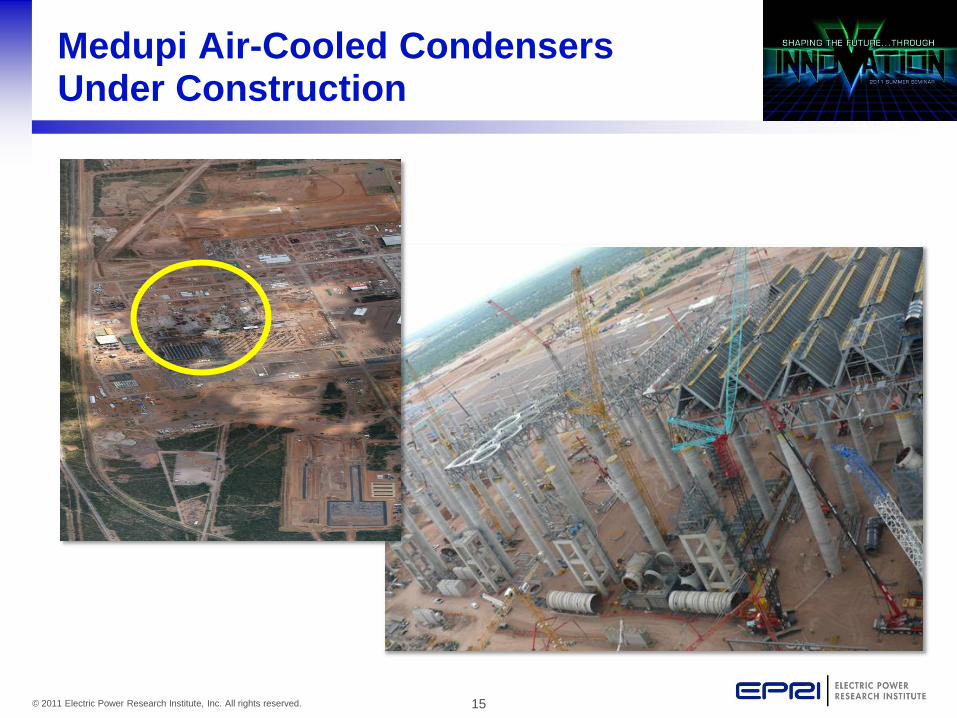
Medupi Power Station (6 x 794 MW)
• Average back pressure: 14.1 kPa (at 9m/s wind)
• LP turbine protection: 75 kPa (a)
• Average steam velocity approximately 78 m/s at 14.1 kPa (a)
• Station orientated with prevailing wind direction towards boiler
• 2 x 6.2 m exhaust ducts
• ACC details per unit
– 64 fans, 11m diameter
– 8 streets with 8 fans per street
– Street length 108 m
– Approximately 52 m air inlet opening
– 12.4 MW auxiliary power consumption
• Total platform footprint 72252 m2
14© 2011 Electric Power Research Institute, Inc. All rights reserved.
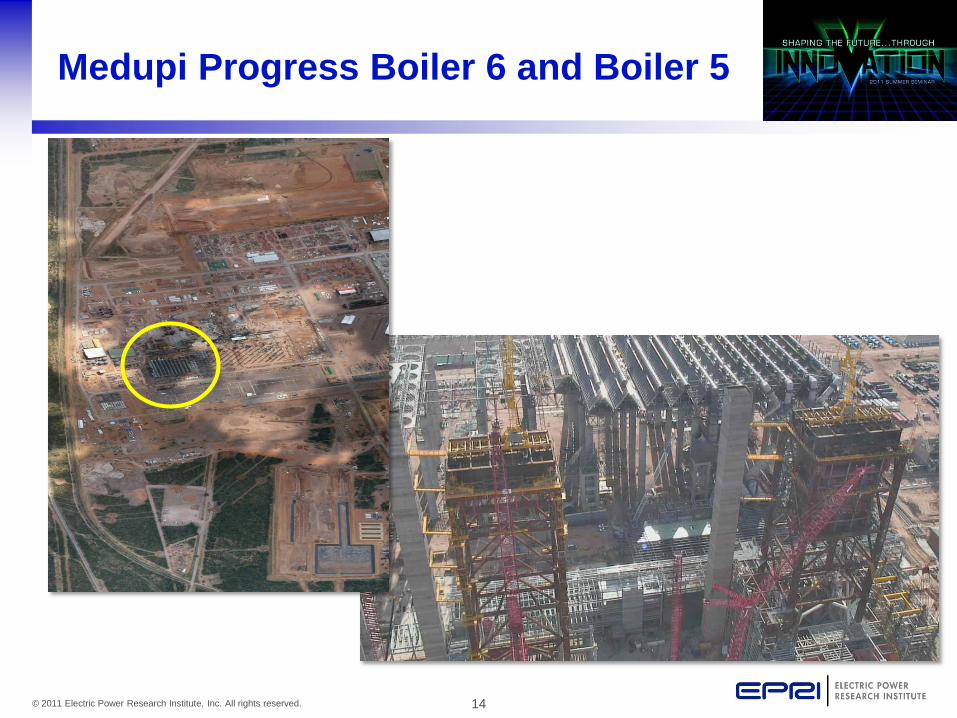
Medupi Progress Boiler 6 and Boiler 5
15© 2011 Electric Power Research Institute, Inc. All rights reserved.
Medupi Air-Cooled Condensers Under Construction

16© 2011 Electric Power Research Institute, Inc. All rights reserved.
Kusile Power Station (6 x 800 MW)
• Average back pressure 11.55 kPa (at 9 m/s wind)
• LP turbine protection: 75 kPa
• Average steam velocity approximately 83 m/s at 11.55 kPa
• Station orientated with prevailing wind direction towards boiler
• 2 x 6 m exhaust ducts
• ACC details per unit
– 64 fans, 11 m diameter
– 8 streets with 8 fans per street
– Street length 100.1 m
– Approximately 58 m air inlet opening
– 12.4 MW auxiliary power consumption
• Total platform footprint 66052 m2
17© 2011 Electric Power Research Institute, Inc. All rights reserved.
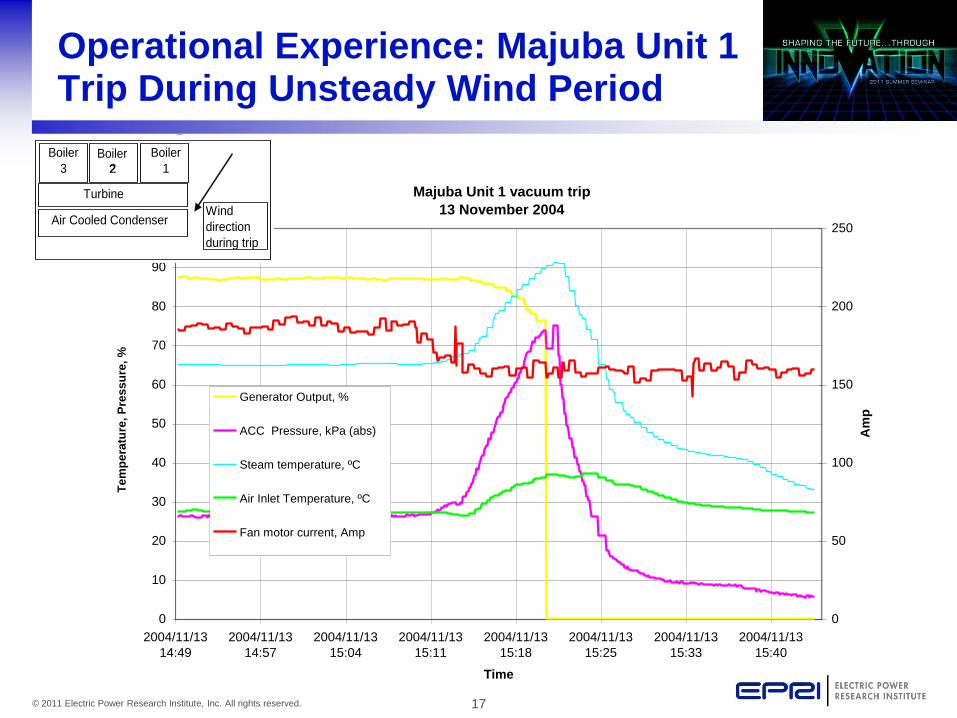
Operational Experience: Majuba Unit 1 Trip During Unsteady Wind Period
Majuba Unit 1 vacuum trip
13 November 2004
0
10
20
30
40
50
60
70
80
90
100
2004/11/13
14:49
2004/11/13
14:57
2004/11/13
15:04
2004/11/13
15:11
2004/11/13
15:18
2004/11/13
15:25
2004/11/13
15:33
2004/11/13
15:40
Time
Te
mp
era
ture
, P
ress
ure
, %
0
50
100
150
200
250
Am
p
Generator Output, %
ACC Pressure, kPa (abs)
Steam temperature, ºC
Air Inlet Temperature, ºC
Fan motor current, Amp
Air Cooled Condenser
Turbine
Boiler
2
Boiler
3
Boiler
1
Wind
direction
during trip
2

18© 2011 Electric Power Research Institute, Inc. All rights reserved.
Future Role of Dry Cooling
• Key technology in South Africa’s climate change impact adaptation strategy
• All future coal plants will be dry cooled
• Application to other technologies being evaluated –especially solar thermal
18

19© 2011 Electric Power Research Institute, Inc. All rights reserved.
Together…Shaping the Future of Electricity
Thank You