INllllll111111I Ehiii/MiiIi llIMlllllll · UNCLASSIFIED DEC liiiiII82 AFIT/Of/EE/S20-23 F/O S/10 NL...
142
AO-A124 842 A NOOEL FOR HUMANI VISUAL PROCESSING WHICH EXPLAINS I/ PFRCEPTIONS OF NlOTION-..IUI AIR FORCE INSt OF TECH WRIOHT-PATTERSON AFS OH SCHOOL OF ENOI.. A L fARTER UNCLASSIFIED DEC 82 AFIT/Of/EE/S20-23 F/O S/10 NL liiiiII llll111111I "INll Ehiii/MiiIi ll~lllllll llIMlllllll
-
Upload
dangnguyet -
Category
Documents
-
view
216 -
download
0
Transcript of INllllll111111I Ehiii/MiiIi llIMlllllll · UNCLASSIFIED DEC liiiiII82 AFIT/Of/EE/S20-23 F/O S/10 NL...

AO-A124 842 A NOOEL FOR HUMANI VISUAL PROCESSING WHICH EXPLAINS I/PFRCEPTIONS OF NlOTION-..IUI AIR FORCE INSt OF TECHWRIOHT-PATTERSON AFS OH SCHOOL OF ENOI.. A L fARTER
UNCLASSIFIED DEC 82 AFIT/Of/EE/S20-23 F/O S/10 NL
liiiiIIllll111111I"INll
Ehiii/MiiIill~lllllllllIMlllllll

Ig 14.0 .
1III.8111111L25 11114 111.
1111 I .4I 11111L6
MICROCOPY RESOLUTION TEST CHART
hANA L~~ BUREAU IF STANDAS-1963-A

U TV040
iUNITED STATES AIR FORCE
0 WHICH EXPLAINS PERCEPTIONS
OF MOTION-AFTER-EFFECTS
THESIS
AFI'r/GE/EE/8. )-23 Roger L.CarterCapt USA
T TCINEERIWN
83SI 0u- 10

AFIT/GE/EE/82D-23
A MODEL FOR HUMAN VISUAL PROCESSING
WHICH EXPLAINS PERCEPTIONS
OF MOTION-AFTER-EFFECTS
THESIS
AFIT/GE/EE/82D-23 Roger L. CarterCapt USA
TEIR
,A
Approved for public release; distribution unlimited
A.W

AFIT/GE/EE/82D-23
A MODEL FOR HUMAN VISUAL PROCESSING
WHICH EXPLAINS PERCEPTIONS OF MOTION-AFTER-EFFECTS
THESIS
Presented to the Faculty of the School of Engineering
of the Air Force Institute of Technology
Air University
in Partial Fulfillment of the
Requirements for the Degree of
Master of Science
by
Roger L. Carter, B.S.E.E.
Capt USA .
Graduate Electrical Engineering
December 1982
Approved for public release; distribution unlimited.
a* i

The kernel of this thesis, an attempt to explain
motion-after-effects in human visual processing, evolved
from discussions with Dr. Matthew Kabrisky, Air Force
Institute of Technology. The development of a theoretical
model for human visual processing, and the conduct of the
psycho-physical experiments to support the model, were
extensions of an original hypothesis that motion-after-
effects are a result of a predictive system which permits
binocular fusion with varying retinal image size and
displacement disparity patterns. My ability to develop this
thesis to its conclusion was made possible by the constant
encouragement I received from Dr. Kabrisky, and his
willingness to explore my new ideas.
I am also indebted to Dr. Allan Pantle, Miami of Ohio
University, for his advice in the design of computer
generated visual stimulus displays, and his willingness to
provide both an authoritative and an objective view of my
ideas. I wish further to thank Dr. Richard Fenno for his
efforts in editing and critiquing my writing so that the
final product might clearly communicate my intent.
Finally, I wish to express my appreciation to my wife,
Connie, whose assistance and support have been a significant
factor in not only this work, but in everything of worth
which I have accomplished.
ii
Contents
Preface . . . . . . . .... . .. . ....................
List of Figures . .. . . . . . . . . . . . . . . . . . v
List of Tables . . . . . . . . . ..... ............ vii
Abstract . . . . . . . . . . . . . . viii
I. Introduction . ... . . . . 1
II. Existing Theory . . . . . . ........ . 3
Properties and Structure ofHuman Visual Processing .. . . . 3
Functional Components ofVisual Processing . .......... 6Visual Perception . . . 11
Binocular Perception .......... 12Motion Perception .......... 16Motion-After-Effects .......... 18
III. Theoretical Development . . . . . . . . . . . . 24
Visual Inputs and PerceptionDuring Uniform Motion . . . . . . . . . . 24
Production of MAE . . . . . . . . . . . . . 39Physical Structure ofVisual Processing . . . . . . . . . . 44Experimental Proposals . . . . . . . . . . 48
IV. Experimental Design and Procedure . . . . . . . 50
Limits of Human Binocular Fusion . . . . . 50Equipment . . . . . . . . . . . . . . 50Procedure . . . . . . . . . . . . . . . 54
MAE Related to Locationin the Visual Field ..... . . . .. 60
Equipment . . . . . . . . . . . . . . . 60Procedure . . . . 0 .. .. . . . . . . 61
V. Experimental Results . . .. . . . ..... 66
Limits of Human Binocular Fusion . . . . . 66Reported Perceptions . . . . . . . . . . 66Quantitative Results . . . . . . . . . . 70
MAE Related to Locationin the Visual Field . . . . . . . . . . . 75
Correlation BetweenBinocular Fusion and MAE . . . . . . . . . 79
iii

VI. Conclusions and Recommendations . . . . . . . . 84
Conclusions . . . . . . . . . . . . . . . . 84Recommendations . .. . . . . . . . . . . . 89Project Summary . . . . * . . . . . . . . . 92
Bibliography . . . . . . . . . . .. . . . . . . . . 93
Appendix A: Programs to Support an Experimenton the Limits of Binocular Fusion . . . 97
Appendix B: Instructions for Experimentwith Binocular Fusion . * ... . .. 108
Appendix C: Questionnaire for Experimentwith Binocular Fusion . . . . . . . . . 112
Appendix D: Program Listing for Experimentwith MAE Thresholds and Duration . . . . 113
Appendix E: Instructions for Experiment withMAE Thresholds and Duration . . . . . . 116
* Appendix F: Raw Data Example for Experiment onthe Limits of Binocular Fusion . . . . . 118
Appendix G: Raw Data Example fromExperiment on MAE .. . . . . . . . . . 120
Vi ta . . . . . . . . . . . . a. . .. . . . . . . . 123
iv

.. . . - _.. .. . ... . ... . . . . ....
1 Model of the Structure ofHuman Visual Processing . . . . . . . . . . . . 4
2 Relationship of Image Size to Locationof an Object in the Visual Field ....... . 25
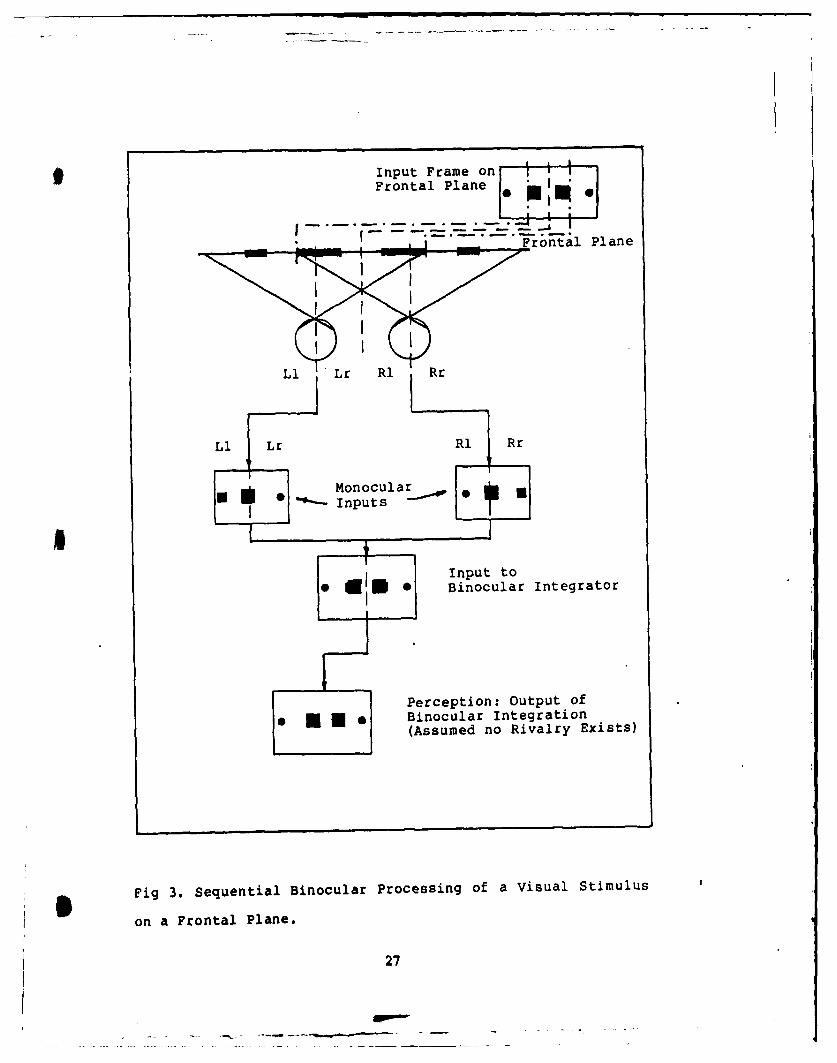
3 Sequential Binocular Processing of aVisual Stimulus on a Frontal Plane . . . . . . 27
4 Graphs of the Image Size Disparityvs. Head Position . . . . . . . . . . . . ... 29
5 Processing of Sequential Monocular RetinalInputs During Head Rotation to PermitPerception of a Single StationaryObject in the Visual Field . . . . . . . . . . 32
6 Data Flow Diagram of Visual ProcessingRelated to Perception of MotionAssociated with Objects in theVisual Field . . . . . . . . . . . . . . . . . 34
7 Data Flow Diagram for Processing BinocularRetinal Inputs Leading to a Perceptionof Object Motion . . . . . . . . . .. . .. 37
8 Hypothesized Role of Lateral Geniculate Nucleusin Providing Mappings Displaced in Time toPrimary Visual Cortex . . . . . . . . . . . . . 45
9 Relationship of Proposed Model Processes toPhysical Structures in Humans ......... . 47
10 Equipment Configuration for the Experimenton the Limits of Human Binocular Fusion . . . . 52
11 Adjustable Platform Constructed for theCromemco Color Monitor . . . . . . . . . . . . 53
12 Adjustable Platform to Provide a Chin Restand to Support an Adjustable Mirror . . . . . . 55
13 Equipment Configuration for the ExperimentMeasuring the Parameters of MAE as aFunction of Position in the Visual Field . . . 62
14 An Example of the Time Interval Method usedin Analyzing the Raw Data from an Individual'sReports in the Experiment with MAE Thresholdsfor Stimulus Duration ............. 76
v

15 An Example of the Family of StimulusDuration Threshold Curves Associated witheach Category. . . .. .. .. . . .. . .. . 78
16 Scattergram and Parameters Related to theKendall tau Test for Correlation ofPeformance Between Limits for BinocularFusion and MAE Stimulus Thresholds . . . . . . 83
v
vi

| 2f TblesTables
I Arithmetic Means of Individual's Limitsfor Binocular Fusion . . . . . .......... 72
2 Results of Data from an Experiment on theParameters of MAE as a Function of Locationin the Visual Field . . . . . . . . . . . . . . 80
vii

AF IT/GE/EE/ 82D- 23
A theoretical model for human visual information
processing was developed which attributes functional roles
to the cerebellum, lateral geniculate nucleus, and cerebral
cortex. The lateral geniculate nucleus is believed to
provide sequential monocular mappings as inputs to the
primary visual cortex, which uses this information for
binocular integration, detection of motion, and other of its
functions. The cerebellum is hypothesized to function within
a predictive feedback loop to provide information to the
cortex essential to reconcile differences in monocular image
sizes and displacements.
In an experiment with the limits of human binocular
fusion, two separate limits were discovered. When dichoptic
images are first perceived to represent a single object, the
limit for fusion is greater than when no initial reference
for a single object association is given.
A second experiment measured the stimulus duration
thresholds for motion-after-effects. Correlation of
performance by subjects in the two experiments was used to
conclude that similar mechanisms are involved in binocular
fusion and the processing of perceptions leading to motion-
after-effects.,AWithin the visual processing model developed,
both binocular 14U17or and the existence of motion-after-
effects are related to the existence of a predictive
feedback loop. Thus the correlation of the performances
could be predicted by the author's theoretical model.
viii

I. Introduction
Human visual processing is the transformation of the
retinal input stimulus at the two eyes into a perception of
the physical environment lying within an individual's field
of vision. Since the retinal inputs involve a pair (in the
case of binocular vision) of two-dimensional pictures, data
available at the retina must be transformed into a three-
dimensional perception of the world. Perception, and the
method by which perception is derived, is important, then,
in determining how an individual will react to his
environment. The following section on existing theory
reviews what is known about the way the visual system
processes retinal inputs, with particular attention to the
properties, structure, and furctions of each major
component. Finally, the subject of visual perception is
covered by a review of known human perceptions to certain
visual stimuli.
After a presentation of existing theory, a theoretical
development of a model for human visual processing is
presented. The model is developed based on what are
determined to be required processes in transforming the
retinal mappings induced by visual stimuli into perceptions
which agree with known human perceptions. The scope of the
model is limited to the perception of single objects in
motion. The specific objective of the model is to attempt
to explain the phenomena of motion-after-effects from a
system model designed to maintain perception of single
1

objects in motion.
The visual processing model is then used to predict the
outcome of two experiments. The first experiment conducted
measured the limits of binocular fusion for objects of
different size when presented to each of the two eyes. The
second experiment measured the stimulus duration thresholds
for motion-after-effects as a function of the position of
the stimulus in the visual field.
The results of these experiments are then presented and
their relationship to the validity of the hypothetical model
is discussed.
2
- -' .-- .-- avow -

Prpri. a~d otutr f Human Visual Prcssn
A model of the human visual processing system is
presented in Figure 1. The pathways shown between physical
components represent the transmission of information along
nerve cells or neurons. Neurons are specialized cells which
are the basic building blocks of the entire nervous system.
Each neuron senses the chemical balance at the
junctions of its inputs and when a critical balance is
reached, responds by firing a sudden voltage increase along
its output or axon. At the termination of the axon, the
voltage spike causes release of chemicals into a junction,
or synapse, with corresponding inputs to one or more other
neurons. These neurons sense the change, fire, and thus
continue the transmission. Information is thus relayed by
the frequency at which a neuron fires. Since both the
pathways and component structures of the visual processing
system rely on neurons for information transmission and
transformation, the firing rates of neurons have been a
source of extensive study.
The activities of neurons, with associated inputs and
outputs, are believed to be interrelated to perform
specified tasks and functional calculations. Attempts to
determine the physical location of neurons involved in
certain tasks and calculations have been based on the
g characteristic firing rates of individual neurons studied
within the brain. In these studies the firing rates of
3

Primary VisualCortex
Area 17[_PercT t Aea 18
eprioptijon PatternRecognition
i/& Other
Functions
Semi-Circular NeckCanals Muscles Colliculus
Visual
Stimulus
Fig 1. Model of the Structure of Human Visual Processing.
4

individual neurons have been linked to controlled stimuli.
An assumption is then made that, since the firing rate of
the neuron appears related to the stimulus, the neuron must
be involved in the performance of tasks or calculations
required to perceive and react to the stimulus.
An inherent problem exists in the use of firing rates
to specify the nature of neural calculations. Because of
the numerous interconnections between neurons, the firing
rate of any one neuron, or set of neurons, may relate only
to the nature of a single variable within a complex
calculation. Neighboring neurons could even represent
separate variables within separate and independent
calculations. To illustrate this idea, the example of two
simple functions, A = B + C and D = E + F, is taken.
Knowledge of the variation of B and E does not provide
sufficient information to determine the values of either A
or D. Nor can the functions themselves be determined. The
interconnectivity of neurons within the human visual system
suggests the operation of functions far more complex than
simple summation of variables. The existence of neurons
with known characteristic firing rates, with respect to some
specific stimuli, can then be used to argue the existence,
within a physical structure, of a variable with the same
variation characteristics. The operands of the function
would be held within the physical structure which determines
how the output of one neuron affects other neurons. This
relationship between neuron firing rates and the
5

interconnectivity of neurons is important since a great deal
.of what is known about the structure of visual information
processing centers depends on either the rates, the
interconnectivity, or both.
Funcional monents DI Visual Procesng
As shown in the model at Figure 1, the visual stimulus
is received at either or both of the two eyes. The
existence of binocular vision (simultaneous input from two
eyes) is important since the images projected onto the two
retinas will normally contain disparities. Disparity is due
to each projection defining a different angle to the point
of fixation. The horopter (the spatial field projecting
images containing no disparity to the two eyes) has been
studied and found to be an extremely complex configuration
(Shipley and Rawlings 1970). Thus, during normal binocular
viewing, disparities will always exist between the two
visual input fields. Disparities of a different nature can
also be introduced by object motion (motion by an object in
the visual field), eye movement, and head or body movement.
The inputs obtained at each retina are then relayed
through the corresponding optic nerves to the lateral
geniculate nucleus (LGN) within the thalamus (Guyton
1976). Studies of the firing rates associated with input
and output neurons of the LGN suggest that little, if any,
visual processing takes place within the LGN (Tat So and
Shapley 1981). The inputs are sent nearly unaltered to the
primary visual cortex.
6

Area 17 of the primary visual cortex is believed to
hold a homeomorphic mapping of the visual inputs received
from the two retinas. In microelectrode experiments,
neurons in area 17 have been found to display activity
related to either monocular (input from one eye) or
binocular (input from two eyes) characteristics (Freeman and
Bonds 1979). The density of monocular and binocular
neurons has been further found to be dependent on the
visual experience of an individual during a critical period
of development (Banks, Asliu, and Letson 1975). In a
series of other experiments, neural firing rates in area 17
have been attributed with characteristics specific to
orientation and direction of motion of the visual stimulus
(Hubel and Wiesel 1959).
Though little is known of the exact function of area 18
of the cortex, it is known to receive input from area 17 and
is generally believed to play a major role in the processing
of visual information. Among other functions, area 18 is
thought to be involved in the process of pattern recognition
and the correlation of retinal disparity information leading
to the perceptions of depth (Tyler 1973) and motion.
In the model, area 18 is shown to provide output to an
area labeled perception. In studies to date, perception is
better related to a theory than to a physical location in
the brain. Its depiction in the model does not represent
known physical structure or signal transmissions. It
* remains a hypothetical element with hypothetical inputs and
7

outputs.
Additional outputs from area 18 have been postulated to
end in the superior colliculus (McIlwain and Fields 1970).
Though the superior colliculus is believed to play a role in
saccadic eye movements, monkeys who have lost partial
function of the superior colliculus still show saccadic eye
movements (Robinson and Goldberg 1977). In experiments
which involved both real and apparent motion induced by eye
movements, over 60% of the neurons in the superior
colliculus were able to differentiate real motion (Robinson
and Wurtz 1976). The ability to determine real motion
was not, however, found in studies of neurons within the
cortex. Due to the latency periods between motion and
corresponding firing rates, the eye movement signal which
permits differentiation of real motion is not believed to
originate in either the retina or eye muscles.
The cerebellum, as shown in the model, receives inputs
from numerous sources, including vestibular (i.e., from the
semi-circular canals), proprioceptive neck, proprioceptive
extraocular, and visual sources related to retinal slip or
disparity (Lisberger and Fuchs 1978; Suzuki, Noda, and Kase
1981). Extensive research is available on the major
components of the cerebellum, with the majority of the
research aimed at discovering the role of the cerebellum in
the "fine" control of muscle coordination. The cerebellum
is generally thought to provide a feedback loop to the motor
cortex. In providing feedback data, the cerebellum is
8
believed to be capable of predicting future positions of
moving body parts. The cerebellum is believed to perform
predictions based on a full range of tactile, auditory,
visual, vestibular, and oculomuscle inputs. Evidence of the
role of the cerebellum has been found in monkeys and humans
who lack complete cerebellum function. In the case of a
monkey, the animal was unable to predict the visual approach
of an object and would repeatedly bump into objects. Humans
who have suffered damage to the cerebellum have been
discovered to "overshoot" objects when reaching for them.
Both of these examples show at least a lack of ability to
predict or anticipate the approach of an object.
The concept of the cerebellum acting as a feedback
device to permit the motor cortex to react to approaching
objects has been expanded to explain the learning of
skilled motor functions (Guyton 1976). Skilled motor
functions performed for the first time are thought to
require the latency involved in the prediction and
transmission of a feedback signal from the cerebellum to the
cortex. As a skilled motor function is repeated, the
learning process allows increased prediction without input
and eventually may eliminate the feedback requirement.
Thus, individuals are able to perform skilled motor
functions with increasing speed. The establishment of a
rapid motor pattern is then being controlled directly by the
cortex. During rapid motor patterns, the cerebellum is
thought to act as an error corrector rather than as a
9

predictor, its normal role. In this case, the cerebellum
signals to the motor cortex error corrections to be made
after the action has been taken, rather than providing input
toward the action itself.
In more detailed studies with microelectrodes,
components of Purkinje cell activity in the flocculus of the
cerebellum have been discovered which are related to eye and
head velocity. Further, during periods when both head and
eye movements were invoked, the resulting neuron activity
could be predicted by performing a vector summation of the
individual eye and head components (Lisberger and Fuchs
1978). These findings have led to the conclusion that the
flocculus modifies the vestibuocular reflex (the reflex
signal sent to the optic muscles to correctly track an
object) by performing calculations dependent on vestibular,
eye movement, and retinal error inputs.
Lobules VI and VII of the cerebellar vermis have also
drawn considerable research effott. Inputs to the vermis
include tactile, visual, auditory, proprioceptive neck,
proprioceptive extraocular, and vestibular (Suzuki, Noda,
and Kase 1981). Among neural firing characteristics
discovered in the vermis are spikes located at points
corresponding to visual targets off the point of fixation
and whose discharge precedes saccadic eye movements to
fixate the new target. Tonic (relatively non-varying rates)
outputs from Purkinje Cells related to eye position were
also present (Kase, Miller,and Noda 1980). Purkinje cells
10

have additionally been documented which fire in phase with
either retinal target velocity (while eyes are fixed) or eye
tracking velocity (Kase et al. 1979). The phase lags
between actual target/eye motion curves and the firing rate
curves varied with target/eye velocity and in all cases were
less than the lag time which would be predicted by the
latency inherent in the neural circuits (Suzuki, Noda, and
Kase 1981). Thus a predictive calculation is implied in the
nature of Purkinje cell activity within lobules VI and VII
of the vermis.
In summarizing their research, Suzuki &I d1 (1981,
p.1135) found the neural characteristics to suggest that the
Purkinje cells of lobules VI and VII of the vermis "may sum
weighted retinal image acceleration and velocity to form
time derivatives of visual stimulus movement that contribute
to predictive mechanisms attributed to the cerebellum." Thus
a resulting output would contain the neural correlate of
target velocity, an element which could perform a function
in the calculation of resultant visual perception.
Visual Perceotio
As mentioned previously, perception is the end result
of the visual processing system. The relationship between
the actual world and visual perception has most likely
evolved from the requirements imposed by nature upon the
species. Interpretation, or perception, may then be based
on what is determined to be the most likely occurrence in
I nature. This is a determination which may be incorrect when
11
,,loom

the visual stimuli do not correspond with naturally
O occurring events for which the system has been developed.
Studies of perception have used these inferences. Since the
physical location of perception is not known, psycho-
physical experimentation has been applied to determine the
perception induced by controlled visual stimuli. Controlled
stimuli, however, do not necessarily depict naturally
occurring events, and the concept may not accurately
describe the physical scene. Through documentation of
perceptual errors in determining the actual state of the
physical environment, conclusions can then be drawn about
the nature of the calculations involved in perception. With
this in mind, three areas of human visual perception will be
reviewed: perception related to information obtained by
binocular vision, perception of motion by an object in the
visual field, and perception of motion-after-effects.
jinocuar Perce.on: The existence of two visual
inputs appears to be more than simple redundancy of an
element essential to survival. The overlapping of the visual
images introduces disparities which contain a great deal of
information beyond that available from a single source. As
mentioned earlier, the manner in which the two inputs are
used in developing perception has been found to be
dependent, in some degree, on the visual experience of an
individual during a critical period of development (Banks,
Asliu, and Letson 1975). Eye movement and visual
3 stimulation during this period are essential to the normal
12
A
- nu-nun-S u~.u i ue --- u l

cortical development (Freeman and Bonds 1979). In
individuals with abnormal binocular experience, differences
in perception at low contrast thresholds have been observed
1Levi, Harworth, and Smith 1979). Evidence exists to
suggest that the differences in perception between
individuals with normal and abnormal development are caused
by differing concentrations of monocular and binocular
neurons of the visual cortex (Blake and McCormack 1979). A
conclusion which can be drawn from the evidence is that the
calculations leading to perception in the binocular system
have a degree of plasticity. Further, the cortex is a
likely location for at least one level of integration of the
binocular information.
The existence of disparate inputs has led to two areas
of research in the study of binocular perception. The first
involves determining how the disparity information is used
in forming perception. The second is aimed at discovering
how disparity is dealt with in the development of perception
of a single environment or object.
The human visual system is presumed to have the ability
to develop depth perception (stereopsis) through the use of
disparities in background and foreground images (in relation
to the object of fixation). In the absence of any depth
cues except disparity, humans are able to perceive relative
depth. Psycho-physical experiments have shown that humans
can interpret stereoscopic cues from dichoptically presented
3 patterns when the stimulus pairs are separated by up to 50
13
- ------- Avo w

msec (Ross 1976). The location of this transformation has
been postulated to reside within the cortex because of the
apparent relationship of stereoscopic vision with the
density of binocular cells in the cortex (Packwood and
Gordon 1975). Beyond stereopsis, no discussion of
additional direct use of binocular disparity in the
enhancement of perception could be found in the literature.
However, additional information is available to the brain
from the relationship of binocular disparity during
observation of a target in motion. This subject will be
expanded upon later.
A second area of research has attempted to discover the
limits and processes involved in binocular fusion (the
perception of a single object from separate disparate
inputs). During experiments involving dichoptic viewing
(separate visual stimuli presented to each eye), the limits
of binocular fusion have been quantified. Recent work with
the disparity limits of binocular fusion leads to
conclusions that a disparity gradient rather than the
disparity magnitude is involved in the determination of a
limit (Burt and Julesz 1980). In either case, research
points to a functionally constant relationship for fusion
given stationary dichoptic disparities.
Several theories have attempted to explain the
mechanics of binocular integration. One such theory, energy
summation, supposes that the integration of binocular inputs
3 involves the summing of energy levels from
14

corresponding retinal points. A second, probability
summation, assigns probabilities to the perception of each
monocular input through a relation to its corresponding
energy levels. The binocular probability is then defined on
a relationship of the monocular probabilities. Though in
specific experimental applications these theories appear to
fit the data, in a set of experiments by Cohn and Laxley
(1976) neither theory of integration was able to accurately
predict the characteristics of binocular thresholds.
Instead, these experiments with binocular thresholds
support a theory that integration involves two sets of
independent mechanisms. One mechanism sums the energy
levels while the second computes their difference. The
outputs of these two mechanisms are then sent to a central
processing center. No conclusion was drawn by Cohn and
Laxley as to the exact nature of calculations held within
the central processing center.
Monocular suppression is ahother theory that has been
used to explain the perception of a single environment given
disparate inputs. In this theory, the input from one eye is
suppressed while input from the other eye provides the sole
input to perception. Examples of monocular suppression can
be experimentally proven. However, Blake and Camisa (1978)
found that monocular suppression was evident only when
disparities exceeded a given magnitiude. Thus monocular
suppression appears to be present only when the disparity
4is large enough to sufficiently confuse the mechanism
15
ao-

* attempting to determine a single perception.
Earlier assumptions that fusion was being produced by
torsional eye movements have been contradicted by
experiments involving fusion with no measureable eye
movement (Kertesz and Jones 1970).
It is important to note that experimental evidence
taken on stereoblind subjects (individuals incapable of
determining depth through disparity cues alone) has shown
that these individuals maintain their ability to fuse
objects (Richards 1970). Thus, fusion and binocular
perception appear to involve separate mechanisms. Related
studies of visual processing suggest that the information
required for stereoscopic depth perception is extracted
Jprior to the point where fusion is produced (Grimson 1980).
Motion cptn: Determination of an object's motion
in a visual scene requires a system which must be capable of
filtering out information related to apparent motion induced
by the almost constant movement of the eyes, head, and body.
This ability, one might guess, involves a multi-layered
computation of extremely high complexity. This hypothesis
about complexity may be supported by the fact that extensive
research in this area has as yet been unsuccessful in
integrating the behavior of the motion detecting system into
a model capable of predicting its varied behavior.
Experiments have revealed some characteristics of
motion perception. The perceived direction of motion hasS been found to be altered when an individual is first
16

adapted to motion in a specific direction (Levinson and
Sekuler 1976). Similar studies have shown that simultaneous
motion in two differing directions will alter the perceived
direction of the motion of each. The degree of alteration
in this case was dependent on the actual angle between the
original stimulus directions (Marshak and Sekuler 1979).
Results of this kind have been used to support the theory
that perception of motion is derived from motion and
direction detectors within the cortex. The alterations
noted were attributed to fatigue of these detectors, a
theory which has received much support in the literature
since the discovery of cortical neurons displaying firing
characteristics tuned to motion and direction.
in a series of experiments using fine points of light
to suggest complete form, Johansson (1975, p.84) discovered
that "continuous perspective tranformations always evokit the
perception of moving objects with a constant siar- and
shape." His theory of the perc'eption of moving objects,
termed vector extraction, says that the visual system
determines certain objects to be rigid and to be moving in a
manner consistent with the rigidity of the object. In this
theory, the visual system would extract the vector motion
component of the rigid object from all points on the object
to determine the motion of the points relative to the object
itself.
Regan rt al (1979) have shown that the perception
of motion in depth can be elicited by either changing the
17
--•- -

size of an object or changing the magnitude of its dichoptic
disparity.
The correspondence between eye motion and perception
has been shown to be interdependent. Perception has been
found to be dependent on eye motion from experiments in
which individuals whose eyes had been immobilized perceived
motion when they attempted to move their eyes (Tolhurst and
Hart 1972). Another set of experiments determined that
individuals would produce eye tracking motions related to
perceived motion rather than actual motion (Steinbach 1976).
Thus perception and eye motion each seem to depend on the
results of the other.
In the study of a multistable movement display (a
display which elicits two separate alternating perceptions)
Pantle and Picciano (1976) found evidence that two separate
motion detection systems exist. A slow perceptual mechanism
was believed to involve preliminary processing of form while
a second mechanism, which could respond to shorter periods
of stimulus presentation, did not require the processing of
form.
The consensus of all the motion studies reviewed was
that the mechanism for determining motion is at the cortical
level. There appears also to be consensus about the
existence of perhaps numerous functionally independent
modules being used in motion processing. Each module plays
a specific role in the development of the final perception.
SMotion-After-Effects: The discovery of motion-after-
18

effects (MAE) has led to attempts to understand the nature9of human motion perception through the study of this
irregularity. MAE are a visual phenomena involving the
appearance of motion in the direction opposite to a stimulus
of constant velocity and direction, which are observed after
the stimulus is halted. Motion-after-effects produced by
both spirals of constant velocity and spatially periodic
functions of constant velocity and direction have been used
in such studies. Though a great deal is understood about
the characteristics of MAE and stimulus methods to produce
MAE, as yet no theory to explain the reasons for this
processing fault has received general acceptance.
Among properties known to affect the production of MAE
is their contingency upon stimulus orientation and color
(Favreau and Corballis 1976). Stimulus patterns of specific
visual orientation will produce MAE tuned to the same
retinal orientation. MAE have been reported for more than 24
hours after the presentation of a stimulus when the pattern
is oriented on the retina matching the original stimulus
(Masland 1969). Expanding on work with orientation and
motion contingent after-effects by McCollough and Hepler
(Hepler 1968), Favreau &I Al (1972) were able to show a
color contingency for MAE. In their experiment, Favreau &I
Al had subjects observe red contracting and green expanding
spirals during an adaptation period. The subjects then
reported red stationary spirals to expand and green
stationary patterns to contract. These color contingent MAE
19

could be stimulated 24 hours and more after the adaptation
period. Since color after-effects do not exhibit interocular
transfer, Murch performed a series of experiments to
determine if the color contingency of MAE could be
transferred (Favreau and Corballis 1976). Murch found that
MAE were transferred but their color contingency was not.
The contingency of MAE on orientation and color tends to
support the fact that MAE are produced at a level in the
visual system which to some degree has previously processed
and "recognized" the visual pattern. An objection to this
conclusion is the presence of MAE immediately after the
adaptation period when the stimulus pattern is no longer
present.
] It has been noted that tracking eye movements can
reduce or eliminate MAE (Weisstein, Maguire, and Berbaum
1977). A subject who follows the motion by matching his eye
movement to the velocity of the stimulus will report little
or no MAE. In a related experiment, however, Tolhurst and
Hart (1972) found that constant sinusoidal movement of the
eyes across a stationary stimulus will result in the
subject reporting MAE . These results seem to contradict
each other. In any case, they clearly point to the fact
that MAE cannot be explained solely by the presence or
absence of eye movements. Instead, it would appear that MAE
are derived from the presence of retinal disparity
patterns.
5 Arguments against this role for retinal disparity
20
g patterns in the production of MAE also exist. In numerous
experiments MAE have been reported from monocular viewing of
a pattern in constant motion. Monocular viewing should
relay no disparity information to the visual system. In
some of these experiments the existence of interocular
transfer of MAE has also been confirmed (O'Shea and Crassini
1981). What would seem an equally strong argument against
an association between retinal disparity and the production
of MAE is the fact MAE have been reported in areas of the
visual field where no actual stimulus motion was present
(Weisstein, Maguire, and Berbaum 1977). In these
experiments the subjects were given a stimulus which
permitted them to perceive motion in an area of their visual
field where no actual motion existed. They then reported
MAE within the same visual areas where motion was perceived,
yet no real motion or retinal disparities were present from
the stimulus. To explain these results, it might be
concluded that retinal disparities are first used to produce
perception, which then acts as an input to a processing
level directly related to the production of MAE.
Certain stimulus requirements to produce MAE have been
quantified. First, it has been observed that the production
of MAE is limited to the cases in which the stimulus elicits
the perception of "smooth" motion (Banks and Kane 1972).
Smooth motion means that the subject will perceive no jumps
in the movement of the stimulus. To produce such smooth
motion requires successive stimulus movements of less than
21

15-30 minutes of visual angle (Braddick 1974). Also, the
video frames must be displayed less than 30 msec apart.
Surprisingly, these limits have been found to be independent
of each other in producing the perception of smooth motion.
Studies of MAE have shown them to display certain
generally accepted characteristics. The most visible of
these is that MAE have exponentially decaying velocities
during the period when the subject is reporting their
existence. Some experiments report a second phase of MAE to
involve reversing stabilization where the visual scene
appears to alternate in direction just prior to the end of
its observation (McKenzie and Hartman 1961).
Experiments to establish a relationship between
* stimulus velocity and duration versus reported velocity and
duration of MAE have found the following: (1) increasing
the stimulus velocity decreases the reported velocity .1nd
duration of MAE; (2) increasing stimulus duration increases
the reported velocity and duration of MAE (Sekuler and
Pantle 1967). However, the findings of Sekuler and Pantle do
not totally agree with earlier findings reported by McKenzie
and Hartman (1961) which could be a result of the inherent
difficulties in quantifying the duration and velocity of
MAE. In the performance of experiments on the duration of
MAE, it is important to note that subjects display differing
levels of uncertainty in reporting the end of an
exponentially decaying event (Benson and Reason 1966). Thus
it becomes difficult to establish the true duration of MAE
22

perceived by any one individual.
Beyond characteristics associated with velocity and
duration, MAE have been reported which represent vector
summations of dichoptically presented stimulus motions of
different orientation (Riggs and Day 1980). The MAE travel
in a direction opposite to the vector sum of the separate
stimulus directions. These findings continue to support the
theory that the production of MAE is handled at a level Qf
visual processing at or beyond the point of binocular
fusion.
The most prevalent theory to explain MAE is that they
are caused by "fatigue," or adaptation of neurons tuned to
motion and direction within the cortex (Favreau and
Corballis 1976). This theory has difficulty in explaining
long term MAE (over 24 hours after the experimental
adaptation period) when no apparent problems were reported
by the same subjects in normal viewing during the
intervening period. Also, Levinson and Sekuler (1976)
reported marked alteration in the perception of motion
direction in experiments which did not produce MAE. If
alteration of the direction of motion, concluded to be
caused by neural fatigue, did not also involve reports of
MAE, then it is possible to conclude that the "fatigue"
theory cannot explain fully the production of MAE by the
human visual system.
223

If MAE are not created through the fatigue of cortical
neurons tuned to orientation and motion, then the problem
is to determine what causes the visual system to produce
such a fault. MAE are obviously a result of computations
required to process uniform motion. The answer must lie
then in the system used to process perception of uniform
motion. The following theoretical discussion will begin at
the inputs caused by different mechanisms which interact
during the viewing of uniform motion. By comparison of the
physical inputs to the perceptual output, the nature of the
computational process will then be hypothesized. Based on
the hypothetical process, a theory based on what is known
about the human visual information processing system will be
presented. Finally, a set of experiments to judge the
validity of the theory will be proposed.
Visual Inpt And £keQn Ding Uniform otion
Significant characteristics of the retinal inputs
include the following three distinct patterns of disparity:
image size variation, retinal disparity (caused by binocular
inputs or depth in three-dimensional scenes) and retinal
slip (a pattern of disparity caused by movement of an object
in the visual field or physical movement by the individual).
Figure 2 shows the geometric reasoning behind image size
variation when a visual stimulus is presented on a frontal
plane (a two-dimensional plane parallel to the subject's
24

Visual Stimulus onFrontal Plane (TwoE Squares of equal(A) _ !bsize)
(A)
Note: Length of Arc E is greater than length of arc F.
Image ImageSize Size
(B)
v-Center of Horiz.Visual Field Location
of Object
MONOCULAR BINOCULAR
Fig 2. Relationship of Image Size to Location of an Object
in the Visual Field. A) Geometry of Relationship B)
B) Graphs of Image Size vs. Horizontal Position of an Object
in the visual field.
25

chest). Since most experiments involve presentations of
visual stimuli on a frontal plane, these inputs cannot be
ignored. The variation of the image size is a function of
the location of an object in the visual scene. The closer
an object is to the monocular fixation point, the larger the
retinal image that will be produced.
Figure 3 shows the input characteristics caused by
binocular viewing of a frontal plane with a stationary
stimulus. As discussed previously, the inputs from the two
eyes introduce images of different size to the binocular
integration process. In this case, when the eyes
simultaneously view the same stimulus, the images of the
same object are also displaced. Retinal disparity, as this
image displacement is called, has been the subject of most
experiments to determine the nature of binocular fusion.
The output, or perception, determined by binocular
integration, expands the field to include the periphery of
both eyes and "sees" singular objects. Thus the binocular
integrator must be capable of eliminating the disparities in
image size and location.
Before a discussion of the nature of inputs caused
directly by uniform target motion, certain input features
which are normally present should be investigated. These
inputs involve changing references due to controlled head
movements, alterations in the orientation of the body, and
controlled eye movements. Each of these factors plays an
Salmost continuous role in determining human perception.
26
* Input Frame onFrontal Plane I
- Frontal Plane
Li Lr R1 Rr
Li Lr R1 Rr
emInput to
* jI* S Binocular Integrator
Perception: Output of* *] [ * Binocular Integration(Assumed no Rivalry Exists)
Fig 3. Sequential Binocular Processing of a Visual Stimulus
on a Frontal Plane.
27

If it is assumed that the eyes remain stationary and
the body orientation is fixed, then image size
patterns induced by head movements alone will, in general,
follow the graphs shown in Figure 4. Certain assumptions are
implicit in these graphs. First of all, it is assumed that
head movements describe a circular path, an assumption
which may not be true because of the physical structure of
the head and the manner in which it pivots upon the neck.
However, though this assumption alters what might be the
true magnitude of the image-size disparity, it would not
alter the overall relationship observed for horizontal head
movement, nor the constant size disparities related to
vertical head movements. It should also be noted that
horizontal head movements across objects cause image-size
variations similar to the graphs for the stationary case.
One difference does exist though, between horizontal
head movement and stationary image-size curves. Since
motion of the head alters the distance from the eyes to the
frontal plane, the curves will rise and drop more sharply
than the curves depicting the image-size versus object
location in the field in the absence of head movement. The
argument for the existence of nearly constant image-size
disparities in vertical head movements is consistent with
the geometry shown earlier, since the object does not change
horizontal location in the visual field. In assessing the
graphs of Figure 4 it should also be noted that the
5 magnitude of the image-size disparity is not quantified.
28

Object
FrontalPlane
~~~0-0b 0
/a bC\ Ha
0 0/ Image
Size(A) I I
(B)
Sb HeadPosition
Frontal
0b 0
, Object Y0/a 0) Center
Right S,.,.LeftEye Eye I1mage
Size of Y
I1r
a b c HeadPosition
Fig 4. Graphs of the Image Size Disparity vs. Head Position
SA) Graph of Image Size for Horizontal Head Rotation. B)
Graph of Image Size for Vertical Head Movements.
29
The magnitude would be dependent on several factors, the
most important of which would be the distance between the
viewer and the object being viewed. At viewing distances
significantly greater than the distance between the viewer's
eyes, the magnitude of the size disparity would likely
become too small to play a role in the processing of
information obtained from the visual inputs. The limit where
image-size disparity becomes too small to be detected by the
visual system has not been quantified and should not be
confused with the limits of binocular fusion of points.
Stereoscopic vision, which uses disparity cues, is known to
involve a separate level of processing than binocular fusion
(Richards 1970). In addition to the image-size variation
induced, the entire visual scene is moving across the
retinas at a velocity and direction opposite to the motion
of the head. Thus a component of retinal slip velocity is
introduced by head movements. Additionally, disparities
caused by binocular image displacement will be introduced as
the object location varies in the visual plane.
From human experience, or simple self-experimentation,
it can be shown that stationary objects in the plane of
fixation are not perceived to move during head movements.
They do, however, differ in their orientation to background
and foreground., objects as the head moves. Another important
feature of perception during head movements is that there
appears to be no difficulty in maintaining binocular fusionI
for objects encountered in the visual field.
30

Since the detection of motion by an object is generally
regarded to be determined by either a change in the object's
orientation or size in relation to its background and
foreground, the human visual system must be compensating for
head movement in computing perception. The failure of head
movement to produce double vision of objects implies the
system is also overcoming the retinal image-size disparities
induced.
Figure 5 depicts, in successive frames, how the
combination of retinal slip, retinal disparity, and image-
size variation might interact during head movement from left
to center. If the system continues to perform binocular
fusion to eliminate confusion, then a perceptual integrator
can be hypothesized which attempts to match retinal slip
velocity to that expected by the head velocity. In this
manner, stationary objects could be identified. It might be
guessed that some limit exists on the head movement
velocities under which this system can continue to correctly
determine visual information received. Self experimentation
tends to support the idea of this limit.
Inputs caused by alterations in body orientation and
eye movement are similar to those induced by head movements.
In each case, retinal slip opposite in direction and
velocity to the movement, and retinal disparity and image-
size variation as functions of an object's location in the
visual field, are introduced. To determine perception,
3 however, the system now needs information related to eye and
31

StationarySFrontal PlaneDisplay
0,0 Direction of+ read Rotation
zSuccessive MonocularRetinal FramesL1 Moving Head fromLeft to Center
Head SuccessiveVelocity Inputs to'
Binocular--]a Integrator
Successive I* Frames J1Seen" I ,Z
PerceptualIntegator]Perception of a Stationary
Single Object
Fig 5. Processing of Sequential Monocular Retinal Inputs
During Head Rotation to Permit Perception of a Single
Stationary Object in the Visual Field.
32
- * - .- -. .

body orientation velocity vector components. For alterations
in body orientation, this information is available from the
semi-circular canals. In the case of eye movements,
information either from the optic muscles, or more probably
their controlling mechanism, could provide the necessary
input. A diagram of the possible data flow which can be
hypothesized at this point is given in Figure 6.
The case of uniform object motion within the visual
frontal plane can now be considered. Uniform motion can be
observed either by tracking the object with the eyes or by
keeping the eyes fixed. From the earlier discussion it can
be seen that the image-size disparity and retinal disparity
input functions will, in each case, be similar to those
observed for eye, head, and body movements. The main
difference will lie then in the introduction and
compensation for retinal slip velocities introduced by eye
movement. For eye trpcking, the system can determine object
motion by locating images in the plane of fixation whose
slip velocity does not match the slip velocity induced by
related eye movement. With the physical system held steady,
the presence of retinal slip will indicate motion.
Another look should now be taken to determine the
implications of the data flow diagram built from the
knowledge of the visual inputs and perceptual outputs.
First of all, we may ask whether it is necessary to place
binocular integration before the perception of motion. This
sequence was developed from the nature of the monocular
33

9 Alterations Eyein Body MovementsVisual Orientation
SceneInput
MapMonocular Monocular .
Retinalt Outputs
Bodnoveent
BinocularIntegration
Head Fused I
MO s ObjectPerceptual
ScenesRetinal Slip
Velocity Inducedby Eye, Head, andBody Movements
PerceptionIntegration]
1 Relative
Motion ofObjects inPercptio~isul~ceef Visal
Field.
34
- ---- -.---
Perepio

inputs. The computation of retinal slip velocity is
simplified if ambiguous data due to image-size and
displacement disparity are first extracted. Computer
implementation techniques which indicate the extraction of
stereoscopic disparity cues prior to binocular integration
(Grimson 1980) also support this view, since in the system
presented, disparity information would not be available
beyond the point of fusion.
A second point to be made about the system developed is
to determine what expected retinal slip velocity would
result from physical movements. It is easy to see how the
perceptual integrator can pick out the vector sum of the
eye, head, and body movements if given appropriate input
data. But this velocity, derived as a direct result of
physical movements, will induce retinal slip velocities
which vary with the distance to an object in the field. The
further an object is from the viewer, the slower the retinal
slip velocity induced by physical movement. To perceive
motion, a logical selection for the perceptual integrator
would be to compute an induced retinal slip velocity for the
plane of fixation. This procedure would seem appropriate
since the plane of fixation is the plane of greatest
interest. If this is correct, then a degree ofuncertainty
would be present in determination of motion by background
and foreground objects. Once again, subjective tests appear
to validate this conclusion.
S A final topic relating to the visual processing system
35

described here is the nature of a binocular integrator and,
specifically, the limits to the disparity this system could
be expected to handle. The question is whether the limits
of binocular fusion can be described as maximums of a
constant functional value or whether the limits can be
caused to vary. Subjective experiments, where individuals
view a visual scene with one eye looking through a lens of
of varying focal length (i.e. a "zoom" lens), support the
idea of a variable maximum for binocular fusion. The point
of fusion in these experiments is different for the
instances when the scenes are initially fused and the
instances when they are initially seen as double. This
variable maximum of disparity magnitude for fusion implies
tthat a feedback signal is present to allow the binocular
integrator to predict and maintain "singleness" when
disparate monocular images are previously known to represent
a single object. The feedback signal would need to be able
to inform the integrator to expect single object disparities
of a magnitude based on the full range of input variations
being induced by the physical alteration of the visual
scene.
Based on the previous discussion, the data flow diagram
(Figure 6) can be expanded to that shown in Figure 7. The
numerous processing levels in Figure 7 begin to depict the
complexity of deriving perception from visual scenes. Each
of the processes shown would require many additional
processing levels to perform their functions.4
36

I Alterations
in Body EyeOrientationvmet
Visal k Derive Extract
Scn JMonocularl Monocular V DepthInpu J Retinal Mappings Disparity
Hed/ll Mappingsl ICues .
Moveeq~) IBinocular Fused _JIdentify
SIntegration Scenes lO b jec ts
S of I in VisualJ[ appings I S c e n e
MoeIt DetermineJ Imag e "
--' Sum of Ratio & ]ObjectsPhysical Displacement finMovementsl Prediction IScene
Alterations'
in BodyOrientation]
k~j/ / IDetermine Determine/ I Visual Retinal/ I Alterations Slip Related
Induced of objects to ObjectsPhysical . •I"
, Alterations /Field, l /Depth
\ | / RelationshipsEye [Orientaion \-|Retinal
I \SlipFixation
\of objects
ObjetsObjectson
Reatv DepathtMtin f bjct
Scen xatintrao Exece Object
Fig . Daan Flo Daga Vel Poceity forla Deerminal
InptsLedig t a Meoetion of ObjeteMoion
Objct
Percptio Reltiv
The data flow diagram, with its related processing, has
been hypothesized based on the nature of successive
"samples" of visual scene inputs. The depiction of the
human visual processing system as a sampling mechanism
appears to agree with some of the known facts. Experiments
by Braddick (1974) with the production of "smooth" motion,
using successive stimulus presentations, support the idea of
the visual system deriving perception from visual samples.
As reported earlier, Braddick found subjects reported smooth
motion when the object displacement was less than 15-30
minutes of visual angle. He further discovered the
displacement required to produce smooth motion to be
independent of the time interval between presentations. If
the system processes against successive samples, then the
independence of the two parameters would be expected. The
limit for time between frames would be directly related to
the visual system's sampling rate, while the limit for
object displacement would be a result of the processes
required to identify objects and compute their relative slip
velocities. Since motion perception can only be determined
by a relation between present and past states, and the
required processing of visual data will involve certain
latencies, there appears to be a valid argument for
depicting the human visual system as a "sampler."
It should also be added that the retention of past
states agrees with experiments conducted by Ross (1976)
V' which showed that humans can derive stereoscopic cues from
38

dichoptically presented stimulus pairs when up to 50 msec
separates corresponding frames of a pair. The smooth motion
limit of approximately 30 msec between samples would predict
that the system would take a third sample approximately 60
msec after the first. Within experimental error, these
results can be taken together to hypothesize a system which
processes information based on a most recent and a previous
sample. Using this hypothesis to explain the experiment by
Ross, a time delay greater than 50 msec would have caused a
third sample to be taken and the stereoscopic cues
associated with the previous two samples would have been
lost.
The idea of visual sampling does cause some intuitive
problems since this method of processing would involve
synchronization of the system. To synchronize processes the
visual system would require synchronization signals to be
sent between processes. This appears unlikely in a system
whose structure suggests asynchronous computations *to
produce continuous output functions. Further, in
microelectrode investigations of the visual cortex, the
firing rate characteristics of neurons display continuous
output functions related to the visual stimulus inputs, a
result which does not suggest "sampling" has occurred.
The data flow diagram in Figure 7 has been constructed
without regard to how a system so designed would produce
MAE. This was done since MAE are not part of the normal
39

visual processing but are instead an inadvertant
concommitancy of a system constructed to produce correct
perception of visual stimuli. Whether the system
constructed can explain such a fault becomes a test of the
system's validity in depicting the nature of human visual
processing.
From the diagram produced, it is apparent that MAE
should be a direct result of an incorrect output from the
process used to determine objects in motion. For this
process to produce a false output would imply either the
incorrect computation of the expected slip velocity related
to stationary objects or an incorrect computation of the
retinal slip velocity associated with objects. The fact
that MAE appearing immediately after the stimulus period can
be observed in the absence of the stimulus suggests that the
expected slip velocity calculation is the more likely
cause. Yet an investigation of the processes shown to
jproduce the expected slip velocity gives no clear reason why
this system would fail after observing uniform motion
(unless neural fatigue is to be considered the underlying
cause).
A first look at the processes involved in the
calculation of retinal slip associated with objects in the
visual field seems to give no clue as to why this system
would "fail" after observing uniform motion. As long as the
feedback loop remains intact, the binocular integrator
should continue to properly locate fused objects in the
40

visual field. When the objects are properly located in the
field, the calculation of their related retinal slip
velocities should continue to be computed correctly. The
result would then be the correct perception of their
relative motion. However, if the feedback loop drops out
after "learning" the characteristics of a uniform stimulus
pattern, and the stimulus pattern is later altered, the
binocular integrator will improperly locate objects in the
field based on its expectations of the "learned" response
pattern. In this case all objects in the area of the
learned response would be assigned incorrect relative slip
velocities.
This appears to be a rather bizarre occurence. Yet
precedence for a system of this type exists. The human
motor response system is believed to use the cerebellum as a
feedback loop to allow correct coordination of motor
movements (Guyton 1976). Further, the ability to "learn"
rapid motor movements has been bypothesized to result from
the removal of the latency involved in the feedback loop of
the cerebellum. After "learning" a constant response
pattern, the motor cortex is thought to continue to respond
to the "learned" nature of the pattern. If a similar
feedback system is used in visual processing, then uniform
motion could invoke a learned response and thus eliminate
the feedback loop used bythe binocular integrator. The
result upon altering the stimulus pattern would then be a
* series of corrective actions until the feedback loop is
41
spo

re-established. This series of corrective actions couldlead
to a decaying function similar to those attributed to MAE.
If learned response patterns are at the root of MAE,
that fact would help to explain the reports of MAE up to 24
hours after the uniform motion stimulus period. The
retention of a learned response to an event would produce
MAE much as humans learn to rapidly respond with motor
actions to a given event. In the case of the production of
long-term MAE, it has been reported that the stimulus scene
must be located at the same point in the visual scene as the
original stimulus pattern (Masland 1969). Thus the re-
introduction of the visual scene with the same orientation
could be said to cause the subject to recognize a learned
event and react accordingly.
The fact that MAE can be color contingent may arise
from the fact that the process of object identification is
hypothesized to occur before a determination of the relative
i object slip velocity. Learned tesponse to the event then
occurs upon recognition of the object and event. This same
relationship to the process of object identification could
explain why MAE have been observed in an area of the visual
field where only "phantom" motion is present (Weisstein,
Maguire, and Berbaum 1977).
The vector summation results from MAE and from normal
motion perception also seem to conform to the data
processing model presented. If, as in the experiments
producing vector sums, the computation of relative object
42

retinal slip velocity must be made on ambiguous data
transposed onto the same areas of the visual field, it would
not be surprising to have it yield a summation. After all,
the system is trying to determine slip velocity associated
with a single object at a point in the field. The
transposition of ambiguous retinal slip data would not be a
naturally occurring event since in the physical world only
one object can define a space.
Since this hypothesis about the production of MAE is
centered on a binocular system, then MAE produced by a
single monocular stimulus must be considered. To explain
this phenomenon, it must be assumed that the binocular
integration process remains a part of the circuit in spite
of the fact it is receiving only a single monocular input.
In the model shown at Figure 7 the process which determines
visual alterations of objects, and receives "induced
physical alterations" as input may well be relaying the
information to the binocular integrator to ignore data from
the closed eye. In this manner the binocular integrator
could continue to output objects correctly placed in the
field. Also the feedback loop would remain functional in
correcting for physical alterations and image-size disparity
as objects move within the visual field. If, as
hypothesized, "learned" response drops the feedback loop out
during the viewing of uniform motion, then the system would
again produce incorrect results when the stimulus is
5 altered. Since the system is designed to interact on the
43

results of binocular vision, the interocular transfer of
MAE, as reported, is not surprising either.
By using the idea of a learned response to explain MAE,
the validity of the data flow diagram (Figure 7) can be
argued. The final requirement is to relate the processes of
the data flow diagram to the known physical structures which
might perform these processes.
PhsclStructure of Visual Frocessing
As reported earlier, the retinal inputs are transmitted
to the primary visual cortex with no apparent processing
performed in the Lateral Geniculate Nucleus (LGN).
However, an investigation of the LGN, with its layered
structure, can provide an insight to its possible function.
In the previous discussion it was asserted that to correctly
interpret motion, the visual system would require both a
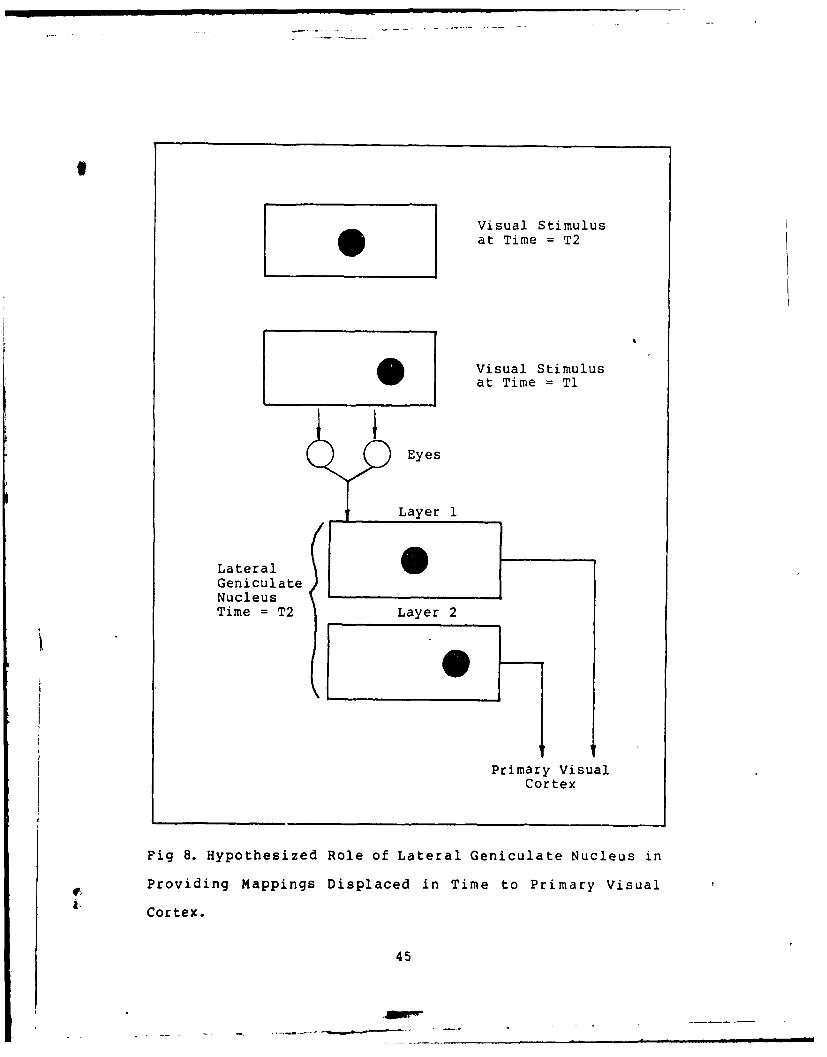
present and previous visual input scene. One method of
attaining sequential visual mappings would be to provide a
transmission latency between successive mappings. This
method is depicted in Figure 8 and coincides well with the
known structure of the LGN. Since microelectrode experiments
on individual neurons would not disclose the dual latency
patterns of the LGN output, the functional importance of the
LGN could easily have been missed.
If the LGN does provide the cortex with multiple visual
mappings, separated in time, then the next question is what
functiont are performed by the visual cortex. At present
the data do not clearly indicate the exact manner of
44
Visual Stimulusat Time = T2
Visual Stimulusat Time Ti
Eyes
Layer1
LateralGeniculateNucleusTime = T2 Layer 2
Primary VisualCortex
Fig 8. Hypothesized Role of Lateral Geniculate Nucleus in
Providing Mappings Displaced in Time to Primary Visual
Cortex.
45

cortical processing. The reported existence of neurons
tuned to orientation and motion direction cannot be used to
conclusively argue the existence of any of the hypothesized
processing centers. As discussed earlier, reported cortical
neuron characteristics may only suggest the presence of a
single variable within a far more complex function. In any
case, the high order processes hypothesized would most
likely reside at the cortical level. Among the processes
hypothesized, the cortex would likely perform binocular
integration, object identification, calculation of induced
and object related slip velocities, determination of motion,
and the integration of perception.
Based on the available range of input data to the
cerebellum, and the hypothesized role it might play in the
production of MAE, the determination of the effects of
physical and object movement would likely be performed by
the cerebellum.
A composite diagram is shown in Figure 9 with data
processes displayed within the boundaries of their
hypothesized physical locations. Admittedly this diagram
evolved from a series of intuitive leaps. Most
significantly, the roles attributed to the LGN and
cerebellum are not found in the literature about visual
information processing. Since these roles have not been
explored, little evidence exists to support the theory
presented. At this point the model can be defended only on
the apparent need for the processing functions described and
46

~LGNVisual Derive Monocular ProduceScene Monocular Mappings MappingsInput Mappings SeparatedI
/ / in Time ]
Head Sequential
Movements /Monocular_Eye 1 MappingsMovements|/7 I S A is coRT xAlterations in ! f-- --- - --Body Orientation / ,Binocular | Ex tr ac t
1 / Integration | Depth
J / / lof Monocular| DisparityCEREBELLUM Mappings Cues
Determine Sum I Fused IFieldof Physical Image I Sequential DepthAlterations Ratio & . pappings IRel.
J I ~Displacement . .- , ,' Prediction Identify I R e l a t e
Induced / o b j e c t s I Depth toJ/Physical I Objects/Alterations i Objects ,
k I / ] Related to/J Determine ] _ Scenes Relative
Visual . Depth ofAlterations ' Determine Objectsof Objects I , Retinal Slip
% ' l k Related to-- - J -- objects
Retinal Slip
.. ____Velocity of
Ey il ompare InducedlMovements 'to Actual Slip|
Fixaion Velocities
Angle J - - Relative MotionCalculate / of ObjectsInduced / k_ - -, Slip Velocity Perceptualin Fixation | IntegratorPlane
Perception ofViual Scene
Fig 9. Relationship of Proposed Model Processes to PhysicalI Structures in Humans.
47

the possibility, based on structure and known available
inputs, of the LGN and cerebellum performing their ascribed
roles.
If Pantle and Picciano (1976) are correct that two
motion detection systems exist, then this model would
describe the system requiring object identification. It
would intuitively make sense that humans might also have a
"reflex" motion detection system which avoids the latencies
inherent in this model. Such a second system could well be
used to signal a defensive reaction to perceived motion.
Experimental Proposals
The following sections describe psycho-physical
experiments that were conducted in an attempt to assign a
degree of validity to the model. The objective of the
experiments was to quantify the existence of a variation in
the maximum limit of binocular fusion and to determine if
the production of MAE is related to the position of the
uniform motion stimulus in the visual field. The theory that
a feedback loop exists to aid binocular integration is based
on the fact that fusion can be maintained beyond a normal
limit when the monocular images have previously been
identified as a single object. If this assumption can be
quantified, then it would provide credence to the existence
of the predictive feedback loop.
MAE were hypothesized to result from the learning of a
uniform pattern variation which allowed the binocular
integrator to function in the absence of input from the
48

feedback loop of the cerebellum. In this case, an alteration
in the "learned" stimulus pattern would cause the system to
incorrectly locate fused objects in the integrated visual
field. Based on this hypothesis, visual adaptation to
uniform motion in the periphery, where less variation occurs
in image-size and image displacement, should invoke less MAE
than uniform motion centered on the foveal area. A psycho-
physical experiment to determine if this expected result is
obtained is also discussed in the following sections of this
report.
Since both MAE and binocular fusion have beenhypothesized to depend on a feedback loop from the
cerebellum to the cortex, it would appear likely that a
correlation could exist between the data collected from each
experiment. The possibility of the existence of such a
correlation will also be discussed later.
4
I
49
_______________________ ______________

IV. EXPERIMENTAL DESIGN AMD PRCEDURE
Limits of Human Binocular Fusion
In this experiment an attempt was made to determine the
characteristics of human binocular integration. As
mentioned earlier, the specific purpose was to investigate
the limits of binocular fusion. Thirteen male graduate
students in Electrical Engineering participated as
subjects. Two of the subjects reported prior to the
experiment that they were red-green colorblind.
Additionally one subject reported to be asimetropic (near-
sighted in one eye and far-sighted in the other eye). A
fourth subject reported to have weak ocular muscles in his
left eye. Seven of the thirtet.. wore corrective lenses.
jj ",menit: Two microprocessors were used to produce
separate visual stimuli. The first, a Cromemco Z-2D
microprocessor with two 48-K video memory boards and a
digital-to-analog video board, was used to produce visual
stimuli which were presented to the subject's left eye. Two
5 1/4 inch Cromemco disk-drives were used for program
storage. Video presentations were displayed on a Cromemco
RGB 13 inch high resolution monitor. The color and contrast
controls were set at mid-range and the brightness control to
its highest setting. Fortran-IV programming language was
used along with the Cromemco SDI software graphics library.
During the experiment, a black poster board frame was taped
to the Cromemco monitor. The frame covered the front of the
monitor, allowing the subject to view only the central
50

portion of the monitor screen. The exposed screen area was
0 9 1/2 inches in width and 7 1/4 inches in height. A
Heathkit H-19 monitor and keyboard were used to enter
programs and to communicate with the Cromemco
microprocessor. Experimental data were output to an Anadex
Silent Scribe printer.
The second microprocessor, a TRS-80 Color Computer with
32-K RAM, was used to produce visual stimuli which were
presented to the subject's right eye. A Radio Shack CTR-
80A cassette recorder was used for program storage. Video
presentations were displayed on an RCA 13 inch color
television screen. The color and contrast controls were set
at mid-range and the brightness control to its lowest
setting. The Extended Basic programming language, provided
with the TRS-80 Color Computer, was used to produce the
required graphics. As with the Cromemco, a black poster
board frame was taped onto the front of the RCA screen
exposing only a portion of the screen 9 1/2 inches in width
by 7 1/4 inches in height. A Radio Shack joystick control
was used during the experiment to allow subject's to
communicate with the TRS-80 microprocessor. Experimental
data were output to a Decwriter IV printer.
Figure 10 depicts the equipment configuration during
the experiment. From the center of each screen to the floor
was 110 cm. To position the height of the Cromemco monitor,
and to tilt the screen forward to be perpendicular to the
floor, an adjustable platform was constructed (Figure 11).
51

N
W E0
Fig 10. Equipment Configuration for the Experiment on the
Limits of Human Binocular Fusion. A) RCA 13 in TV
B) Decwriter IV Printer C) CTR-80A Cassette Recorder D)
TRS-80 Color Computer E) Cromemco Color Monitor F)
Adjustable Monitor Platform G) Heathkit H-19 Monitor H)
Cromemco Z-2D microprocessor I) Anadex Silent Scribe
Printer J) Joystick Control K) Chair L) Chin Rest M)
Adjustable Mirror N) Laboratory Bench 0) Desk
52
-~i

IO'k
Fig 11. Adjustable Platform Constructed for Cromemco Color
Monitor.
53

To provide a stable chin rest, and to permit centering
of the two visual scenes on the subject's eyes, an
adjustable platform was built (Figure 12). Mounted on the
platform was an automotive side-mirror with a 5 in. by 5 in.
flat reflective mirror taped securely to it. The automotive
mirror was used since it provided an easy method of
obtaining a pivotal joint for adjustment of the flat
reflective mirror. The flat reflective mirror was used by
the subjects to view the Cromemco screen.
The use of two differing video screens resulted in
differences in luminance, contrast, and hue. The luminance
of the RCA screen was approximately 40 ft-lamberts while
that of the Cromemco screen was 5 to 10 ft-lamberts. Both
screens were type P22A phosphors. During the experiment the
room was lit by flourescent lighting with the lights
directly over the experimental area turned off to reduce
glare. No attempt to match contrast or luminance of the
screens was made since, in trials prior to the experiment,
it was determined that the differences did not significantly
interfere with the observations to be tested. The colors
of the stimuli were changed during the experiment in an
attempt to determine if any stastical difference could be
found in the test data related to color. Contrast and
luminance of the two screens remained constant throughout
the experiment.
Procedure: Prior to beginning the experiment, each
3 subject was introduced to the equipment and controls to be
54

J s~kto.Ae- m'r%rror
64
foci
32"
Fig 12. Adjustable Platform to Provide a Chin Rest and to
Support an Adjustable Mirror.
55

used. The subject was then asked to read a set of
instructions (Appendix A). After the subject completed the
instructions, the experiment monitor assisted the subject in
adjusting the equipment so that each screen was centered
within the visual field of the subject's eyes. This was
accomplished by having the subject adjust the mirror to
center a solid green square within a larger green square
frame. The square frame was first presented to the right
eye (from the RCA screen) while the left eye viewed a solid
square (from the Cromemco). The order of presentation was
then reversed. Because of perception difficulties, caused
by binocular rivalry, the subject was told to only be
concerned that the squares were "generally" centered. In
tests performed prior to the experiment it was discovered
that a degree of tolerance existed in centering the scenes
without significantly affecting the data.
After the subject had centered the scenes, the conduct
of the experiment was left to the programmed control of the
two microprocessors. The two programs (Appendix B) were
designed to prompt the subject with messages. By following
the instructions provided on the screens (mostly the R-A
since messages on the Cromemco were reflected off the mirror
backwards) the subjects were able to conduct the experiment
without additional direct intervention by the experiment
monitor. In the initial segment of the experiment, subjects
were taken through a learning phase. Throughout this phase
a solid green square centered on a black background was
56

displayed on the Cromemco (left eye). The square was 6.5 cm
on each side with a small black square (approximately 2mm),
for a focal point, at its center.
The subjects were first instructed to observe as a
solid green square (6.5 cm) centered on a black background
was displayed on the RCA (right eye). This square also
contained a small focal point (approximately 2 mm) at its
center. The subjects next observed as the green square on
the RCA expanded from 6.5 cm to 17.8 cm. The rate of
expansion of the square was 1.62 cm/sec. During two
observations of the expanding square, the subjects were
instructed to fixate on the small focal point and determine
at what point a smaller square distinctly appeared inside
the larger square. On a third trial the subject was asked
to press the control button on the joystick (connected to
the TRS-80 color computer) when the second square appeared.
The subjects were next told to observe as the square on
the RCA screen contracted from 17.8 cm to 6.5 cm. The rate
of contraction of the square was 1.62 cm/sec. Again the
subjects were told to fixate on the black focal point.
While the larger square contracted the subjects were told to
observe at what point the smaller inner square and the
larger contracting square appeared to become one square.
The subjects were next told to press the joystick control
when it appeared the two squares had become one square.
Pressing the control momentarily (1 second) halted the
contraction before it continued. After one trial the
57

subjects were asked if the inner square immediately re-
appeared. If so, they were instructed to again press the
control as the squares appeared to become one square and to
continue to press the control again until the second square
did not reappear. The subjects were then given five trials
at performing this test. This completed the learning phase
of the experiment.
During the initial portion of the testing phase the
subjects observed expanding and contracting squares in
alternating tests on the RCA screen. The size and speed
parameters, as described earlier, remained the same
throughout the tests. The scene displayed on the Cromemco
was always a solid 6.5 cm square on a black background with
a small black square (used as a focal point) at its center.
The small black square (focal point) on the RCA screen was
only present when a random number from 1 to 10 was greater
than 4. Thus the focal point was absent from the RCA screen
in approximately 40% of the tests during this phase.
In the first series of 10 tests ( 5 with the square
expanding and 5 with it contracting) the squares on both
screens were green. When subjects pressed the control while
the squares were expanding, the expanding square was erased
from the screen. The size of the square when the control
was pressed was then sent to the printer along with other
information describing the test just completed. A 7 second
delay was imposed between each test. When the square
contracted, the size of the square when the control was last
58
..... . . ... - - -

pressed was sent to the printer. Each time the control was
pressed as the square contracted, the contraction halted for
one second, then continued. The square would always
continue until it reached 6.5 cm before sending the data to
the printer. In all test cases the speed of expansion and
contraction was held constant at 1.62 cm/sec.
Ten tests were then taken in the same manner with the
color of the square presented on the Cromemco changed to
red. The initial testing phase was completed when 10
additional tests were conducted with the color of the
squares on both the RCA and Cromemco changed to white. With
the exception of the color changes no other experiment
parameters were altered.
The second, and final portion of the testing phase was
conducted with the expanding and contracting squares
appearing on the Cromemco (left eye). During these tests
the RCA always displayed a 6.5 cm square with a focal point
at its center. All parameters *except color were kept the
same as in the first series of tests. To signal the
Cromemco the subjects were instructed to first press the
"space" on the H-19 keyboard and then press any letter key.
Three sets of 10 data elements were taken, as before,
with the expanding and contracting squares appearing on the
Cromemco. For the first set the squares on both the
Cromemco and RCA were white. During the second set the
square on the RCA was white and the squares appearing on the
Cromemco were green. For the final set of 10 data elements,
59
. - |

the squares on both the Cromemco and RCA were green.
Upon completion of the testing each subject was asked
to complete aquestionnaire (Appendix C). The experiment
monitor then had each subject describe verbally what they
had observed and at what point in their observations
they would respond. This was done to insure the data
collected were associated with the observations to be
measured.
MA Related IQ Lohn e Visual Field
In the second experiment subjects were tested to
determine the relationship between their reported MAE and
the location of the stimulus in their visual field. The
subjects used were the same individuals who, one week
earlier, participated in the first experiment. Each of the
participants reported after the experiment to have either
previously witnessed MAE or that they were aware of the
existence of MAE in human perception.
Ei1nLjt: Throughout the experiment a series of
visual stimuli were presented on an RCA 13 inch color
television screen. The television signal was transmitted
from a TRS-80 Color Computer with 32-K RAM. The Extended
Basic programming language was used to produce the required
graphics displays (Appe-dix D). A Radio Shack CTR-80A
cassette recorder was used for program and graphics storage.
To allow the subjects to communicate with the computer, a
Radio Shack joystick control was used. A Decwriter IV
printer was used for data output.
60

To control the subject's viewing position, the
adjustable chin rest platform, described in the first
experiment, was again used. For this experiment the mirror
and its mount were removed.
Next to the television a sheet of black poster board
was mounted upright to provide a uniform background. The
poster board also served to permit the location of a
peripheral focal point used in the experiment. The
equipment configuration and the location of the focal points
are shown in Figure 13.
The room was lit with flourescentlights, with the
lights directly over the experimental area turned off to
reduce glare. The luminance of the RCA screen was
approximately 40 ft-lamberts on a P22A phosphor screen. The
brightness control was set to its lowest position with
contrast and color settings in their midrange.
Procedure: Each subject was initially seated in the
chair with the chin rest platform positioned directly in
front of the television screen. The experiment monitor then
read aloud the first paragraph of the instructions (Appendix
E) and described a visual scene which was presented on the
screen. The scene observed was a series of vertical black
and green bars, 6 mm in width, enclosed within a black frame
measuring 14.0 cm x 13.5 cm. A black square (5 mm) was
centered in the frame.
Translated into degrees of visual angle, the pattern
frame was 6.2 degrees in width when the viewer was directly
61

i J A~
B:C/2 cm
WOF
TOP VIEW
1} IIIcrn
1.5
FRONT VIEW
Fig 13. Equipment Configuration for the Experiment Measuring
the Parameters of MAE as a Function of Position in the
Visual Field. A) RCA 13 in Color TV B) Black Poster Board
C) Decwriter IV Printer D) CTR-80A Cassette Recorder E)
TRS-80 Color Computer F) Joystick Control G) Adjustable
6 Chin Rest H) Desk I) Chair J) Laboratory Bench
62

in front of the screen. The spatial frequency of the0vertical square wave pattern was 1.9 cycles/degree.
A green background surrounded the pattern on the
screen. When the pattern appeared, the vertical bars
initially moved to the right at 4.3 degrees/sec for 2.7
seconds. The vertical bars then halted and the pattern
remained on the screen for 2.6 seconds.
The subject was then instructed to place his chin on
the chin rest and observe the pattern while fixating on the
small black square in the center of the pattern. The
subject was further instructed to attempt to determine if
there was any leftward movement of the pattern immediately
following the halting of the rightward moving vertical bars.
* The experiment monitor also advised the subject that the
leftward movement, if present, would not involve movement of
the bars across the focal point. Instead the subject was
told to look for a leftward movement by the entire pattern.
The same scene, as just described, was presented four times.
When the subject observed leftward movement of the pattern
he was to press and release the control button on the
joystick.
The second paragraph of the instructions (Appendix E)
was then read aloud to the subject. The subject then
observed three trials where the bars moved rightward for
13.3 seconds. The subject was to press the control button
when he observed leftward motion of the pattern and hold the
button until the motion ceased. The stationary pattern
63
...............................

would remain on the screen as long as the subject pressed
the control button. After each trial a blank green screen
was displayed for 11 seconds. One second before each trial
began a tone would sound. No data were collected during
these trials (the printer was turned off). This completed
the learning phase of the experiment.
The testing phase of the experiment consisted of two
tests, each of which was taken with the subject seated in
one of three positions. A separate focal point was assigned
to each position (Figure 13). The subject was given two
different tests at each position. Starting with position 1,
with the pattern centered in the visual field, the tests
were then taken consecutively at positions 2, with the
pattern 7.3 degrees off the center of the visual field, and
position 3, with the pattern 17.1 degrees off the center of
the visual field. The same sequence of positions was then
Le-tested. Both tests involved the presentation of the same
video pattern as described in the learning phase.
In the first test performed at each position the bars
were moved rightward for a period of time determined by a
random number. Based on the value of the random number, the
duration of the moving bars varied from 0.13 seconds to 2.67
seconds in increments of 0.13 seconds. After the vertical
bars halted, the subject viewed the stationary pattern for
up to 2.6 seconds, pressing the control to indicate if he
observed leftward movement of the pattern. After each test
*the pattern was removed and a blank green screen was
64

displayed for 11 seconds. One second prior to each test a
tone would sound. This same test was repeated ten times,
with the results of each sent to the printer.
Upon completion of ten repetitions of the first test, a
second test was performed at each position. In the second
test the same pattern was displayed as before. In this
series of tests the duration of the rightward moving
vertical bars was held constant at 13.3 seconds. When the
bars halted, the subjects were to press and hold the control
button during the period they observed leftward movement of
the pattern. Three repetitions of this test were performed
with 11 seconds between tests, and a tone provided one
second before initiation of the next repetition. The length
of time subjects reported leftward movement was sent to the
printer after each repetition. During the tests the
subjects were given 5.3 seconds to report leftward movement
of the stationary pattern before it was assumed no leftward
movement was observed.
Completion of three repetitions of the second test
completed the testing at each position. Subjects were then
moved to the next position in the experiment sequence and
the tests repeated until all three positions were tested
twice.
665

V. EXPERIMENTAL RESUL
Limit Human B QQ2uJa Fusion
Of the thirteen graduate students who participated
twelve reported similar perceptions. The data taken from the
twelve subjects were used to determine the subjects'
relative limits for perception of a single object when given
disparate visual stimuli to the two eyes. The following
discussion will first cover the general perceptions reported
and then the quantitative results of the data collected.
Repgrted Pereotig : When the squares presented to
each eye were of the same size, the form remained stable.
The color of the square, however, alternated between the
colors presented to each eye. This bi-stable perception was
believed to result from binocular rivalry. Since color
after-effects do not display interocular transfer (Favreau
and Corballis 1976), it is likely the perceptual integrator
must decide between the color input from each eye. With no
additional information to judge the importance of each
monocular input, the perceptual integrator becomes unstable,
producing the alternating color rivalry reported.
A significant finding, reported by the subjects of this
experiment, was that regardless of the color observed, the
focal point appeared to remain in the middle of the square.
This occurred even when the focal point was only present on
the screen of the color not reported. It is hypothesized
that the importance given the focal point in the
instructions, prior to the experiment, caused the subjects'
66
• , mWPM,

binocular integrator to keep this form present even when
* local rivalry allowed the other eye to determine the color
of the surrounding square.
As one of the squares began to expand the subjects
initially reported seeing only one square. The color of
this square remained stable and was always reported to be
the color of the square actually expanding. The importance
of the boundary motion of the expanding square is believed
to have caused the perceptual integrator to have stabilized
on the color associated with the motion. Here again, the
focal point was reported to have remained within the
subject's visual perception even when it was only present on
the square which was not expanding.
As the one square continued to expand, the subjects4reported a period when a "dark fuzz" appeared as an outline
of a square the size of the nonexpanding square. At a
further point in the expansion, the nonexpanding square
from the opposite eye would suddenly, and distinctly, appear
within the expanding square. It is believed that at the
point when the smaller square appeared the individual's
capability to fuse the two squares had been exceeded. Prior
to this point it is hypothesized that a feedback loop,
involving the cerebellum, was allowing the visual system to
predict the size disparity of the two squares and to fuse
the forms into a perception of one square. This belief is
drawn from the model of visual processing previously derived
and shown at Figure 9.
67

Additional support for a predictive feedback loop was
provided by unsolicited reports from the experimental
subjects. In their responses on the post experiment
questionnaire, three students mentioned that if they
happened to blink their eyes while the square was expanding,
then the second inner square would immedia~ely appear.
Follow up questions posed to the other subjects found
several to believe they had also observed the same
phenomena. Others were unsure and could not report
definitely if blinking their eyes had caused the second
square to appear.
The act of blinking one's eyes would disrupt the
continuous predicative feedback loop hypothesized to
maintain binocular form fusion. A disruption in the
feedback loop would then be predicted by the visual
processing model to result in loss of the perceived
singleness of the two disparate squares, a prediction which
is consistent with the results.
The second portion of the experiment, involving a
contracting square, proved to be an inherently difficult
experiment for the subjects to produce consistent data. The
experiment began with the disparity in size of the squares
well beyond an individual's ability to fuse the two forms.
Because of this, binocular rivalry, as discussed earlier,
was present. Rivalry caused the subjects to observe a bi-
stable perception where the smaller square would appear and
disappear. This bi-stable perception would cause the
68
subjects to report fusion of the squares when, in fact,
rivalry had caused the second smaller square to momentarily
disappear. This problem was discovered prior to initiation
of the experiment. To allow for the interference of
rivalry, the contraction of the square was halted and would
then continue after each response. If the smaller square
reappeared the subjects would again respond when the two
squares appeared to become one. By successively responding,
then watching for the second square to reappear, a point
would be reached where the subjects reported the perception
to stabilize as one square contracting. The final response,
where the perception of a single contracting square
stabilized, was taken as the actual point where the size
disparity came within the individual's limit to fuse the
two forms. Though subjects uniformly reported observing
the stabilized perception to occur, the experimental
uncertainty, caused by binocular rivalry, introduced a great
deal of variance in the data collected. In spite of the
problems encountered, the subjects consistently found the
point of perceptual stabilization on a single object to be
significantly lower for the contracting versus the expanding
square. This observation, which will be quantitatively
discussed later, agrees with both the subjective
observations earlier mentioned and the predictions which
would be made based on a visual processing model
incorporating a predictive feedback loop to the binocular
*integrator.
69

As with the expanding square, the color of the
9 stabilized contracting square was always that of the square
which was actually contracting. The focal point was
reported by some subjects to be missing for a short period
of time when the contracting square was first displayed on
the screen at its full size. However, as soon as the square
began to contract the subjects again reported its presence,
even when the color of the square, associated with the
stimulus actually displaying a focal point, was not
observed.
Bi .JIt: At the conclusion of the
experiment, 60 data points had been taken on each subject.
An example of the raw data collected is provided in Appendix
F. Using the Chi-square method of best fit (Nester,
Wasserman and Whitmore 1978, p. 395-402) with alpha = 0.05,
the data collected for each subject was found to fit a
Poispon distribution for both the expanding and contracting
tests. This result was expected since the probability of
data points being less than the size of the stationary
square was zero.
The Mann-Whitley test (Nester, Wasserman and Whitmore
1978, p. 370-375), with alpha = 0.05, was used to examine
the correlation of data from different sample populations.
For eight of ten subjects the data taken from tests where
the colors were different showed a positive correlation. Of
the two which did not display correlation, the data fell
Sslightly beyond the limits with alpha = 0.05, and could be a
70
result of the small samples involved.
When data taken from tests with the
expanding/contracting square in either the left or right eye
were examined, correlation was found for seven of ten
subjects. The subjects whose data did not correlate showed
significant differences in the data taken when each eye
observed the alterations. One of the three had previously
reported to have weak ocular muscles in the left eye. No
direct relation could be found for the lack of correlation
of data taken from the remaining two subjects.
One subject reported after the experiment that he
observed both squares throughout the experiment. For this
reason, his data were not examined for correlation.
Experimental disparities, which corrupted some of the data
points taken from two subjects, left insufficient sample
sizes to conclusively determine the presence of correlation
between data populations.
Table 1 contains the arithmetic means of data samples
taken from the different experimental test cases. Since the
distribution was discovered to be Poisson, the actual limits
of an individual's ability to fuse objects would be slightly
less than those shown. With the limited number of data
elements taken from each test, no attempt was made to
specify the actual limit for each individual. The
observation that, for all twelve subjects, the limit of
fusion was greater when the square expanded, was taken as
sufficient evidence to support the hypothesis. The
71

TABLE 1
Arithmetic Means of Individual's Limits for Binocular Fusion
TESTCONDITIONS EXPERIMENT SUBJECT
DWD SAH RJO GHG REH JEF
Right Eye
Color Test
G-G Inc 12.2 11.3 11.1 9.2 10.1 14.0Dec 7.2 8.0 7.4 7.1 7.2 8.0
R-G Inc 9.8 13.7 8.5 8.7 13.5 11.0Dec 7.0 8.8 7.4 7.0 7.1 8.7
W-W Inc 9.0 9.8 9.5 9.8 12.3 13.2Dec 6.6 8.5 7.2 7.0 6.9 8.5
All Inc 9.7 11.9 9.7 9.2 10.2 13.6Dec 7.0 8.4 7.4 7.0 7.1 8.4
Left Eye
9Color Test
W-W Inc * 10.5 8.1 8.5 10.1 12.4Dec 7.7 6.9 7.1 6.9 7.9
G-W Inc 9.8 8.0 8.4 8.8 11.2Dec 7.6 7.3 7.0 6.8 7.9
G-G Inc 8.7 11.3 9.4 8.5 10.4 13.7Dec 6.6 8.2 .7.2 6.6 7.0 8.2
All Inc 8.7 10.3 8.2 8.5 9.8 12.5Dec 6.7 7.8 7.1 6.9 6.9 8.0
Combined
Inc 9.2 11.0 9.0 8.9 10.0 13.1
Dec 6.8 8.1 7.2 7.0 7.0 8.2
*** During the testing of DWD, the programing
synchronization was temporarily lost. As a result, the data
from the initial tests, with his left eye as the eye of
origin, were not collected.
772

9 TABLE 1 Continued
Arithmetic Means of Individual's Limits for Binocular Fusion
TEST
CONDITIONS EXPERIMENT SUBJECT
TWG DES DAH KNF RDM EWK
Right Eye
Color Test
G-G Inc 10.1 10.8 13.4 13.7 14.7 10.2Dec 8.4 7.2 6.8 7.8 8.0 7.9
R-G Inc 11.0 9.9 12.6 13.7 12.7 10.2Dec 8.3 7.3 6.9 7.5 9.1 7.5
W-W Inc 11.2 10.5 14.2 14.1 15.0 12.0Dec 10.4 7.0 7.0 8.1 10.1 7.9
All Inc 10.8 10.4 13.3 13.8 14.1 10.8Dec 8.9 7.2 6.9 7.8 9.1 7.8
Left Eye
0Color Test
W-W Inc 11.3 9.9 16.0 11.1 15.5 11.3Dec 9.7 7.1 7.1 7.3 8.1 7.5
G-W Inc 9.8 9.4 13.5 10.8 10.1 10.4Dec 6.9 6.6 6.8 7.1 7.4 7.5
G-G Inc 9.4 9.9 15.8 10.5 14.0 10.5Dec 6.8 6.6 6.9 7.3 9.1 8.2
All Inc 10.2 9.7 14.8 10.8 13.2 10.7Dec 7.8 6.7 6.9 7.3' 8.2 7.7
Combined
Inc 10.5 10.1 14.0 12.3 13.7 10.8
Dec 8.3 6.9 6.9 7.5 8.6 7.8
Note: Subject GA reported in the post-experiment interview
that he never lost sight of either square. His data were
thus not tabulated or used in tests for correlation.
73

hypothesis is that perception of a single object can be
maintained by a predicative feedback loop as the retinal
image sizes vary when the retinal images are first perceived
to represent a single ooject. When the square contracted,
and no previous relation was given to the two retinal
images, the limit where the two images fused to a
perception of one object was significantly lower.
In reviewing the results of the experiment at Table 1
it is also evident that the limits of fusion appear to
differ among individuals. The difference in limits among
individuals could be explained for the tests involving
contracting squares by the interference resulting from
binocular rivalry. However, for the tests involving the
expanding squares, interference caused by binocular rivalry
can not explain the individual differences. When the square
expanded, the appearance of a second square was distinct,
with no rivalry present prior to its appearance. Thus the
results from this experiment show that the capability to
fuse forms does vary among individual subjects.
The range of values for the limit of binocular fusion
when the squares expand is from a square size of
approximately 8.9 cm to 14.0 cm. Translated into the ratio
of disparity in image size between retinal images, this
range becomes 1.37 to 2.15. Similarly, the translated range
of limits found for different individuals when the square
contracted is 1.05 to 1.32.
*The data in Table 1 suggest that the normal limit as
74

the square expands is approximately 10 cm. The difference in
* visual angle subtended by the two squares at this limit is
from 3.4 degrees to 5.2 degrees. Assuming the normal limit
as the square contracts to be approximately 7.5 cm, the
difference in visual angle subtended by the two squares at
the limit is from 3.4 degrees to 3.9 degrees.
MAE Ret tg L t in the Visual Field
The thirteen subjects who participated all reported the
observation of MAE produced by the moving vertical square
wave stimulus. The test to determine the stimulus duration
threshold resulted in data with a large degree of variation.
Similarly, data received on the duration of MAE also
showed significant variation. The variation was expected
since, as reported from the literature earlier, reports on
MAE involve a subjective determination by the participants.
An example of the raw data collected from the tests on
each individual is shown in Appendix G. For analysis of the
data related to stimulus durati'on thresholds, the reports
were averaged over a stimulus duration interval of 0.67
seconds. The characteristics of the averages plotted were
then used to draw a best fit curve for each test sample. An
example of this method is shown with the graph in Figure 14,
which plots the raw data contained in Appendix G. This
method was used since there were insufficient data to allow
a more rigorous statistical approach because of the
variation in subjective reports. By using this method the
Sthreshold characteristics for individuals could be
75

% of MAE
Reports
F 100 -
/
75 //
GHG50- position 1
/
25--
0.65 1.30 1.95 2.60Stimulus (sec)Duration
Fig 14. An Example of the Time Interval Method used in
Analyzing the Raw Data from an Individual's Reports in the
Experiment with MAE Thresholds for Stimulus Duration.
76

categorized.
Eleven of the thirteen subjects displayed a family of
threshold curves which were considered "normal." Each of
these individuals' thresholds increased as the location of
the stimulus moved further into his periphery. Four of the
eleven considered normal were further categorized as
"normal-high" since their thresholds were significantly
higher than the other eight. These individuals reported
little if any MAE when the stimulus was positioned off the
center of their visual field. An illustration of the family
of curves for the different categories is shown in Figure
15.
The two remaining subjects were categorized as
displaying "abnormal" families of curves (Figure 15). Both
subjects consistently reported MAE in the center of their
visual field and in their far periphery. However neither
individual observed any MAE when the stimulus was in their
near periphery. No correlation with reported visual defects
could be discovered to explain their variation from the
other eleven participants.
The fact that eleven of the thirteen subjects reported
higher stimulus duration thresholds in their periphery
supports the prediction that the lesser binocular image-size
variation in the periphery would provide less stimulation to
the learning process hypothesized to be involved in the
production of MAE.
To permit comparison of relative thresholds between
77

% ReportsMAE
M11
2
NORMAL
Z1
NORMAL-HIGH
1 3ABNORMAL Stimulus
Duration
Position 1- Pattern Centered in Visual Field.Position 2- Pattern 7.3 degrees off center of Field.Position 3- Pattern 17.1 degrees off center of Field.
Fig 15. An Example of the Family of Stimulus Duration °
S Threshold Curves Associated with each Category.
78

individuals , the point on each estimated curve where
the percentage of reports of MAE equaled 50% was determined.
Once again, because of the small data sample, this method of
analysis can be argued to be statistically weak. However
the justification for using this method is that it
permitted comparative ranking.
Using the methods described for analysis of the
threshold data, and determining the means for duration of
MAE at each position, the results provided in Table 2 were
obtained.
In view of the results in Table 2 certain general
observations can be made. Differences between individuals'
stimulus duration thresholds were significant. In test
cases where some individuals consistently reported MAE with
stimulus durations of one second or less, others would not
report MAE when the stimulus duration was up to 2.7 seconds.
Another observation which can be made is that, for
eight of the thirteen subjects, an increase in their
threshold of MAE in the periphery corresponded with a drop
off in the duration of MAE. Again the small sample size and
the subjective nature of an individual's reports prevent
making any direct correlation between the threshold for MAE
and the duration of MAE.
Correlatin Between Binoular Fusion nd A
Though a lack of knowledge concerning the mechanisms
involved in human learning prevents the prediction of what
correlation there should be between the parameters of
79
b. m-.

TABLE 2
Results of Data from an Experiment on theParameters of MAE as a Function of Location in Visual Field
SUBJECT THRESHOLD DURATION CATEGORY OF(sec) (sec) FAMILY OF CURVES
Position Position
1 2. 3 1 2 3
KNF 0.3 >2.7 >2.7 6.6 ** ** Normal-High
TWG 1.0 1.6 1.6 6.8 6.2 4.0 Normal
GHG 0.8 1.2 2.0 6.3 5.8 4.0 Normal
RJO 1.3 1.5 >2.7 5.2 3.9 2.5 Normal
DWD 0.5 0.7 * 6.5 7.1 7.7 Normal
REH 0.7 0.9 1.2 7.0 8.5 6.1 Normal
GA 0.7 >2.7 >2.7 4.7 ** ** Normal-High
RDM 1.9 >2.7 >2.7 4.5 2.9 ** Normal-High
SAH 0.7 0.8 1.4 5.3 5.0 2.5 Normal
EWK 0.9 2.4 1.6 2.7 3.2 1.9 Normal
DAH 2.7 >2.7 >2.7 3.4 ** ** Normal-High
JEF 2.7 >2.7 1.2 4.9 3.3 1.8 Abnormal
DES 1.3 >2.7 1.3 3.7 ** 4.3 Abnormal
* Individual was tested prior to increasing the random
number maximum from 10 to 20.
•* At least twice the individual reported no MAE.
880

binocular fusion and MAE, the fact that each is hypothesized
to depend on the same predictive feedback loop would
indicate a correlation should exist. Because of this the
results from each experiment were analyzed together to
determine if any correlation could be found between an
individual's ability to fuse objects and his reports of MAE.
On first examination of the data from each of the
experiments, a subjective correlation was observed.
Subjects who tended to have extremely high limits for
binocular fusion also exhibited high stimulus duration
thresholds to produce MAE. An examination of Tables 1 and 2
reveals that of the four subjects whose collective mean
limit for binocular fusion (when the square was expanding)
was greater than 12.0 cm, all were classified as either
"normal-high" or "abnormal" in the experiment with
thresholds for MAE. Of the eight remaining subjects, who
reported lesser limits for binocular fusion, all but one
were classified as "normal" based on their family of curves
in the experiment with thresholds for MAE.
To test for correlation in a more rigorous manner,
Kendall's tau test (Robson 1973, p. 56-60) at the P = 0.05
level was applied to the ranking of individuals by their
collective means for binocular fusion and by their
thresholds at position 2 for MAE. Data related to position
2 in the experiment with thresholds for MAE was used in the
test for correlation since individuals displayed less
variance in their reports at this position. It is believed
81
_i

that since position 2 involved threshold times in the
midrange of the stimulus durations tested, the subjects were
able to better differentiate in subjective reports on the
presence of MAE.
The scattergram and relevant test parameters are shown
in Figure 16. The Kendall tau test provided a positive
correlation between the performance of the participants in
the two experiments.
The correlation discovered provides evidence that the
visual information processes involved in producing binocular
fusion also are involved in the perceptual fault which
results in MAE. Since binocular fusion is hypothesized to
involve a predictive feedback loop to the cortex, and MAE
* are believed to result from a learned cortical response
which eliminates the latency of the feedback loop to provide
fusion, then a correlation between experimental data could
be predicted. However, the exact nature of the correlation
could not be predicted, nor can the correlation discovered
be adequately explained, since the manner in which humans
learn a patterned stimulus is not well defined. The
correlation can be used only to provide further evidence for
the structure of the hypothesized model of visual
information processing (Figure 9).
o
82 .

Rank of/MAEThreshold/
DES AN RQM.EWJV JEF DAH
RJO T~
cGic REH
/ DWWSHRank of Fusion Limit
£ Scattergram of
UBinocular Fusion vs. Position 2 MAE Rankings
Subject S+ s-
GHG 8 0 Tv=O0RJO 7 0DWW 9 2 Th = 5(4)/2= 10REH 7 2DES 0 0 tau = 32/((66-56)1-/ 2 )TWG 5 1EWK 4 1 tau = 32/60.8SAH 4 6KNF 0 0 tau = 0.53JEF 0 0RDM 0 0 For tau > 0.43 the testDAH 0 -provides a positive
44 12 correlation at the
S= 44-2= 32p=0.05 level.
Fig 16. Scattergram and Parameters Relate(, to Kendall t -au
Test for Correlation of Performance Between Limits for
Binocular Fusion and ME Stimulus Thresholds.
83

VI. Colusin a Recommendations
A hypothetical model has been developed to show how
human visual information processing is accomplished. The
model was derived by postulating the existence of processes
based on what were concluded to be essential requirements.
The requirements were determined by the information
manipulation needed to obtain a correct visual perception
from a system which receives visual inputs from two eyes.
The model was designed to specifically address how the
perception of motion and the perception of single objects
could be determined. The ultimate objective was to evaluate
the model developed in this manner, based on its ability to
explain the phenomenon of MAE.
The model developed (Figure 9) attributed visual
processing functions to the gerebellum, lateral geniculate
j nucleus, and cerebral cortex. The cerebellum was
hypothesized to provide a predictive measurement for both
the binocular image size ratio and image displacement to the
area of the cortex performing binocular integration. The
lateral geniculate nucleus (LGN) was attributed with the
function of providing monocular mappings, displaced in time,
as inputs to the same area of the cortex. Then, the cortex
was hypothesized to develop a single fused visual scene by
using the monocular inputs from the LGN and the predictive
5 measurements from the cerebellum. From the fused scene the
84

cortex was further hypothesized to perform the information
processes associated with object identification, computation
of retinal slip velocities associated with objects, and
computations to determine actual motion of an object in the
visual field.
The visual processing model was then compared to known
perceptions induced by controlled stimuli. Specifically, the
model was examined to determine its effectiveness in the
perceptions involved in uniform motion and MAE.
Perceptions of single objects from images moving across
the retina were hypothesized to depend on a predictive
feedback loop to the cortex which permits compensation for
image-size variation and imaCe displacement. By so
compensating, the cortex could thus determine single objects
from separate monocular irputs which involve disparity:
MAE were concluded to be caused when the cortex learned
a response pattern and thus no longer required the
predictive feedback provided by the cerebellum. The basis
for the functional relationship between the cerebellum and
cortex was associated with their similarly hypothesized
roles in muscle coordination activities (Guyton 1976) and
recent micro-electrode exi~eriments investigating the
cerebellum (Kase et al. 1975). It was concluded that the
role of the cerebellum proposed in the model was consistent
with previously published findings and could provide an
explanation for MAE observed over 24 hours after the
*adaptation to a stimulus.
85
-•- .. . .~ - - -

The function of the LGN to provide successive monocular
inputs separated in time was based on the need for
information from successive frames to permit motion
detection and the suitability of the known physical nature
of the LGN to this func-ion. Though no experimental
evidence was provided, it was concluded that this hypothesis
shows no disagreement with neurological studies of the LGN
(Tat So and Shapley 1981). These studies have shown that
little or no processing is performed by the LGN. However,
since these studies involved single micro-electrode
investigations, the time relationship of differing layers of
the LGN mappings would not have been clearly evident.
Functions attributed to the cortex were inferred from
previous studies and requirements for visual information
processes developed from an investigation of the properties
of the monocular retinal inputs which lead to perception.
No experimental evidence was collected to strengthen the
hypothetical processes hypothesized to be performed within
the cortex.
In an experiment which measured an individual's ability
to fuse objects presented separately to each eye, two
separate limits were discovered. Separate images will
continue to be perceived as one object, with a larger image
size disparity limit, if they are initially seen as
representing one object. The range of image-size, taken
from data collected on twelve subjects, was discovered to be
from 1.37 to 2.15 for the case when the images were first
86
AD-A124 842 A ECOEL FOR H.MAN VISUAL PROCESSING WHICH EXPLAINS /hPFRCEPT IONS OF IITIWI-. tIll AIR FORCE INST OF TECHWRIGHT-PATTERSON AFA ON SCHOOL OF EI.. A L CARTER
UNCLASSIFIlED DEC 82 AFITIOEIEE1820-23 0 S 5/10 ML
11111111i IIMW
- 1.8
11111 L.
MICROCOPY RESOLUTION TEST CHARTNATIONAL BUREAU OF STANAROS - 1963 - A

associated to a single object. With no prior association of
the images, the same subjects displayed ratio limits from
1.05 to 1.32. The existence of the two separate limits
provides evidence for the predictive feedback loop
hypothesized to be used in the integration of the monocular
inputs.
In the same experiment, further evidence was provided
to support the hypothesis of a feedback loop. In post-
experiment interviews, the subjects reported that blinking
their eyes during the tests would immediately result in
double-vision (the object in each eye being observed
simultaneously). Since the act of blinking one's eyes would
disturb the continuity of the predictions, this result is
consistent with the existence of a predictive feedback loop
used in binocular integration.
The experiment was conducted using different contrast
levels in the presentations to the two eyes. Subjectively
the difference in contrast was concluded not to interfere
with the ability to fuse the forms presented. During the
experiment, different colors were associated with squares
seen by each eye. Correlation tests at alpha = 0.05 showed
no apparent difference in sample populations of experimental
tests taken with different colors. When the image variation
was located in either the left or right eye, three of twelve
subjects displayed a distinct difference in the fusion
limits obtained. The remaining subjects displayed no
significant difference at alpha =0.05 in thelL fusion limits
87

when the eye of origin for variation was changed.
From similar perceptions reported by twelve of the
thirteen subjects, certain properties of binocular
integration were concluded. Since the subjects reported the
presence of a focal point when it was not displayed to the
eye from which they were simultaneously reporting the color
and size of the square, it was concluded that binocular
integration could involve the inclusion of all forms given
importance. In this manner, forms, or objects, observed in
only one monocular scene could be integrated into a visual
perception which selectively builds a view of the entire
visual field. Additional support for this conclusion was
taken from the fact that the same subjects also reported to
observe the color of the fused forms to always be that of
the square which was varyi ,g in size. In this case the
motion of the boundary from one of the monocular inputs
allowed the system to stabilize on its associated color.
Binocular rivalry could not satisfactorily explain this
observation since perception of the focal point would remain
though it was on the opposite screen within a square whose
color was not observed.
In a second experiment the stimulus duration threshold
of MAE and the duration of MAE were both examined as a
function of the location of the stimulus in the visual
field. Since the hypothesized model explained MAE as being
related to the learning of a uniform pattern of image-size
and image displacement variation, it was predicted that the
88
threshold for MAE would drop off in the periphery where less
variation occurs.
The results of the experiment, for stimulus duration
thresholds, showed eleven of the thirteen subjects displayed
a family of threshold curves which matched the results
predicted. Though the thresholds determined varied between
individuals, each of the eleven subjects evidenced a larger
threshold as the stimulus was moved further into their
periphery.
Since binocular fusion and MAE were hypothesized to
both be dependent on the same physical mechanisms, it was
predicted that a correlation would exist.between an
individual's ability to fuse forms and his thresholds for
MAE. The exact correspondence could not be predicted
because of a lack of a well-defined model for how a pattern
is learned. When the ranking of an individual's performance
was compared with the Kendell tau test at the P = 0.05
level, a positive correlation was found. Subjects with high
limits for fusion also displayed high stimulus duration
thresholds for MAE. The correlation provides evidence that
binocular fusion and MAE do depend on similar mechanisms.
In regard to the visual processing model presented,
correlation of the data from the two experiments provides
further evidence for the role assigned to a predictive
feedback loop.
Recommendations
I To provide a better data base for statistical analysis,
89
- 0

it is recommended that the experiment with the stimulus
duration thresholds for MAE be expanded. The 20 data points
accumulated at each stimulus location did not permit a truly
rigorous approach to determining the threshold of an
individual. Less variation in an individual's reports of MAE
might be obtained by increasing the range of stimulus
durations presented. In the experiment performed, less
variation was observed if an individual's threshold was in
the mid-range of the durations tested.
For future attempts to determine the limits of form
fusion, it would be beneficial if the eye of origin, for the
object varying in size, could be a random selection. The use
of two micro-processors without a communication link did not
permit random selection for eye of origin in the experiment
performed. Random selection of eye of origin could provide
a better test for correlation of data between the two sample
populations.
The subjective evaluation that fusion was independent
of contrast, above the individual's contrast threshold,
should be explored. If this fact is true, then it would
give evidence for binocular fusion based solely on detection
of form boundaries.
Though correlation between data from the two
experiments was used to support the existence of a
predictive feedback loop, the association of the cerebellum
to the feedback loop was not estabjished. A definitive
experiment on this hypothesis remains to be conducted with
90

subjects who have known deficiencies in the functioning of
their cerebellum. Similar studies to determine the
relationship of the cerebellum to muscle coordination have
been conducted (Guyton 1976).
The hypothesis that the LGN provides separate monocular
mappings displaced in time could be tested by micro-
electrode experiments determining the firing rate
characteristics of neurons in different layers of the LGN.
Neurons in different layers, whose firing rates can be
associated with a controlled stimulus, should exhibit a time
delay relationship if the hypothesis is true.
In the development of the visual processing model it
was hypothesized that the system compensates for physically
induced retinal slip velocities. It was further stated that
this compensation must be conducted based on a given
reference plane. The reference plane hypothesized was the
plane containing the fixation points. One experimental
proposal to test this hypothesis would be to set an
individual in a rotating chair with a fixation point at a
constant distance which rotated with the chair, As the
chair and fixation point are rotated at a known velocity the
subject would then be required to report on the motion of
objects at different distances in the visual field. If the
hypothesis is correct, the accuracy of an individual's
ability to report motion should be directly related to the
distance the object is from the plane of the fixation
*. point.
91
.-.- . . -

Project Summary
The hypothetical model presented in Figure 9 exhibits
numerous process relationships not previously reported. Yet
the requirements to form perception from binocular vision
seem to imply that either the process relationships
presented or related processes must exist. A review of the
results of previous studies of visual information processing
does not show serious conflict with the process
relationships hypothesized. However, this model does differ
significantly in the viewpoint taken in drawing conclusions
from some of the results of previous studies.
If importance is to be attributed to this model, that
importance derives from its difference in viewpoint rather
)than its exactness in describing the full range of human
visual perceptions. In fact, the development of the model
in Figure 9 was limited in scope to a high level processing
view of a system involved with perception of moving objects.
The tests provided were limited to those associated with the
hypothetical relationship of a predictive feedback loop to
binocular integration. Further tests of the validity of the
proposed model are left to future studies and experiments.
?2
02
• • m •

Prie Summary
0 The hypothetical model presented in Figure 9 exhibits
numerous process relationships not previously reported. Yet
the requirements to form perception from binocular vision
seem to imply that either the process relationships
presented or related processes must exist. A review of the
results of previous studies of visual information processing
does not show serious conflict with the process
relationships hypothesized. However, this model does differ
significantly in the viewpoint taken in drawing conclusions
from some of the results of previous studies.
If importance is to be attributed to this model, that
importance derives from its difference in viewpoint rather
) than its exactness in describing the full range of human
visual perceptions. In fact, the development of the model
in Figure 9 was limited in scope to a high level processing
view of a system involved with perception of moving objects.
The tests provided were limited to those associated with the
hypothetical relationship of a predictive feedback loop to
binocular integration. Further tests of the validity of the
proposed model are left to future studies and experiments.
92
92
- * - - nu-nn- -nu-- - - - -I, n II

BiQr
Banks, M. S.; Asliu, R. N.; and Letson R. R. 1975.Sensitive period for the development of human binocularvision. Science 190:675-77.
Banks, W. P. and Kane, D. A. 1972. Discontinuity of seenmotion reduces the visual motion aftereffect. Perception &Psychophysics 12:69-72.
Benson, A. J. and Reason, J. T. 1966. Individualdifferences in after-effects of apparent motion. PartII: Judgement of exponentially decaying signals,impulsiveness, and motion sickness susceptibility.Flying Personnel Research Committee unclassified report226b.
Blake, R. and Camisa, J. 1978. Binocular vision alwaysmonocular? Science 200:1497-99.
Blake, R. and Cormack, R. H. 1979. Psychophysical evidencefor a monocular visual cortex in stereoblind humans.Science 203:274-75.
Braddick, 0. 1974. A short-range process in apparentmotion. Vision Res. 14:519-527.
Burt, P. and Julesz B. 1980. A disparity gradient limitfor binocular fusion. Science 208:615-17.
Cohn, T. E. and Lasley, D. J. 1976. Binocular vision: Twopossible central interactions between signals from twoeyes. Science 192:561-63.
Favreau, 0. E.; Emerson, V. F.; and Corballis, M. C. 1972.Motion perception: A color-contingent aftereffect.Science 176:78-79.
Favreau, 0. E. and Corballis, M. C. 1976. Negativeaftereffects in visual perception. Sci Amer 235:42-48.,
Freeman, R. D. and Bonds, A. B. 1979. Cortical plasticityin monocularly deprived immobilized kittens depends on eyemovement. Science 206:1093-95.
Grimson, W. E. L. 1980. A computer implementation of atheory of human stereo vision. MIT ArtificialIntelligence Laboratory memo 565.
Guyton, A. C. 1976. The textbook of medical physiology.5th ed. Philadelphia: W. B. Saunders Co.
Hepler, N. 1968. Color: A motion-contingent aftereffect.Science 162:376-77.
93
* -. -. . ..-- - - - - -.

Hubel, D. H. and Wiesel, T. N. 1959. Receptive fields ofsingle neurons in the cat's striate cortex. J. Physiol.148: 574-591.
Johansson, G. 1975. Visual motion perception. Sci Amer232:76-88.
Kase, M.; Miller, D. C.; and Noda, H. 1980. Discharges ofpurkinje cells and mossy fibres in the cerebellar vermisof the monkey during saccadic eye movements and fixation.J. Physiol. 300:539-55.
Kase, M. et al. 1979. Target velocity signals of visualtracking in vermal purkinje cells of the monkey.Science 205:717-20.
Kertesz, A. E. and Jones R. W. 1970. Human cyclofusionalresponse. Vision Res. 10:891-96.
Levi, D. M.; Harworth R. S.; and Smith III, E. L. 1979.Humans deprived of normal binocular vision have binocularinteractions tuned to size and orientation. Science206:852-54.
Levinson, E. and Sekuler, R. 1976. Adaptation altersperceived direction of motion. Vision Res. 16:779-81.
Lisberger, S. G. and Fuchs, A. P. 1978. Role of primateflocculus during rapid behavioral modification ofvestibulocular reflex. I. Purkinje cell activityduring visually guided horizontal smooth-pursuit eyemovementa and passive head rotation. J. Neurophysiol.41:733-63.
Marshak, W. and Sekuler, R. 1979. Mutual repulsion betweenmoving visual targets. Science 305:1399-401.
Masland, R. H. 1969. Visual motion perception:Experimental modification. Science 165:819-21.
McIlwain, J. T. and Fields, H. L. 1970. Superiorcolliculus: Single unit responses to stimulation of visualcortex in the cat. Science 170:1426-28.
McKenzie, R. E. and Hartman, B. 1961. The effects of size,speed, and inspection time on the duration of the spiralaftereffect. School of Aerospace Medicine, USAF AerospaceMedical Center unclassified report 62-13.
Nester J.; Wasserman W.; and Whitmore G.A. 1978. Appliedstatistics. Boston: Allyn and Bacon, Inc.
O'Shea, R. P. and Crassini, B. 1981. Interocular transferof motion after-effect is not reduced by binocular
94
rivalry. Vision Res. 21:801-804.
Packwood, J. and Gordon, B. 1975. Stereopsis in normaldomestic cat, siamese cat, and cat raised with alternatingmonocular occulsion. J. Neurophysiol. 38:1485-98.
Pantle, A. and Picciano, L. 1976. A multistable movementdisplay: Evidence for two separate motion systems inhuman vision. Science 193:500-502.
Regan, D.; Beverley, K.; and Cynader, M. 1979. The visualperception of motion in depth. Sci. Amer. 241:136-51.
Richards, W. 1970. Stereopsis and stereoblindness. Exp.Brain Res. 10:380-88.
Riggs, L. A. and Day, R. H. 1980. Visual aftereffectsderived from inspection of orthogonally moving patterns.Science 208:416-18.
Robinson, D. L. and Wurtz, R. H. 1976 Use of anextraretinal signal by monkey superior colliculus neuronsto distinguish real from self-induced stimulus movement.Armed Forces Radiobiology Research Institute report #SR76-28.
Robinson, D. L. and Goldberg, M. E. 1977. Visualmechanisms underlying gaze: Function of the superiorcolliculous. Vol.1, Elsevier/North-Holland: BiomedicalPress.
Robson, C. 1973. Experiment, design and statistics inpsychology. Baltimore: Penguin Books Inc.
Ross, J. 1976. The resources of binocular perception.Sci. Amer. 234: 80-86.
Sekuler, R. and Pantle, A. 1967. A model for after-effectsof seen movement. Vision Res. 7:427-39.
Shipley, T. and Rawlings, S. C. 1970. The nonius horopterI. History and theory. Vision Res. 10:1225-62.
Steinbach, M. J. 1976. Pursuing the perceptual rather thanthe retinal stimulus. Vision Res. 16:1371-76.
Suzuki, D. A.; Noda, H.; and Kase, M. 1981. Visual andpursuit eye movement: Related activity in posteriorvermis of monkey cerebellum. J. Neurophysiol. 46:1120-39.
Tat So, Y. and Shap'ey, R. 1981. Spatial tuning of cellsin and a aund ] eral geniculate nucleus of the cat: Xand Y re..y c( is and perigeniculate interneurons. J.Neurophysi ... 45:107-120.
95
II • -- . • -- __ i4

Tolhurst, D. J. and Hart, G. 1972. A psychophysicalinvestigation of the effects of controlled eye movementson the movement detectors of the human visual system.Vision Res. 12:1441-46.
Tyler, C. W. 1973. Stereoscopic vision: Corticallimitations and a disparity scaling effect. Science181:276-78.
Tyler, C. W. 1975. Spatial organization of binoculardisparity sensitivity. Vision Res. 15:583-90.
Weisstein, N.; Maguire, W.; and Berbaum, K. 1977. Aphantom-motion aftereffect. Science 198:955-57.
9
96

Programs to Support anExperiment on the Limits of Binocular Fusion
The following program listing was executed on a TRS-80Color Computer with 32K RAM and Extended Basic. The purposeof the program was to present interactive commands andvisual stimulus scenes in support of a dichopticallydisplayed experiment with the limits of human binocularfusion.
Program Parameters:PT = Random Variable determining
presence of the Focal PointT = Determines color of SquareNR = Current test numberFL = Fusion LimitCR$ = Color of Square on CromemcoTR$ = Color of Square on TRS-80F$ = Presence of Focal PointST$ = Test Conditions
10 PRINT#-2," TEST# CROMEMCO TRS-80 FOCAL POINTCONDITIONS SIZE"
20 FOR I=1 TO 3: PRINT#-2,CHR$(10: NEXT I30 PT=5: T= 0: NR= 140 SCREEN 0,0: CLS50 PRINT@96, "IN THIS PART OF THE EXPERIMENT"60 PRINT@128,"YOU WILL NEED TO CENTER A SOLID"70 PRINT@160,"SQUARE WITHIN A FRAME BY ADJUST-"80 PRINT@192,"ING THE MIRROR. AFTER EACH"90 PRINT@224,"ADJUSTMENT PRESS BOTH THE CONTROL ON THE
3 TRS AND A <SPACE>100 PRINT@288,"FOLLOWED BY ANY LETTER ON THE CROMEMCO."110 PRINT@384," PRESS CONTROL TO CONTINUE."120 GOSUB 1280: GOSUB 1330: GOSUB 1390130 GOSUB 1280: GOSUB 1330: GOSUB 1480140 GOSUB 1280: GOSUB 1330150 SCREEN 0,0: CLS160 PRINT@128,"YOU WILL NOW START THE LEARN-"170 PRINT@160,"ING PHASE. REMEMBER TO FOCUS ON"180 PRINT@192,"THE BLACK DOT. HERE'S AN EXAMPLE"190 PRINT@224,"OF WHAT YOU WILL SEE."200 GOSUB 1230: GOSUB 1570: 1910: GOSUB 1230210 SCREEN 0,0: CLS220 PRINT@64," WE WILL START BY"230 PRINT@96," EXPANDING THE SQUARE."240 GOSUB 1970250 SCREEN 0,0: CLS260 PRINT@64," DID YOU SEE THE"270 PRINT@96," SECOND SQUARE APPEAR?"280 PRINT@416," WATCH AGAIN!"
97

290 GOSUB 1970300 SCREEN 0,0: CLS310 PRINT@64," THIS TIME PRESS THE"320 PRINT@96," CONTROL WHEN THE SECOND"330 PRINT@128," SQUARE APPEARS."340 GOSUB 1970350 SCREEN 0,0: CLS360 PRINT@64," YOU'VE GOT IT!"370 GOSUB 1230: CLS380 PRINT@96, "NOW YOU WILL GET A CHANCE TO SEE"390 PRINT@128, "WHAT HAPPENS WHEN THE SQUARE"400 PRINT@160, "SHRINKS."410 PRINT@192, "TAKE A LOOK!"420 GOSUB 2080430 SCREEN 0,0: CLS440 PRINT@64, "DID YOU SEE THE SQUARES"450 PRINT@96, "BECOME ONE SINGLE SQUARE?"460 PRINT@416, "WATCH AGAIN!"470 GOSUB 2080480 SCREEN 0,0: CLS490 PRINT @64, "THIS TIME STOP IT BY PRESS-"500 PRINT@96, "ING THE CONTROL WHEN YOU"510 PRINT@128, "THINK THEY FUSE TO ONE."520 GOSUB 2080530 SCREEN 0,0: CLS540 PRINT@64, "DID THE OTHER SQUARE"550 PRINT@96, "REAPPEAR IMMEDIATELY?"560 PRINT@416, "TRY AGAINI"570 GOSUB 2080580 SCREEN 0,0: CLS590 PRINT@64, "NOW IF THE 2ND SQUARE REAPPEARS"600 PRINT@128, "-THEN WAIT TILL IT BEGINS TO"610 PRINT@160, "SHRINK AND STOP IT AGAIN."620 PRINT@224, "-CONTINUE UNTIL THE 2ND SQUARE"630 PRINT@256, "NO LONGER REAPPEARS AFTER YOU HALT
IT."640 GOSUB 1230650 GOSUB 2080660 CLS670 PRINT@64, "THIS IS HOW THE TESTS WILL"680 PRINT@96, "BE TAKEN SO TRYIT A FEW"690 PRINT@128, "MORE TIMES."700 PRINT@192, "REMEMBER TO KEEP STOPPING IT"710 PRINT@224, "UNTIL THE 2ND SQUARE NO LONGER"720 PRINT@256, "REAPPEARS!"730 FOR H=l TO 3740 GOSUB 2080750 NEXT H760 SCREEN P,0: CLS770 PRINT@64, "GREAT!! I THINK YOU'VE GOT IT."780 GOSUB 1280: GOSUB 1280: CLS790 PRINT@64, "THE TEST PHASE WILL NOW BEGIN."5 800 PRINT@128, "DON'T WORRY YOU ARE DOING FINE."810 GOSUB 1230: CLS
98

820 PRINT@64, "FOR THE FOLLOWING TESTS USE THE"* 830 PRINT@96, "CONTROL TO INDICATE WHEN THE"
840 PRINT@128, "SQUARES BECOME ONE, WHEN CONTRACTING,
OR TWO SQUARES"841 PRINT@192, "APPEAR WHEN EXPANDING."850 TR$= "GREEN": CR$= "GREEN"860 FOR M= 1 TO 5870 PT=RND(10): GOSUB 1970: ST$= "TRS-INC": GOSUB 2180880 PT=RND(10): GOSUB 2080: ST$= "TRS-DEC": GOSUB 2180890 NEXT M900 SCREEN 0,0: CLS901 PRINT@96, "DID YOU REMEMBER TO KEEP YOU EYES
FIXED ON THE FOCAL POINT?"902 GOSUB 1230: CLS910 PRINT@96, "PRESS <SPACE> ON THE CROMEMCO
FOLLOWED BY ANY LETTER."920 GOSUB 1230: CR$= "RED"930 FOR M= 1 TO 5940 PT=RND(10): GOSUB 1970: ST$= "TRS-INC": GOSUB 2180950 PT=RND(10): GOSUB 2080: ST$= "TRS-DEC": GOSUB 2180960 NEXT M970 SCREEN 0,0: CLS971 PRINT@96, "REMEMBER--LOOK FOR THE 2ND SQUARE
AS IT EXPANDS AND TRY TO"972 PRINT@160, "KEEP THE 2ND FROM REAPPEARING
WHEN IT CONTRACTS."" 973 GOSUB 1230: CLS
974 PRINT@96, "DON'T FORGET TO KEEP YOUR EYES ONTHE FOCAL POINT."
975 PRINT@224, "YOU ARE DOING FINE--KEEP UP THEGOOD WORK!"
976 GOSUB 1230: CLS980 PRINT@96, "PRESS <SPACE> ON THE CROMEMCO
FOLLOWED BY ANY LETTER."990 GOSUB 1230: CR$="WHITE": *TR$= "WHITE": T=I1000 FOR M=l TO 51010 PT=RND(10): GOSUB 1970: ST$= "TRS-INC": GOSUB 21801020 PT-RND(10): GOSUB 2080: ST$= "TRS-DEC": GOSUB 21801030 NEXT M1040 SCREEN 0,0: CLS1050 PRINT@128, "YOU'RE GOING DOWN THE HOME STRETCH
NOW!!"1060 GOSUB 1230: CLS1070 PRINT@96, "FROM NOW ON YOU WILL NEED TO USE
THE <SPACE> ON THE"1080 PRINT@160," "CROMEMCO TO STOP THE
EXPANDING/CONTRACTING"1090 PRINT@224, "SQUARE."1100 GOSUB 1230: CLS1110 PRINT@128, "REMEMBER TO PRESS ANY LETTER ON
THE CROMEMCO EACH TIME"1120 PRINT@192, "AFTER PRESSING THE <SPACE>!!"1130 GOSUB 1230: CLS1140 PRINT@128, "PRESS <SPACE> FOLLOWED BY ANY
99
-owA

LETTER ON THE CROMEMCO TO"O 1150 PRINT@192, "CONTINUE."
1160 GOSUB 1230: T=I:GOSUB 1570: GOSUB 1910: GOSUB 13301170 T=0: GOSUB 1570: GOSUB 19101180 GOTO 11801190 '*********SUBROUTINES*********12001210 ' DELAY FOR 7 SECONDS12201230 FOR I=l TO 3400: NEXT I1240 RETURN12501260 ' PAUSE FOR 2 SECONDS12701280 FOR I=l TO 975: NEXT I
1290 RETURN13001310 WAIT FOR CONTROL BUTTON13201330 B = PEEK(65280)1340 IF B <> 254 THEN 13301350 RETURN13601370 ' DRAW SQUARE FRAME & WAIT13801390 PMODE 4,11400 SCREEN 1,0: PCLS1410 LINE (84,52)-(172,140),PSET,B1420 B= PEEK(65280)1430 IF B 0 254 THEN 14201440 RETURN14501460 ' DRAW SOLID SQ. & WAIT14701480 PMODE 4,11490 SCREEN 1,0: PCLS1500 LINE (78,46)-(178,146) ,PSET,BF1510 B= PEEK(65280)1520 IF B <> 254 THEN 1510
1530 RETURN15401550 ' DRAW SMALL TEST SQUARE15601570 PMODE 4,11580 SCREEN 1,T: PCLS1590 LINE (87,63)=(169,129) ,PSET,BF1600 RETURN16101620 ' DRAW LARGE TEST SQUARE16301640 PMODE 4,11650 SCREEN 1,T: PCLS3 1660 LINE (24,0)-(232,192),PSET,BF1670 RETURN
100
m •mmmmmmmmm mmm - - m mmmm(m mm mmm i ml m m

1680* 1690 'CONTRACT SQ. & PAUSE ON CONTROL. RETAIN SIZE OF
SQUARE ON LAST PAUSE (FL).17001710 FOR I=0 TO 631720 LINE (24+I,0+I)-(232-I,192-I),PRESET,B1730 FOR J=l TO 51740 B= PEEK(65280): IF B =254 THEN 17701750 NEXT I1760 GOSUB 1280: PCLS : RETURN1770 FL=64-I: FOR K=1 TO 450: NEXT I: GOTO 172017801790 ' EXPAND SQ. UNTIL CONTROL. RETAIN SIZE OF SQ. WHEN
HALTED (FL).18001810 FOR I=0 TO 631820 LINE (87-I,63-I)-(169+I,129+I),PSET,B1830 FOR J=l TO 51840 B= PEEK(65280): IF B=254 THEN 18601850 NEXT I1860 FL=I: FOR I=l TO 975: NEXT I1870 PCLS: RETURN1880 '1890 ' DRAW FOCAL POINT19001910 LINE (127,95)-(129,97) ,PRESET,BF1920 RETURN19301940 EXPAND SQUARE TILL CONTROL. FOCAL PT ON TRS-80 AT
RANDOM.1950 ' OUTPUT: FL= FUSON LIMIT19601970 GOSUB 1230:1980 GOSUB 15701990 IF PT < 5 THEN 20102000 GOSUB 19102010 GOSUB 12802020 GOSUB 18102030 RETURN20402050 ' CONTRACT PAUSING FOR CONTROL. FOCAL PT ON TRS-80 AT
RANDOM.2060 ' OUTPUT: FL = FUSION LIMIT20702080 GOSUB 12302090 GOSUB 16402100 IF PT <5 THEN 21202110 GOSUB 19102120 GOSUB 12802130 GOSUB 17102140 RETURN21502160 ' PRINT TEST RESULTS
101
....... ------------.
2180 X$= "2190 IF PT > 4 THEN 22202200 F$= " NO"2210 GOTO 22302220 F$= "YES"2230 PRINT#-2, N NR " "CR$ " "X$ TR$ " "F
X$ " "ST$ X$ FL2240 PRINT#-2, CHR$(10)2250 NR= NR+1: FL= 0: RETURN
1
102

The following program is written in Fortran IV and wasexecuted on a Cromemco Z-2D with two 48K video memory boardsand a video digital-to-analog board. The software available
in the Cromemco SDI video library was also used inprogramming. The purpose of the program was to provideinteractive commands and video stimulus displays in supportof a psycho-physical experiment on the limits of humanbinocular vision.
Program Parameters:Jcolor = Color of SquareNbr = Current test numberJsize = Value of loop parameter
when Square haltedSize = Size of Square in
centimeters
Trs = State of TRS-80 displayKstate = Test conditions
PROGRAM Fusion.for
Cdimension i(9)
data i(l),i(2),i(3),i(4),i(5)/4,119,50,119,190/data i(6),i(7),i(8),i(9)/259,190,259,50/
Cwrite (2,10)
10 format (/,' TEST# CROMEMCO TRS-80FOCAL POINT',
1' CONDITIONS SIZE',//)C
call grafixcall nit
CC Declare background as black and define colors.C
call defclr (0,0,0,0)call defclr (1,15,0,0)call defclr (2,15,15,15)call defclr (3,4,15,0)
CC Draw solid square to center the dichoptic scene.C
call xarea (139,70,239,170,3)call wait
CC Draw square frame to center the dichoptic scene.C
call xarea (139,70,239,170,0)call xpoly (3,i)call wait
*C
103

C Draw small green test squares to support TRS-809C phase of experiment.C
call testsq (3)call waitcall testsq (1)call waitcall testsq (2)call wait
CC Perform test sequences.C
nbr= 1call seq (2,.true.,nbr)call seq (3,.true.,nbr)call xarea (0,0,378,240,3)call1 xt e xt (20,60,O,'PRESS CONTROL BEFORE
CONTINUING. .')call delaycall seq (3,.false.,nbr)call xtext (20,2O,0,'CONGRATULATIONS1^')call xtext (20,60,0,'YOr.VRE FINISHED!HV')END
CCC SUBROUTINESC
*CC Subroutine SEQ alternately performs tests onC expansion and contraction.C Input: jcolor= Specified colorC
Subroutine SEQ (jcolor,trs,nbr)do 100 j=1,5
call xarea (0,0,378,240,0)call delaycall testsq (jcolor)call intercall expand (jcolor,nbr,trs)call xarea (0,0,378,240,0)call delaycall contr (jcolor,nbr,trs)
100 continuereturnend
CC Subroutine TESTSQ draws a square with a focal pointC for the experimental phase.C Input: Jcolor- Color of the square.C
Subroutine TESTSQ (jcolor)call xarea (0,0,378,240,0)3 call xarea (139,80,239,160,jcolor)
104
* -,-..A

C Draw small green test squares to support TRS-80C phase of experiment.C
call testsq (3)call waitcall testsq (1)call waitcall testsq (2)call wait
CC Perform test sequences.C
nbr= 1call seq (2,.true.,nbr)call seq (3,.true.,nbr)call xarea (0,0,378,240,3)call xtext (20,60,0,'PRESS CONTROL BEFORE
CONTINUING.")call delaycall seq (3,.false.,nbr)call xtext (20,20,0,'CONGRATULATIONSV ^')call xtext (20,60,0,'YOU'RE FINISHED!II ^')END
CCC * SUBROUTINES *
*C4C
C Subroutine SEQ alternately performs tests onC expansion and contraction.C Input: jcolor= Specified colorC
Subroutine SEQ (jcolor,trs,nbr)do 100 j=l,5
call xarea (0,0,378,240,0)call delaycall testsq (jcolor)call intercall expand (jcolor,nbr,trs)call xarea (0,0,378,240,0)call delaycall contr (jcolor,nbr,trs)
100 continuereturnend
CC Subroutine TESTSQ draws a square with a focal pointC for the experimental phase.C Input: Jcolor- Color of the square.C
Subroutine TESTSQ (jcolor)call xarea (0,0,378,240,0)3call xarea (139,80,239,160,jcolor)
104
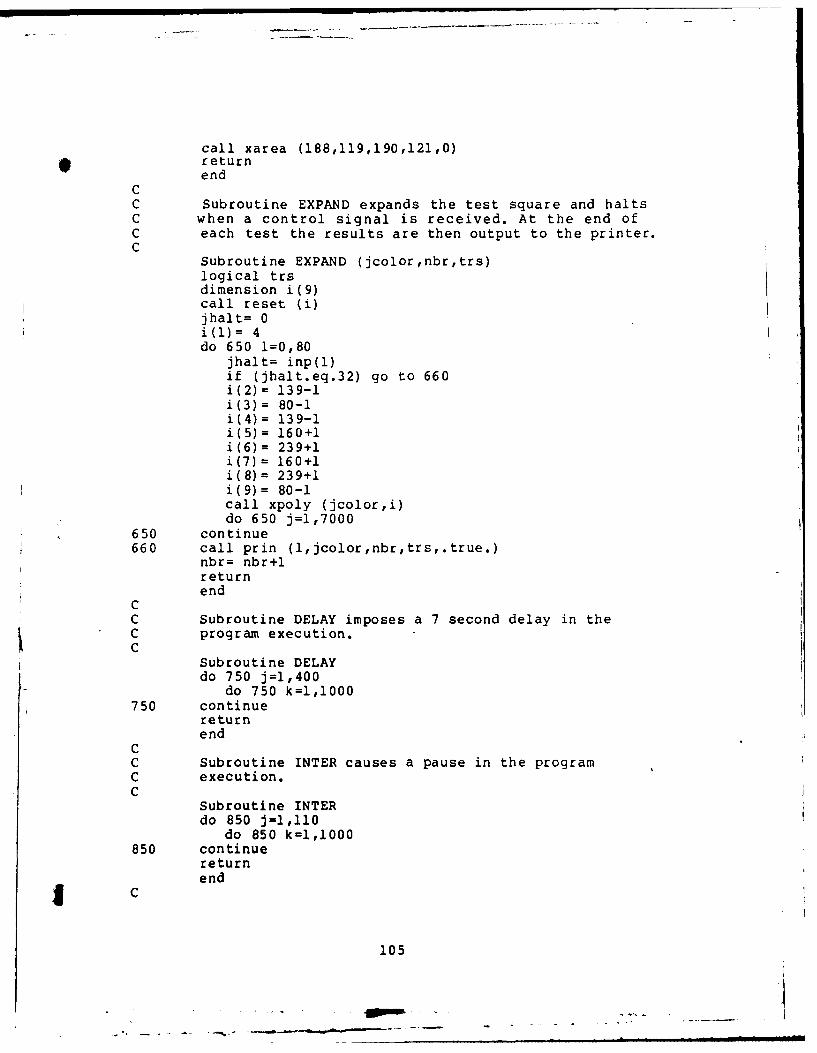
call xarea (188,119,190,121,0)returnend
CC Subroutine EXPAND expands the test square and haltsC when a control signal is received. At the end ofC each test the results are then output to the printer.C
Subroutine EXPAND (jcolor,nbr,trs)logical trsdimension i(9)call reset (i)jhalt= 0i(l)= 4do 650 1=0,80
jhalt= inp(l)if (jhalt.eq.32) go to 660i(2)= 139-1i(3)= 80-1i(4)= 139-1i(5)= 160+1i(6)= 239+1i(7)= 160+1i(8)= 239+1i(9)= 80-1call xpoly (jcolor,i)do 650 j=1,7000
650 continue660 call prin (l,jcolor,nbr,trs,.true.)
nbr= nbr+1returnend
CC Subroutine DELAY imposes a 7 second delay in theC program execution.C
Subroutine DELAYdo 750 j=l,400
do 750 k=1,1000750 continue
returnend
CC Subroutine INTER causes a pause in the programC execution.C
Subroutine INTERdo 850 j=l,ll0
do 850 k=l,1000850 continue
returnend
*C
105
m. .m m mawm m~mm m mm mlnmlmwwwwIm l

C Subroutine PRIN prints out the results of the testC just completed.C
Subroutine Prin (jsize,jcolor,nbr,trs,kstate)logical trs,kstateif (jcolor.eq.2) go to 890if (trs.and.kstate) write (2,910) nbr,jsizeif (trs.and..not.kstate) write (2,915) nbr,jsizeif (.not.trs.and.kstate) write (2,920) nbr,jsizeif (.not.trs.and..not.kstate) write (2,925) nbr,jsizego to 990
890 if (kstate) write (2,900) nbr,jsizeif (.not.kstate) write (2,905) nbr,jsize
900 format ( ',i4,' WHITE WHITE YES',1 CRO-INC ,i4)
905 format (I ',i4,' WHITE WHITE YES',1 I CRO-DEC 1,i4)
910 format ( ',i4,' GREEN WHITE YES',1 CRO-INC 1,i4)
915 format ( ',i4,' GREEN WHITE YES',1 CRO-DEC ',i4)
920 format ( ',i4,' GREEN GREEN YES',1 CRO-INC 1,i4)
925 format ( 1 ,i4,' GREEN GREEN YES',1 CRO-DEC ,i4)
990 returnend
CC Subroutine WAIT waits for the control button to beC pressed after initially pausing to protect itselfC from previous calls.C
Subroutine WAITdo 1050 j=1,200
do 1050 k=l,10001050 continue
jcont= 01060 jcont= inp(l)
if (jcont.ne.32) go to 1060returnend
CC Subroutine RESET resets the values of the i-array toC the dimensions of the small experimental square.C
Subroutine RESET (i)dimension i(9)i(2)= 139i(3)= 80i(4)= 139i(5)= 160i(6)= 239i(7)= 160i(8)= 239
106
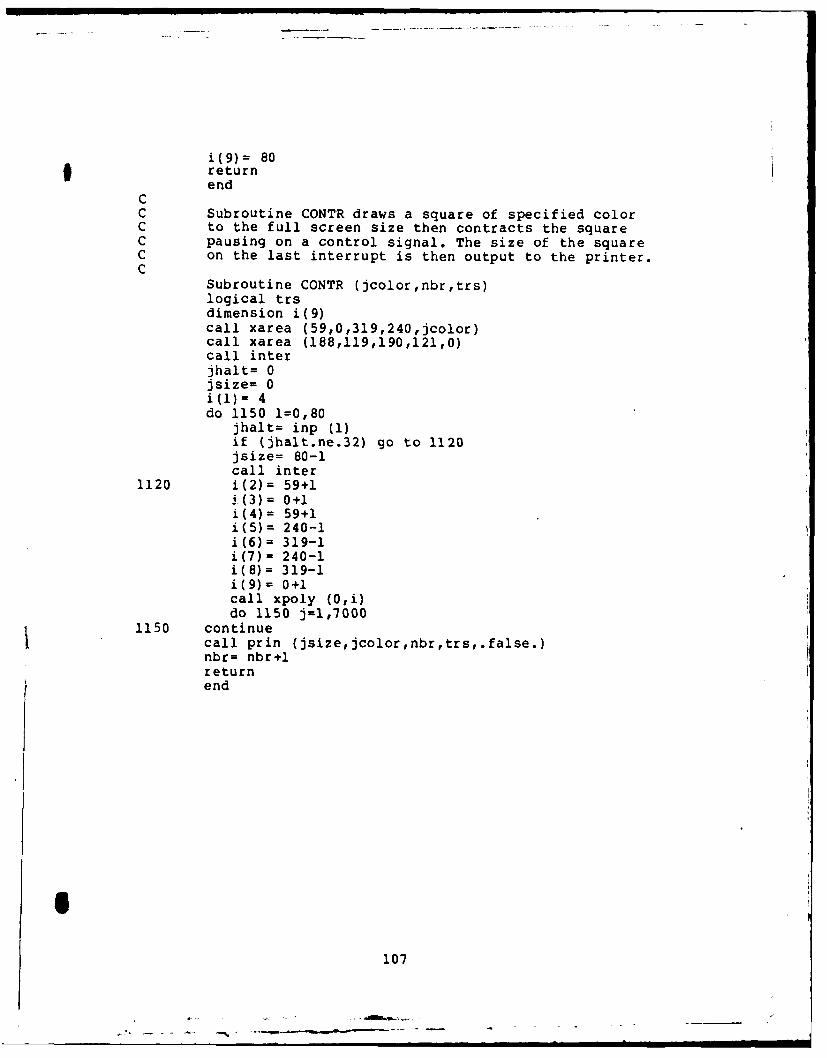
i(9)= 80returnend
CC Subroutine CQNTR draws a square of specified colorC to the full screen size then contracts the squareC pausing on a control signal. The size of the squareC on the last interrupt is then output to the printer.C
Subroutine CONTR (jcolor,nbr,trs)logical trsdimension i(9)call xarea (59,0,319,240,jcolor)call xarea (188,119,190,121,0)call interjhalt= 0jsize= 0i(l)= 4do 1150 1=0,80
jhalt= inp (1)if (jhalt.ne.32) go to 1120jsize= 80-1call inter
1120 i(2)= 59+1i (3) = 0+1i(4)= 59+1i(5)= 240-1i(6)= 319-1i(7)= 240-1i(8)= 319-1i(9)= 0+1call xpoly (0,i)do 1150 j=1,7000
1150 continueI call prin (jsize,jcolor,nbr,trs,.false.)nbr= nbr+lreturnend
107

APPENDIX b|B
Instructions for Experiment with Binocular Fusion
INSTRUCTIONS
You are about to participate in a psycho-physical
experiment studying the limits of binocular vision. In a
series of test cases you will be asked to respond based on
what you can see. There are no right or wrong answers! It
is only important that you attempt to follow the
instructions given and report what you see.
1
108
____ ___ ____ __ ____ __ 1

Throughout this experiment you will be asked to respond
when you either observe a single square become a square-
within-a-square, or vice versa. When the square expands,
you may at some point observe a second dis~inc smaller
square appear as shown below. At the point you make this
observation respond by pressing the appropriate button.
(OUTSIDE SQUARE EXPANDING)
In other trials you will first see a large square
surrounding a smaller square. As the larger square begins
to shrink you may at some point see the two squares become
one. When the two become one you will be asked to respond.
This one is tricky since sometimes, immediately after you
push the button, the second square will reappear. This is
caused by "binocular rivalry" and is not the observation
sought in this experiment. Instead it is desired that you
wait until the two squares have "fused." This point can be
determined since the second square will not "immediately"
reappear. To allow you to see and learn the difference, a
"learning" phase will be presented when the contracting
square will halt momentarily after each time you press the
button. During this learning phase try to determine where
the percept of one square becomes stable. Do not worry
about the colors fading in and out. The distinct forms are
a what you should look for.
109
,, .. . _ - - dp ... .
In all test trials a small black dot will appear in the
center of the screen. Use this dot as a focal point. It is
important you keep your eyes fixed on this point during the
individual tests. If at any time you notice the dot
disappear, then report this on completion of the experiment.
At different points in the experiment the color of the
squares will change. Do not worry about it. The forms of
the squares are the important feature to watch for.
You are now ready to begin. Pick up and hold in your
left hand the control connected to the "TRS-80". Now
locate with your right hand the <SPACE> bar on the
"Cromemco." The red button on the TRS-80 control will be
your way of communicating wirh it and will be referred to as
the "CONTROL." When it is necessary for you to communicate
with the Cromemco, you will be asked to press the <SPACE>
and, after the <SPACE>, to press any letter on the keyboard.
This might seem a little awkward so you might want to try it
a few times before starting up the program.
In the initial portion of the experiment you will be
instructed to center a solia square within a square frame.
You can do this by adjusting the mirror on the chin rest
platform. It adjusts just like the mirrors on your car.
Don't get too concerned about whether you have the box
exactly centered. When you believe them to be generally
centered, then continue. Once you have performed the
centering procedure, keep your chin on the platform and your
head steady until you have completed the experiment. All
110
1. .. . . ... mmmmm mmm( mm l mrm ta mm m m m

further instructions will be displayed on the monitor.-
If you understand the instructions, place your chin onthe platform, centered on the line provided, and begin.
I
lbl
I

A&PPENDIX
Questionnaire for Experiment with Binocular Fusion
PSYCHO-PHYSICAL EXPERIMENT ON THE LIMITS
OF BINOCULAR VISION
NAME:Please Print LAST, FIRST, MI
AGE: _ SEX:
DATE: TIME:
Did you ever lose sight of the focal point when the squares
were either contracting /expanding?
IHave you ever had any vision related illnesses or problems?
If so please describe and include your age at onset.
During the experiments did you have any problem in the
V perception of the squares? If so please describe.
Please provide any additional thoughts or comments you might
have concerning the conduct of this experiment.
THANK YOU FOR YOUR COOPERATION AND ASSISTANCE! !
112
3-
Wooli

Program Listing forExperiment with MAE Thresholds and Duration
The following program listing was executed on a TRS-80Color Computer with 32K RAM and Extended Basic. The purposeof the program was to display interactive commands andvisual stimulus scenes to support a psycho-physicalexperiment measuring the stimulus duration thresholds formotion-after-effects and the duration of motion-after-effects to a stimulus of constant duration.
Program Parameters:SQWV-3 = Machine language program
stored on tape containing thevideo frames to be used.
DR = Number of times the videosequence is to be executed.
TIMER = Internal timer provided withextended basic language.
10 PCLEAR 820 POKE 150,180 'Set printer baud rate30 CLOADM "SQWV-3" 'Load video memory
b 150 CLS160 PRINT@160," READY TO START.!"170 GOSUB 1040180 FOR G=l TO 5190 GOSUB 990: SOUND 200,3: FOR D=1 TO 486: NEXT D200 DR= 20: GOSUB 570: GOSUB 870210 SCREEN 0,0: CLS220 PRINT@160," PRESS <C> TO*CONTINUE!"230 GOSUB 1040240 NEXT G250 GOSUB 1100260 PRINT@160," PRESS <C> TO BEGIN TESTI"270 GOSUB 1040280 FOR B=1 TO 2290 FOR P=1 TO 3300 PRINT#-2," POSITION @" P CHR$(10)310 FOR G=1 TO 10320 GOSUB 990: SOUND 200,3: FOR D=1 TO 486: NEXT D330 DR=RND(20) : GOSUB 570: GOSUB 870340 SCREEN 0,0: CLS: GOSUB 990350 IF C$="NO" THEN 380360 PRINT#02," DURATION- " DR " REPORTED MAE" CHR$(10)370 GOTO 390380 PRINT#-2," DURATION= " DR NO MAE REPORTED"
CHR$ (10)390 NEXT G400 GOSUB 1100
113

410 PRINT#-2, CHR$(10)420 SCREEN 0,0: CLS430 PRINT@160," PRESS <C> TO CONTINUE!!"440 GOSUB 1040450 NEXT P460 NEXT B470 END480490500 *********SUBROUTINES*********510520530540 ' CONSECUTIVELY DISPLAY PAGES 1 TO 8. USE THE TIMER550 ' TO PROVIDE VERTICAL SYNC.560570 FOR K=I TO DR580 TIMER=0590 PMODE 0,1600 SCREEN 1,0610 IF TIMER=0 THEN 610620 PMODE 0,2630 SCREEN 1,0640 IF TIMER=1 THEN 640650 PMODE 0,3660 SCREEN 1,0670 IF TIMER=2 THEN 670
. 680 PMODE 0,4690 SCREEN 1,0700 IF TIMER =3 THEN 700710 PMODE 0,5720 SCREEN 1,0730 IF TIMER=4 THEN 730740 PMODE 0,6750 SCREEN 1,0760 IF TIMER=5 THEN 760770 PMODE 0,7780 SCREEN 1,0790 IF TIMER=6 THEN 790800 PMODE 0,8810 SCREEN 1,0820 NEXT K830 RETURN840850 ' DISPLAY PAGE 1 AND TEST FOR CONTROL.860870 PMODE 0,1880 SCREEN 1,0890 FOR D-1 TO 150900 C- PEEK(65280): IF C=254 THEN 940910 NEXT D920 C$="NO"930 RETURN940 C$="YES"
114
_ _ __-_ _ _ _ _I__ _ I II1
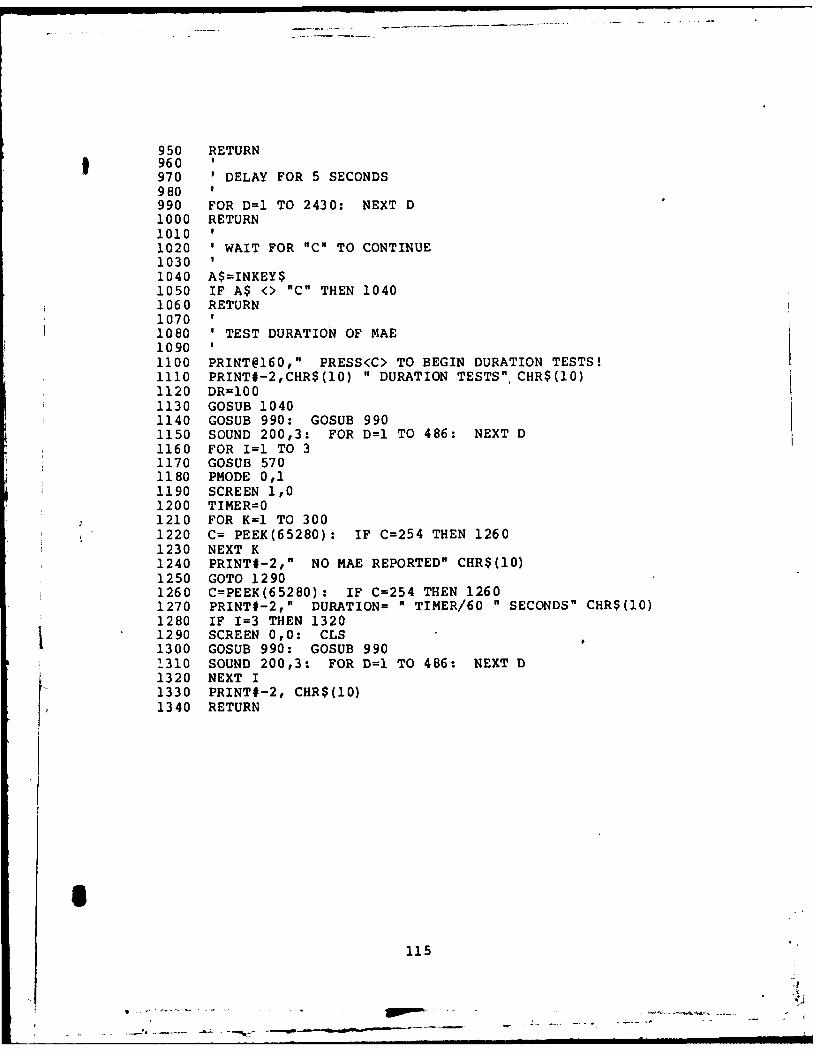
950 RETURN960970 ' DELAY FOR 5 SECONDS980990 FOR D=l TO 2430: NEXT D1000 RETURN1010 11020 WAIT FOR "C" TO CONTINUE10301040 A$=INKEY$1050 IF A$ <> "C" THEN 10401060 RETURN1070
'
1080 ' TEST DURATION OF MAE10901100 PRINT@160," PRESS<C> TO BEGIN DURATION TESTS!1110 PRINT#-2,CHR$(10) " DURATION TESTS" CHR$(10)1120 DR=1001130 GOSUB 10401140 GOSUB 990: GOSUB 9901150 SOUND 200,3: FOR D=l TO 486: NEXT D1160 FOR I=l TO 31170 GOSUB 5701180 PMODE 0,11190 SCREEN 1,01200 TIMER=01210 FOR K=I TO 3001220 C= PEEK(65280): IF C=254 THEN 12601230 NEXT K1240 PRINT#-2," NO MAE REPORTED" CHR$(10)1250 GOTO 12901260 C=PEEK(65280): IF C=254 THEN 12601270 PRINT#-2," DURATION= " TIMER/60 " SECONDS" CHR$(10)1280 IF I=3 THEN 13201290 SCREEN 0,0: CLS1300 GOSUB 990: GOSUB 9901310 SOUND 200,3: FOR D=1 TO 486: NEXT D1320 NEXT I1330 PRINT#-2, CHR$(10)1340 RETURN
o
115
,2

APPENDIX
Instructions for Experiment with MAE Thresholds and Duration
INSTRUCTIONS
Psycho-Physical Experiment on MAE
Two separate tests will be shown. In the first you
will observe a rightward moving vertical square-wave. After
a varying observation period you will observe the pattern
halt its rightward movement. At that time, if the pattern
appears stationary, then no response is required. If you
detect a leftward movement of the pattern, however slight,
then immediately press the control button. Throughout the
test period, while the pattern is displayed, you will be
asked to maintain your fixation on a specified focal point.
I' It is important you do so, and attempt not to blink when the
pattern is present. Between each test the screen will be
blanked. A tone will sound one second prior to the
initiation of each test.
(Observe 5 Trials)
The second test will present the same rightward moving
square wave one second after a tone. This time, rather than
just pressing the control to indicate the detection of
leftward motion, you will be asked to press the control
"firmly" and continue pressing it until the leftward motion
ceases. Again keep your eyes on the specified focal point
* during the tests.
116
(Observe 3 Trials)
Don't be concerned if you do not observe any leftward
movement. It won't always occur! Motion is not across the
focal point but rather the whole pattern will move.
11
I
'S,
117!
- _ _ __ _ _ _ __ _ _ _
""________,__________ -*..- ---- • -- - -

APPEnIx-
Raw Data Example for ExperimentOn the Limits of Binocular Fusion
SUBJECT: REH
TEST# CROMEMCO TRS-80 FOCAL POINT CONDITIONS SIZE(CM)
1 GREEN GREEN NO TRS-INC 11.12 GREEN GREEN NO TRS-DEC 7.63 GREEN GREEN YES TRS-INC 10.94 GREEN GREEN YES TRS-DEC 7.75 GREEN GREEN NO TRS-INC 9.76 GREEN GREEN YES TRS-DEC 6.57 GREEN GREEN YES TRS-INC 8.18 GREEN GREEN YES TRS-DEC 6.99 GREEN GREEN NO TRS-INC 10.5
10 GREEN GREEN YES TRS-DEC 7.411 RED GREEN NO TRS-INC 9.512 RED GREEN YES TRS-DEC 6.513 RED GREEN YES TRS-INC 7.714 RED GREEN NO TRS-DEC 7.215 RED GREEN NO TRS-INC 8.316 RED GREEN NO TRS-DEC 7.717 RED GREEN YES TRS-INC 7.618 RED GREEN YES TRS-DEC 6.919 RED GREEN YES TRS-INC 7.920 RED GREEN NO TRS-DEC 7.021 WHITE WHITE YES TRS-INC 14.422 WHITE WHITE YES TRS-DEC 6.723 WHITE WHITE NO TRS-INC 12.824 WHITE WHITE NO TRS-DEC 6.725 WHITE WHITE YES TRS-INC 15.626 WHITE WHITE NO TRS-DEC 7.227 WHITE WHITE YES TRS-INC 10.028 WHITE WHITE NO TRS-DEC 6.929 WHITE WHITE NO TRS-INC 8.430 WHITE WHITE NO TRS-DEC 7.031 WHITE WHITE YES CRO-INC 11.432 WHITE WHITE YES CRO-DEC 6.933 WHITE WHITE YES CRO-INC 8.934 WHITE WHITE YES CRO-DEC 6.535 WHITE WHITE YES CRO-INC 8.536 WHITE WHITE YES CRO-DEC 7.137 WHITE WHITE YES CRO-INC 13.038 WHITE WHITE YES CRO-DEC 7.139 WHITE WHITE YES CRO-INC 8.840 WHITE WHITE YES CRO-DEC 6.841 GREEN WHITE YES CRO-INC 8.842 GREEN WHITE YES CRO-DEC 6.543 GREEN WHITE YES CRO-INC 8.1
118

TEST# CROMEMCO TRS-80 FOCAL POINT CONDITIONS SIZE(CM)
44 GREEN WHITE YES CRO-DEC 6.645 GREEN WHITE YES CRO-INC 8.5'46 GREEN WHITE YES CRO-DEC 6.847 GREEN WHITE YES CRO-INC 8.148 GREEN WHITE YES CRO-DEC 7.249 GREEN WHITE YES CRO-INC 10.550 GREEN WHITE YES CRO-DEC 6.851 GREEN GREEN YES CRO-INC 11.452 GREEN GREEN YES CRO-DEC 6.953 GREEN GREEN YES CRO-INC 9.754 GREEN GREEN YES CRO-DEC 7.555 GREEN GREEN YES CRO-INC 10.456 GREEN GREEN YES CRO-DEC 6.557 GREEN GREEN YES CRO-INC 10.258 GREEN GREEN YES CRO-DEC 7.559 GREEN GREEN YES CRO-INC 10.160 GREEN GREEN YES CRO-DEC 6.5
119
... ', . ... . - -- , . -- - . ... ..
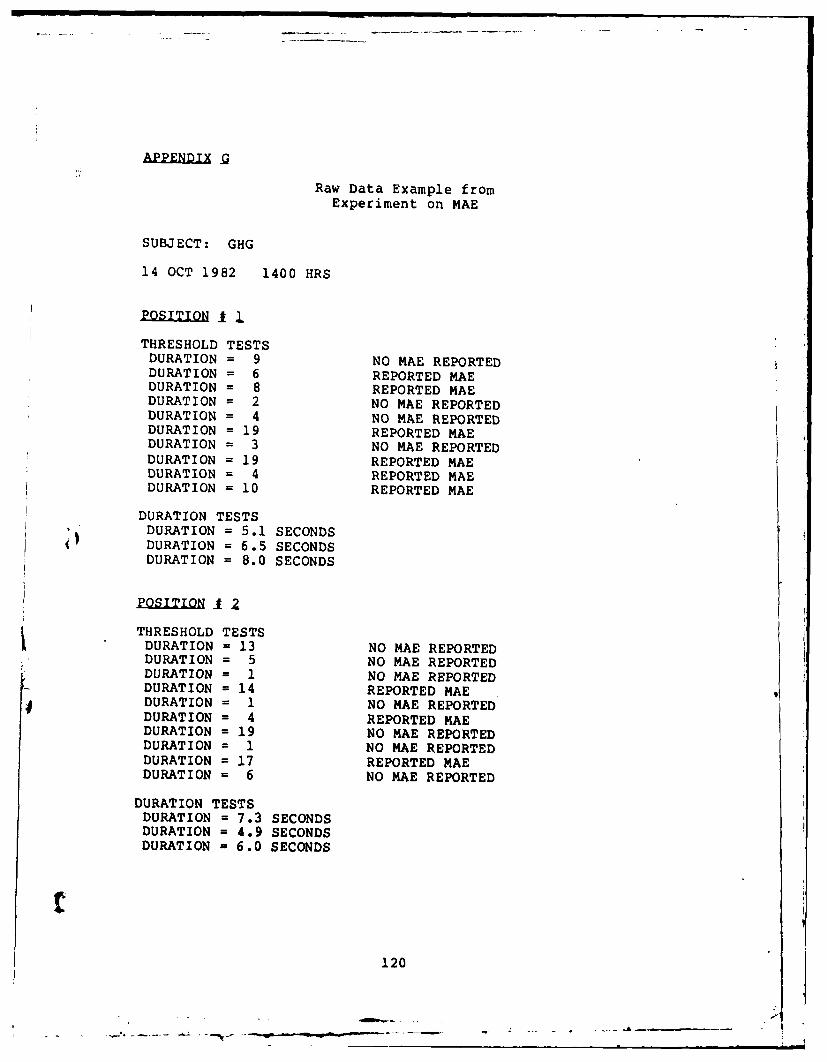
APENDI X |
Raw Data Example fromExperiment on MAE
SUBJECT: GHG
14 OCT 1982 1400 HRS
THRESHOLD TESTSDURATION = 9 NO MAE REPORTEDDURATION = 6 REPORTED MAEDURATION = 8 REPORTED MAEDURATION = 2 NO MAE REPORTEDDURATION = 4 NO MAE REPORTEDDURATION = 19 REPORTED MAEDURATION = 3 NO MAE REPORTEDDURATION = 19 REPORTED MAEDURATION = 4 REPORTED MAEDURATION = 10 REPORTED MAE
DURATION TESTSDURATION = 5.1 SECONDS
4' DURATION = 6.5 SECONDSDURATION = 8.0 SECONDS
THRESHOLD TESTS
DURATION = 13 NO MAE REPORTEDDURATION = 5 NO MAE REPORTEDDURATION = 1 NO MAE REPORTEDDURATION = 14 REPORTED MAEDURATION = 1 NO MAE REPORTEDDURATION = 4 REPORTED MAEDURATION = 19 NO MAE REPORTEDDURATION = 1 NO MAE REPORTEDDURATION = 17 REPORTED MAEDURATION = 6 NO MAE REPORTED
DURATION TESTSDURATION = 7.3 SECONDSDURATION = 4.9 SECONDSDURATION = 6.0 SECONDS
120
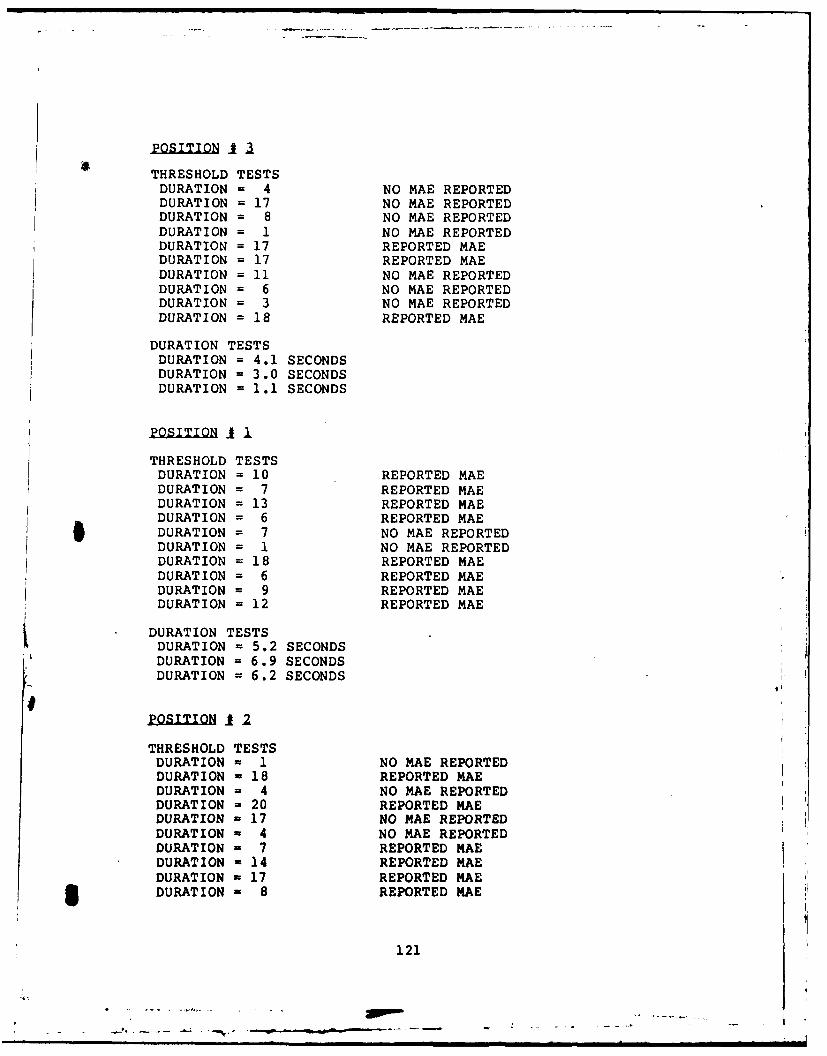
THRESHOLD TESTSDURATION = 4 NO MAE REPORTEDDURATION = 17 NO MAE REPORTEDDURATION = 8 NO MAE REPORTEDDURATION = 1 NO MAE REPORTEDDURATION = 17 REPORTED MAEDURATION = 17 REPORTED MAEDURATION = 11 NO MAE REPORTEDDURATION = 6 NO MAE REPORTEDDURATION = 3 NO MAE REPORTEDDURATION = 18 REPORTED MAE
DURATION TESTSDURATION = 4.1 SECONDSDURATION = 3.0 SECONDSDURATION = 1.1 SECONDS
PQITION 1 1
THRESHOLD TESTSDURATION = 10 REPORTED MAEDURATION = 7 REPORTED MAEDURATION = 13 REPORTED MAEDURATION = 6 REPORTED MAEDURATION = 7 NO MAE REPORTEDDURATION = 1 NO MAE REPORTEDDURATION = 18 REPORTED MAEDURATION = 6 REPORTED MAEDURATION = 9 REPORTED MAEDURATION = 12 REPORTED MAE
i DURATION TESTSDURATION = 5.2 SECONDSDURATION = 6.9 SECONDSDURATION = 6.2 SECONDS
POQSITIONi t 2
THRESHOLD TESTSDURATION = 1 NO MAE REPORTEDDURATION = 18 REPORTED MAEDURATION - 4 NO MAE REPORTEDDURATION - 20 REPORTED MAEDURATION = 17 NO MAE REPORTEDDURATION m 4 NO MAE REPORTEDDURATION - 7 REPORTED MAEDURATION - 14 REPORTED MAEDURATION - 17 REPORTED MAEDURATION - 8 REPORTED MAE
121
- -.---.. ..- .-- %, -.. ....- . - -.

DURATION TESTS*DURATION = 5.4 SECONDS
DURATION = 5.5 SECONDSDURATION = 5.7 SECONDS
THRESHOLD TESTSDURATION = 10 REPORTED MAEDURATION = 20 REPORTED MAEDURATION = 7 NO MAE REPORTEDDURATION = 19 REPORTED MAEDURATION = 11 NO MAE REPORTEDDURATION = 10 NO MAE REPORTEDDURATION = 13 REPORTED MAEDURATION = 5 REPORTED MAEDURATION = 7 NO MAE REPORTEDDURATION = 3 NO MAE REPORTED
DURATION TESTSDURATION = 6.1 SECONDSDURATION = 4.5 SECONDSDURATION = 4.9 SECONDS
122

Roger L. Carter was born on 18 February 1950 in
Lawrence, Kansas. He graduated from Lawrence High School and
attended the University of Kansas from which he received the
degree of Bachelor of Electrical Engineering in January
1976. Upon graduation he received a commission in the U.S.
Army Ordnance Corps through the ROTC program. In addition to
attendance at several military logistics schools, he served
as a Maintenance Officer in the Third Infantry Division,
located in West Germany, from 1976 to 1980. Among military
honors he has received are the Army Commendation Medal,
Meritorious Service Medal, U.S. Army Europe award for
Individual Support of German-American Interoperability, and
the Herbert W. Alden Award as the outstanding graduate of
the Ordnance Officer Advanced Course. Since entering the
School of Engineering, Air Force 'Institute of Technology, in
May 1981, he has been initiated into the Eta Kappa Nu honor
society for Electrical Engineers.
Permanent address: 2022 Vermont St.
Lawrence, Kansas 66044
$
123

SECURITY CLASSIFICATION OF THIS PAGE (Whsen Data Entered)
REPOT DCUMNTATON AGEREAD INSTRUCTIONSREPOT DCUMNTATON AGEBFORE COMPLETING FORMI. REPOqT 'NUMBER 2. GOVT ACCESSION NO. 3. RECIPIENT'S CATALOG NUMBER
4. TITLE (ed&bII)5. TYPE OF REPORT & PERIOD COVERED
.... ~x. .. u~i~~-j~'~(XF~iT..S. PERFORMING ORG. REPORT NUMBER
7. AUTHOR(.) S. CONTRACT OR GRANT NUMBER(s)
.i'ioEger :.. arttur
9. PERFORMING ORGANIZATION NAME AND ADDRESS 10. PROGRAM ELEMENT, PROjECT, TASKAREA & WORK UNIT NUMBERS
..- r..ce -nstitutc- 01of r;~.y ~ITi.~
ill. CONTROLLING OFFICE NAME AND ADDRESS 12. REPORT DATE
IS. NUMBER OF PAGES
14. MONITORING AGENCY NAME & ADORESS(tI diffelrent from Controlling Office) 1S. SECURITY CLASS. (of this report)
I5s. OECLASSIFICATION7OOWNGRAOINGSCHEDULE
IS. DISTRIBUTION STATEMENT (at thie Report)
,+~v~u fur iubljc recaswe; diztrib-utox:w i...
V). DISTRIBUTION STATEMENT (of the abstract entered In Block 20, It different from Report)
14. SUPPLEMENTARY NOTES A*oved to L1IARIGi
%,, Icas4 JA% AFAM
19. KEY WORDS (Continue an reverse side If neceseary end Identify by block numiber)
... ui :rif~x..a-Lion. 1Prcussing Lerceptiun
241 A WTVIACT (CtWANed Patets siEt N "eweeay a" Idelatify by block niusbov)Ath ortticul .:0ou1 for hu...an visi. al infornaution proOe injw v- ,e.fi2. triLtv fuzictioiiai roles to the ctrebeliIL, Z1.-crL1 ;(rnicai hz~ i: cleui:
.Cct..rcural. cortux. The 1-torL1 ;iii Iw41tu nucie, s i6 "u-diuvco Ltc~.. J. .onocular asjl ~iy~ to the Pv..Lr vis..ai co;:tuxl '--: LCh
S:i~iori-~ator. foi- uinocular irnteE~ratiori, t ctiw, u. ... '1io:., L_;otheioll 11f f~x.ctions. The cv.rebellua is hy,,thcsized to 1.Azctiui. within. a ,-dctive feecc,'cz loo,; to providie infor..~ion to the cortex Wtzzj1~ r.. -o..ci1e
_Lr%;rct;L iri !LOnO1Cur iiwage sizes arid cdspliacuwcnts.
DD 1473 EDIt1om or i NOV 6s is owsuOLT . CzL I
sacuorIy CLASSIFICATION Of -jN1S PAGE (WPien Dat. Eneeregjo

SECUF41TY CLASSIFICATION OF THSPAUW..DaEnee)
In. wn expurimzent -Kith the li:-,itz of hwaan birnocular fu jion, two se.:-eli:..it.; -.-,rec iscovered. kilen dichoptic imlaces are first ' ecreeived to re:jresenta sir lc obje-ct, the li..it for fusi,)n is Cru-tcr thaia wi, no iisjtia. i~ferencefor a ~i~eobject associAion is Liven.
. euonu exoeri!:ernt eas;urec the tisua~raTio:., iL-hnohs for ..ot ilx.ufe-~xect. o~rl~ton f;erforwance by suuij. ct6 iii ih tw xr..nts
u.;6" to eox~clude ' hat si -ilhr ..eLn~:~are involvcd in uinocalur f-uzAonand ti-e :-roccssiaj: of perceitioiis lia.iiA ;o motion-aftef-LffeCtS. .. l.nthevi~uJ1 M)oce , ing :xodel devulop,(1, bo-Lh iiiocul--r ±'uzion anu,, the exijtc: --ce ofIo.i:.-eifter-effectL; ave Tltuc tL he existence of a :iicefu dba~ji loop.
m- -z; ~T nlSECURtITY CLASSIFICATION OF THIS PAGE(Uiea Doets Entered)

DAT
DTINO
-A