INITIATION AND GROWTH OF MICROCRACKS WELDS · PDF fileINITIATION AND GROWTH OF MICROCRACKS IN...
185
AD-A268 751 INITIATION AND GROWTH OF MICROCRACKS IN HIGH STRENGTH STEEL BUTT WELDS by EDWARD OLSEN B.S., Mechanical Engineering University of South Carolina, 1985 Submitted to the Department of Ocean Engineering in Partial Fulfillment of the Requirements for the Degrees of Naval Engineer and ' TIC Master of Science in Mechanical Engineering ELECTE \Iaster AUG 3 1 1M91 at the I .E Massachusetts Institute of Technology May 1993 C Edward Olsen. 1993. All rights reserved. The author hereby grants to MIT permission to reproduce and to distribute publicly copies of this thesis document in whole or in part. • I " ii Signature of Author Edward Olsen PP Certified by i vgi~~•6 Professor Koichi Masubuchi, Kawasaki Professor of Engineering Thesis Supervisor Certified by v~V~ /cK & X Proftessor Frank A McClintock. Department of Mechanical Engineering Thesis Reader Accepted by , l/ -,.,.,, c-,( Protes~r A Douglas Carmrcha-e, Department of Ocean Engineering Department Graduate Committee I ,o O PN W 4;'
Transcript of INITIATION AND GROWTH OF MICROCRACKS WELDS · PDF fileINITIATION AND GROWTH OF MICROCRACKS IN...

AD-A268 751
INITIATION AND GROWTH OF MICROCRACKS IN HIGHSTRENGTH STEEL BUTT WELDS
by
EDWARD OLSEN
B.S., Mechanical EngineeringUniversity of South Carolina, 1985
Submitted to the Department of Ocean Engineeringin Partial Fulfillment of the Requirements for the Degrees of
Naval Engineer
and ' TICMaster of Science in Mechanical Engineering ELECTE
\Iaster AUG 3 1 1M91at the I .E
Massachusetts Institute of TechnologyMay 1993
C Edward Olsen. 1993. All rights reserved.The author hereby grants to MIT permission to reproduce and to
distribute publicly copies of this thesis document in whole or in part.
• I " ii
Signature of AuthorEdward Olsen PP
Certified by i vgi~~•6Professor Koichi Masubuchi, Kawasaki Professor of Engineering
Thesis Supervisor
Certified by v~V~ /cK & XProftessor Frank A McClintock. Department of Mechanical Engineering
Thesis Reader
Accepted by , l/ -,.,.,, c-,(
Protes~r A Douglas Carmrcha-e, Department of Ocean EngineeringDepartment Graduate Committee
I ,o O PN W 4;'

INITIATION AND GROWTH OF MICROCRACKS IN HIGH
STRENGTH STEEL BUTT WELDS
by
EDWARD OLSEN
Submitted to the Department of Ocean Engineeringon 7 May 1993 in partial fulfillment of the
requirements for the Naval Engineer Degree andMaster of Science in Mechanical Engineering.
ABSTRACT
Early tests such as the explosion bulge test created a preference for overmatchedwelds (welds which are stronger than the base metal) which eventually became codified formany structural applications. While an overmatched system offers advantages such as theshedding of strain to the base plate, it requires the use of expensive fabrication proceduresto avoid cracking. Undermatched welding of some high strength steels may offerreductions in welding costs with little sacrifice in weld performance or low cycle fatigueintegrity.
An experimental study was carried out to observe microcrack initiation and growthof overmatched and undermatched butt welded high strength steel samples using globallyelastic low cycle fatigue testing. First, 1 inch thick HY-80 and HY-100 base plates weremultipass, spray gas metal arc welded (GMAW) with overmatching and undermatchingfiller metal using a semiautomatic welding machine. Second, 1/4 inch thick M1L-A-46100high hardness armor plates (HHA) were manually, two pass spray GMAW welded withtwo grades of undermatching consumables. Weld reinforcements were removed from allHY specimens and six HHA specimens. All specimens had a crack initiator slit machinedin the test section. The specimens were fatigue tested by transverse tensile loading with a12 to 13 Hz tension-tension profile. The loading range was from 10% to 85% of thetensile strength of the HY steel base plate and HHA weld metal respectively. Crackinitiation and propagation was observed in situ using a confocal scanning laser microscope.
In the HY 80 tests, the undermatched specimens failed between 14,500 and 16,500cycles, overmatched specimens failed between 21,000 and 26,500 cycles, and the baseplate failed at 20,000 cycles. In the HY 100 tests, undermatched specimens failed between16,500 and 21,000 cycles, overmatched specimens failed between 17,800 and 21,600cycles, and the base plate failed at 32,000 cycles. All "as welded" HHA specimens failedbetween 8,000 and 17,500 cycles. H-A ground IOOS-I welds failed at 10,000 cycles andthe 70S-6 welds failed at 17,500 cycles
Thesis Supervisor: Professor Koichi Masubuchi4Title: Kawasaki Professor of Engineering 93w` 210140
2
% al it ilill
'

Acknowled2ments
I would like to extend special thanks and gratitude to the people who have helped me inthis endeavor.
Professor Koichi Masubuchi for his expertise, guidance and support.
Professor Frank McClintock for his expertise in fracture mechanics and helping me tounderstand it better.
Captain Osie Combs, USN, for providing the HY plate specimens and the requisite testing.
Tom Melvin of the Army Research Laboratory for providing the HHA material specimens.
Warren Mayott and Bob Pierce of Electric Boat for preparing the HY specimen plates,their NDT, and documentation.
Gene Franke of David Taylor Research Center, Annapolis for allowing me to study theirresearch material and work with the materials group during "Professional Employment".
The Navy for making this MIT graduate program possible and my colleague 13A's forkeeping it fun.
My brothers Andy and Greg who provided me with ongoing inspiration and friendly phonecalls.
Dr. Sally Boyd who through her love and patience taught me the value of friendship andhelped me grow immeasurably.
Finally, to my wife, Kathy R, and daughter, Brooke, thanks for being there throughoutthese past three years. Your love and devotion have given me strength throughout thesetrying times.
ýNTIS
DTIC TAB0Ub~announced 0Justifcaot1o
St#A, USNPS/Code 031(Ms. Marsha Schrader - DSN 878-2319) DIAbu1dTelecon, 27 Aug 93 - CB
DTCQsLT T-- --------I I
DTTC QUALMT INSP3C3 IL pltAvieado r

Table of Contents
Initiation And Growth Of Microcracks In HighStrength Steel Butt Welds
Title Page IAbstract 2Acknowledgments 3Table of Contents 4List of Tables 6List of Figures 7List of Thermal Image Photographs 8
Chapter I Introduction 9
Chapter 2 Background 11Hot Cracking 12Cold Cracking 16Carbon Equivalent 16Residual Stresses 17Hydrogen Embrittlement Cracking 19Stress Corrosion Cracking 21Stress Concentrations 21Fatigue Fracture 22Overmatching and Undermatching of Welds 27Weld Defects 29Fracture Mechanics 32Weld Strength Matching Effects on J, and 4 33Single Edge Notch Specimens 34Wide Plate Specimens 37The Energy Concept of Cracking 42Submarine High Strength Steel Fatigue search 46Chemical Compositional Effects of Titanium 47Nonmetalic Inclusion Effects on Fatigue Life 48Comparison of Over and Undermatched Welding 48Crack Initiation of Thick Specimens 50Fatigue Life versus Yield Strength 51Temperature Effects on Low Cycle Fatigue 52Reheating Effects on Multipass Welds 53Toughness and Tensile Properties in HSLA 53Weldment Cooling Effccts on Strength wid TouS.,es:, 53Undermatched Double V Butt Welds 54
4

Chapter 3 Experimental 57Specimen Acquisition 57Base Plates 57HHA. Base Plates 58NDT of HY and HHA 59Specimen Surface Hardness Testing 59Specimen Sizing for Testing 59Description of Equipment 61Experimental Procedure 63Observation with CSLM 64
Chapter 4 Results and Discussion 66Crack Growth 66Crack Initiation From the EDM Slit 66Crack Growth Versus Cycles 68
Chapter 5 Conclusion and Recommendation 69Experiment Comments 69Conclusions 69Recommendations for Future Work in This Field 70
Tables 71
Figures 98
References 131
AppendicesA. The Confocal Scanning Laser Microscope (CSLM) 133B. HY Steel Welding Data Sheets 138C. High Hardness Armor (HHA) Performance Data Sheets 154
5

List of Tables
No. Title Page1 Effects of Chemical Composition on Properties of Steel 712 Mismatch Values for HY Weld Samples 723 Mismatch Values for HY Weld Samples 724 Selected Welding Parameters for HY Specimen 735 Base Plate Material Nominal Chemical Analysis 746 HY Base Plate Material Properties 747 HY Specimen Sizing Data 758 HHA Specimen Sizing Data 759 HY 80 O/M-I Specimen Crack Data 7610 HY 80 O/M-2 Specimen Crack Data 7711 HY 80 O/M-3 Specimen Crack Data 7812 HY 80 O/M-4 Specimen Crack Data 7913 HY 80 U/M-1 Specimen Crack Data 8014 HY 80 U/M-2 Specimen Crack Data 8115 HY 80 U/M-3 Specimen Crack Data 8216 HY 80 U/M4 Specimen Crack Data 8317 HY 80 Virgin Base Plate Specimen Crack Data 8418 HY 100 O/M-1 Specimen Crack Data 8519 HY 100 O/M-2 Specimen Crack Data 8620 HY 100 O/M-3 Specimen Crack Data 8721 HY 100 O/M-4 Specimen Crack Data 8822 HY 100 U/M-1 Specimen Crack Data 8923 HY 100 U/M-2 Specimen Crack Data 9024 HY 100 U/M-3 Specimen Crack Data 9125 HY 100 U/M-4 Specimen Crack Data 9226 HY 100 Virgin Base Plate Specimen Crack Data 9327 HHA 100 S-I Specimen Crack Data 9428 HHA 100 S-2 Specimen Crack Data 9429 HHA 100 S-4 Specimen Crack Data 9530 HHA 70 S-1 Specimen Crack Data 9531 HHA 70 S-2 Specimen Crack Data 9532 HHA 70 S4 Specimen Crack Data 9633 HHA 70 S-5 Specimen Crack Data 9634 Selected CSLM Operating Parameters and Data 9735 CSLM Image Display Information 97
6

List of Figures
No. Title Pagge1 Residual Stress Distribution In a Butt Weld 982 Endurance Limit Versus Ultimate Tensile Strength 993 Common Weldment Heat Affected Zone (HAZ) Characteristics 1004 HY- 100 Overmatched Specimen Weld Bead Arrangement 1015 HY- 100 Undermatched Specimen Weld Bead Arrangement 1016 HY-80 Overmatched Specimen Weld Bead Arrangement 1017 HY-80 Undermatched Specimen Weld Bead Arrangement 1018 HY-80 Overmatched Surface Hardness Profile 1029 HY-80 Undermatched Surface Hardness Profile 10210 HY- 100 Overmatched Surface Hardness Profile 10311 HY- 100 Undermatched Surface Hardness Profile 10312 HH-A 100 S-1 Surface Hardness Profile 10413 HHA 70 S-6 Surface Hardness Profile 10414 HY Specimen Dimensions 10415 HHA Specimen Dimensions 10516 HY 80 O/M-2 Crack Growth 10617 HY 80 O/M-3 Crack Growth 10718 HY 80 O/MA4 Crack Growth 10719 HY 80 Virgin Base Plate Crack Growth 10820 HY 80 U/M-1 Crack Growth 10821 HY 80 U/M-2 Crack Growth 10922 HY 80 U/M-3 Crack Growth 10923 HY 80 U/M-4 Crack Growth 11024 HY 100 O/M- 1 Crack Growth 11025 HY 100 O/M-2 Crack Growth 11126 HY 100 O/M-3 Crack Growth III27 HY 100 O/M4 Crack Growth 11228 HY 100 U/M- 1 Crack Growth 11229 HY 100 U/M-2 Crack Growth 11330 HY 100 U/M-3 Crack Growth 11331 HY 100 U/M4 Crack Growth 11432 HY 100 Virgin Base Plate Crack Growth 11533 HHA 100 S-I Crack Growth 11634 HHA 100 S-2 Crack Growth 11635 HHA 100 S4 Crack Growth 11736 HHA 70 S-2 Crack Growth 11837 HHA 70 S4 Crack Growth 11838 HHA 70 S-5 Crack Growth 11939 CSLM Optics Arrangement 12040 HHA 70 and HHA 100 Stress - Strain Diagram 121
7

List of Thermal Image Photographs
No. Title Page41 Image of 100 O/M- I Fusion Zone, 1 OOX Objective 12242 Image of 80 O/M-2 UR Crack at 2,500 Cycles, 40X Objective 12243 Image of 100 U/M-2 UL Crack at 2,500 Cycles, 40X Objective 12344 Image of 80 U/M-2 LR Crack at 2,500 Cycles, 40X Objective 12345 Image of 80 Virgin Base Plate LR, 2,500 Cycles, IOOX Objective 12446 Image of 100 O/M- I UL Crack at 3,000 Cycles, 20X Objective 12447 Image of 80 Virgin Base Plate LL, 7,500 Cycles, 20X Objective 12548 Image of 100 O/M-2 UR Crack at 8,000 Cycles, IOOX Objective 12549 Image of 100 O/M-2 UR Crack at 9,730 Cycles, lOX Objective 12650 Image of 80 U/M-4 LL Crack at 11,130 Cycles, lOX Objective 12651 Image of 100 O/M-2 Asperity Profile, 11,730 Cycles, IOOX Objective 12752 Image of 100 O/M-2 Asperity Profile, 11,730 Cycles, IOOX Objective 12753 Image of 100 O/M-3 UL at 17,500 Cycles, lOX Objective 12854 Image of 100 O/M-3 LL Profile at 10,000 Cycles, 40X Objective 12855 Image of 80 Virgin LR Plastic Zone at 18,500 Cycles, IOX Objective 12956 Image of HIHA 100 S-4 UL Crack at 2,500 Cycles, 40X Objective 12957 Image of HHA 100 S-4 UL Profile at 10,000 Cycles, 40X Objective 13058 Image of HHA 70 S-4 LL Crack Fork, 12,500 Cycles, 40X Objective 130
8

Chapter 1
Introduction
Many modem structural applications require high strength steels to reduce size and
weight. High strength HY steels have been used in the construction of Navy warships and
submarines since World War 11. These steels are used as both structural hull material and
ballistic armor. Submarines have especially led the field in the development and
application of high strength steel. Research in the area of relative weld strength in
submarine material design during the 1950's by Pellini and Hartblower formed the basis for
some of today's structural codes.
An important code that has developed is requiring the weld metal to be relatively
stronger than the plate material. A weldment is by its very nature, different from its base
metal. Most welds fall into the category of overmatched in terms of weld strength relative
to the base plate strength. Unfortunately, with the overmatching comes a reduction in
ductility and toughness. Some welds are designed to be undermatched or evenmatched
but this is fairly rare. Relative weld metal strength has profound effects on structural
behavior, performance under fatigue conditions, and welding costs.
Perhaps the most profound penalty associated with high strength steels is the well
documented and researched sensitivity to failure mechanisms that are influenced by the
weldment's relative strength. In particular, high strength steels are subject to cracking that
is aggravated by hydrogen contamination, inclusions or flaws, environment, and residual
9

stresses. Crack initiation and propagation properties are also a function of loading and
joint geometry. It is important for a designer to understand the effects of relative weld
strength on failure mechanisms peculiar to high strength steels.
A particularly dangerous failure endemic to high strength steel is brittle fracture.
The failure is usually sudden and catastrophic. This failure is difficult to predict and is not
well understood. It is thought that fatigue related failure is closely associated with brittle
fracture because the final phase of fatigue failure is usually brittle in nature. The fatigue
mechanism reduces the effective stress bearing area until the stress concentration reaches a
critical loading and failure is imminent. Crack initiation and propagation are the key to
understanding this type of failure.
Crack initiation is sometimes very difficult to identify by normal methods of
nondestructive testing (NDT). The cracks are very small and can easily escape even
sophisticated radiography techniques. Subsurface cracks require sophisticated X-ray or
neutron diffraction techniques which are cost prohibit;,e and small scale in nature.
Nuetron diffraction is essentially destructive because the material becomes radioactively
activated and unusable. The situation becomes even more difficult when dealing with large
scale structures and complex weldments. Efficient NDT may simply be impossible. A
simple way to experimentally observe cracks is to use a microscope. The Confocal
Scanning Laser Microscope is an ideal tool for high resolution, in situ nondestructive
observation of weld specimens.
10

Chapter 2
Theory and Backeround
High strength steels show sensitivity to loading with regards to differentiation
between crack initiation and growth. In ship building where shock loading such as hull
slamming must be taken into account, both crack initiation and propagation properties are
important [Masubuchi]. Crack propagation may be inhibited at the production level by
using fine grain steels and production quality control to ensure fracture toughness.
In-service crack propagation is minimize., by designing for loading within acceptable stress
levels.
Fracture toughness is important to avoid brittle fracture of welded structures. This
is especially true of high strength quenched and tempered steels such as HY-80 and
HY-100. These steels have high yield strength and excellent notch toughness that is
difficult to match in the weld metal. Fracture initiation may be inhibited by proper material
selection, fabrication quality control, and regular inspections.
Fractures are most likely to initiate from a welding defect. Induced thermal
stresses during cool down can create a great deal of localized strain. Stress relief occurs
when a crack initiates and grows to relieve additional stresses. Local defects such as
inclusions also create localized high stresses which can develop into crack sites.
11

In the most general sense weld metal cracking may be divided into hot cracking
and cold cracking. The following sections discuss various types of common cracking
experienced by high strength steels
Hol Cracking
Some of the following information was extracted from Iwancowicz, 1992. Hot
cracking is intergranular and occurs at or near bulk solidus temperature, approximately
14000 C to 1500' C for steel. The majority of hot cracking is referred to as weld metal
solidification cracking and occurs at the initial stages of cooling when the thermal
shrinkage is greatest, about 2%-6%. Strains across the liquidus weld metal and fusion
zone cause rupturing of the dendritic interfaces with subsequent crack nucleation. Hot
cracks have also been observed in the HAZ adjacent to the fusion zone. The HAZ is
particularly vulnerable to cracking because of the propensity for microcrack formation
along the fusion line. Figure 3 shows the characteristics of a common weldment HAZ
Hot cracks may be characterized by their formation and location. Dixon classifies
hot cracking as either segregation hot cracks or ductility-dip cracking.
Segregation cracking is caused by microsegregation of the liquidus phases into
intergranular films having a low melting temperatures. This may occur in the weld metal
and in the HAZ.
12

Ductility-dip hot cracking is the result of the reduction in ductility some alloys
exhibit immediately below recrystalization temperature. Ductility-dip regions form near
newly formed grain boundaries. This may occur in the weld metal and in the HAZ. The
ductility-dip regions do not contain low melting temperature film boundaries and require
higher strains to crack than segregation cracking.
Several hot cracking mechanism theories share a common crack initiation site
theory. It is generally accepted that the molten weld pool solidifies in a method consistent
with heat input and thermal gradient. A high thermal gradient process such as GTAW
promotes cellular grain growth while a lower thermal gradient method such as SAW and
GMAW promote dendritic growth.
The dendritic crystals growth initiates at the liquid-solid interface and continues
into the molten weld pool along crystallographic directions. During cooling, dendritic
growth perpendicular to the advancing solidification front become dominant by blocking
the growth of other advancing dendrites. Weld metal solute is rejected from the
solid-liquid interface. The final product is a non homogeneous grain boundary at the
dendrite-liquid interface with a preferential crystallographic orientation. Thermal stresses
near the solidification front may cause interdendritic cracking which subsequently serve as
initiation sites for the growth of solidification cracks during cooling. These crack sites are
initially filled in and "healed" by liquidus weld metal flow fr om adjacent pockets. This
process continues until solidus, then permanent cracks are formed.
13

Borland proposed a hot cracking mechanism theory involving Dixon's
Shrinkage-Brittleness theory and Pellini's Strain theory. Dixon's strain theory claims that
cracking does not occur during the "mushy" stage of solidification because shrinkage
strains are uniformly distributed across the weld pool. Instead, cracking is caused by low
melting temperature liquid films formed between solidified grains.
Dixon's shrinkage-brittleness theory considers the interlocking of dendrites and
subsequent rupture caused by ununiform contraction strains. Aforementioned "healing"
occurs but eventually ceases. The rupturing and tearing of dendritic boundaries takes
place in the "brittle temperature range" (BTR) which covers the temperature range from
dendritic interlocking to just below solidus. Contraction strains become uniform when
solidus is reached and thermal cracking is minimized and stopped. The relation of BTR to
hot cracking is not fully understood but it appears to be directly related to a material's
susceptibility to hot cracking.
In Borland's theory the solidification process is divided into four stages:
" Primary dendrite formation: full dispersion of the solid phases in the liquidus withboth phases capable of relative movement.
" Dendrite interlocking: growth and interlocking of dendrites. Liquid and solidphases are continuous but only the liquid phase is capable of movement,
" Grain boundary development: initial stage of hot cracking. Dendritic growthcontinues with healing of fissures. Shrinking strains may create permanent crackinitiation sites and possibly cracks. Referred to as critical solidification range (CSR)
14

by Borland. Material susceptibility is directly related to CSR. Advanced crystalgrowth and solid bridging across dendrites traps any remaining liquid in pockets.
Completion of solidification: solidification of the remaining pockets of liquid.
Borland further states that a wide CSR is insufficient in itself to cause hot cracking.
Dispersal of the liquid phase over all the grain surfaces is necessary to maximize shrinkage
strains. Borland suggests that the liquid phase distribution is a function of the ratio of
liquid-solid interfacial energy and the grain boundary energy. Hot cracking is reduced as
the ratio increases above 0.58.
Prokhorov described weld metal cracking as a function of temperature and the
strain rate within the solidifying metal. He defined a brittle temperature range (BTR) as
the band in which cracking will occur. The BTR has an upper limit corresponding to the
temperature where liquid cannot freely circulate around the grains. The lower limit is the
temperature just below solidus where the grain boundary strength is sufficient to resist
thermally induced shear stresses.
The weld metal is ductile during the BTR and can absorb limited strain. These
strains cause localized shearing of ductile intergranular phases. Cracks form when the
strain rate becomes great enough to cause grain boundary film rupture.
Hot cracking in the HAZ was investigated by Masubuchi. Because the welding
process partially melts surrounding base metal, residual tensile stresses caused by cooling
15

create high strain across grain boundaries which may develop into small intergranular
cracks. Grains are assumed to be surrounded by soft material that has a low critical shear
stress. Consequently deformation by sliding occurs at fairly low levels of applied stress.
Experimentation in hot cracking mechanisms has led to suggestions of more
advanced modeling techniques [Goodwin, 1990]. It was suggested that better
understanding of hot cracking dynamics would result from the use of more accurate
analytical models using fractal mathematics and super computers.
Cold Cracking
Cold cracking occurs below 2050 C (4000 F) and is localized in the HAZ and fusion
zone and is transgranular in nature. It is also referred to as delayed cracking, hydrogen
delayed cracking, hydrogen assisted cracking. Some authors disregard the hydrogen
qualifier and refer to cold cracking in a generic sense as anything other than hot cracking.
Cold cracking is further subdivided into short-time cracks and delayed cracks, Short time
cracking occurs during the cooling process. Delayed cracking may take any amount of
time to initiate after cooling. Most high strength steel structures require delayed NDT to
identify these cracks. The U. S. Navy requires seven days delay for checking HY steels.
Carbon Equivalent
Carbon equivalency (CE) is the method by which a steel's constituents can be
examined with respect to cold cracking. CE is based on the effects of carbon increasing a
16

material's susceptibility to cold cracking. Carbon content is a contributing factor in the
formation of martensite in the weld metal. There are several versions of CE expressions
developed for special purposes. The American Welding Society (AWS) defines the CE for
high strength steel as:
M=C Ni Cr Cu Mo VCE C 6 20 "10 40 50 10'
AWS declares 40 as the upper limit for prevention of underbead cracks. Table I lists the
relative contributions of some alloying elements and their importance compared to carbon.
Residual Stresses
Residual stresses are the result of welding thermal transients which induce
incompatible strains and inelastic stresses. Incompatible strains are plastic strains due to
solidification and solid phase transformation of the weld metal. Residual stresses may be
reduced through thermal stress relief. Unfortunately, post weld heat treatments are
prohibited on high strength quenched and tempered steels. Masubuchi has developed a
rational analytical approach for determining residual weldment stresses in practical
structures through simulation. Residual stresses are characterized as either:
"* Welding stresses produced in the welding of unrestrained members.
" Reaction stresses caused by external restraint. Figure 1 shows typical weldingstresses associated with a butt weld. a, represents stresses parallel to the weld axisand a,, stresses perpendicular to the weld axis. In Figure 1 part c, curve I shows therelatively low intensity tensile stresses in the center of the plate which taper off andbecome compressive at the edges. Curve 2 shows the additive effects of restraininglateral contraction. Analytical investigation led to the theory that residual stresses in
17

constrained butt welded joints are caused by; 1) elastic dislocation due to transverseshrinkage, and 2) incompatible strains produced near the weld due to longitudinalshrinkage of the weld metal and plastic deformation of the base plate.
Magnitude and distribution of residual stresses in weldments are affected by:
"* the temperature distribution in the weldment,"* the thermal expansion characteristics of the material," the mechanical properties of the material at elevated temperatures.
Computer simulation models and experimentation by Masubuchi have shown that
peak residual stresses in the weld center can approach yield stress in some high strength
steels. However, experimentation with quench and tempered (HY) steels indicated peak
residual stresses below yield stress. In any case, high strength steels exhibit very narrow
bands of tensile stresses near the weld which seems to be related to the size of the HAZ.
Specimen size plays an important role in residual stress distribution and magnitude
of unrestrained butt welds. Weld length is directly related to the central peak longitudinal
stress with a limit of about 18 inches where the stress becomes uniform. Transverse stress
remained tensile in the central area and become compressive at the plate edges and were
not affected by weld length. Width was negligible as long as overall width was several
times the residual stress zone.
Residual stresses are influenced by the thickness of the specimen. Thick specimens
require more welding passes and exhibit greater tensile surface longitudinal and transverse
stress fields. A problem with experimentation in this area is that interior stress fields
is
cannot be measured adequately. All stress fields are predicted from destructive tests which
allow surface measurements and as such are limited in accuracy.
It is generally accepted that transverse and longitudinal residual stresses become
compressive near the center of the weld, a direct result of multipass welding. Residual
stresses normal to the weld surface exhibit mostly compressive stresses but some
researchers believe the stresses can become tensile in very thick welds. HY specimens
used in this experiment were multipass welded, Figures 4 through 7 depict the weld bead
arrangements.
Variations in the sequence of multipass welds affect distortion and the residual
stress distribution. Transverse residual stress in restrained welds varied with the sequence
used. Block sequence butt welds produced the least shrinkage, strain energy, and reaction
stresses. Longitudinal stresses did not vary significantly with different weld sequencing.
Local surface hardness is affected in the HAZ hen multipass welding is used. Figures 8
through 11 show the effects of multipass welded butt joints on surface hardness of 1 inch
HY 80 and HY 100. Figures 12 and 13 show surface hardness for 0.25 inch, two pass
welded HHA specimens.
Hydrogen Embrittlement Cracking
Hydrogen is one of the most common and serious types of time dependent failure
[Masubuchi, 1980]. The presence of hydrogen reduces the ductility of unnotched
19

specimens and hence reduces tensile strength of notched specimens. Characteristics of
hydrogen cracking include:
"* not being a form of stress corrosion cracking"• embrittlement resulting from hydrogen greater than the equilibrium solubility limit,
about I ppm for high strength steels.
Material and weld strength is directly related to its susceptibility to hydrogen
cracking. Life of the specimen is significantly reduced as a function of tensile load and
hydrogen in solution. A specimen of HY-80 briefly exposed to hydrogen contamination
and loaded to 80,000 psi in tension failed after 400 minutes. A specimen of SAE 4340
quenched and tempered steel with a tensile strength of 260,000 psi failed after 15 minutes
when loaded in tension to 80,000 psi while hydrogen was being charged to the steel
[Masubuchi, 1980].
The affects of hydrogen embrittlement are aggravated by high longitudinal residual
stresses. Transverse crack length is uniform in the center of the weld and decrease in
length as one moves toward the edge of the plate. There were no cracks at the plate's
edge. Typical hydrogen induced cracks were short, transverse and adjacent to the weld.
Severe hydrogen embrittlement enhanced extensive cracking while less hydrogen
embrittled specimens exhibited short, less predominant and widely spread cracks. A lower
limit of embrittlement produced no cracking along with a lower limit on material toughness
which indicated no cracking even when highly charged with hydrogen.
20

Stress Corrosion Cracking
Stress corrosion cracking (SCC) is characterized by its severe localized affects on a
structure. The combination of corrosion and tensile stresses can cause a normally ductile
material to fail in a brittle manner. SCC does not affect pure metals and seems to be
reduced when pure metals are used in alloying steels. Specifically, aluminum, copper, and
magnesium based alloys show reduced susceptibility to SCC as the alloying components
are reduced. Environments causing SCC vary depending on the base metal. For steels the
most detrimental environments are alkalis, nitrates, hydrogen cyanide, hydrogen sulfate,
anhydrous liquid ammonia, sodium chloride solutions and marine atmosphere [Masubuchi,
1980]. While SCC can occur without external loading, it is aggravated by the presence of
high residual stresses.
Stress Concentrations
Geometric conditions can create zones of stress concentration that can become
zones of high strain from which cracks can initiate. Flaws are not required for a stress
concentration to occur. Most generally, a stress concentration will occur wherever there is
a geometric discontinuity such as sharp edges, slits, notches and even inadvertent arc
strikes.
An arc strike is defined as an inadvertent heat affected zone or change in contour
of the finished weld or adjacent base metal resulting from an arc or heat generated by the
passage of electrical current between the surface of the finished weld or base metal and a
21

current source [Czyryca, Juers, Werchniak, 1991]. An arc strike may be considered a
metallurgical notch from which failures may initiate. During the fraction of a second that it
takes an arc strike to occur, a very thin layer of the base metal is melted. This molten base
metal is not protected by flux or shield gas, thus it is probably contaminated. Since a small
volume of base metal is melted, the large mass of the surrounding conducts the heat away
rapidly, causing a very high cooling rate. The rapid quenching can cause a local brittle
HAZ which then lies in a field of tensile residual stress caused by thermal gradients and
volume changes that accompany metallurgical transformations. Arc strikes may also
contain microcracks and porosity.
Fatigue Fracture
Fatigue is a complex phenomena that is not well understood, and difficult if not
impossible to predict [Shigley, Mitchell, 19831. Designs can easily compensate for static
load failures but not for fatigue failures. Fatigue failures are usually sudden and
catastrophic in nature, hence very dangerous. Fatigue fracture is caused by cyclic stresses.
The stress may be classified by its frequency, range and profile with respect to time.
Engineers are generally concerned with two types of fatigue fracture mechanisms:
"* high cycle, low stress loading"• low cycle, high stress loading
High cycle fatigue must consider the endurance limit which is generally accepted as
greater than 106 cycles. High cycle fatigue is associated with ship structures near high
speed equipment such as the propeller. Low cycle fatigue is more important for ocean
22

engineering structures because the major loads on the ship's hull girder are (low frequency)
wave induced elastic loads. Empirical data for ocean engineering structures and ships is
very scarce. Figure 2 shows the variation in endurance limit as a function of material
condition and tensile strength.
Fatigue fractures grow slowly and may never actually cause failure of the structure.
As the crack propagates through a ductile structure, cross sectional area is slowly reduced
to the point where loading exceeds the ultimate tensile stress which results in failure.
Less ductile or brittle materials fail catastrophically when a critical crack length is
reached. Brittle failures exhibit strong dependence on temperature and geometry.
Ductility tests yield a transition temperature which indicates ductile to brittle failure for a
given load.
Fatigue cracks typically exhibit three stages:
"* initiation"• slow growth"* onset of unstable fracture
Repeated stress cycles below the ultimate strength (and sometimes even the yield
strength) of the material still result in failure. The failure initiates from a point of
discontinuity in the material such as a keyway or hole. Less obvious are welding defects
that are invisible to the eye but are usually undetectable by NDT also. When the stress at a
discontinuity exceeds the elastic limit, plastic strain results. A fatigue fracture occurs with
23

the presence of cyclic plastic strain. As the crack initiates and continues to grow, so too
does the plastic strain field around the crack site. Eventually, stress concentration
becomes great enough to cause total failure. The ensuing slow growth of transgranular
cracks occurs as a function of cyclic loading. Striations (beach markings or concentric
rings) are formed along the crack front and are related to the number of cycles. Other
variables such as mixed mode failure and plasticity influence the actual ratio of cycles to
striations.
The site of a fatigue failure contains two distinct areas. The first is caused by
progressive development of the crack, while the second is due to the sudden fracture. The
sudden fracture zone is similar in appearance to the fracture of a brittle material such as
cast iron, that has failed in tension.
Cracks propagate in the direction normal to the maximum tensile stress; transverse
to the load axis. Finally, the onset of unstable fracture occurs when the nonlinear crack
growth reduces cross sectional area. If the area is reduced sufficiently, ultimate strength is
exceeded resulting in failure. The plastically failed surface will appear fibrous or
crystalline depending on ductile or brittle failure respectively.
Several methods have been developed to portray cyclic failure. The most common
is the Wohler or S-N curve where S is the nominal cross sectional stress, and N is the
number of cycles. The graph is usually plotted in a log-log format to yield a linear curve.
24

The overall curve has a constant slope to the endurance limit which for ferrous materials is
about 106 cycles. For the section of the curve preceding the endurance limit, the general
relation for the slope of the S-N curve is:
Fr= S (N/n)k
where
F. is the fatigue strength computed for failure at n cycles
S is the stress loading producing failure in N cycles
k is the slope of the best fit straight line S-N curve [Masubuchi, 1980].
Factors influencing fatigue limit include:
"* Most high strength steels are particularly susceptible to reduced endurance limitscaused by sensitivity to microstructure and chemical content. Material effects areillustrated in Figure 3. This condition is strongly influenced by any welding processand the subsequent formation of a HAZ.
" Stress concentrations will form where ever there is a change in structural continuitysuch as cracks, holes, welds, and notches. The shape and size of the discontinuityinfluence the concentration factor. A sharp crack has the highest stressconcentrating effect. Weld reinforcements reduce fatigue life considerably and mustbe ground flush on critical joints. Reinforcement or doubler plates may also suffice.
" Corrosion fatigue is a highly localized failure that can significantly reduce the life ofa structural material. High strength steels and titanium alloys are subject to severecorrosion fatigue in seawater. High stress aggravates the situation.
" Residual stress significantly affects those phenomena occurring under low appliedstress. For instance, stress corrosion cracking and hydrogen induced cracking takeplace with no applied load, so residual stresses can further reduce the fatigue limit[Masubuchi, 1991]. Residual stress is important in high cycle fatigue since it ischaracterized by low stress. Some investigators feel that residual stress effects areminimal while others contend that surface compressive residual stresses arebeneficial and caused an increase in fatigue life. Evidence suggests that mostresidual stresses can eliminated by stress relieving the structure.
25

Fatigue crack growth rate (da/dN) correlates with stress intensity factor (AK). As
a fatigue crack grows, daldN and AK increase also. Diagrams of da/dN versus AK show
the material's relative resistance to crack growth.
Low cycle fatigue failure is generally characterized by high local stress loading
which involves plastic deformation. True stress cannot be calculated by elastic theory and
plastic theory is not developed enough. Plastic strain causes hysteresis of the
loading-unloading curve on a stress strain diagram, therefore total strain must be used as
the second variable [Masubuchi, 1980]. However, if the material response to loading
remains in the elastic range, stress remains an adequate parameter. Experimentation has
indicated that strain is the dominant factor in low cycle fatigue and is independent of the
strength or type of mat!erial. High cycle fatigue strength varies with strength however.
The problem is that there is no clear cutoff between high and low cycle fatigue.
Experimentation has also indicated that high yield strength materials may suffer low cycle
fatigue failure while being cycled in the elastic region.
Fatigue limits for welded specimens can be estimated to be 0.5 to 0.8 tensile
strength loading for 100,000 cycles. Low cycle fatigue is defined as failure below 10,000
cycles. Failure above this value is referred to as high cycle fatigue. The endurance limit
for steels is typically 1,000,000 cycles or greater. The significance of the endurance limit
is that failure is not anticipated beyond this number of cycles. Interestingly, nonferrous
metals and some steels do not have an endurance limit and are classified as having a finite
cyclic lifetime.
26

Manin classified several factors influencing the endurance limit (and hence the
failure limit) of practical structures. These include the following: surface factor, size
factor, reliability factor, temperature factor, stress concentration factor and a
miscellaneous effects factor.
Overmatching and Undermatching of Welds
Cracking of butt welded high strength steel is a complex phenomena that continues
to be researched extensively. Important factors in butt welded high strength steels include
joint geometry, direction of principal strain axis, and the weldment's strength relative to the
base metal.
Joint geometry is important because it determines the moments and forces
transmitted from the base plate to the weldment. Principal strain axis direction will effect
the relative direction and propagation of failure cracks. Weldment relative strength is
categorized as overmatched if the weldment is stronger than the base plate or
undermatched if the base plate is stronger than the weldment.
The degree of weldment mismatch is determined from the weld metal and base
plate metal respective yield or tensile strengths as follows:
Mismatch = (YS,, - YSp ) / YSP,•,
or
Mismatch = (TS,,,Id -TSP•)/ TSPI,.
27

Mismatch is sometimes indicated as negative for undermatched welds and positive
for overmatched welds. Multiplying the mismatch by 100 yields the percent mismatch. It
is important to indicate which reference is being used. The percent yield and tensile
referenced mismatch for each of the samples is presented in Table 2 and Table 3.
For the past several decades weld overmatching has been the norm. In many
instances this policy has been codified in structural applications. The history of the
preference for overmatching can be traced back to explosion bulge experimentation with
high strength steels with overmatched and undermatched welds in the 1950's [Kirk, 1991].
The topic of overmatched versus undermatched weld joints has been the focus of recent
experimentation and analytical research, perhaps driven in part by the economics of
welding manufacturing. Kirk has researched the affects of overmatched and undermatched
welds, some of the following information is taken from his paper.
Overmatching has technical and economic penalties. Overmatch welded high
strength steels usually require preheating to avoid hydrogen cracking. Satoh demonstrated
that preheat requirements could be halved when welding HT-80 (113 ksi nominal tensile
strength) steel with an undermatched electrode (AWS E9016G, 90 ksi nominal tensile
strength) rather than with an overmatched electrode (AWS E 106G, 110 ksi nominal
tensile strength). This resulted in a reduction of energy costs and increased production.
Increased production is the result of the reduced preheat allowing a greater welding duty
cycle. Undermatched welding of HY steels in the 80 to 130 ksi range has a deposition rate
28

greater than overmatched welding. Lack of fusion and lack of penetration defects are
reduced because of the higher heat input. Residual stresses are reduced and weld metal
toughness is increased. Since the hydrogen embrittlement problem is reduced, the
electrodes do not require the same degree of preheating and special storage resulting in a
further savings in energy.
The welding process has many uncontrolled variables that effect the characteristics
of the solidified weld and surrounding heat affected zone (HAZ). Toughness of the
weldment and HAZ must be considered along with weld defects which can serve as crack
initiators.
Analytical and experimental results indicate that transversely loaded weldment
plastic strains concentrate in the material with the lower yield strength. An overmatched
weld sheds strains to the plate where there is better fracture toughness and less defects.
An undermatched weld concentrates strains in the weldment.
Weld Defects
Weld defects can be categorized as planar / crack-like (cold cracking, lack of
fusion, hot tearing, lack of penetration, or undercut) or volumetric (porosity, slag
inclusion). These defects may not be detectable using economical methods of
nondestructive testing (NDT). The most important defects are those that provide initiation
sites for cracking during service.
29

Overmatching welds on high strength steels have an increased probability of weld
defects which increase considerably with base metal and weldment strength. While high
quality undermatched welding may be easier to perform on high strength steel structures,
there remains the problem of contending with the concentrated weldment strains that could
cause premature failure.
Historical preference for overmatching came about as the result of empirical
studies of weld metal deformation. In 1951, Pellini and Hartblower performed explosion
bulge tests to study deformation and fracture behavior of weldments in high-rate,
multiaxial loading. The test results indicated that overmatched welds experienced local
strains that were less than the global plate strain while undermatched welds exhibited the
opposite effect. The ability of overmatched welds to shed strain to the base plate was
influenced by both the geometry of the weld and the relative strength (not absolute) of the
weld over the strength of the base metal.
Pellini and Hartblower's experiments further bolstered overmatching by indicating
that overmatched welds absorbed more energy than undermatched welds. Overmatched
samples exhibited a greater ability to thin without fracture for a given temperature.
Weldment cracking propagated perpendicular to the principal strain axis, therefore
cracking initiated and propagated parallel to the weld axis in undermatched samples while
in overmatched samples, cracks propagated perpendicular to the weld axis into the plate
30

where they were arrested. Since weldments are subject to defects, the arresting feature of
the overmatched welds was highly desirable. The base metal became the major contributor
in governing fracture resistance of the overmatched structure. This was a very important
discovery since metallurgical controls for plate fabrication are easier to control than the
welding process. Consequently, undermatching was not considered as a realistic
alternative in high strength steel structures.
Experiments by Satoh and Toyoda investigated strength and ductility of
undermatch butt welded wide plate in tension. The feasibility of reducing or eliminating
the preheat when welding HY-80 was investigated. Results showed that the weldment
ultimate strength approached that of the plate as joint thickness decreased, indicating that
joint strength is a function of joint geometry and flow properties. An increase in the
weldment's strength resulted from the higher strength base metal constricting plastic flow
in the joint. Reduction in ductility was characterized by a reduction of both ultimate strain
to failure and strain at maximum load. Finally, experimentation with combinations of
undermatching double-V and double-U groove joints typically used in industry were
performed. These tests indicated that a 10%/ undermatched weld could achieve the
ultimate strength of a slightly overmatched weld. Undermatching effected ultimate ductility
of the weldment much more than its ultimate strength. A 34% undermatched weld
retained 94% of the ultimate strength of an overmatched weld but only 29*/o of its ultimate
ductility. A major obstacle facing the use of undermatching welds is the reduced ductility
of the weldment.
31

Tensile tests performed by Patchett and Bellow in 1983 indicated that the
weldment thickness of undermatched submerged arc welded pressure vessels was
indirectly related to the ultimate strength of the weld. The weld's yield strength was
unaffected. Plastic flow dependent failure, a function of yield strength, is independent of
weld thickness.
Undermatched welds are still an attractive alternative because it can alleviate
special needs such as, the need to reduce hydrogen cracking by preheating, or the need for
residual stress relief Overmatched and undermatched weldments must also be examined
with respect to crack initiation and propagation.
Fracture Mechanics
Fracture toughness and the fracture driving force of a material can be quantified by
a crack tip characterizing parameter. Stress intensity factor, K, is used when linear elastic
conditions prevail. If the crack tip is not vanishingly small compared to other dimensions,
then the nonlinear fracture mechanics (NLFM) term of crack tip opening displacement
(CTOD), 8 or the J-integral, Ji, are used.
When conditions of linear elastic loading exist, the three parameters are related.
For post yield loads, 8 and J, are related by material flow properties and a geometry
factor. Intensity of the crack deformation field with some geometry independence can be
32

measured by the crack characterizing parameter. NLFM provides a framework to predict
maximum safe load of a flawed structure.
Experimental procedures are well established for computing values of K,, 8, and J,
for homogeneous specimens. No guidelines have been established for welded specimens.
Currently there is research on the effects of mismatch on J1, 8, and critical fracture
toughness.
Weld Strength Matching Effects on J, and 8
Experimentation and analytical finite element modeling of test pieces has been
performed by numerous investigators. Single edge notched specimens in tension SE(T),
and single edge notched specimens in bending SE(B) have been used to estimate fracture
toughness of the material. Tension loaded wide plate specimens are used as a structural
scale proof test because the loading and relative crack size more closely model a structure
than an SE(T) or SE(B) specimen.
In the following section, the test pieces were treated as a bi-material consisting of a
weldment and a base metal where the values of J, and 8 did not vary significantly from the
finite element estimations. The elastic modulus of the weldment and base plate were held
equal while the post yield flow properties were allowed to differ. The heat affected zone
(HAZ) of the weld vicinity is an important issue because the bi-material treatment of the
specimen can break down. Figure 3 shows the region of a typical HAZ.
33
The HAZ is an area of large gradient of change in constitutive properties between
the weldment and base plate with the size of the HAZ relative to the dimensions of the
plate and weldment being the critical parameter. Thin plate or narrow weld specimens
therefore will not behave according to the bi-material treatment making analysis very
difficult. Thick plate (on the order of 3/4 inch to 2 inch) that has been multipass welded
has a large HAZ but it is relatively small compared to the plate and weldment dimensions
so bi-material modeling is acceptable. A thick plate specimen HAZ is far away from the
center of the notched weldment where the crack will initiate and propagate. This prevents
the crack from encountering the HAZ where applied J, varies.
Single Edge Notch Specimens
Fracture toughness of a material can be determined using the SE(T) and SE(B)
tests. SE(B) tests have the advantage of requiring less loading and simpler equipment to
perform the experimentation, therefore it is the most common test. Values of applied load,
displacement, and crack edge separation or crack tip opening displacement (CTOD) are
typically monitored during the experiment. Loading progresses to the point of crack
initiation by either cleavage (brittle fracture) or microvoid coalescence (ductile failure).
These data can be used to calculate the critical fracture toughness, J,, and/or 8, using
equations for unwelded specimens as cited in ASTM testing standards. It is important to
determine if J1c or 8, are influenced by the presence of a weld and if so, by what amount.
34

The effect of weld geometry for 15% undermatched 0.1 a/W (ratio of crack depth,
a, to test piece width, W) SE(B) specimens was investigated by Bleackley. The plot of
applied J, versus load point displacement indicated an initial parabolic curve that was a
function of linear elastic response and therefore not influenced by weldment matching or
joint geometry. The curve continues to a linear portion that is indicative of gross section
yielding, the slope of which varies directly with the severity of fracture. Gross section
yielding is a function of both weld metal matching and joint geometry. Undermatched
welds exhibited a large slope and overmatched welds had a small slope. Bleackley's data
showed that experimentally measured values and crack tip driving force, JI, varied with
joint geometry. The single-V and square groove welds agreed with values for a monolithic
weld metal specimen. Double-V groove welds showed less applied J, than predicted by
the previous model. The reduction of J, occurred because the width of the weld joint
caused high strains to concentrate inside the weld along the metal-plate fusion line, but
these strains did not spread to engulf the crack tip.
The effects of matching ratio and crack depth to specimen width ratio on SE(B)
double-V groove specimens was studied by Cray, Luxmoore and Sumpter. It was
determined that no correspondence of J, for a given load existed between the
homogeneous and welded specimens. The welds exhibited trends that were consistent
with weld deformation behavior of uncracked weld joints. The undermatched weldment
concentrated the strain and increased the applied J, while the overmatched weld reduced
the applied J, by shedding the strain to the base plate.
35

Investigation of SE(B) specimens revealed the following.
"* Shallow Cracks: accurate J1 estimates that take into account weld mismatchand nonhomogeneity of the specimen do not exist for welded plates.
"* Deep Cracks: a reasonably accurate value of J, may be experimentally determined ifthe weldment is treated as a monolithic specimen. The model is constrained toplastic deformation of the weldment only.
Similar experiments with SE(T) specimens indicate that applied J,, relative to plain
plate general yielding, is reduced in both under and overmatched welds. The greatest
reduction in J1 is by the undermatched weld because in tension the width of the joint
allows high strains to concentrate into slip bands along the weld-plate fusion line. Since
crack tip strains were kept low, the applied J, was reduced.
Finite element analysis of four a/W ratios (0.05 to 0.2) was performed by Cray. In
bending, overmatched welds needed less toughness than an undermatched weld to resist
fracture for a shallow crack. Increasing crack depth mitigates this feature. Tension testing
results were inconclusive and enforced the dependence of applied J, on the mismatched
weld-plate fusion line deformation concentration.
Dong and Gordon investigated the effects on J, of SE(B) specimens. Monolithic
bend specimens made of entirely of weld metal and base metal were compared to
overmatched square groove welded samples. Results for a 0.1 a/W qualitatively agreed
with Cray's double-V results and indicated no correspondence. A deep crack specimen
with a 0.5 a/W showed good correspondence with the homogeneous weld metal case.
36

This is probably the result of the deep crack yielding being confined to the intact weld
metal, the net ligament. This suggests that accurate estimates of J, for a deeply cracked
undermatched weld is possible by this procedure. Undermatching and bending load
concentrate deformation strains in the weldment. The limit of the homogeneous model
occurs when the weldment has a very narrow ligament such as a narrow groove weld or a
double-V weld with a small bevel angle. In these cases the yielded zone of the ligament
can exceed the width of the weld causing a breakdown of the model.
Wide Plate Specimens
Wide plate specimens typically contain semi-elliptical surface cracks that are
comparable to those found in structural service, making them ideal for scale testing.
Specimens are modeled as either having a through crack or a semi-elliptical surface crack.
Only one analytical model exists for the semi-elliptical surface crack while there are several
variations of the through crack. Both crack models use a symmetrically located crack on
the centerline of the weld and loading perpendicular to the weld axis.
Reed and Petrovski estimated J, of semi-elliptical surface flaws for a double-V
butt welded HSLA-80 plate. Three matching ratios ranging from 37% undermatched to
170/ overmatched and two crack depth to plate (a/t) ratios, 0.2 and 0.4 were used.
Undermatched welds with small cracks experienced a rapid increase of J1, especially when
strain exceeded 1.5 times the yield strain. The overmatched weld with small cracks
reached a plateau and remained constant for strains of 1.5 times the yield strain. Deep
37

crack specimens (a/t of 0.4) of under and overmatched welds both indicated a high J1
regardless of weld metal matching. Overmatched welds shield shallow cracks but this
advantage disappears as crack depth increases.
Weidian performed finite element analysis of 37% overmatched wide plate with a
square groove joint containing a middle crack severing 20% of the plate width. Effects of
varying the weld layer width or distance between the plates on J, were studied. J, was
found to react inversely with weldment width. This is apparently because the wider
weldment removes the highly strained lower strength plate material from the crack tip.
Dong and Gordon performed finite element analysis of wide plates having the same
weld/crack geometry as Weidian but with a wider range of conditions. Specimens having
cracks with an a/W of 0.05 and 0.2 were studied. Undermatched weldments experienced
a slightly higher applied J, in the weld compared to overmatched welds. A panel of base
plate material was found to closely approximate applied J, for all weldments studied. The
ratio of the weld layer thickness to crack length (2h/2a) did not significantly effect J, for
the range studied. The last two results were explained by an earlier detailed analytical
study performed by Zhang, whom studied the effects of strength and strain hardening
mismatch on applied- J1.
Zhang performed finite element analysis of wide plates with square butt welds
containing cracks that were 40% of the panel width. The concept of equivalent yield
38

stress and equivalent strain hardening exponent were introduced. These values were
defined as those that produce the same applied J, in a monolithic wide plate having the
equivalent constitutive properties as in the welded plate. If the weld layer thickness
exceeds 1.5 times the crack length then the equivalent yield strength nearly equals the weld
metal yield strength. In the limit, equivalent yield stress approaches the base metal yield
stress as the ratio of weld layer thickness to crack length (2h/2a) approaches zero. This
data agrees qualitatively with that of Dong and Gordon for estimations of J, from
weldments with 2h/2a <0.3 and the J1 for a monolithic wide plate with base metal
properties.
The Ramberg-Osgood strain hardening exponent, n, approaches I for linear
elasticity and infinity for perfect plasticity. When the weld layer thickness exceeds 1.5
times the crack length the equivalent hardening exponent will approach the value of the
weld metal. Conversely, in the limit, the equivalent hardening exponent will approach the
value of the base metal. This is especially true of undermatched welds where the
equivalent hardening exponent changes at a greater rate than the overmatched case.
Barsom and Rolfe have said that a wide variety of martensitic steels exhibit strain
hardening rates that is inverse to the yield strength. This leads to the notion that the
strength of an undermatched weld is overmatched with respect to strain hardening. The
same analogy holds true for overmatched welds.
39
Some limitations of the concept of equivalent yield stress and equivalent strain
hardening exponent were cited by Read and Petrovski. Experimentation with shallow
cracks in welded panels indicated that under certain conditions J, did not increase as
anticipated with increased strain because of the accumulation of strains at the fusion
boundary. This condition precludes the use of the equivalent Yield stress and equivalent
strain hardening exponent concept because the applied J, in the monolithic panel will not
reach a plateau for the same reason. The accumulation of strains at the fusion boundary of
the welded panels causes J, to plateau because of asymmetric in plane yielding that occurs
between net and gross section yield. This poses a restriction on the application of Zhang's
concept to cases where J, has yet to plateau or cannot reach plateau. Thus, models are
limited to either having cracks of adequate depth to prevent plateauing, or, shallow cracks
at loads not much above the limit load.
Analytical and experimental results indicate the concentration of strain will occur in
the material of lowest material strength in a transversely loaded weldment. Remote
bending and tension tests indicate that the driving force for fracture, J, in an
undermatched weld increases at a much faster rate with increasing plastic strain than for a
crack in an overmatched weldment. The effects of this phenomena are augmented by the
crack's geometry and location in the weldment. The most important of these include
cracks that are either shallow with respect to the specimen thickness (less than 30% of
thickness) or small with respect to gross load bearing cross section (less than 4% to 21%
area reduction).
40

Experiments studying the effects of weld strength mismatch on weld metal
toughness have produced data that shows no significant toughness variation with strength
matching ratio. If this is correct, then undermatched welds could reduce the factor of
safety against fracture for a structure. This area needs more research since plate material
typically exhibits toughness that is inversely related to strength.
Ovtrmatched weldments generally require less weld metal toughness than
undermatched welds to prevent crack initiation. The equivalent yield stress and strain
hardening exponent appears valid provided J1 cannot plateau with increasing strain. Since
cracks in structures are fairly shallow, the use of this concept in structural safety
assessments is limited.
Investigation of wide plate tension specimens have indicated the following:
" Small or Shallow Cracks: cracks in welds are shielded from high applied J,.Overmatched weldments reach a plateau at a certain plastic strain level after whichno appreciable change in J1 occurs. Undermatched weldments do not exhibit aplateau. If cracks in a structure can be kept small then overmatched welds requireless toughness to prevent failure than undermatched welds. If simplified schemes forJ, existed, it would be reasonable to select a toughness greater than the J, plateaufor the largest expected crack size in a structure.
" Deep or Large Cracks: The rate of increase of J, with increasing plastic strain is lessrapid for cracks in overmatched welds than in undermatched welds. A J, plateaudoes not occur in this case. J, can be estimated by treating the weldment as amonolithic plate with an equivalent yield stress and strain hardening exponent(Zhang, et al). The equivalent properties become those of the plate as the platethickness becomes small compared to the crack length. Conversely, the equivalentproperties become those of the weldment when the weld thickness becomes largecompared to the crack length.
41

The Energy Concept of Cracking
Fracture toughness, the ability to withstand plastic deformation without fracture
even in the presence of a flaw, is a function of the material's response to local stress and the
geometry of the flaw producing the high localized stresses [Flinn, Trojan, 1981]. Material
fracture that occurs with local yielding has an energy balance: energy input (work) to
produce fracture _Ž surface energy (ys) of fracture surfaces + energy of plastic
deformation (yp). y. is the surface energy per unit surface area (J/m2) and may be
considered to be the energy required to break the atomic bonds and create the new
surfaces. y, is the energy of plastic deformation per unit volume (J/m 3 ). The energy input
is the difference between external work supplied and the stored elastic energy at the onset
of fracture. Work is the area under the true stress - true strain curve. Energy required for
fracture is the sum of Ys multiplied by fracture surface area and yp multiplied by the volume
of plastic deformation. Typically, y' - yp /10i so fracture toughness is essentially
proportional to yp, the ability to undergo plastic deformation before failure.
Stress concentration is the result of geometry effects such as flaws and drillings.
The concentration is analytically modeled by a stress concentration factor, K,. As a flaw
approaches the geometry of a sharp crack, the concept of stress concentration breaks
down and methods of fracture mechanics are required.
Fracture mechanics takes into account the difficulty in accurately measuring the
energy required for plastic deformation of the crack tip. The material's fracture toughness
42

is proportional to the crack tip plastic deformation energy. Stress intensity factor, KI is
used to determine the fracture toughness of most materials. It is similar to the stress
concentration factor Ko, but the two are not equivalent. For a given material, catastrophic
failure occurs when the stress intensity factor reaches a critical value, K,,. This value of
Kic is called the fracture toughness. K,, and K, are related in a manner similar to the
relation of stress and tensile strength: K, represents the level of stress intensity at the
crack tip (stress dependent) and K1C represents the highest value of stress intensity without
fracturing (material dependent).
An expression that relates fracture toughness, crack size and fracture stress is:
a,= Kf/Y
where af is nominal fracture stress, K1c is fracture toughness, Y is a geometry constant
and a is crack length. Crack size is measured differently depending on whether or not it
cuts a free surface. An edge crack has a length of a while a center crack has a length of
2a.
The previous equation may be rearranged to form an expression for stress intensity
as follows:
K = Y V ,
where a is the nominal applied stress. Stress is linearly related to the stress intensity
factor. Y does not account for the geometrical parameter.of thickness. Thickness is
important because it determines if a specimen is in plane stress or plane strain. Thin
specimens are typically in plane stress and yield a higher value of fracture toughness, K,.
43

This is because of a large plastic zone at the crack tip. Thick specimens are typically in
plane strain and exhibit a lower fracture toughness which approaches a minimum value
referred to as plane strain fracture toughness, KIc. The transition from plane stress to
plane strain fracture toughness is a function of the material's yield strength. Empirical
results show that plane strain conditions prevail when:
tt2. OYc
where t is thickness and ays is yield stress. This relationship must be satisfied to ensure
accurate calculation of K1c, especially for a specimen of unknown fracture toughness. If
the sample is tested and calculated K1c does not satisfy the previous expression, then
thicker test samples must be used and the experiment repeated.
Fracture toughness is inversely related to yield strength. High strength steels used
to minimize component size and weight are highly stressed and thus have increasingly
smaller tolerance for flaws.
Cyclic stress loading can cause premature failure of a component. Small flaws are
initiated and grow until the critical crack size is reached, then rapid failure occurs. This
type of rapid failure after a time in service is at worst, dangerous and at best, detrimental
to consumer confidence. Critical crack size is directly related to KIC or inversely related to
yield stress. Crack detection (with normal nondestructive testing methods) becomes very
difficult with high strength steels.
44

S-N diagrams depicting nominal stress loading versus the number of cycles can be
interpreted as having two separate parts. The first part would plot crack initiation versus
number of cycles and the second part would plot crack growth versus number of cycles.
Cracks may initiate from flaw-free regions or from defects such as inclusions. The
variation in initiation is usually responsible for data scatter for failure as a function of
cycles.
In a defect free region, cracks may initiate from minute stress concentrators caused
by localized plastic deformation on particular slip bands. After repeated cycling small
cracks appear at the intersections of the local deformation bands. Minute imperfections
such as surface scratches may greatly shorten or even eliminate the crack initiation phase.
Surface finish is therefore an important factor in total fatigue fife of an item.
Internal defects simply shorten the number of cycles required to initiate cracking.
As the crack grows, crack propagation is categorized by its direction of travel. Early
stages of propagation are dependent on the orientation of the grain and is referred to as
stage I cracking. The cracks propagate on specific crystallographic planes and
subsequently, tend to change directions quickly. As the crack grows it becomes
independent of grain -orientation and travels normal to the applied stress, even through
grain boundaries. This is referred to as stage II cracking and is predominant during
propagation fife. Stage II crack growth is often indicated by distinct surface markings
called fatigue striations.
45

It is generally accepted that the rate of crack propagation is a function of the stress
intensity factor, K,. For most engineering alloys, the rate of propagation da&dN can be
expressed as function of the range of the stress intensity, AK,, that is experienced by the
crack during the stress cycle:
da CxdN
where C and m are material dependent constants. AK1 is calculated using
AKI = AK 1,. -AK11 (s - s.Y i-
where it can be seen that AK, is not a constant value but varies with crack length, a.
Submarine High Strength Steel Fatigue Research
High strength steels used in submarine pressure hulls are required to endure high
stress, low cycle fatigue. Several new high strength alloys were compared to HY-80 steel
in the cycle-life range of 10,000 to 100,000 cycles [Rolfe, Haak, Imhof, 1964]. Candidate
fatigue strengths, the strain range necessary to cause failure, were compared and found to
vary as a function of the number of cycles, composition, and yield strength of the steel.
The investigators state that a high strength steel's resistance to fatigue failure should be
proportional to the yield strength of the steel in order to reduce susceptibility to cracking.
Experimental results showed significant differences in fatigue strength for plain
base plate and GMAW welded plate. Generally, the welded plate exhibited fatigue
strength better than plain base plate above 10,000 cycles to the maximum of interest,
100,000 cycles. Fatigue analysis was conducted and compared using predictions
46

developed by Morrow, Langer and Manson. Langer and Manson's fatigue predictions are
based largely on monotonic tensile properties and did not predict failure as well as
Morrow. Morrow's methods best agreed with experimental results because his equations
were both empirically derived and they take into account the material's cyclic stress-strain
properties such as hardening or softening. Morrow defined total strain as the sum of
elastic and plastic strain. He showed that while the plastic and elastic strain versus cycles
log-log plots were linear, the total strain versus cycles log-log plot was not. Plastic strain
fatigue loading has a much greater effect on the reduction of fatigue life. The slope of the
plastic strain versus cycles log-log plot for HY-80 is three to four times the elastic strain
versus cycles log-log slope.
Chemical Compositional Effects of Titanium
Transition temperature is a function of cleavage fracture stress. Cleavage fracture
initiation is associated with the population of titanium bearing, nonmetallic inclusions
located in the region of coarse cleavage facets [DeLoach, Franke, 1989]. Inclusion
initiated fracture occurred at the sites on the order of 0.5 gtm to 1.0 gtm. Titanium content
as little as 0.01 % weight resulted in inclusion fracture sites. A increase of 0.004%
titanium increased inclusion size by 0.05 pm. Several cases of inclusion initiated cleavage
fracture in crack opening displacement and Charpy vee notch specimens. Previous studies
had identified lath pocket size as the controlling feature for martensitic and bainitic steels
and weldments. DeLoach and Franke have found that packet size alone can cause
47

dislocation pile-ups. Packet size is proportional to the effective grain size of the
microstructure and hence promotes microcrack initiation through dislocation pile-up.
Nonmetallic Inclusion Effects on Fatigue Life
Experiments with SMAW, GMAW, ESW, and ES butt welded joints indicated low
cycle fatigue life is indirectly related to the volume fraction of nonmetallic inclusions in the
weldment [Dziubinski, Adamiec, Brunne, 1987]. The inclusions can act as stress
concentrators. The microstructure was aiso found to influence fatigue life but to a lesser
degree. SMAW as deposited weldments displayed the lowest cyclic plasticity and the
highest volume percent of nonmetallic inclusions; 0.56%. Interestingly, the ES welds
which had the least favorable deposited microstructure displayed the greatest cyclic
plasticity. This can be attributed to the very low (0.15%) nonmetallic inclusions which
was less than the base plate.
A Comparison of Over and Undermatched Welding
Low cycle fatigue tests of full section beam specimens of HY-130 steel GMAW
and SMAW butt joint with undermatching and overmatching weld metal yield strength:
Overmatching of base metal is done through tradition with little or no experimental data to
support the requirement [Czyryca, Werchniak, 19911. Overmatching of high strength
steels results in decreased toughness and increased propensity for weld metal cracking.
Welding of higher strength steels becomes difficult because the narrowing in range of
welding parameters that dictates yield strength and toughness. In particular, weld metal
cooling rate is proportional to yield strength but inverse to toughness. Undermatched
48

welds allow for maximum heat input which results in high deposition rates. Fabrication,
rework and repair costs are reduced because the higher heat input yields better fusion,
reducing sidewall and interbead fusion defects. Overmatched systems must use low heat
input in order to attain the required cooldown rates for higher yield weld metal.
Undermatched welding systems could increase producibility and efficiency through:
"* expanded welding parameters
"* increased weld deposition rates
"* increased selection of weld filler metals.
Weld metal matching is defined in terms of 0.2% offset yield strengths of base
plate and weld metal. Low cycle fatigue experimental results with overmatched and
undermatched HY-130 plates indicated crack initiation and propagation occurring in the
parent material and not the weld. This result held true for SMAW and GMAW welds, in
as-welded and flush ground reinforcements. Similar experiments with HY-100 also
indicated no preferential site for crack initiation.
Extensive high cycle fatigue testing of construction steels by the American Welding
Society has indicated that fatigue properties may not be dependent on the yield strength of
the base metal or weld metal. Instead, structural joint performance was related to joint
design and the quality of welding workmanship. Undermatched samples with the weld
reinforcement removed exhibited fatigue lives approximately identical to equivalent
overmatched beams. Stress concentrations, residual stresses, and alignment of pieces were
49

the dominant factors, not yield strength. Local stress concentrations caused by fabrication
defects, joint geometry, and metallurgical flaws are most likely to occur in the vicinity of a
weld, namely the HAZ or fusion zone. Residual stresses influenced the crack growth path
of undermatched specimens. Crack growth did not propagate perpendicular to the applied
bending stress but instead deviated toward the HAZ.
Crack Initiation of Thick Specimens
Empirically plotted low cycle fatigue growth rate of large through thickness cracks
and small surface cracks as a straight line against logarithmic AJ, the cyclic J integral and
AK, , the strain intensity factor [Hatanaka, Fujimitsu, 1988]. The relation was relatively
independent of material in both cases. Accurate predictions of specimen fatigue lives were
found to be slightly conservative, especially as N became large, about 10,000 cycles.
Crack initiation to failure ratio, Ni / Nf, is about 0.15 - 0.20 and is material
independent.
In low strength, high ductility steels fatigue cracks nucleate at or near the grain
boundary in response to lines of intense slip deformation impinging ferrite grains. In
quench and tempered high strength steels the crack initiates at an inclusion site with very
little evidence of slip lines. This difference in crack initiation behavior makes microcracks
easier to detect in the quench and tempered steels.
50

Log da/dN versus log AJ plots of high strength, low ductility steels indicate
through thickness cracks have a greater slope than surface cracks. Therefore the system
tends to minimize the potential energy required for a given change in crack length.
Fatigue Life versus Yield Strength
Empirical results with transversely loaded butt welds indicated that fatigue life
decreased with the increase in material yield strength when the estimated mean stress
exceeded the yield strength of the base metal [Ohta, Maeda, Suzuki, 1992). Mean stress is
defined as the sum of the applied stress and the residual stress. Residual stresses as high as
cy exist in large scale structures, thereby reducing the usable applied stress loading.
Increased fatigue strength may be attained through development of 1) TMCP steels
with yield to tensile stress ratios near one, and 2) welding consumables with lower
transformation temperatures. TMCP steels offer high tensile strength with relatively lower
yield strength. The authors cite an example of structural application where tensile strength
is the determining factor in material design strength. Fatigue strength requirements then
dictate that yield strength be minimized. Low transformation weld consumables reduce
residual stress by allowing weldment expansion during cooling.
Temperature Effects on Low Cycle Fatigue
Constant strain low cycle fatigue tests were conducted on butt welded joints at
20°C and 350°C [Gregor, 1987]. The low temperature case required less cycles to crack
initiation, Ni, and less cycles to failure, Nf, than the high temperature case. However, the
51

difference in cycles, AN = Nf - Ni, was less for the high temperature case. The rate of
crack growth, Aa/AN, was greatest for the high temperature case.
Reheating Effects on Multipass Welds
Primary factors that determine a weld metal's microstructure and mechanical
strength are cooling rate and chemical composition [Oldland, Ramsay, Matlock, Olson,
1988]. The complexity of multipass welds is caused by subsequent passes of weldment
causing reheating and thermal cycles which change the weld's microstructure and
mechanical properties significantly. Heat input and cooling rate can be controlled and
monitored to produce the weldment's desired strength and ductility. Experimentation by
Krantz indicated significant losses in weldment strength caused by the presence of
increased volume fractions of lower strength microconstituents like bainite and ferrite after
partial reausteninization of the weldment. Further reheating of the weldment produced a
further reduction in strength.
Experimentation by Strunck investigated the detrimental effects of increased heat
input on toughness of a multipass weld. Strunck suggests that toughness can be improved
in multipass welds by controlling weld variables that increases the fraction of reheated
weldment above A, by subsequent weld passes, thereby decreasing the fraction of
as-deposited weld metal. Lower heat inputs, causing faster cooling rates, increased weld
toughness by reducing the amount of proeutectoid ferrite in the weld metal. Other
researchers believe the increased toughness is the result of weld metal microstructure
refinement and tempering.
52

HAZ Toughness and Tensile Properties in HSLA
Welding thermal cycle simulations and detailed microstructaral study of
instrumented single pass weldments of HSLA-80 were conducted [Scoonover, 1988].
Heat input had different affects on the various HAZ microstructures but in general heat
input was inverse to the strength of the weld metal.
The HAZ can be broken down into six zones by their microstructure. Moving from the
unaffected base plate to the fusion line are the following regions:
"* inner and outer subcritical or tempered"* inner and outer intercritical or partially transformed"* grain refined"* grain coarsened
Four of the six zones had Charpy transition temperatures higher than the base
plate. Three zones, outer subcritical, intercritical, and grain-coarsened, had toughness
inferior to the base plate. The grain-coarsened zone had a transition temperature above
specification and was described as a local brittle zone (LBZ). The investigators likened the
HAZ to a composite material where the mechanical properties of each region are
influenced by those of the surrounding regions and by its own and their relative sizes.
Undermatched welds were criticized because concentration of strain in the HAZ can cause
low strain fracture unless the microstructure at the crack tip exhibits high toughness. The
intercritical HAZ microstructure in HSLA-80 had the lowest strength in the HAZ and a
toughness lower than the base plate.
Weldment Cooling Effects on Strength and Toughness
Cooling rate of weld metal is a major influence on the microstructure and
mechanical properties of the weldment [Blackburn, Franke, 1992]. Heat input, interpass
53

and preheat temperature, and consumables can be controlled to yield (within reason) zhe
desired weldment strength and toughness. Heat input also effects the size and
microstructure of the HAZ. The investigators pointed out some shortfalls of traditional
cooling rate calculations used for thick, high strength steel plate that should be considered.
Specific points not covered in the cooling rate equation include the following:
" Multipass welding is a special case of three dimensional cooling with a constantlychanging heat sink. The mass of weld metal and joint geometry change with eachpass.
"* Weld metal deposition rate (lb of weld metal / inches of travel) is affected by wirediameter, travel spee I and current. For a given current, thinner weld wire has agreater deposition rate than large diameter wire.
"* Weld joint configuration (type of intersection and dimensions) and position ofwelding other than bead on plate and butt welds.
"* Use of backing bars on single side butt welds act as a heat sink and increase coolingrate.
The authors further state that cooling rate data and weld metal properties are very
case specific. Accurate extrapolation of data is not possible. Cooling rate calculations
should only be considered a tool to establish trends when all other variables are held
constant.
Undermatched Double V Butt Welds
Experiments with undermatched double v butt welds in the elastic-plastic range
were performed to investigate the weld metal's behavior during loading [Lee, Luxmoore,
1990]. A defect was simulated with a slit machined across the weld and transverse to the
54

loading. Undermatched double v welds experience stress concentration when loading
reaches the weld's plastic strain limit. Under tensile loading, the weldment initially reaches
yield. Continued loading causes strain concentrations at the center of the weld because the
base plate acts like a rigid body. The effects of the strain concentrations on a defect
cannot be predicted accurately. Small edge cracks that may escape NDT can become the
initiation site for failure. The enhanced yield strength of the HAZ may be responsible for
locally increased strain concentrations. The authors chose to use crack tip opening
displacement (CTOD) because it was easiest to measure experimentally. CTOD is related
to the strain concentration at an elastic-plastic crack tip. During tensile testing the parent
plates rotated as rigid bodies, symmetrically about the crack plane during the phase of
constant CTOD. An in-plane slip line field was apparent as additional plastic regions
formed in the base plate areas adjacent to the weld. The CTOD increased rapidly once the
plastic zone reached the far boundary opposite the crack, indicating that the main
mechanism for large crack openings was the formation of conventional in-plane slip line
fields.
5% undermatched specimens displayed virtually no effect on CTOD during tensile
loading. There was no significant transition in CTOD behavior as weld metal net section
yielding gave way togross yielding. The overall was similar to homogeneous edge
cracked specimens.
55

A 26% undermatched specimen showed significant impact on CTOD behavior
during tensile and bend testing. Net section yielding of the weld was reached well before
yielding of the base plate occurred. Rigid body rotation of the base plate under restraint
and the joint geometry created a concentrated transverse stress field. In tension, yielding
begins in the center of the plate and extends outward, forming a triangular shaped crack tip
slip band. In bending high strain occurs in the weld metal near the fusion zone and low
strains occur at the base plate just after weld yielding. which at the fusion area and cause
local yielding of the base plate. High shear strains contribute to gross yielding of the base
plate.
For highly undermatched specimens in both tension and bending, testing indicated
a temporary shielding effect on the deformation of weld metal at the notch. Gradual strain
build up and yielding of the base metal was found to be the cause. The shielding effect
temporarily reduces the CTOD until the base plate reaches gross section yield. CTOD will
then increase and the specimen one again behaves as a homogeneous material because
crack geometry has become the dominant feature.
56

Chapter 3
Experimental
Specimen Acquisition
HY-80 and HY- 100 steel base plates were obtained from General Dynamics,
Electric Boat (EB) Division of New London, Connecticut. EB performed the fitup,
welding, tensile testing and nondestructive testing (NDT). All machine work was
performed by Custom Machine, Inc. of Woburn, Massachusetts.
The High Hardness Armor (HHA) was obtained from the Army Research
Laboratory (ARL) of Watertown, Massachusetts. ARL performed the fitup, welding and
initial specimen shaping into 1.5 x 12 inch rectangles by water jetting. All subsequent
machining of the HHA specimens was performed by Custom Machine, Inc. of Woburn,
Massachusetts.
HlY Base Plates
Four HY plates, two of HY-100 and two of HY-80 were welded using
undermatched and overmatched weld metal. The base plates were multipass welded by
semiautomatic gas metal arc welding (GMAW) process. The torch speed, rate of torch
oscillation and wire feed rate were manually set and then automatically controlled while
the arc length was manually adjusted throughout the process. Preheat and interpass
temperature controls were used. Regulation of the interpass temperature and cooldown
rates established the final tensile characteristics of the weldments. The HY- 100
57

overmatched weldment required two twelve hour soaks at 3500 F. Appendix B contains
photocopied data sheets used to record the welding parameters during the process. Table
4 lists selected welding data from the process. Weld bead configurations are indicated in
Figures 4 through 7. Nominal base plate metallurgical compositions are listed in Table 5
and are enclosed in Appendix B.
The final dimensions of each of the four welded HY plates were 30 inches long, 16
inches wide and 1 inch thick. The single vee weld bead was along the 30 inch length.
Backing plates and run-on / run-off tabs were used on the plates and removed before
delivery. Transverse and longitudinal (relative to rolling direction) tensile specimens were
taken from each of the two types of base plate. This data is presented in Table 6. Ten
inches of welded length was removed and machined into all weld metal tensile specimens.
This specimen data is presented in Table 6. Figure 14 shows the final dimensions of the
HY specimens.
HHA Base Plates
The HHA specimens were welded using the manual downhand GMAW process.
Each specimen consists of a single vee with lands welded with two passes. A total of
fifteen plates was provided by ARL, five each of undermatched and overmatched plates,
two plain base plates, and one plate with an arc strike. Figure 15 shows the final
dimensions of the HHA specimens.
58

NDT of HY and HHA
Radiographic NDT was performed on both the HY and HHA weldments. All
plates passed standard examination by qualified inspectors at Electric Boat and ARL
respectively.
Specimen Surface Hardness Testing
Rockwell C scale surface hardness testing of the base metal, heat affected zone and
weld metal was performed on samples of each specimen. The weld reinforcement was
machined away and the surface polished to reduce the variance of the readings. The
results are shown in Figures 12 and 13.
The HI-IA exhibited some deviation from the advertised value of Rockwell C-52.
During conversations with ARL it was discovered that surface hardness is not normally
performed on HHA. The HAZ is subject to decarburization which reduces hardness
significantly. ARL recommended machining away 0.030 inch of thickness in order to
reach the RC-52 hardness. This was not performed because a qualitative study of the
hardness profile was desired, not to mention the impracticality of machining such a hard
material.
Specimen Sizing for Testing
The criteria used for sizing of the specimens were as follows:
# test section loading must be within the capacity of the test machine* specimen should fail in a reasonable time, say 10,000 - 100,000 cycles* specimen must fit in the hydraulic chuck
59

"* test the full thickness of the weld, therefore only width is variable"* elastic loading of the weldment"* avoid stress concentrators such as pin mounting holes
Estimation of the endurance limit for the welded specimens was accomplished by
reviewing experimental data of high strength steel fatigue experiments and generic
textbook information. The endurance limit for steels below 200 ksi are about 0.5 tensile
strength. Other data suggests that the endurance limit for martensiticn microstructural
steels range from 0.23 to 0.47 tensile strength. This lower value suggests martensite's
brittleness and sensitivity to cyclic stress loading. The mean endurance limit corresponding
to steels with a tensile strength not exceeding 200 ksi is about 0.45 tensile strength. The
conservative approach then is to design the specimens for loading exceeding the higher
loading of 0.5 tensile strength.
Figures 14 and 15 shows the HY and HHA specimen design and dimensions. All
specimens were sized to reflect the maximum hydraulic chuck load of 50,000 pounds
force. Empirical data from high strength steel fatigue testing indicated a loading of 80% to
90% of tensile strength produced failure in 10,000 to 100,000 cycles. This translates to
16.7 minutes and 2.7 hours respectively at 10 cycles per second (cps). Tables 7 and 8
show the sizing data and tensile specimen results used in computing the 800/6 and 90%
tensile strength load window for the HY and HHA specimens, respectively.
Weld reinforcements were machined off all HY specimens to allow proper use of
the CSLM. The irregular surface of the reinforcement would not permit positioning the
60

objective lens close enough to the specimen. The weld surface was then smoothed with
600 grit wet/dry silicon carbide and then polished with a commercial polishing compound
and buffing wheel. Two of each type of HHA sample were tested with intact weld beads.
The welds were such that the microscope could be used even over the uneven surface.
Reinforcements were removed from all other welded HHA specimens and the test areas
polished as described for the HY plates.
All samples had a crack starter slit electrical discharge machined (EDM) into the
test area to initiate crack growth through stress concentration. The slit was machined
transverse to the loading and centered across the weld or test area. The slit dimensions
were selected by examining fatigue experimental data using crack starters. The selected
depth of the slit was 5% of the thickness, length was twice the depth, and width was 0.020
inches as this was the minimum reasonably attainable by the EDM process. Figures 14 and
15 show drawings of the EDM slits used on the HHA and HY specimens.
Description of Equipment
A computer controlled electro-hydraulic MTS tensile testing machine was used to
fatigue test the welded specimens. The machine has a 100,000 pound load capacity but
this is limited by the hydraulic chuck's 50,000 pound force maximum load when in the
cyclic fatigue mode.
61

The pulsating tension loading profile was used. This loading function is sinusoidal
and ideally ranges from a minimum stress of zero to the maximum stress. Operational
constraints prevented the zero stress minimum, therefore a "tension-tension" loading
resulted. The minimum attainable load is approximately 10% of the total range. The mean
load is the average of the minimum and maximum loads. Maximum load is the sum of the
minimum load (MTS "setpoint") and load range (MTS "span"). Setpoint and span were
input at potentiometers mounted in the load drawer of the cabinet. The span setting
required using the potentiometer dial while the setpoint and maximum load forces are
displayed as linear voltage signals. The maximum signal is 10 volts. For example, a
50,000 pound maximum load corresponds to 10.0 volts. The 10% minimum or setpoint is
5,000 pounds force corresponding to a 1.0 volt signal. The span is the difference of
maximum and setpoint and is therefore 45,000 pounds which is a 9 volt signal.
The cyclic loading frequency is adjustable and is indirectly related to the load
range. A high frequency is desirable in order to reduce testing time but it must not be
allowed to over range the hydraulic system. The 50,000 pound load range restricted the
frequency to a maximum of about 15 cycles per second. A frequency of 12 Hz was
selected because the machine exhibited better load control. A counter drawer in the
computer control system recorded the number of completed cycles and stopped the
machine when a set number of cycles had been completed. This allowed for precise
control and accounting of the number of cycles between observations.
62

A stroke sensor also stopped the machine if the specimen separated. This interlock
had to be overridden each time a new specimen was loaded or the hydraulic pumps would
trip off line. A stroke controller potentiometer had to be zeroed to indicate the new null
position of the chuck for each test.
Experimental Procedure
The hydraulic pump and control cabinet were energized and allowed to run and
warm up for 15 minutes prior to testing. Each piece was marked for consistent mounting
in the hydraulic chucks. Pieces were first centered and mounted squarely in the upper
chuck using a square. The upper cross head was then unlocked and lowered until the
specimen engaged the lower chuck. The lower chuck was raised at least one inch above
its bottom stop to ensure freedom of movement during cycling. Once the specimen was
aligned in the lower chuck, it was hydraulically locked in place.
Test parameters such as cycle frequency, load span, and load setpoint were set for
the specimen. The counter drawer's preset number of cycles was set to the desired number
of cycles. The stroke potentiometer zeroed and the machine started. Peak load is then
monitored and fine adjusted using the setpoint potentiometer.
Initially, four HY specimens (one of each category) were tested "as is" to verify the
integrity of the specimens and the procedure. Subsequently, the same four HY specimens
were slotted by EDM process on a trial basis and retested to determine the range of cycles
63

to crack initiation and failure. The HY-80 overmatched specimen was cycled to failure to
verify timely fatigue life. Based on this performance, all HY samples were EDM slotted
using the original dimensions of the slit and tested at low cycle, high stress loading. HHA
samples were EDM slotted straight away using the 5% depth guideline. HHA testing
commenced without any trial period. Tables 9 through 33 lists cycle information, crack
growth, and video mapping for each specimen.
HHA specimen tensile testing was performed using the MTS test machine. A
moderate strain rate was used and the results plotted for the HRA 70 and 100 series
specimens. This was necessary to ascertain the proper load window during testing.
Elastic loading of the specimen required the use of the weld tensile strength vice the base
material. Figure 42 shows the tensile test stress - strain plots.
Observation With the CSLM
All specimens were examined at regular intervaJs under the CSLM. The
examination consisted of the following steps:
"* visually inspect the specimen for overall condition ad cracking outside of the EDMslit test area
"* load and setup video cassette tape for the specific specimen"* scan the specimen with low power setting (lOX and 20X) to ascertain global crack
locations"* position the slide to observe the lower right comer of the EDM slit"• start the video recorder"• scan with low and higher powers to identify cracks, look for shadows and use the
pencil beam 40X lens to pinpoint highlight small areas of interest"* when a crack is identified allow the video recorder time to record it, pause the
recorder and measure crack length"• if desired use thermal imager for "photographs""* if desired use surface profilometry for crack plate level changes
64

* use direct on screen linear measurement or if the crack is too long use stagecoordinates, note magnification setting for conversion to microns
* restart video recorder and scan for more cracks, examine corners in acounterclockwise fashion
* pause video recorder and remove specimen, record video counter* insert next specimen for examination and repeat steps
Cracks were measured in one of two ways. Once identified, short crack length was
measured directly using the CSLM's measuring function. Unfortunately, this method is
only for dimensions "less than the size of the monitor" because cross hairs marking the
desired length can only be moved within the confines of the monitor's field of view. The
second method used for the longer cracks involved traversing the length of the crack and
recording the coordinates displayed by the stage position indicator. Crack length was
determined by assuming a linear profile and applying the Pathagorean theorem. The
conversion for stage units to microns is 1.0 pRm = 0.001 stage units. The stage position
display indicated seven significant digits, four of which were to the right of the decimal.
65

Chapter 4
Results and Discussion
Crack Growth
HY EDM slit virgin base plates were tested to compare their crack growth
characteristics with the welded specimens. Tables 17 and 26 list the crack length as a
function of cycles and Figures 24 and 33 show the crack growth for the HY virgin base
plate specimens
All welded HY and HHA specimen crack growth data is shown in Tables 9
through 33. All crack growth as a function of cycles is shown in Figures 16 through 40.
Crack Initiation From the EDM Slit
All HY specimens exhibited EDM slit crack initiation. The HHA specimens with
the reinforcement intact showed no cracking. HHA specimens with the reinforcement
removed were similar to the HY specimens.
All cracks initiating in the EDM slit occurred near the comer and on the side of the
slit running parallel with the axis of loading, in other words, the short sides of the slit. The
EDM slit comers were not perfectly square but instead had a small radius. Cracks
appeared to form where the radius met the straight edge of the slit, a stress concentration
area. The cracks propagated at approximately 30 to 45 degrees off the horizontal. As the
cracks propagated, the plastic zone grew. Eventually, the crack fanned out into many
branches which would either continue to propagate as a separate branch crack or simply
66

arrest. The majority of branches arrested after a short distance. Generally, each specimen
had two very long cracks formed on either side of the slit. The cracks propagated at about
the same rate and reached the specimen's edges approximately together. Two smaller
cracks at the opposite comers propagated for a short distance and then arrested as the
strain release by the larger cracks became dominant.
Mixed failure modes were indicated by a change in elevation across the crack's
width. Elevation change was apparent by shadows when scanning across the crack and
then by detailed profilometry which indicated mean elevation changes of three to five
microns. Figure 54 shows the profilometry function and the corresponding change in
mean elevation across a crack.
The small width of the specimens prevented the cracks from reaching the fusion
line. No observations were made concerning overmatched weld crack arresting properties
orui ' matched weld's propensity to crack along the fusion line.
The HY specimens taken to total failure all indicated fatigue striations with a slight
reduction in area around the ductile failure area which had the cup-cone shape. The HHA
specimens failed dramatically with little reduction of area and exhibited signs of brittle
fracture. Three of four HHA specimens with the weld reinforcement intact failed after a
short number of cycles and in a brittle manner. No cracking was detected during the
testing prior to failure. All the HHA failures occurred along the weld fusion line with no
67

assistance from the EDM slit. HHA specimens with weld reinforcement removed and
polished exhibited modest crack propagation properties.
Crack Growth Versus Cycles
Cracks were measured at discrete steps in the number of cycles. Crack growth data
versus cycles for all specimens is shown in Tables 9 through 26. All cracks were measured
linearly from origin to tip. It became impractical to measure true crack lefigth especially as
the crack propagated and meandered. Definite measurement also became difficult as the
plastic zone grew and the crack tip became less definite as the result of fanning out.
Elevation changes and mixed modes of failure were evident. Slip and cleavage
were apparent and caused the downstream load side of the crack to drop in elevation. The
elevational gradient was directly related to the number of cycles and the proximity to the
initiation point of the crack. The gradient decayed to zero at the crack tip. The area
behind the crack tip was comprised of a plastic zone that grew in size with the number of
cycles. Figure 43 shows a small, low cycle, sharp crack tip propagation. Figures 51 and
56 show a large high cycle plastic zone and tip branching.
The overmatched HY-100 specimens showed evidence of hard protrusions pushing
above +he surface as cycles increased. Figures 52 and 53 show the profilometry and views
of two of the asperities. These may be very hard weld inclusions but this was not verified.
68

Chapter 5
Conclusions and Recommendations
Conclusions
" In the HY 80 tests, undermatched specimens failed between 14,500 and 16,500cycles, overmatched specimens failed between 21,000 and 26,500 cycles, and thebase plate failed at 20,000 cycles. In the HY 100 tests, undermatched specimensfailed between 16,500 and 21,000 cycles, the overmatched specimens failed between17,800 and 21,600 cycles and the base plate failed at 32,000 cycles. All "as welded"HHA specimens failed between 8,000 and 17,500 cycles. HHA ground 1OOS-1welds failed at 10,000 cycles and the 70S-6 welds failed at 17,500 cycles.
" Ground HY 80 base plate had a crack growth rate less than the undermatchedspecimens but greater than the overmatched specimens. The ground HY 100 baseplate had a crack growth rate less than both the undermatched and overmatchedspecimens.
" All HY specimens exhibited the cycles to initiation to cycles to failure ratio, Ni / Nf -0.1 - 0.2. Ground HHA specimens required many more cycles than the HY steel toinitiate cracking and then failed quickly. HHA "as welded" specimens showedsudden brittle failure after only 2,000 cycles, showing the importance of flushgrinding weldments to reduce stress concentrations.
"* All HY specimens exhibited the anticipated initial linear crack growth rate followedby a nonlinear increasing growth rate. All specimens formed four cracks, two ofwhich propagated to the edges and ultimately caused failure. These dominant crackswere on opposite sides of the slit and grew at a similar rate. The smaller crackswere essentially arrested as the dominant cracks strain release exceeded the strainenergy needed for propagation.
"* The tremendous undermatching of the HHA specimens allowed the base metal act asan elastic member and the weldment as an plastic body. Crack initiation occurredbetween 2,500 and 7,500 cycles for the IOOS-I and 70S-6 welds respectively. The70S-6 welded specimens exhibited the least crack growth rate. This is most likelybecause of the higher toughness compared to the 1OOS-1 consumable.
"* HHA crack growth rate was generally erratic but demonstrated an initial lineargrowth with subsequent nonlinear growth rate.
69

* 85% tensile loading was correct for this low cycle experiment. All specimens failedin a reasonable number of cycles, the maximum being 32,500 cycles required by theHY 100 base plate. This load was globally elastic but stress concentration at themachined slit produced plastic strain which led to cracking in a very low number ofcycles. Crack initiation was observed at 2,000 cycles in the HY 80 specimens.
* The confocal scanning laser microscope was a valuable tool for this research andshould be continued to be explored as a tool for other experiments. In situexamination increased productivity with no loss of resolution or accuracy. Videorecordings and still shots taken during the examination process can be used forreexamination or teaching purposes.
Experiment Comments
"* More specimens should be run to allow a meaningful statistical treatment of the data.A small population of samples, while sufficient for this experiment, is not adequatefor global conclusions.
"* Surface preparation of the specimens is very important. Little in the way of fatiguecrack growth was gleaned from the HHA specimens that were left with intact weldreinforcements (as welded). All other specimens that were ground flush andpolished performed well in regards to observing cracks. Another method worthconsideration is etching of the test section to allow easier observation.
"* A drawback of the confocal scanning microscope (CSLM) is the limited depth offield available during real time viewing. Specimens with an uneven surface are verydifficult to read because the laser illumination can only scan a small section at a time(several hundred square microns depending on the magnification) and theillumination is oblique to the surface, making it difficult to examine irregularsurfaces. Memory scan is a viable option but it is time consuming, requiring on theorder of one to two minutes per viewing.
Recommendations for Future Work in This Field
* Use the CSLM for in situ examination of fatigue crack growth in an in-service shiphull girder. A long term study could detect and track cracking over the life of a shipoutfitted with a designated test area that was equipped with telemetry to monitorand record data such as strain and load frequency. This experiment could providevaluable information before catastrophic fatigue cracking of the hull.
70

00 00 00
00U: .X I I0'ý
0 ~ P 0 00 0
-,ao~~ a to ~0 ' 0S> U,
*= 0
Of 0w 0000 0- 06
00 cc
i-4-.0
C4 *
71-

Material / Parameter Weld Yield Weld Tensile Tensile YieldStrength Strength Mismatch Mismatch
(ksi) (ksi) (A%) (A%)
HY-80 Overmatched 99 105 1.9 13.8
HY-80 Undermatched 83 95 7.8 4.6
HY- 100 Overmatched 122 127 7.6 14.0
HY- 100 Undermatched 91 99 16.1 14.9
Table 2: Mismatch Values for HY Specimens
Material / Parameter Approximate Approximate Yield TensileWeld Yield Weld Tensile Mismatch Mismatch
Strength Strength (A%) (A%)(ksi) (ksi)
HHA 70 S-6 16.25 20.5 1,130.7 1,119.5Specimens
HHA 100 S-1 21.5 27.0 830.2 825.9Specimens
Table 3: Mismatch Values for HHA Specimens
72

Parameter HY-100 HY-100 HY-80 HY-80Undermatched Overmatched Undermatched Overmatched
Type of Weld GMAW GMAW GMAW GMAW
Shield Gas 95%Ar, 5%CO., 95%Ar, 5%CO, 95%Ar, 5%CO, 95%Ar, 5%CO,
Shield Gas 45 35 45 42Flowrate (scth)
Number of Passes 17 27 13 26
Wire Type 100S-1 120S-1 100S-1 100S-1
Wire Diameter 0.05 0.045 0.06 0.045(in)
Polarity DCRP DCRP DCRP DCRP
Interpass 300 200 400 225Temperature (F)
Preheat 275 200 400 200Temperature (F)
Average Wire 300 320 175 310Feed Speed (ips)
Weld Current 280 280 340 280(Amps)
Weld Voltage 25.5 25 25.5 25.5(Volts)
Torch Travel 6.55 13.98 4.75 11.20Speed (ips)
Average Heat 65.39 30.45 109.5 38.5Input (kJ/in)
Torch Oscillation 0.5 0 0.625 0Width (in)
Note: HY-100 Overmatched plate soaked at 3500 F for 12 hours.
Table 4: Selected Welding Parameters for HY Specimens
73

Composition HY-80 HY-100 HHA(% weight)
C 0.17 0.20 0.31
Cr 1.16 1.5 0.52
Mn 0.30 0.1-0.4 0.96
Mo 0.24 0.4 0.55
Ni 2.92 3.2 1.10
P 0.018 0.025 0.015
S 0.023 0.25 0.003
Si 0.19 0.25 0.39
A] - - 0.025
Table 5: Base Plate Nominal Material Chemical Composition
Sample Material Relative Direction Tensile Strength Yield Strength(PSI) (PSI)
HY-80 Transverse 101,000 87,000
HY-80 Longitudinal 103,000 90,000
HY-100 Transverse 119,000 107,000
HY-100 Longitudinal 118,000 105,000
Table 6: HY Base Plate Material Properties
74

Base Metal Material / Property I HY-S0 I HY-100
Tensile Strength (ksi) 102 118
80 % Tensile Strength Load (ksi) 81.6 94.4
Maximum Test Area (inA2) 0.61 0.53
90% Tensile Strength Load (ksi) 91.8 106.2
Maximum Test Area (inA2) 0.55 0.47Ntes: 1) MTS Hydraulic Chuck Capacity is 50,000 Pounds
2) Set HY Test Area to 0.5 in'
80 % Tensile Strength Load (kp) 40.8 47.2
90% Tensile Strength Load (kp) 45.9 53.1
Table 7: HY Specimen Sizing and Loading Data
Weld Material / HEA HJAProperty 70S-6 100S-1
Approximate WeldTensile Strength 20.5 27.0
(ksi)80 % Weld Tensile 16.4 21.6Strength Load (ksi)
Maximum Test 0.328 0.43Area for 80% (inA2)
90%/ Weld Tensile 18.45 24.3Strength Load (ksi)
Maximum Test 0.37 0.48Area for 90% (inA2)
Notes: 1) MTS Hydraulic Chuck Capacity is 50,000 Pounds2) Set HHA Test Area to 0.1875 in2
80 % Weld Tensile 3.08 4.05Strength Load (kp)
90% Weld Tensile 3.46 4.55Strength Load (kp)
Table 8: HHA Specimen Sizing and Loading Data
75

Sample Number: HY-80 Overmatched - 1
Number Video Crack Position Crack Length CommentsCycles Counter (UR, LRUL,LL) (pm)
8,000 - UR - Cracks visible, lOX magUL glass
20,000 - UR 7/64"UL 7/64"
22,000 - UR 9/64"UL 1/8"
24,000 - UR 11/64"UL 9/64"
25,000 - UR - At edge, turning comerUL
26,000 - UR 1/8" up respective sideUL
26,460 - UR FailureUL
26,460 000-142 LL 170 Post failureLR #1 86LR #2 70
Note: All cracks propagated 45 degrees off horizontal
Table 9: HY 80 O/M-1 Specimen Crack Data
76

Sample Number: HY-80 Overmatched -2
Number Video Crack Position Crack Length CommentsCycles Counter (UR, LR,,UL,LL) (4im)
1,500 142-432 "- UL Initiating
2,500 432-1256 UR 22.3 Picture, 40XUL 48.9
3,500 2201-2614 UR 22.4UL 85.6
4,500 4103-4357 LR 41.4UR 82.5UL 102.4
6,000 5824-5959 LR 167.7UR 124.7UL 132.4
8,500 6332-6517 LR 222.7UPR 240.2UL 169.1
11,000 6848-7129 LR 381.5UR 317.6UL 186.1LL 550.3
13,500 7606-7813 LR 842.1UR 351.4UL 191.0LL 946.8
18,500 8224-8544 LR 1968.3UR 356.2UL 191.0LL 1133.4
23,500 Not Used LR 4301.1UP, 361.1UL 190.1LL 4110.5
Table 10: HY 80 O/M-2 Specimen Crack Data
77

Sample Number: HY-80 Overmatched -3
Number Video Crack Position Crack Length CommentsCycles Counter (UR, LRUL,LL) (rIm)
2,000 1256-1736 --
3,000 2614-3330 UR 43.0UL 33.9LL 36.4
4,000 4357-5304 LR 110.6UR 50.7UL 34.5LL 70.0
5,500 5959-6224 LR 195.2UR 88.0UL 90.3LL 136.9
8,000 6517-6717 LR 247.6UR 119.4UL 277.5LL 234.4
10,500 7129-7404 LR 363.4UR 181.9UL 280.8LL 433.3
13,000 7813-8021 LR 599.1UR 182.8UL 281.1LL 747.4
18,000 8544-8908 LR 1672.8UR 193.9UL 283.0LL 1693.7
23,000 Not Used LR 3261.4UR 195.0UL 285.0LL 3252.6
Table II: HY 80 O/M-3 Specimen Crack Data
78

Sample Number: HY-80 Overmatched -4
Number Video Crack Position Crack Length CommentsCycles Counter (UR, LRlUL,LL) (gm)
2,000 1736-2201 UR #1 8.5UR #2 8.5
3,000 3330-4103 LR 33.4UR #1 67.0UR#2 75.5
LL 58.2
4,000 5304-5824 LR 78.7UR 106.5 UR #1 and UR #2 mergedLL 81.9
5,500 6224-6332 LR 84.8UR 113.7LL 82.2
8,000 6717-6848 LR 93.0UR 309.0LL 92.6
10,500 7404-7606 LR 150.1UR 666.8UL 731.0LL 109.3
13,000 8021-8224 LR 150.1UR 1093.3UL 1161.7LL 114.5
18,000 8908-9305 LR 155.0UR 2438.8UL 2506.2LL 114.5
21,000 Not Used LR 158.1UR 3887.0UL 3962.7LL 116.3
Table 12: HY 80 O/M-4 Specimen Crack Data
79

Sample Number: BIY-80 Undermatched -1
Number Video Crack Position Crack Length CommentsCycles Counter (UR, LR1UL,LL) (4m)
1,500 000-400 -
2,500 1623-2111 LR 16.6 LL InitiatingUR 100.9UL 49.7
3,500 3633-4533 LR 37.3UR 210.4UL 257.1LL 15.1
4,500 6138-6746 LR 61.4UR 320.8UL 343.0LL 79.5
5,500 8649-8904 LR 108.1UR 381.1UL 345.7LL 115.9
8,000 9642-9911 LR 261.3UR 507.5UL 465.6LL 122.4
10,500 10709- LR 551.511021 UR 1114.4
UL 550.5LL 126.4
13,000 11519- LR 694.211719 UR 1626.9
UL 1495.2LL 129.0
15,000 12436- LR 694.212617 UR 2072.0
UL 2209.2LL 129.0
16,500 Not Used LR 694.2UR 3090.5UL 3868.4LL 129.0
Table 13: HY 80 U/M- I Specimen Crack Data
80

Sample Number: HY-80 Undermatched -2
Number Video Crack Position Crack Length CommentsCycles Counter (UR, LRUL,LL) (4m)
1,500 400-707 -
2,500 2111-2748 LR 51.7 Picture, 40XUR 57.9UL 44.1LL 44.0
3,500 4533-5141 LR 160.5UR 200.1UL 83.6LL 50.2
4,500 6746-7700 LR 219.1UR 246.6
UL 194.2LL 155.2
5,500 9044-9323 LR 349.2UR 270.2UL 243.0
LL #1 178.9LL #2 66.1
8,000 9911- LR 539.110157 UR 273.4
UL 751.1LL #1 182.0LL #2 68.3
10,500 11021- LR 1700.311201 UR 376.9
UL 1216.9LL #1 207.5LL #2 119.4
13,000 11719- LR 2952.812132 UR 384.3
UL 2509 8LL 26S.7 LL#1 and LL#2 merge
14,550 -- Failure
Table 14: HY 80 U/M-2 Specimen Crack Data
81

Sample Number: HY-80 Undermatched -3
Number Video Crack Position Crack Length CommentsCycles Counter (UR, LRUL,LL)_ (Anm)1,500 707-915 -
2,500 2748-3254 --
3,500 5141-5741 LR 175.5UR#1 30.9UR #2 61.3
UL 69.71,500 7700-8117 LR #1 204.9
LR #2 43.5UR #1 60.7UR #2 66.0
UL 170.8LL 105.2
5,500 8904-9044 LR #1 568.2 LR #1 and #2 mergeLR #2 45.1UR #1 90.9UR #2 151.7
UL 184.5LL 190.9
8,000 10157- LR 796.910501 UR#1 91.7
UPR #2 160.0UL 339.1LL 492.8
10,500 11201- LR 1349.511350 UR #1 102.5
UR #2 171.8UL 429.5LL 628.0
13,000 12132- LR 2073.812326 UR#1 102.1
UR #2 195.7UL 491.7LL 1236.0
15,000 12617- LR 2662.512803 UR #1 179.4
UR #2 296.7UL 499.2LL 1963.4
Table 15: HY 80 U/M-3 Specimen Crack Data
82

Sample Number: HY-80 Undermatched -4
Number Video Crack Position Crack Length CommentsCycles Counter (UP, LILUL,LL) (4im)
10,130 915-1623 UR 255.9LL 306.2
11,130 3254-3633 LR 137.2UR 1308.5UL 166.6LL 1256.7 Picture: plastic zone 20X
12,130 5741-6138 LR 252.5UR 1749.8UL 174.2LL 1455.1
13,130 8117-8649 LR 260.4 Weld toe crack formedUR 2043.1 BranchingUL 177.3LL 1716.0
14,130 9323-9642 LR 263.9UR 2490.7UL 177.7LL 2106.3
16,350 - - FailureUR LL Cracks reachededge at 16,000 cycles.
Table 16: HY 80 U/M-4 Specimen Crack Data
83

Sample Number: HY-80 Virgin Base Plate
Number Video Crack Position Crack Length CommentsCycles Counter (UR, LRIJL,LL) (4im)
2,500 10501- LR 31.9 Picture, IOOX10709 UR 26.5
UL 50.5LL 33.7
5,000 11350- LR 86.5 Large plastic zone11519 UR 125.5
UL 136.2LL 64.9
7,500 12326- LR 363.912436 UR 183.8
UL 281.6LL 144.0 Picture, 20X
12,500 12803- LR 1260.712948 UR 196.9
UL 1133.9LL 171.7
18,500 Not Used LR 3109.6UR 197.8UL 3069.5LL 182.5
20,000 Not Used LR 4750.7UR 199.5UL 4624.3LL 189.6
Table 17: HY 80 Virgin Base Plate Specimen Crack Data
84

Sample Number: HY-100 Overmatched -1
Number Video Crack Position Crack Length CommentsCycles Counter (UR, LIRUL,LL) (Itm)
160 -
1,500 000-145 -
3,000 531-836 UL 78.8 Picture 40X
4,500 2118-2943 UL 149.4
6,000 4905-5708 LR 119.2UR 124.0UL 197.4LL 149.3
7,500 7945-8137 LR 355.1UR 124.0UL 223.3LL 242.9
10,000 8529-8745 LR 700.2UR 216.2UL 325.4LL 524.1
12,500 9705- LR 1246.410159 UR 217.1
UL 338.3LL 985.5
17,500 10859- LR 2681.811107 UR 218.1
UL 351.4LL 1090.7
20,500 11615- LR 3992.011947 UR 221.9
UL 351.5LL 3400.2
21,500 Not Used LR 5295.0 LR crack reached edgeUR 226.8UL 351.7LL 4121.9 Failure imminent
Table 18: HY 100 O/M-I Specimen Crack Data
85

Sample Number: HY-100 Overmatched -2
Number Video Crack Position Crack Length CommentsCycles Counter (UR, LRUL,LL) (Am)
8,230 145-348 -
9,730 836-1221 LR 438.9UR 320.0 Picture, lOXUL 747.5
11,230 2943-3627 LR 776.5UR 335.9 UR UL large plastic tipUL 1096.1 zones
12,730 5708-7300 LR 1018.6 Picture: asperities alongUR 338.1 lower edge, IOOXUL 1434.2
14,230 8137-8406 LR 1114.3UR 364.4UL 1646.6
16,730 8845-9141 LR 1672.6UR 372.3UL 2721.2
19,230 10159- LR 3299.310446 UR 376.6
UL 3602.7LL 50.1
21,630 Failure
Table 19: HY 100 O/M-2 Specimen Crack Data
86

Sample Number: HY-100 Overmatched -3
Number Video Crack Position Crack Length CommentsCycles Counter (UR, LRUL,LL) (gm)
1,500 348-531 -
3,000 1221-1730 UL 12.5LL 14.8
4,500 3627-4146 LR 94.8UR 84.3UL 71.1LL 65.8
6,000 7300-7635 LR 195.2UR 160.8UL 137.4LL 71.5
7,500 8406-8535 LR 338.9UR 201.3UL 233.1LL 89.7
10,000 9357- LR 594.29705 UR 209.2
UL 482.3LL 106.4
12,500 10446- LR 1003.710624 UR 219.3
UL 874.0LL 106.4
17,500 11107- LR 2355.411319 UR 219.3
UL 2169.9 Picture, lOXLL 113.6
20,500 11947- LR 3697.212301 UR 223.2
UL 3601.1LL 113.6
21,500 Not Used LR 4060.3UR 246.1UL 5022.6 UL crack reached edgeLL 113.6 Failure imminent
Table 20: HY 100 O/M-3 Specimen Crack Data
87
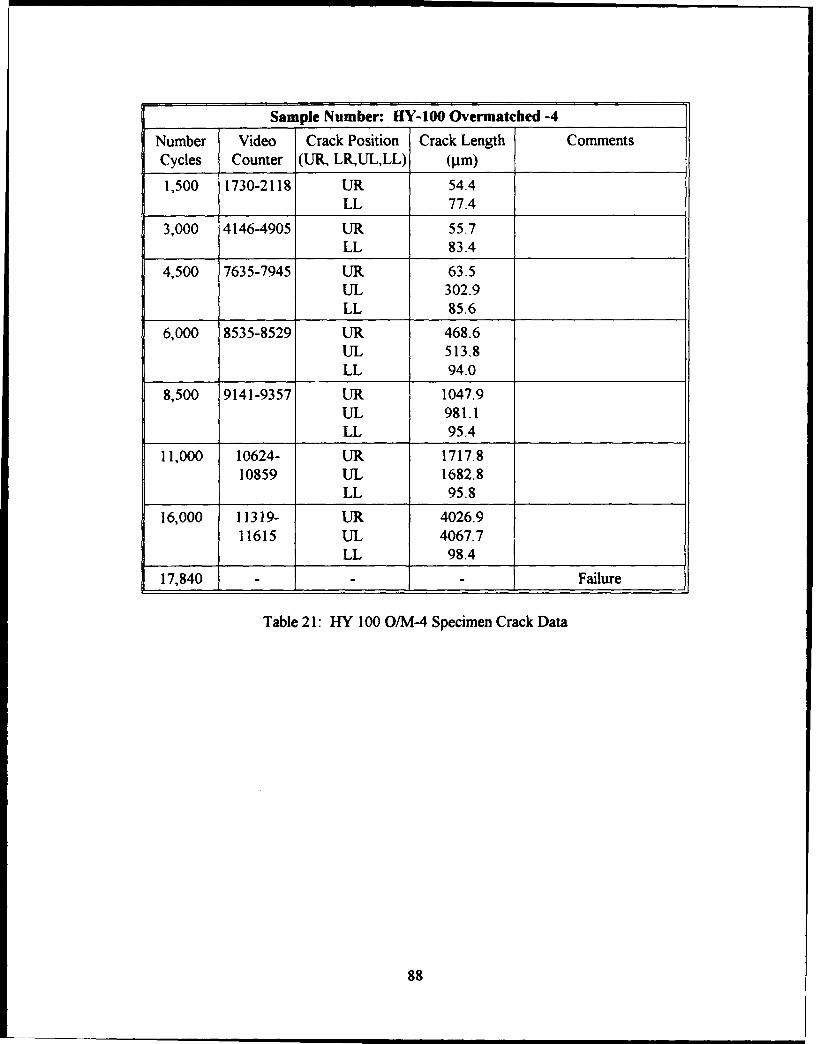
Sample Number: flY-100 Overmatched -4
Number Video Crack Position Crack Length CommentsCycles Counter (UIR, LRUL,LL) (Im)
1,500 1730-2118 UR 54.4LL 77.4
3,000 4146-4905 UR 55.7LL 83.4
4,500 7635-7945 UR 63.5UL 302.9LL 85.6
6,000 8535-8529 UR 468.6UL 513.8LL 94.0
8,500 9141-9357 UR 1047.9UL 981.1LL 95.4
11,000 10624- UR 1717.810859 UL 1682.8
LL 95.8
16,000 11319- UR 4026.911615 UL 4067.7
LL 98.4
17,840 - - Failure
Table 21: HY 100 O/M4 Specimen Crack Data
88
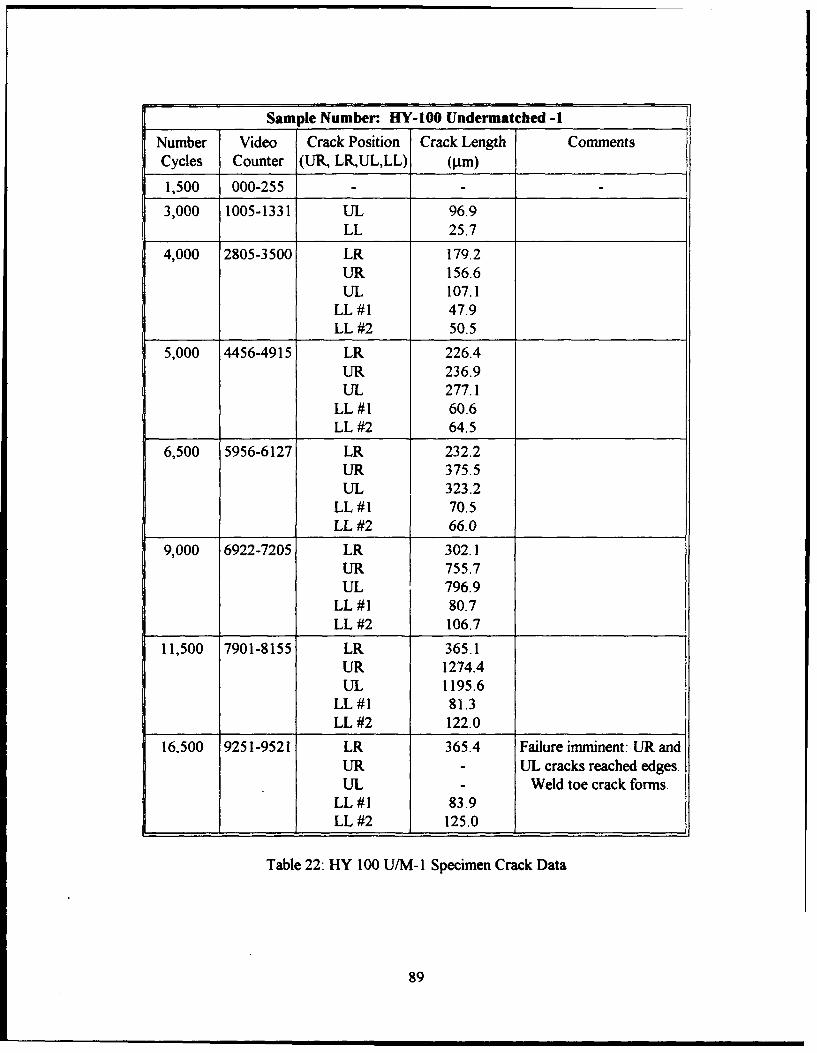
Sample Number: HY-100 Undermatched -1
Number Video Crack Position Crack Length CommentsCycles Counter (UIR, LRUL,LL) (gim)
1,500 000-255 -
3,000 1005-1331 UL 96.9LL 25.7
4,000 2805-3500 LR 179.2UR 156.6UL 107.1
LL #1 47.9LL #2 50.5
5,000 4456-4915 LR 226.4UR 236.9UL 277.1
LL #1 60.6LL #2 64.5
6,500 5956-6127 LR 232.2UR 375.5UL 323.2
LL #1 70.5LL #2 66.0
9,000 6922-7205 LR 302.1UR 755.7UL 796.9
LL #1 80.7LL #2 106.7
11,500 7901-8155 LR 365.1UR 1274.4UL 1195.6
LL #1 81.3LL #2 122.0
16.500 9251-9521 LR 365.4 Failure imminent: UR andUR - UL cracks reached edges.UL - Weld toe crack forms.
LL #1 83.9LL #2 125.0
Table 22: HY 100 U/M-I Specimen Crack Data
89

Sample Number: HY-100 Undermatched -2
Number Video Crack Position Crack Length CommentsCycles Counter (UR, LRUL,LL) (4im)
1,500 255-503 -
2,500 1331-1810 UL 55.6 Picture 40X
3,500 3500-3426 LR 65.7UL 90.0LL 87.7
4,500 4915-5259 LR 133.0UR 66.9UL 156.3LL 90.1
6,000 6127-6256 LR 245.7
UR 112.3UL 217.4LL 219.8
8,500 7205-7432 LR 477.5UR 250.3UL 348.9LL 489.3
11,000 8155-8441 LR 1022.4UR 261.0
UL 384.7LL 981.1
16,000 9521-9806 LR 2552.9UR 261.0UL 385.9LL 2307.4
16,500 10446- LR 2712.310845 UPR 261.0
UL 415.5LL 2609.9
18,500 Not Used LR 4452.1 LR crack at edge
UR 261.1UL 431.1LL 4256.6
Table 23: HY 100 U/M-2 Specimen Crack Data
90

Sample Number: HY-100 Undermatched -3
Number Video Crack Position Crack Length CommentsCycles Counter (UR, LRUL,LL) (tm)
1,500 503-823
2,500 1810-2217 UR 97.3UL 63.5LL 86.1
3,500 3426-4002 UR 103.6UL 89.7LL 86.9
4,500 5259-5633 UR 121.0UL 153.8LL 165.5 LL branching
6,000 6256-6431 LR 145.2UR 169.5UL 171.5LL 168.4
8,500 7432-7703 LR 292.1UR 311.8UL 187.4LL 653.6
11,000 8441-8804 LR 831.0UR 420.3UL 211.6LL 1362.4
13,500 9806- LR 1590.810014 UR 459.9
UL 212.9LL 2042.0
16,000 10845- LR 2555.811209 UR 461.6
UL 214.8LL 2600.4
19,000 Not Used LR 5102.5UR 468.7UL 197.6
_ LL 5431.8 LL at edge
Table 24: HY 100 U/M-3 Specimen Crack Data
91

Sample Number: HY-100 Undermatched -4
Number Video Crack Position Crack Length CommentsCycles Counter (UR, LRUL,LL) (Am)
1,500 823-1005 -
2,500 2217-2805 LR 51.5UR 39.3UL 56.7
4,500 4002-4456 LR 82.4UR 131.3UL 96.5LL 84.4
5,500 5633-5956 LR 123.2UR 172.4UL 142.6LL 106.9
7,000 6431-6556 LR 222.6UR 292.8UL 233.0LL 129.9
9,500 7703-7901 LR 280.0UR 466.4UL 488.4LL 153.6
12,000 8804-9007 LR 334.3UR 700.0UL 727.3LL 158.8
16,000 10014- LR 1012.610325 UR 1175.1
UL 1711.2LL 164.7
18,000 11209- LR 1267.711557 UR 1206.9
UL 2316.8LL 166.5
21,000 Not Used LR 2820.7UR 1370.5UL 4629.4LL 169.1
Table 25: HY 100 U/M-4 Specimen Crack Data
92

Sample Number: HY-100 Virgin Base Plate
Number Video Crack Position Crack Length CommentsCycles Counter (UR, LRUL,LL) (AM)
2,500 6556-6920 LR 48.0
5,000 9007-9251 LR 108.4UL 40.0
7,500 10325- LR 153.810446 UL 90.2
LL 60.2
12,500 11557- LR 211.011653 UL 275.3
LL 66.2
17,500 Not Used LR 382.1UR 23.5UL 452.2LL 120.3
22,500 11653- LR 974.411853 UR 201.9
UL 831.6LL 244.6
27500 11853- LR 1772.712053 UR 260.7
UL 1868.2LL 249.4
32500 12053- LR 3015.912253 UR 260.7
UL 2873.4LL 249.4
Table 26: HY 100 Virgin Base Plate Crack Data
93

Sample Number: HEA 100 S-I
Number Video Crack Position Crack Length CommentsCycles Counter (UR, LRUL,LL) (jAm)
2,000 00-131 LL 4.2
7,000 935- 1243 LL 27.2
8,080 - - Brittle failure along lowerI- _weld fusion line
Table 27: HHA 100 S-I Specimen Crack Data
Sample Number. HEA 100 S-2
Number Video Crack Position Crack Length CommentsCycles Counter (U1, LR, UL,LL) (Am)
5,000 131-438 LR 68.2UR 97.3UL 130.4LL 454.1
10,000 1243- LR 75.01643 UR 145.1
UL 131.1LL 450.0
10,880 - - Brittle failure along lowerweld fusion line
Table 28: HHA 100 S-2 Specimen Crack Data
94

Sample Number: lHA 100 S-4
Number Video Crack Position Crack Length CommentsCycles Counter (UR, LRLUL,LL) (gm)
2,500 438-551 UR 17.7UL 45.6
7,500 1643 - LR 98.31910 UR 345.6
UL 452.0LL 82.1
10,000 1910- LR 105.62347 UR 846.9
UL 1112.7 Picture 40XLL 85.0
Table 29: HHA 100 S-4 Specimen Crack Data
Sample Number: HEA 70 S-I
Number Video Crack Position Crack Length CommentsCycles Counter (UR, LRUL,LL) (tm)
5,000 00 - 403 None
10,000 935- 1225 None
10,620 -- - Brittle failure along upperI_ _ I_ I weld fusion line
Table 30: HHA 70 S-I Specimen Crack Data
Sample Number: HHA 70 S-2
Number Video Crack Position Crack Length CommentsCycles Counter (UR, LRUL,LL) (Im)
7,500 403 -630 UR 35.1
12,500 1225- UR 50.81500
17,500 1829- LR 35.5
2110 UR 80.8
Table 31 I-1:HA 70 S-2 Specimen Crack Data
95

Sample Number: HHA 70 S-4
Number Video Crack Position Crack Length CommentsCycles Counter (UP, LRLUL.LL) ()tm)
5,000 630-757 UL 16
12,500 525-704 LR 125.3UR 54.4UL 44.9LL 198.9 Picture 40X
17,500 241 -454 LR 383.7UR 85.5UL 61.4LL 623.9
"Tiable 32: HHA 70 S-4 Specimen Crack Data
Sample Number: HHA 70 S-5
Number Video Crack Position Crack Length CommentsCycles Counter (UR, LRUL,LL) (gm)
7,500 757 -933 None -
12,500 1639- UR 145.4 UR forking1829 UL 114.0
LL 84.0
17,500 2323- LR 21.12740 UR 335.2
UL 333.2LL 98.5
Table 33: HI-IHA 70 S-5 Specimen Crack Data
96

Category Parameter / Data
Manufacturer / Model Lasertec CorporationModel I LM 11 Scanning Laser
Microscope
Resolution 0.25 mm with Nikon Optiphot 100x0.95NA Objective
He-Ne Laser Wavelength 6328 Angstroms
Laser Output Power 1.50 mW at laser body0.14 mW at exit of 5x 0.INA objective
Scanning Frequency Vertical: 60 HzHorizontal: 15730 Hz
Interlace: 2:1
Minimum Measurement Unit 0.01 mm
Measurement Repeatability +/- .03 mm (3 s)
Table 34: Selected CSLM Operating Parameters and Data
Objective Lens Magnification on Field of View Scan LineMagnification Video Monitor (PAD) Density
{pro/line)
10 600 410x325 0.68
20 1,200 205 x 163 0.34
30 2,400 125 x 82 0.17
50 3,000 82 x 65 0.14
80 6,000 51 x41 0.08
100 6,000 41 x 32 0.07
Table 35: CSLM Image Display Information
97

Y
y
Crx
f+
Ya Butt Weld
Y
CompressmIon Tension
0 Distribution of o'1 long YYv
c Distribution of or, Along XX
Figure 1: Residual Stress Distribution in a Butt Weld
98

14
LU
oC.
LU
z ~I A E4SL E S R~ J T.J I C o L E Q fN
Fiu420n u a c L m z V r u J~ mae T n ie Sr n t
99 LYNT

1 23 4 56
Figure 3: Common Weldment Heat Affected Zone (HAZ) Characteristics.
Zone 1: Weld Metal"* as-cast microstructure"* peak temperature above 1650 C* toughness is situationally dependent. Microstructurally inferior to the plate but may
have better toughness through enriched chemistry
Zone 2: Grain Coarsened HAZ"* large prior austenite grains"* peak temperature above 1100 C"* toughness is much worse than plate
Zone 3: Grain Refined HAZ"* small prior austenite grains"* peak temperature above 900 C"* toughness close to or better than plate
Zone 4: Intercritical HAZ"* duplex microstructure"• peak temperature above 700 C"* toughness depends on grain size and microstructural constituents
Zone 5: Subcritical HAZ"• spherodized, or microstructurally identical to plate"* peak temperature between 600 C and 700 C"• toughness depends on plate initial microstructure:
a. embrittlement in rimmed or semi-killed plate caused by strain agingb. tempering in martensitic platec. spherodized in fully killed plate
Zone 6: Base Plate
100

____ ____ ____ L 4
13 - 1-
[)98 -7
4
Figure 4: HY-100 Undermatched Specimen Weld Bead Arrangement
1 E- 1 S 15
N14, 13,1--- 12 11
Figure 5: HY-100 Overmatched Specimen Weld Bead Arrangement
13• 12 11\ 10 -- - 9
65
3,2
Figure 6: HY-80 Undermatched Specimen Weld Bead Arrangement
Figure~~~~17 7:4 38 2vrace Spcie WedBaIragmn
101

40
30 -
02 20-
-- 10-
0Position (I1u6 i inah ents)
Figure 8: HY-80 Overmatched Hardness Profile
25
20
i 15
S10
5
0Position (1/16 inch inau-ntalts)
Figure 9: HY-80 Undermatched Hardness Profile
102

40
3040
20S20
S10
0Position (1/16 inch increments)
Figure 10: HY-100 Overmatched Hardness Profile
30
25 _
. 20-
S15-
10-
5
0 .. . .. .. . . . . . . . . . . . . . . . . . . . . . . . . . . . . . . . .
Position (1/16 inch inran ents)
Figure 11: HY-100 Undermatched Hardness Profile
103

60
4030
20
10
0 .. . .. . . . .. . . . . .
Position (1/16 inc-h inemments)
Figure 12: Hardness Profile of HHA With ER1OOS-1 Consumable
60
50
U40
30 -
20
10
Pouition (1/16 inc in~amts)
Figure 13: Hardness Profile of HHA With ER70S-6 Consumable
104

2.5 1.0
3.0
S1,0 R
.8.0 14.0
.100. Inset0.100
0. 050O""�0.50
EDM Slit Inset i
Not to Scale
All Dimensions in Inches .
Figure 14: HY Specimen Design
105

1.53 0.25
.3
0.3-75 R
•6 12
0.- 100 nset -
0-7 /0 -02d
S -- 0.750
EDM Slit inset I
Not to Scale \
All Dimensions in Inches
Not to Scale
Figure 15: HHA Specimen Dimensions
106

HY •0 O/M-2 Crack Grovth5
S 4
02I-r
SI -
00 5 10 15 20 25
ThousandsCycles
LR _U, -UL 4-LL
Figure 16: HY 80 O/M -2 Crack Growth
HY 80 O/M-3 Crack Grovth
3500
3000
2500
2000
S1500 -" 1000
500
00 5 10 15 20 25
"ThousandsCycles
--*-LR -.-,_UR .--- UL LL
Figure 17: HY 80 O/M-3 Crack Growth
107

HY 80 O/M-4 Crack Grovth
U~ 4
E3
0 5 10 15 20 25ThousandsCycles
_LR -UR --- UL .. LL
Figure 18: HY 80 O/M-4 Crack Growth
HY 80 Virgin Baseplate Crack Growth5
0
0 5 10 15 20"Thousands
Cycles-. LR _.UR --.- UL ._LL
Figure 19: HY 80 Virgin Base Plate Crack Growth
108

FY 80 U/M- 1 Crack Growth5
= 4
0 0 --
00 5 10 15 20
ThousandsCycles
-LR -UR -,-UL -LL
Figure 20: HlY 80 U/M- 1 Crack Growth
HY 80 U/M-2 Crack Growth
3500
3000
S25002000
S1500
S1000500
00 2500 3500 4500 5500 8000 10500 13000
Cycles-LR --.. UR .UL --. LL
Figure 21: HY 80 U/M-2 Crack Growth
109

HY 80 U/M-3 Crack Growth3500
•, 3000
t 2500
"2000
. 1500
1000
500
00 5 10 15 20
ThousandsCycles
-LR _UR _-_UL .LL
Figure 22: HY 80 U/M-3 Crack Growth
HY 80 U/M-4 Crack Grovth3000
-, 2500
.2 2000
"= 1500
-1000
S500
00 5000 10000 15000
Cycles
-LR UR --.- UL _LL
Figure 23: HY 80 U/M-4 Crack Growth
110

HY 100 O/M- 1 Crack Growth6
-' 5
0
0 5 10 15 20 25Thousands
Cycles
_.LR ._UR _-,,_UL ...w,_LL
Figure 24: HY 100 O/M -I Crack Growth
HY 100 O/M-2 Crack Growth]
4
I-
. 3
S0
0
0 5 t 1 15 20"Thousands
Cycles
-.__LR _._UR _._UL _..._LL
Figure 25: HY 100 O/M-2 Crack Growth
III
• " " • ' l l I I0

HY 100 O/M-3 Crack GrovAh6
S5
S0S 2
• 1
00 5 10 15 20 25
ThousandsCycles
_LR _UR ,UL .=LL
Figure 26: HY 100 O/M-3 Crack Growth
HY 100 O/M-4 Crack Growth5
S40
0 0
14
00 5 10 15 20
ThousandsCycles
.LR ---UR ._,-UL _LL
Figure 27: HY 100 O/M-4 Crack Growth
112

HY 100 U/M-l Crack Growth5
• 4.-0
3
00 5 10 15 20
ThousandsCycles
-LR _UR _UL _LL
Figure 28: HY 100 U/M-I Crack Growth
HY 100 U/M-2 Crack Growth5
• 4
3
00 5 10 15 20
ThousandsCycles
-LR .UR .UL .LL
Figure 29: FlY 100 U/M-2 Crack Growth
113
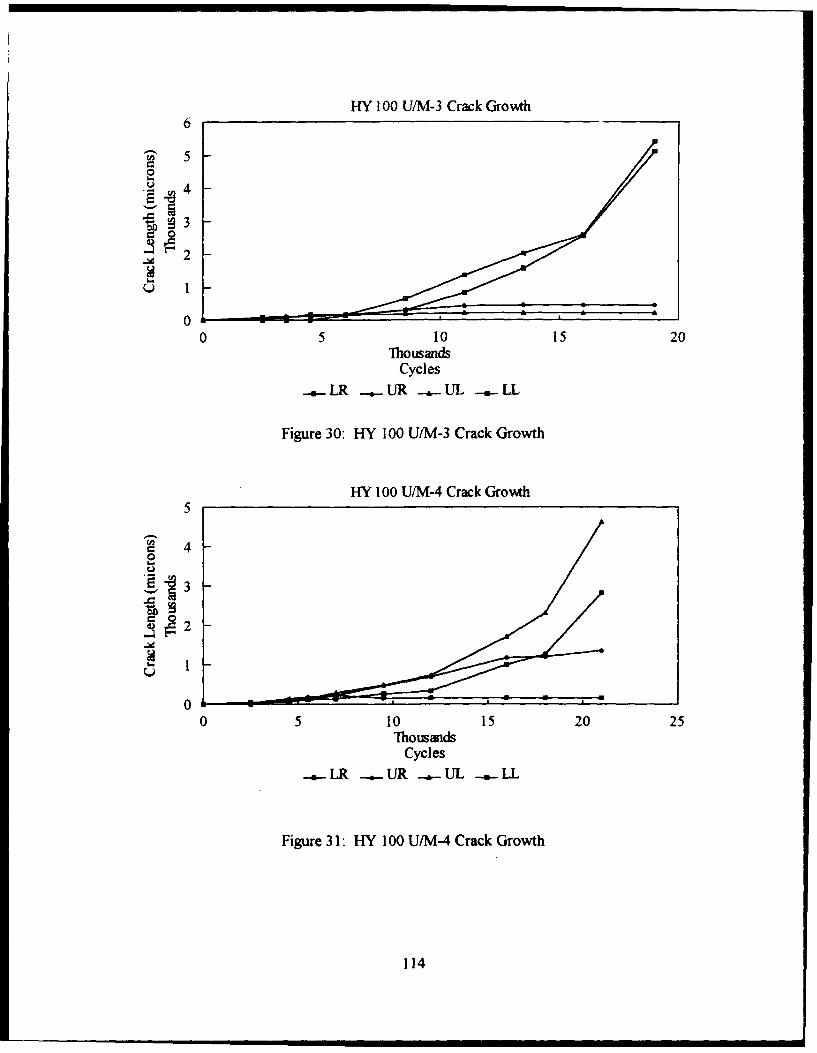
HY 100 U/M-3 Crack Growth6
S5-0
Th_~
Q 12
00 5 10 15 20
"ThousandsCycles
_LR .UR _.-UL _=__LL
Figure 30: HY 100 U/M-3 Crack Growth
HY 100 U/M-4 Crack Growth5
0
. 2 -SI--
00 5 10 15 20 25
"ThousandsCycles
LR UR _,UL -.._LL
Figure 31: HY 100 U/M-4 Crack Growth
114

HY 100 Virgin Basplate Crack Growth3500
S3000S2500
S2000
1 500
1000
5000o - - - - -,W 0 1 1
0 5 10 15 20 25 30 35"Thousands
Cycles
-LR .UR -.. UL -.- LL
Figure 32: HY 100 Virgin Base Plate Crack Growth
115

HHA 100 S-I Crack Growth30
2 2520* 20
• 5
00 1 2 3 4 5 6 7 8
ThousandsCycles
_.,-LR .UR -.- UL _ LL
Figure 33: HHA 100 S-I Crack Growth
HHA 100 S-2 Crack Growth500
400
300
_ 200
100
00 2 4 6 8 10
ThousandsCycles
.--wLR --. UR -- UL .LL
Figure 34: HHA 100 S-2 Crack Growth
116

HHA 100 S-4 Crack Growth1200
"- 1000
.o 800
"• 600
S400
U 200
00 2 4 6 8 10
ThousandsCycles
•LR .UR o UL -LL
Figure 35: HHA 100 S-4 Crack Growth
117

HHA 70 S-2 Crack Growth90
80
702
6s0
. 40
-• 30
2010
00 5 10 15 20
"ThousandsCycles
-.- LR ,.UR -_UL -LL
Figure 36: HHA 70 S-2 Crack Growth
HHA 70 S-4 Crack Growth700
600
6. 500
400
S300
200
100
00 5 10 15 20
ThousandsCycles
LR UR - UL _.LL
Figure 37: HHA 70 S-4 Crack Growth
118

HHA 70 S-5 Crack Growth
400
,- 350
o 300
• 250
S200 -
. 150 -
m 100 -
Q 50 -
00 5 10 15 20
"ThousandsCycles
•LR _..•UR -.. UL _,,LL
Figure 38: HHA 70 S-5 Crack Growth
119

1.
7F
2. Bea Exane Lesew
D :3
7. CDIaeSno : deet relce /li/h/120~
<I_
i8
,/
Figure 39: CSLM Optics Arrangement
1. Helium-Neon Laser2. Beam Expander Lenses, Two3. M~irror4. Acousto-Optic Deflector: horizontal scanning5. Polarized Beam Splitter6. Lens7. CCD Image Sensor: detects reflected light8. Motor Driven Galvano Mirror: controls vertical scanning9. Mirror10. Laser Beam to Microscope
120

0
Figure 40: HI-A 70 and HIl-IA 100 Stress Strain Diagram
121

hI,,ure 4 Irna~ze olnOOOA)-l 1usion tone, I ()OX Ob'lectix e
Figure 422 Imiage o'()~ () M-2 I *R (Crack at -".5f)(' (.cles. 4().\ ()hjlecti\e
12 22

IillUre 43, Image of I 00 I. \1-2t 1. C rack at 2.500~ ('%cle.. 0)\ OTjctb
Figure 4-1 Inia,-e of 80) U\1-2 L.R (rack- at 2.ý')() (CI&.s 40\()betr

Figure 45 Imnage of'80 Vir.in B~ase Plate I.R. 2,0 C~) 'cles. IMAOjct~
1241

EiQUre 47 Image of 80J Vin, n Base Plate I[-- 7,*ý0(v0 e.ZX )jet~
F:igure 48 Image of' 100) O/\I-2 1 ýR (rack at 8,000 ('vcles, li)U\ Ob~jectlxe
125

• , ' I •" '| I ,• 1" I e~
IT.
F.. .. .9 .... 2, L R Ct . . . I \I1 |
Il , /
,,
,,
'5o 8 VI" ' .1 , 1 1 1 ., 1 /.. *I......*2 I 6 ',' ' -
"4 r " ' -r .• ,i ..
' | '"f -'!, " *
Figure 49: Image of 100 OM-2 t R ('rack at 9.73() ('vcles. loX Ob ectixe
Figure 50 Image of'80 I.,I "N-4 [1.1 ('rack at I I. I.,30 C'ycles. I (A ()biecc;'xe
126

Figure 51 Image of 100 OGNt-2 .Asper6t Profile, 1,.73,0 ('xCcls. WONfl Ob~ectille
Fliszure 52 limage of 100 O/N1-2 A\speritv Protile. I11.7.3(0 (xclcs. 10OX Objective
127

Figure 53Image of 100 O/M-3 1.1., Prot-ile at I COU CN cl, 40N Objective
Figure 54ý Image of 100 O/MN-3, L11. at 17.500 Cyvcles, lMX Ohbjectl~e

Flizure 55 Ima-ge of 80 Virgin LR Plastic Zone at 18, ý00 C( cles. I X Oblective
-,r
129

Figure 57 Image of IIIIA 100 S-4 [L. Profile at 10.000 Cycles, 40X Objective
Figure 58 Image of Mi- IA 70 S-4 U. (rack [ orkin. at 11500 C\cles. 40X Objecti'%e
130

References
Blackburn, J. M., Franke, G. L., "Cooling Rate Analysis of HY-100 Welds in Support ofSSN-21 Construction", Carderock Division Naval Surface Warfare Center Report,CDNSWC-SME-92/16, February 1992.
Broek, D., Elemetary Engineering Fracture Mechanics, Kluwer Academic Publishers,1991.
Czyryka, E. J., and Werchniak, W., "Low Cycle Fatigue Performance of Matching andUndermatching Yield Strength HY-130 Steel Weldments", David Taylor Research CenterReport, DTRC-SME-90/45, July 1991.
Czyryka, E. J., Juers, R. L., Werchniak, W., "Low Cycle Fatigue Crack Initiation Studiesof HY- 130 Industrial Base Verification Program", David Taylor Research Center Report,DTRC-SME-91/45, August 1991.
DeLoach, J. J., and Franke, G. L., "Microstructural Features Controlling TransitionBehavior in Martensitic, High Strength Steel Weld Metals", Institute for IndustrialTechnology Transfer, 1989.
Dziubinski, J., and Adamiec, P., and Brunne, W., "A Welded Microstructure Effect onLow Cycle Fatigue", Paper presented to Structural Steel Conference, 1987.
Flinn, Richard A., and Trojan, Paul K., Engineering Materials and Their Applications,Second Edition, Houghton Mifflin Company, Boston, 1981.
Gregor, V., "Growth of Fatigue Cracks from Weldment Defects at Low Cycle Fatigue",Welding Research Institute Bratislava paper, 1987.
Goodwin, G. M., "Hot Cracking: Measurement, Mechanisms and Modeling", WeldingJournal, February 1990.
Hatanaka, K., and Fujimitsu, T., "Growth of Small Cracks and an Evaluation of LowCycle Fatigue Life", ASTM STP 942, 1988.
Iwanowicz, S. E., Study of Residual Stresses and Microcracks in High Strength SteelsWeldments, MIT Master's Thesis, 1992.
Kirk, Mark T., "The Effect of Weld Metal Strength Mismatch on the Deformation andFracture Behavior of Steel Butt Weldments", David Taylor Research Center ShipMaterials Engineering Department Research and Development Report DTRC-SME-91/06,January 1991.
131

Kirk, Mark T. and Dodds, Robert H. Jr., "Effect of Weld Strength Mismatch onElastic-Plastic Fracture Parameters", PhD Thesis, Departinent of Civil Engineering atUniversity of Illinois, August 1992.
Lee, M. M. K. and Luxmoore, A. R., "An Experimental Study of the Elastic-PlasticDeformation of Double 'V' Butt Welds", Journal of Strain Analysis Vol 24, No 4 1990.
Masubuchi, K., Analysis of Welded Structures, Pergamon Press, 1980.
Masubuchi, K., "Design and Fabrication of Welded Ships", Paper presented at MIT underthe Industrial Liaison Program (LLP), 1968.
Masubuchi, K., "Welding for Ocean Engineers", 13.17J Class Notes, Chapter 5, FatigueFracture, Fall 1991.
National Materials Advisory Board (NMAB), Commission on Engineering and TechnicalSystems National Research Council, "Effective Use of Weld Metal Yield Strength for HY-Steels", Report NMAB-380, January 1983.
Ohta, A., and Yoshio, M., and Suzuki, N., "Effect of Yield Strength on the Basic FatigueStrength of Welded Joints", Paper submitted to Fatigue and Fracture of EngineeringMaterials and Structures, October 1992.
Oldland, P. T., Ramsay, C. W., Matlock, D K., OlsonD. L., "Effects of Heat Input andMolybdenum Content on the Microstructures and Mechanical Properties of High StrengthSteel Weld Metal", Center for Welding and Joining Research, Colorado School of Minesreport, T-3599, July 1988.
Rolfe, S. T., Haak, R. P., Imhof, E. J., "Low Cycle Fatigue Of Experimental HY-130/150and HY-180/210 Steels and Weldments", Technical Report 40.018-001(37) by UnitedStates Steel, December 1964.
Scoonover, T. M., "Heat-Affected Zone Toughness and Tensile Properties in ASTM A710Steel Weldments", David Taylor Research Center Report, DTRC/SME-88-18, September1988.
Shigley, Joseph E., and Mitchell, Larry D., Mechanical Engineering Design. FourthEdition, McGraw-Hill, 1983.
132

Appendix A
The Confocal Scanning Laser Microscope
The Confocal Scanning Laser Microscope (CSLM) was developed by Lasertec
Corporation. Table 34 outlines selected CSLM operating parameters and data. The
CSLM is a conventional optical microscope with a scanning He-Ne laser for specimen
illumination. The system also includes a confocal imaging system and an image processing
unit. Unlike a standard microscope, observations of highly textured surfaces are possible
through the use of an extended focus memory feature. This feature creates images that are
the integration of many focused layers. The layers are superimposed to form a single
image with apparent infinite depth of field. A 12 inch video monitor displays output from
the image processing unit. Video recording and still shot photography is also possible.
Specimen manipulation and ..itial focusing is similar to a standard microscope. An
adjustable stage allows for two dimensional lateral movement (X and Y axis) of the
specimen while the microscope can be focused by movement in the third dimension
(Z-axis).
CSLM Optics and Image Magnification
The optical microscope is a Nikon model ILMI 1. The objective turret allows for
up to five objective lenses with an available range of IX to 200X. The most commonly
used objectives for this project were in the range of lOX to. 40X. The image displayed on
the 12 inch video monitor is further magnified by a factor of 60X. Video scan frequency is
133

nominally 0.033 s' and is adjustable to enhance image quality. Table 35 lists CSLM
image display information.
The fixed He-Ne laser source is combined with an Acoustic Optical Device (AOD),
galvano mirror and respective drive units. The AOD and galvano mirror provide the
scanning motion of the fixed laser. Specifically, the AOD performs horizontal scanning (X
axis) while the galvano mirror provides vertical (Y axis) scanning. Figure 39 shows the
CSLM optical arrangement.
Confocal Imaging System
When using the Optiphot 100x 0.925NA objective lens, high resolution imaging on
the order of 0.25 prm is possible. This high degree of resolution and the accompanying
scan line density allows the confocal imaging system to quickly determine if a point of
interest is in focus. The laser beam is focused onto the surface of the specimen and a
portion of the light is reflected back into the objective lens. These reflected rays are then
deflected by a beam splitter and focused through a pinhole opening onto the confocal point
detector. When the surface is out of focus, the reflected rays form a cone of light at the
pinhole opening. Therefore, less light passes through to the confocal point detector when
an image is out of focus. Peak light intensities coincide with areas that are in focus. The
image processing unit determines when the peaks occur in constructing sharply focused
images, making it unnecessary to ascertain if an image is blurry. The image processing
unit supports the following special capabilities of the CSLM:
134

"* Extended Focus
"* Surface Profilometry
"* Lateral Surface Measurements
Extended Focus
This enables the processing unit to compose an image with a virtually infinite depth
of field. This is a necessary feature when viewing specimens with a relatively large height
dimension. Standard optical equipment are very limited in this sense because of finite focal
planes. The CSLM scans finite layers and stores the information. The image processor
identifies the light intensity of each pixel of the specimen. The final image is the
integration of each of the layer's peak light intensities, forming a single focused view with
apparent unlimited depth of field.
Surface Profilometry
This feature allows the viewing of a "cross section" of the specimen. Differences
in elevation and slopes of the specimen can be observed and quantified. With the
processor selected for Measurement Screen Mode, a solid horizontal crosshair is
positioned along the region of desired profile. The Z-Axis Controller is then used
(manually or automatically) to select the heighthwise region of interest. The initial or zero
reference setting on the screen must be carefully observed to determine if it is a "hill" or
"valley". Once this initial positioning is established, the image processor coordinates all
peak intensities with the Z coordinate of the microscope. Raw data is processed with a
135

smoothing algorithm and an altitude profile is constructed. Elevations can then be
measured with the processor unit controls.
Lateral surface measurements
This feature allows for lateral measurements of the specimen when the
Measurement Screen Mode is selected on the processor. A set of dashed vertical
crosshairs can be moved and adjusted to measure lengths to 0.25 gIm.
Some other important features of the system are:
"* Critical dimension (CD) measurement. Repeatability of 3a or 0.03 .im.
"* Real time television refresh rate imaging. Observation, search and focusing of amoving sample is essentially real time because of the high frequency refresh rate.
"* High magnification, high resolution imaging by confocal optics.
"* Low intensity monochromatic illumination precludes thermal damage to specimens.
"* Sample preparation is not required. The sample only needs to be clean and dry.
"* Light emitting objects may be viewed.
"* Slow scan function allows observation of specimens with low reflectivity. The laserscan speed can be slowed to increase the memory storage time of the optical sensor.Sensitivity is inversely proportional to scan time, therefore lower scan rates are bestas reflectivity decreases. There are eleven possible scan speed settings available.
"* Optimization of signal source for various image processing capabilities.
"* Output Signal Recording allows the video output signal to be recorded on tape witha standard Video Cassette Recorder (VCR). Visual signals may also be enhancedwith an external image processing unit.
"* Gamma Function selection adjusts the viewing quality by varying the correlationbetween the amount of optical sensor light input and the video signal output. Threegamma function profiles are available; linear, increasing, and decreasing. Normallythe linear or constant slope gamma function is used. The decreasing slope gammafunction causes dark portions of the image to be lightened and light portions to be
136

darkened. This is helpful in increasing contrast of dark areas of low reflectivityspecimens. The positive gamma function performs the opposite, light areas arelightened more and dark areas are further darkened. This change in contrast allowsbetter imaging of the lighter areas of a specimen.
137

AIIIendIx B
IIY Steel Welding Data Sheets
138

OATASt-S.DOC Welder. GI 'C EA-_i " Engineer: Page-L-- of
PlateNo.:V'Z, 3 _+ Position: F... Description: •y-Bc• C,,,-rc-•
Date: 3-4-5-3 TaskNo.: TaskTite: , --r .
WlreDla.&Type:..,/ g , HeatNo.: Iq 5pL4, ControlNo.: lvk.l5'. SpoolNo.:
Shielding Gas Type: Cylinder No:'7 S'i2/i Actual Composition:
Bead No. 2 -3 L •j1 9 /0 '
Cup Size oIn.) ;',... ~~ Y '~ ŽFlow Rate (cfh) .35 .3 S" 3 -r 3 S -? S- KS-K V v S-Cup to Work (in.) V.' V. Y> .- - - ' - I V X-/ /,,- ,.-.-rip to Work (n.) Sir S-F/ / /1 -5/,- Lls --;Current Type/Pol. :pc.RP - I-PH/,P Temp. (F) • L I----------- . -- ---- a
WIFS(Ipm) 3l7l 3• o 51c 7 1! 13J S' . So'1-z 9t 9'15C 1C3 JC?'OCVV 3o.S" 3' / 3i--[i 13c -3 1 3J ,.Y'I,,3 /, ." •- 3 /Current (A) Ago 1 2 cýI _.jc I -;t-" 11'90 A-go ýko Zp-c 1,z.c 2-?c •
Voltage(V) -'qz,¢j--- s-5' .. ;' I js'," .-5,5 .; '. I .2S. I ., $ •-- 2.-.__Travel Speed (ipm) /I. I //•' i //• //"1 1:J'l 11/1'/"// .=• /-'1 //// "/A/ /3-
Heatlnput(kJ/in) 39. 3F. 3127.,1.3 1 31 .3 ?.3 1-.,- 0.-O l3 3j _,-7.__
Os,. Width (in.) - I i IOsc. Speed (pot) - i I I
Dwell L/R (pot) - I I I_ _ _ _ ~ _ I I _ _ _ I _ _ I
H fOe PL A,-. - -3 0"4.C= Process: Spray GMAWI Power Supply: GI,LL ,i=i#D •v(1-- Ga.I
Instrumentation: vrNC-L~i.A-p~T1FC -iP17cC
PL#AT-"E +"*F
S---A-,
139

CATASHTS. DOC Weider 6p. E 'Fu a Engineer: Page-.2,- of--.
Plate No.: PDAc,,qj Position: cL._ 7" I Description: ' i , , ,,-Date:,•-/g-jl•j TaskNo.:. Task Title: ,t-,€<, ,, ,=p.r'•
Wire Die. & Type:.V,//e.• HSeat No.: -/ 9,S-; A• Control No.: I 4•/; -r 9 Spool No.:
Shielding Gas Type: C S- Cylinder No: Actual Composition:
Bead No. /.&. /L.. " ,- " / I / / -.. - I .9
Cup Size oIn.) -!7- -OS -571 S11-. -51 7;J" IFlow Rate (cfh) 4,4 j s 9• r qS 4's I 5"-S -1•CuptoWork (n.) /-. /' '/, - X- / yý '-j Y- Y'- A,,ripto Work (in.) f _ ~ ~ ' ~Current Type/Pal. o)v..o e -____,qo_.
PH/IP Temp. (F) n /' _"__ _I ___ ,-
Current(A) ,•.. .±•..f ,2.•._ ;••. g.. ,Z? -_•I,8 .)• .,,.. xs.•.
Travel Speed (pm) //. •/,4// // /I', //.• //.Ol.. 1/, . //c•0 /i, "'(,// /11 /132-- //.C'/
osa. width (n.) -Za
Osc. Speed (pot) ___ _t _/_o
Dwell L/R (pot) - _
SI IProcess: Spray GMAW7 ower Supply: 4 ~ 6'cinstrumentation:
140

OATASHTS.XOC Welder- E c c-- v r ' Engineer. Page-- of-..-
PIateNo.:?,O.LO30o7 Position: p- Description: ,
Dat1e:3-/,/f9r3 Task No.: TaskTdle:/,-/Z,, o AJq,, 7-,-WireC~a.<yo- r 4aos - eat No.: 4 qe) Control No.: ~~ 5 SolN.
Shielding Gas Typei ý !, Cy4iner No: I 9 Actual Composition:
_ _ _,,,_. ='1,+"+ <, _ ,--i I _ I KCup Size (In.) ______ I I ~___ _
Fow Rate (cfh) - qS ¢-"1 _"_.__"_I_ __
Cup to Work On.) 0 Y'. "'- ' __
rip to Work (in.) I'v rI -
Current Type/Pal. J,_.•_•. ------- '
PHJ1P Temp. (F) I___ -
WFSQpm) _4]J .$/ ./I I
Curre~nt (Al -IOI a9 2*,28 ;- 9____0Voltage (v) ,S1,2,,. ... "-
Travel Speed Qpm) //o I/oVIt/ /.// ____ _
Heat Input (kJ/in) 1__I3. F3_ -__,F6_. _
?Os trw- , . - I (in.)Osc. Speed(pt) -p-,Dwell1 L/R (pot)I
Process: Spray GMAW Power Supply:
Instrumentation:
141

DATASHTS.DOC Welder. .iLsiaGdL. Engineer Page of~Z
PlateNO.: eItzO3,c Position: IF;.., Decipdn HY-i .,- Ur ~ u rData:3-i s3 Task No.: jTaskTIMe: L. S ,, ý2 ,,WleDla- & Type:X A~. I~No.: l~Zq Control No.: Ictoq4$.- SpoolNo.:ShIelding Gas Type: Cyi o~kdr No: 7 RZ (, 1 Actual Composition:Bead No. Z __ý 5 1.0 17 ~ ~Cup Size On.) 94 r? fk j !,- 5/f, si __ ,__Flow Rate (cflt) 315 35 35 35- 45 L15 q~ 6 ' f 5Cup to Work Qn.) AL" x "r vp~j /~ ~ ' ! ~
Current Type/Pal. 1C .b3CRFP DOM- - -
PH/IP Temp. (F) if 6e 1400 '* . O L4 COL 'fc0ce -lC" 'fct' 4o'.col*;; 4cc, fic' 'k~c'
OCV M 3Z -32 -3t*5 31.5 sj! 2LZ -5. 3(.5 -St.5 31.5 -3(.5current A) :340S .34 ', J -3-2 3'4C 30 340 3LAO -34Voltage(VM 2 5.652 z5 2255.5 2!5- 25.5 2.lU 2 ý.5 25.6 25.'- 25.5 2 z,-Travel Speed(Ipm) It , q 5 .4.5 -1j~5 &f-I 15 q^17 AO75 q.-71q ~7-7 .,7q q-7 5HeatlInput (kJ/mn) 110.0 I16%5 I le 7 1 Cq..5 1 C.F. tc9A.1i 5 105I.7 tc'9. &.1 i c93.1 tC9.5Osc. Width Oin.) 9/4; -5V !Fle '"/11,"' 9/1L. 'l/ji!.* SIS" ' ~ ~ ŽEDwell L/R (pot) ýOz O ý 01 ao Ic-C5 1_3_2_
~~LR1~E Processr Spray GMAW IPower Supply: CjLt ILAAco(cr4ev Q2L14YSO MA5 M4-Tl- Insftrmntation: V.o.M-ý?4C,3t~,55q, .i#Cce.
I WIRC SftmDL"-0qf~r, fRecnA*S
9 1 : 6 0 8~. r
142

DATASHTK.OC Welder: --Bg-A 4t RR'C•G A Engineer: Page Z of.2.
PlbtsNo.:PV203o! Position: FLAT I Descuiption: 14Y-0 QfD-ouR Mtrc4
Date: S-15-q" TaskNo.: I TaskTitle: M 'T s,,• FA'IC.,UF PLATSrS
WIMDla.&Type: P /. I IHeat No.: t q 155%4 ControlNo.: 1 . f, 51 SpoolNo.:
ShIelding Gas Type: 1-5 Cylinder No: 71 5B 2L Actual Composition:
Beead No. 12- _. -
CupSize n) On. ) - - -
Flow Rate(cth) O L5Cup to Work On.) : -
Tip toWork (in.) ~- - - __- -
CurrentType/Pol. bCRP 1 •,P _
PH/IP Temp. (F) A004o o' _.__
WFS(1p) ISo I '7,,OCv(v) MI. ". • 3,5Current (A) 311C .3/1e
VoltageM 25.5 2•.;
Travel Speed QPm) q- 753 .'L2, -75__
Heat nput(kJ/In) I.o 10. _, 10iosc. Widt Qn.) • ' '.
Osc. Speed (ixo) qIq, 4B -,
Process: SprayGMAW PowWrSupply: w,•jL.•A (cvucoJIC aGzL(Instrumentation: V.c.j'ýC 3L-554- Amip"*KC. 39706
143

DATASHTS.0CZ Welder -G..F r-YC Engineer. pace-L. ot2..
Plate No.: ('izo3 oW Position: E~~ escripfion: H V- I Q Q rvE -.,
Date: 3/.2;/q 31 Task No.: (Task Title: Sv- Ius, = w~~G.~i V, 1
Wlre DLa.&Type:. c45j S I I HeatNo.: \qC-~ ContrciNo.: 01-L3C Spccl No.: t --
Shielding Gas Type:'- Cylinder No: L-3q1 ICE? Actual Compostlion: ______
Bead No. Z/ 1___ -3 -, I I _ _ 1_ i7 I!Cup Size (n.) - _ _ 7/7 f/,, ý-I ,Iý I !ý- 1'17'-. y jY, . <-
Flow Rate (cfh)ý s S 3 j- J.7 r ~I__ < 3 -?-r~
Cup to Wor;~ 01At 9 I~ ~ 4 ~ ~ 2
rip to Work~in. I s- 1 -
PH/lP Temp. (F '~
WFS Opm) -3, 31 -;-2 33- 3 Z13 JJý 1722-,
OCV M 3C.! 30.s2I 1~ 3o _TC.Sio•IgC.SS 3o -r 1 3, 2 30.3,5-Current (A) -2,90 I2f- 12C 3401 ;z9-- AK- -I fOI 2.F 1,2- O _ -lVoltage MV _As- 1 ..2- S A~I~~ -- - S .2- -v ' X< ý
Osc. Width (n.) I ___
Osc. Speed (pot) - I___ __
Dwell L/R (pot) - I I_ __ - _ _
vktc ýtee rt PiAjr- 3C"J-C--j Process: Spray GMAW I Power Supply: LA.).V'Gq
L,- -2 1 47- /-Z*'
B3144

TAd.;.C ,, We , er3 -, (22 R P- 41 A/C F-ace-. of-
Plate No.:)tl Position: •, Desc#ton:.- -Date: 3/.7;t/ 31 Task No.: TaskTitle: lI• "r /f=. , F ,-ri G-_ý IEA-r.
Wire Dia. &Type:.€.I• |,• _ Hmat No.: I a, C C . Control No.: 3 c-. - Spccl No.: ctL--
Shielding Gas Type: 'C " -t" Cylinder No: L-3 q • 112 Actual Composition:
Flow.Rate (fh) 3s- v-• - *' j i < . ' j- i 5 .-Cup to Work at k- i ~,1'~ J ŽTip to Work (in. _y-g I 7 10 . / s- I- 1iI7 -Y?Curr--.t Type/P 'e.'" e -I-I -.PH/IP Temp. (F : .,o '" . . - '____-"_-
WFS Opm) J:)- 2-- 3.2-I iiL0 3' ' - 3A 13; 2-3OCv(V Mo.-: 3c.•lo.-" Jc.•1 .. ?130.5 5,'.-i3'.-sI 3C• .,. IT 1C3
Osc.'Width (in.) -- _ _ I _ I
Osc. Speed (pot) - I I I __!
Owe. L/R (pot) --"_I ! I _ _ I
__________________I __ I _ ___ ____ ____I ____ ________
__________ 1 ______ I I _________
1AY i--6r,' P;A--e- 3c"-j.• Process: SpmyC-MAW I Power Supply: '..'_C-V(.;-F- Z .
Instrumentation: vc*.JC.m: PC 3&.554, A•,--K• 'z9"7C6
145

OA7ASHTS.ZOC Welder -GiR Fam ... Engineer~ Fael cL-..-
Plate No.: ft ,,, Posrtfon: D escription: My - 0QC~vwDate:212;,/ 3 q TaskNo.: Taskritle: t,'%-r /us,... fz,-r. rw ?L rwWire Da. &Type:. 44S~2,- 1 HeatNo.: I-LOCX9 Control No.: LI L3 C- Spoc4 No.: (,-Shielding Gas Type: 1C - IICylinder No: L,! h,2 I Actual Camoosftion:End No. .13 .2 ,'zs -46~I I,- 1 1 II1
Cup Size (in.) ... 9k. .4a. 4;ýz,~l I~ 1 _
Flow Rate (cfh) '/-I 7 KbCup to Work(I fit .1 '4- z~a I Z,~ I I I__ I__ I_ I
Currert Type/P )C4-p 4 __I _
PH/IF Temp. (F _ _
WFS Qpm) _FZ T- I __OCV Cl) 10-s-10• ?e /Cl-5,0-5 ,- I __ i iCurrent (A) AYV~ ~LY- z- I.2Ki~ I __I__ I I I__Voltae( ;a M ;~t<I-lZýI IITravel Speed (1pm) / ,ý'&~i//J/'~l~4 I__Heat lrput (kJln) _;0.9 Z'7 / 6 K]3./I __ ____ _
Osc. Width (in.) [- IT T ___I______-
Osc. Speed (pat) -I- _____I_____Dwell L/R (pot) T _ __ _ _ _ _
VkYL-e, -.e'r ir .uTe15 3C A- Process: Spray GMAW IPower Supply: Gj, Aj;,&.vL,ý,C qInstrumnentation: Vc.tvýJC. 3tL-55" A'...pIVNCL39~1CE
146

DATASHT&OOC Welder BAU-Prnel~ Engineer Page I.. ot..&.
Plate No.:T20,,,7 Position: F,.A-, Decrption: Hy tc , j U" -¶ At
Oata: 3-07-931 TaskNo.: ITaskTitle: N.,-T /LS rA~.s4-,...tWWeOML&Type:c.s I~5- HeatNo.: lq5ay5 'ControlNo.: liV21 ýq Spool No.:Shielding Gas Tp:C- 5 1Cý41nder No: '7 -5F2 Actual Composition:BeadNo. I t,3 5 ( 7IE
____ ~ ~ ý1 le A- Or io~ ~ ~ 4 ~ -*Flow Rate (cfh) 35 35- .36 - 35 44 45 ,;-- qj 46
Ti oCWor(V) 31e 1 3/1 5..ýL. 3/j .3i ~.3
___ _ _ M_31 31 31 31_ 313___1 - 1 5 31 .
Current (A) 2F? zo 2$L ZC- Z O ZFC e,2C, .2ýFe 25C 7.SO 29c0 ZSC'Voltage(V) 26.15 -Z 6 .5ý 1 26 S5' 2 '2-.- 2• P-1- 26 ' 25.6 2 6.
Osc. Width OIn.) v,"Io Y,5/ I wk~ -,. __I
Osc. Speed (pot) T, U ~(N !~~ L 0~Dwell L/R (pot)_ 5Cl o3 -5 C2. c3 el -5cý&qc3~
PtLATE Process: Spray GMAW Pa;werSuf GUPIFLL ILA/it (-Cvtc)
-PLAT&P--C i-:'D
147

0ATASHK&OOC Welder. C - A'F Engineer. Page .Z of2.
Plate No.: Pw2o3c,1 Position: FLAT IDescriPtion: Wt'0OD LjnbFeR 1A-rc$4
Date: 3-1-1-9A1 TaslcNo.: TasicTitie: mitT/Lrew Ffir1C21 LJF PLATF-SWireDia. &Type:.o45/ tC`O4*- I eatNo.: l'l!52.'45 IControl No.: ilv12Iq Spool No.:Shielding Gas Type: C.- 5 Cyflnder No: 75C-2 1Actual Composbton:Bead No. I 2. 1-3 14 15 Jg 1-7
Cup Size On.) v '~ ~ "I NWI,
Flow Rate (cth) *45 q1 s 45 4'i 45 t*; __ __ _
Cup to WorkQn.) iD
rip to Work (in.) v~ vi ~.2Current TYPe/Pol. -.>CRp :JCRP XOReP rCIZP MC P PDJC RP_PH/IP Temp. (F) _4jq W~~~~~C'___
WFS Opm) 303 P-9Z 294 ? q ( ZJY3 Z94__OCv M 31 :3L~ 1' 11_ 1_ 3(_31 3
Current (A) _ZRO 2fZQ.. 2$'L()- FC Z-00 Z0 ____
Voltage M 2-65 2~T 2L S -&ý 25 5.5 e±'TravelSpeed~lpm) L,.,15 Le..S9 L.-(, 5! Lv.G5!5 (,.*5 57 ___
Osc. Width (in.) 'I : "L ~.1 11 :ý" k
Osc. Speed 03dt) 46 1414 -14 I LIL Ii __ _ _
Dwefllh/R (pot) C ,~ 3
--. - - C3-53 A -
Process: Spray GMAW IPOW rSUPPlY- CD.LILAMrO Cc .'(-CoV2i ZInstrumentation: v.oyin:*C. -3t,5rL Am,::pWJC 3ql'708
148

! I ! ! ! a -a0-
Iirf*.
lI - - - - - - - - - - - - - - -
, C00000'i
' e •" " " • ' " |" ' • " 0"

*�1���� - - - -
-�
5 -1-�--- -�
a - - - - -
za
ILl
51 1 *
I''
IIw�
* N
ii *�1
V*)S - 8 - - - - - - -
tq,� -'C-d *�
- -; - - - *o.
NE -'S.,-
N '.54
p1 - -S
a -
wN a
I*
- N
a
3
5*] - Ct - b� -� -
I.. a
__ __ K - - - - - - - -
� 6 6'U S
6Ii --- ----- go - --
� I - . 0 0 0 - 0 - U U *O3�
150

137
I--- - -
0 (
ixa.
w
I-.
1151

An
0
LUU
E (n
IXW0U
<f~ cc~c LJf _--- -'
0'C13l -j
0
ww
Lf
3.I
ifi
0 0 ---- - --
oi J
_ z
15

0CL
(D J
r, a li0Ž2L -- - -q
wwwI-.
o II
~a. L153

Appendix C
High Hardness Armor Performance Data Sheets
154

DEPARTMENT OF THE ARMYU.S. ARMY RESEARCH LABORATORY
ARSENAL STREETWATERTOWN. MASSACHUSErrS 021 72-0001
AMSRL-MA-MB (930415-HH) 15 April 1993
Lt. Edward OlsonEngineering Duty OfficerUSN 13A Graduate ProgramMassachusetts Institute of TechnologyDepartment Of Ocean EngineeringCambridge, MA 02139
SUBJECT: Weldment Specimens To MIT.
Per your request, I am submitting weldment specimens to aid you withyour graduate studies involving HAZ craec growth. The base metal is MIL-A-46100 armor steel and the filler metal is ER10OS-1 and ER70S-6. Thespecimens are as follows:
1. (5) 12"x 1.5"x 0.25" transverse GMAW weldments using ER100S-lfiller metal.
2. (5) 12"x 1.5"x 0.25" transverse GMAW weldments using ER70S-6
filler metal.
3. (2) 8"x 1.5"x 0.25" virgin base metal.
4. (1) 8"x 1.5"x 0.25" virgin base metal with an arc strike in thecenter of the plate.
If you need any additional information please call me at (617) 923-5185.
Sincerely,
Thomas G. MelvinWelding EngineerProcessing Research Group
encl: Weldment specimens.
CF Mr. C.Hickey Jr.,Chief, MPBMr. J. Nunes, Chief, PRG
155

Composition 6.31 mm 7.31 mm 7.31 mm 9.71 mm
(w%) (1/4 In.) (9/32 in.) (Extra Hard) (318 in.)
C 0.29 0.31 0.31 ' 0.31Mn 0.83 0.87 0.87 0.96
Ni 0.90 1.16 1.16 1.10
Cr 0.47 0.54 0.54 0.52
Mo 0.53 0.55 0.55 0.55
SI 0.38 0.43 0.43 0.39
Al 0.030 0.036 0.036 0.025
P 0.015 0.010 0.010 0.015
S 0.001 0.002 0.002 0.003
HRC 48 50 51 48
Plate Dimensions (in.) 65 x 165 65 x 220 65 x 220 72 x 100
NOTE: The heat treatment was as follows:Austenitizing 1660°F (9040 C) - 20 minSpray Water (Roller Quench)Tempering 400OF (2040C) - 50 rain for 3 plates30 min for the extra hard (XH) pli
156

Table 4. TENSILE PROPERTIES OF HIGH HARD ARMOR AT ROOM TEMPERATURE
UITS 02% YS ElOm RA
631 mm LT 252.2 2017 10A 44.56.31 mm LT 251.6 20&.6 10.2 42-6
6.31 mm TI. 249.7 200.8 10.5 44.2
&31 mm TL 244.5 201.1 10.1 432
7.31 mm LT 2592 209.3 10.0 46.1
7.31 mm LT 253.4 205.6 11.0 45.2
7.31 mm TL 254.7 206.7 10.3 4&0
7.31 mmTL 251.1 207.6 9.4 43.1
7.31 mm XH LT 265.8 207.0 9.8 41.5
7.31 mm XH LT 263.7 206.9 10.0 42.1
7.31 mm XH TL 266.4 209.5 11.3 36.17.31 mm XH TL 2&12 207.2 9.2 39.7
9.71 mm LT 250.0 197.7 12.0 48.8
9.71 mm LT 248.2 196.1 10.1 41.7
9.71 mm TL 249.7 204.1 9.0 48.49.71 mm TL 255.0 205.3 10.5 33.6
NOTE: LT= LongitudinalT. = Transverse
Table 5. TENSILE PROPERTIES OF HIGH HARD ARMOR AT -40OF
UTS 0.2% YS Elon. RASpecimen (kSol (k,, (%) (N)
6.31 mmTL 235.7 193.3 9.1 54.2
6.31 mmTTL 255.0 2099 11.2 50.1
7.31 mm TL 257.7 210.3 9.7 51.5
7.31 mmlTL 258.5 209.4 9.7 51.2
7.31 mm XH TL 266.5 205.8 94 48.3
7.31 mm XH TL 266.0 205.3 10.2 47.9
9.71 mm TL 263.6 -13.0 9.9 43.9
9.71 mm.TL 263.0 219.1 9.7 47.1
NOTE. TL. = Transverse
157

E
00-- 00- DO
CIO,
0 000ca
E E;
N 1a a v C C
(qi-u) ABDou3 4010U-A Adjs~o (ql.tl) Arliau3 IIOIou-A AdA43I
00 0
coa
---- 00 0 0
0 *0 !7- ;BE
E E TE E* COL
000 00 ~ EF __a-
-H
V. Cm c
0q.)AJU 4300 - Ad,~s OSU 000- AJ
2- - ----- 158

MIL-A-46 fOOD( M)16 Kay 1988SUPERSEDINGMIL-A-46100C13 June 1983AMEINDENT 220 October !986
MILITARY SPECIFICATION
ARMOR PLATI, STEEL, WROUGHT, HIGH-HARDNESS
This specification is approved for use within the Department of theArmy, and is available for use by all Departments and Agencies of theDepartment of Defense.
1. SCOPE
1.1 Scope. This specification covers quenched and tempered high-hardnesswrought steel armor plate for lightweight armor applications for recommendedthickness up to 2 inches inclusive (see 6.1 and 6.3).
2. APPLICABLE DOCU2TS
2.1 Government documents.
2.1.1 Specifications and standards. Unless otherwise specified (see 6.2),the following specifications and standards of the issue listed in that issueof the Department of Defense Index of Specifications and Standards (DODISS)specified in the solicitation, form a part of this specification to the extentspecified herein.
STANDARDS
MILITARY
MIL-STD-129 - Marking for Shipment and StorageMIL-STD-163 - Steel Mill Products Preparation for Shipment and StorageMIL-STD-367 - Armor Test Data ReportingMIL-STD-1185 - Welding High Hardness Armor
(Copies of specifications, standards, handbooks, drawings, and publicationsrequired by manufacturers in connection with specific acquisition functionsshould be obtained from the contracting activity or as directed by thecontracting officer.)
Beneficial comments (recommendations, additions, deletions) and any pertinentdata which may be of use in imnpoving this document should be addressed to:Director, US Army Laboratory Command, Materials Technology Laboratory, ATTN:SLCMT-MEE, Watertown, MA 02172-0001 by using the Standardization DocumentImprovement Proposal (DD Form 1426) appearing at the end of this document orby letter.
AMSC No. A4388 /FSC 9577
DISTRIBUTION STATEMENT A Approved for public release; distribution unlimited.
159

MIL-A-46100D( MR )
2.1.2 Other Government documents. drawings, and nublications. Thefollowing other Government documents, drawings, ann publications form a part
of this specification to the extent specified herein.
USATECOM TOP 2-2-710 - Ballistic Tests of Armor MaterialsQSTAG 335 - Certification of Personnel for Ultrasonic Inspection
(Application for copies should be addressed to the Director, DefenseTechnical Information Center, Att=z DDR, Cameron Station, Alexandria, VA22314)
2.2 Other publications. The following document(s) form a part of thisspecification to e -extent specified herein. The issues of the documentswhich are indicated an DoD adopted shall be the issue listed in the currentDODISS and the supplement thereto, if applicable.
ASTM
ASTM A578 - Specification for Straight-Beam Ultrasonic Examination of Plainand Clad Steel Plates for Special Applications
ASTM A751 - Methods, Practices, and Definitions for Chemical Analysis ofSteel Products
ASTI ElO - Brinell Hardness of Metallic MaterialsASTM El8 - Rockwell Hardness and Rockwell Superficial Hardness of Metallic
MaterialsASTM E23 - Notched Bar Impact Testing of Metallic MaterialsASTM E109 - Dry Powder Magnetic Particle InspectionASTM E290 - Semi-Guided Bend Test for Ductility of Metallic Materials
(Application for copies should be addressed to ASTM, 1916 Race Street,Philadelphia, PA 19103.)
Technical society and technical association specifications and standards aregenerally available for reference from libraries. They are also distributedamong technical groups and using Federal agencies.
2.3 Order of precedence. In the event of a conflict between the text ofthis specification and the references cited herein, the text of this
specification shall take precedence.
3. REQUIREMENTS
3.1 First article. When specified in the contract or purchase order (see
4.2.1.1.2, 6.2, 6.4, and 6.9), a sample or samples of the specified item shallbe made available to the contracting officer or his authorized r~epresentativefor approval in accordance with 4.2.1.1. The approval of the first article
samples authorizes the commencement of shipment but does not relieve thesupplier of responsiblity for compliance with all applicable provisions ofthis specification. The first article samples and test plates shall bemanufactured by the process proposed for use on production armor. Themanufacturer's declared chemical analysis must be submitted to the contractingagency and to the ballistic test agency. The ballistic test agency willrecord the first article ballistic test plates submitted, showing the datestested. Requests from the procuring activity to the ballistic test agency as
160

MIL-A-46 lOOD( MR)
to prior conformance with first article tests must be accompained bycopies of the first article test firing records. Any deviation(s) noticed bythe ballistic agency will be brough*t to the attention of the contractingactivity and to the manufacturer.
3.1.1 First time producer. First time producers wishing to qualify to thisspecification should follow the instructions of 6.7.
TABLE I. Chemical composition (product analysis). L/ 5/
Maximum NaximsmElement Ranqe Percent Limit Percent
CAumOI - 0.10 0.32
MANGANESE: Up to 1.00% incJl 0.30 -
Over 1.00% 0.40
PHOSPHORUS - 0.020 2/
SULFUR 0.010 2/
SILICON: Up to 0.60% incl 0.20 -
Over 0.60% to 1.00% incl 0.30
NICKEL 0.50 -
CHROMIUM: Up to 1.25% incl 0.30 -
Over 1.25% 0.40
:OLYBD£FT": Up tc 0.20% i!€l 0.07
Over 0.20% 0.15VANADIUM 0.15 -
BORON - 3/
COPPER - 0.25 4/
TITANIUM - 0.10 4/
ZIRCONIUM - 0.10 4/
ALUMINUM -0.10 4/
LEAD - 0.01 4/
TIN - 0.02 4/
ANTIMONT 0.02 4/
ARSENIC 0.02 4/
1/ This table lists the maximum range for elements of the manufacturer'sestablished chemical composition.
2/ Phosphorus and sulfur should be controlled to the lowest attainable levelsbut in no case should the combined phosphorus and sulfur content exceed0.025 percent.
3/ When the amount of boron is specified in the alloy, its content sodetermined by heat analysis shall not exceed 0.003%.
161

4/ When the amount of an element .-s less :nan 0.020 the aralysls may :e
reported as 0.02%.
5/ Elements not listed in table, but intentionally added, shall be re~orted.
3.2 Acceptance requirements.
3.2.1 Chemical composition. The product produced to this specificationshall meet the analysis of table I unless otherwise agreed upon between thesteel supplier and the purchaser. All limits as specified in table I(including any deviations negotiated) shall be submitted in advance to thepurchaser. The purchaser may establish and submit separate limits for eachthickness of plate to be furnished (see 6.5). A statement shoving the beatanalysis of each melt and one product analysis of each lot and completedetails of the heat treatment of each lot shall be furnished for the files ofthe purchaser at no cost. All elements of the chemical composition specifiedin table I shall be shown in the statement. When specified in the contract or
order, armor material test reports shall be prepared in accordance withMIL-STD-367 to report the chemical composition range established by theproducer and the chemical analysis of the material submitted (see 6.2.2 and6.6).
3.2.2 Heat treatment. All plates in each lot, including samples, shallreceive the same heat treatment except for such variations in temperingtemperature as may be necessary to produce the prescribed hardness. Unlessotherwise specified, local or general heating shall not be performed after thefinal heat treating operation (see 6.2). This does not include prehearing forwelding or flame cutting, as long as the tempering temperature is notexceeded. Unless otherwise specified (see 6.2) all plates shall be temmeredfor a minimum of 30 minutes after the centerline of the plate thickness hasreached a temperature of at least 350OF, or shall be tempered for a minimumof one hour for each inch of thickness after the plate surface has reached atemperature of at least 3500F. For plates under one inch thick thetempering process shall be carried out according to the tine schedule listedbelow, after the plate surface has reached a minimum temperature of 35300:
1.00 inch 1 hour minimum0.75 inch 3/4 hour minimum0.50 inch 1/2 hour minimum0.25 inch 1/2 hour minimum
The tempering operation should be done as soon as possible after quenching.It is recommended that the delay after quenching be no greater than 24 hours.
3.2.3 Condition. Unless otherwise specified (see 6.2), plates shall be in
the as-heat treated condition; surfaces shall not be pickled.
3.2.4 Mechanical properties.
3.2.4.1 Hardness. The surface hardness of each plate, including firstarticle samples, shall be within the range of HB 477 - HB 534. The diametersof Brinell hardness impressions on any individual plate shall not 'ar-a by morethan 0.15 mm (see 4.6.2).
162
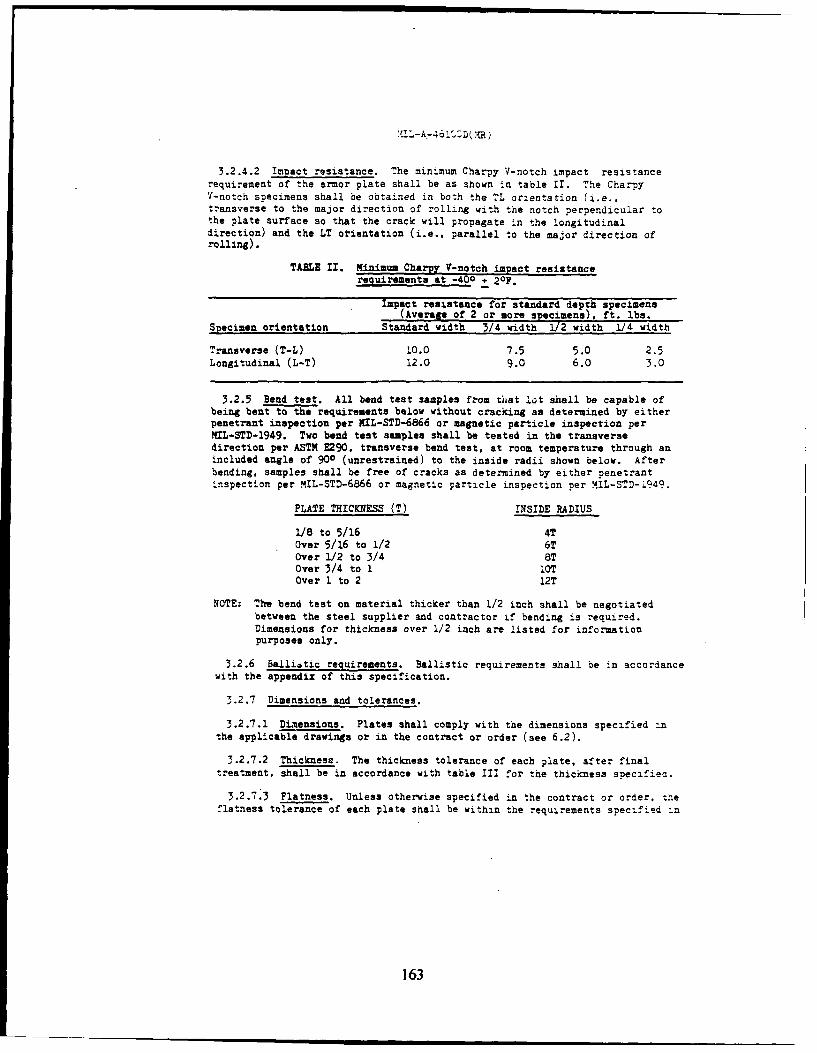
MI!L-A-461SD2•
3.2.4.2 Impact resistance. The minimum Charpy V-notch impact resistancerequirement of the armor plate shall be as shown in table Il. The CharpyV-notch specimens shall be obtained in both the TL orientation (i.e.,transverse to the major direction of rolling with the notch perpendicular tothe plate surface so that the crack will propagate in the longitudinaldirection) and the LT orientation (i.e.. parallel to the major direction ofrolling).
TABLE II. Kinimum Charpy V-notch impact resistancerequirements at +40o * 20°.
Impact resistance for standard depth specimens(Average of 2 or more specimens), ft. lbs.
Specimen orientation Standard width 3/4 width 1/2 width 1/4 width
Transverse (T-L) 10.0 7.5 5.0 2.5Longitudinal (L-T) 12.0 9.0 6.0 3.0
3.2.5 Bend test. All bend test samples from that lot shall be capable ofbeing bent to the requirements below without cracking as determined by eitherpenetrant inspection per MIL-STD-6866 or magnetic particle inspection perNIL-STD-1949. Two bend test samples shall be tested in the transversedirection per ASTM E290, transverse bend test, at room temperature through anincluded angle of 900 (unrestrained) to the inside radii shown below. Afterbending, samples shall be free of cracks as determined by either penetrantinspection per MIL-STD-6866 or magnetic particle inspection per MIL-STD-1949.
PLATE THICKNESS (T) INSIDE RADIUS
1/8 to 5/16 4TOver 5/16 to 1/2 6TOver 1/2 to 3/4 8TOver 3/4 to 1 iOTOver 1 to 2 12T
NOTE: The bend test on material thicker than 1/2 inch shall be negotiatedbetween the steel supplier and contractor if bending is required.Dimensions for thickness over 1/2 inch are listed for informationpurposes only.
3.2.6 Balliotic requirements. Ballistic requirements shall be in accordancewith the appendix of this specification.
3.2.7 Dimensions and tolerances.
3.2.7.1 Dimensions. Plates shall comply with the dimensions specified inthe applicable drawings or in the contract or order (see 6.2).
3.2.7.2 Thickness. The thickness tolerance of each plate, after finaltreatment, shall be in accordance with table III for the thickness specifien.
3.2.7.3 Flatness. Unless otherwise specified in the contract or order. -. eflatness tolerance of each plate shall be within the requirements specified in
163

":•L- A-46 1COD( MR )
table :V. Tighter tolerance requirements -ay be specified L the contract or
order and shall be as agreed upon between the contractor and the procur•:r.
activity.
3.2.7.4 Waviness. Unless otherwise specified in the contract or order, the
waviness tolerance of each plate shall be within the requirements of table V.
TABLE III. Thickness tolerances for ordered thickness 1/,inches (over and under) 2/.
Tolerances over and under ordered thickness for widths givenSpecified 60" to 72 to 84 to 96 to 108 to 120 to 132 toThickness To 72" 84" 96" 1" 120". 132' 144"Inches 60" excl. excl. excl. excl. excl. excl. incl.
1/8 2/ .016 .016 .019 .019 .023 .... ....
3/16 •/ .016 .016 .019 .019 .0231/4 •/ .016 .016 .019 .019 .023 ....5/16 •/ .016 .019 .019 .019 .023 .0263/8 •/ .016 .019 .019 .023 .023 .0267/16 V/ .016 .019 .019 .023 .026 .026 .0311/2 V/ .016 .019 .019 .023 .026 .026 .0319/16 V/ .019 .019 .019 .023 .026 .031 .0315/8 V/ .019 .019 .019 .023 .026 .031 .03111/16 2/ .019 .019 .019 .023 .026 .031 .0313/4 V/ .019 .019 .023 .023 .026 .031 .03913/16 T/ .023 .023 .023 .026 .031 .031 .0397/8 T/ .023 .023 .026 .026 .031 .031 .03915/16 T/ .023 .023 .X26 .026 .031 .036 .0431 T/ .026 .026 .026 .026 .031 .036 .0431-1/16 •'/ .026 .026 .026 .031 .031 .036 .0431-1/8 T/ .026 .026 .026 .031 .031 .039 .0431-3/16 7/ .031 .031 .031 .031 .036 .043 .0481-1/4 2/ .031 .031 .031 .036 .036 .043 .0481-5/16 Y/ .031 .031 .031 .036 .036 .043 .0531-3/8 T/ .031 .031 .031 .036 .039 .048 .0531-7/16 V/ .036 .036 .036 .036 .043 .048 .0581-1/2 T/ .036 .036 .036 .039 .043 .048 .0581-9/16 1/ .036 .036 .036 .039 .043 .058 .0581-5/8 V .036 .036 .036 .043 .048 .058 .0631-11/16 T/ .039 .039 .039 .043 .048 .058 .0631-3/4 Y/ .039 .039 .039 .043 .048 .058 .0681-13/16 2/ .043 .043 .043 .048 .053 .058 .0681-7/8 / .043 .043 .043 .048 .053 .063 .0681-15/16 */ .043 .043 .043 .048 .053 .063 .0762 T/ .043 .043 .043 .048 .053 .063 .076
l/ For intermediate thickness, the tolerance of the closer specified gageshall apply. In case of mid-point, the tolerance for lower gage orinterpolated value shall apply.
2/ When plates under 60" are rolled double width, the equivalent wider platetolerance shall apply.
164

MIL-A-461OOD(.MR)
CY -W co 'S
Q - t- -- I ao I'
0 w0 6%~ It UK.4L% .0. 6
a* '.0 CD (D
co co6
,'. II u.
4'. 0
x4 -
6 0 -wS~" 0 - 4.0-~~t a c ( '
L. 4. . r
*00 c;0e
0 * 6sm
z -,- wN ,
~~~ 'a' oa60 .. 3
165

TABLE V. Waviness tolerances for Dlates.
Flatnesstolerance When number of waves in 12 ft is:
from 1 2 3 4 5 6 7table IV
3/8 3/8 5/16 3/16 3/16 1/8 1/16 1/167/16 7/16 5/16 1/4 3/16 1/8 1/8 1/161/2 1/2 3/8 5/16 3/16 3/16 118 1/169/16 9/16 7/16 5/16 1/4 3/16 1/8 1/85/8 5/8 1/2 3/8 1/4 3/16 1/8 1/811/16 11/16 1/2 3/8 5/16 3/16 3/16 1/83/4 3/4 9/16 7/16 5/16 1/4 3/16 1/813/16 13/16 5/8 7/16 5/16 1/4 3/1!6 1/87/8 7/8 11/16 1/2 3/8 1/4 3/16 1/815/16 15/16 11/16 1/2 3/8 5/16 1/4 3/161 1 3/4 9/16 7/16 5/16 1/4 3/161-1/8 1-1/8 7/8 5/8 1/2 3/8 1/4 3/161-1/4 1-1/4 15/16 11/16 1/2 3/8 5/16 1/41-3/8 1-3/8 1-1/16 3/4 9/16 7/16 5/16 1/41-1/2 1-1/2 1-1/8 7/8 5/8 1/2 3/8 1/41-5/8 1-5/8 1-1/4 15/16 11/16 1/2 3/8 5/161-3/4 1-3/4 1-5/16 1 3/4 9/16 7/16 5/161-7/8 1-7/8 1-7/16 1-1/16 13/16 5/8 1/2 3/82 2 1-1/2 1-1/8 7/8 5/8 1/2 3/82-1/4 2-1/4 1-11/16 1-1/4 15/16 11/16 9/16 3/82-3/8 2-3/8 1-13/16 1-5/16 1 3/4 9/76 7/162-5/8 2-5/8 2 1-1/2 1-1/8 13/16 5/8 7/162-3/4 2-3/4 2-1/16 1-9/16 1-1/8 7/8 5/8 1/2
NOTES:
NOTE 1 Waviness denotes the deviation of the top or bottom surface from ahorizontal line, when the plate is resting on a flat surface, as measured inan increment of less than 12 ft of length. The waviness tolerance is afunction of the flatness tolerance as obtained from table IV.
NOTE 2 When the flatness tolerance is 5/8 inch or less for plates 1/2 .nch orless in thickness, the waviness tolerance shall not apply.
3.2.8 Identification marking. Identification marking shall be legiblypainted and records shall be such as to ensure positive identification of allplates, including test samples and specimens, with the lot and corresponding
heat from which they were produced. Marking shall be approximately six inchesin from the edge of the plate. The key to identification symbols shall befurnished to the inspector prior to submittal for inspection. First article
and acceptance ballistic test plates shall also be marked with themanufacturer's name or trademark, the number of this specification, and theordered plate thickness in inches. First article plates shall be marked"PRE", acceptance plates "ACC", and retest plates will be marked "Rl" and"*R2'.. If a second set of retest plates are submitted they shall be markced"RRI" and "RR2'. The primary plate rolling direction should be identified.
166

•IL-A-46100D(MR)
3.2.9 WorkmanshiD.
3.2.9.1 Surface condition. The top and bottom surface of each plate shallbe free from the following su-rface defects: slivers, laps, checks, seams,blisters, snakes, cold shuts, cracks, burning, mechanical seams, mechanicalgouges and las-nations (see 6.10). The surface of each plate shall be suchthat mill scale or oxidation product shall not interfere with determination ofacceptablility. Imperfections listed above, which are of such a nature as toaffect the fabrication of the materials, are rejectable.
3.2.9.1.1 Depth of imperfections. The depth of rolled-in scale, scalepitting or snakes shall not exceed 0.015 inch and shall not reduce the steelthickness below the allowable minimum. Isolated individual pits over 0.015inch deep but not over 0.03 inch deep and not within 6 inches of each otherand which do not violate the minimum allowable thickness, as specified in theapplicable drawings and fabrication documents, are acceptable.
3.2.9.2 Edge preparation. Thermal cutting shall be permitted after finalheat treatment provided the procedure, which may include grinding afterthermal cutting, is such that no cracks develop on any thermally cut edgewhether detected by nondestructive inspection, or as agreed upon in thecontract. To reduce the potential for plate cracking, plates shall not be cutby cold shearing after final heat treatment. The heat affected zone ofthermally cut plates (up to and including 1/2-inch in thickness) shall notexceed 1.2 times the plates thickness from the cut edge. For plates over1/2-inch thick, the heat affected zone shall not exceed 5/8-inch from the cutedge. In order to have the heat affected zone exceed these limits approvalshall be obtained from the procuring activity.
3.2.9.3 Edge condition. Plate edge on plates delivered after heattreatment shall be free of cracks. The supplier shall practice such necessaryprocess controls to prevent this condition.
3.2.9.4 Edge quality. For all plates the steel supplier shall institutesuch necessary controls such that any cut parts shall comply with therequirements of 3.2.9.4.1, whether detected by magnetic particle inspection.or liquid penetrant inspection.
3.2.9.4.1 Acceptance criteria.
3.2.9.4.1.1 Single linear indications. In any four inches of length asingle linear indication shall not exceed twice the plate thickness.
3.2.9.4.1.2 Multiple linear indications. Multiple linear indications shallnot exceed 1-1/2 times the plate thickness if two or more lie in the sameplane. The total length of indications in one plane, in any four inch length,shall not exceed twice the plate thickness. No more than ten indications,whether in one plane or' multiple planes, are permitted in any four inch length.
3.2.9.4.1.3 Cracks. All cracks are rejectable.
3.2.9.4.1.4 Removal of large indications. Large indications shall beremoved by the manufacturer or processor by grinding, provided the resultingcavity does not exceed 1/4 inch.
167

4. QUALIMY ASSURANCE ?ROVIS:0:S
4.1 ResoonsibilitZ for insnection. Urless otherwise specified in :hecontract or purchase order ksee o.2), the contractor is responsible for theperformace of all inspection requirements as specified herein. Except asotherwise specified in the contract or order, the contractor may use h's ownor any other facility suitable for the performance of the inspectionrequirements specified herein, unless disapproved by the Government. The
Government reserves the right to perform any of the inspections set forth inthe specifications where such inspections are deemed necessary to assure thatsupplies and services conform to prescribed requirements.
4.1.1 Responsibility for compliance. All items must meet all requirements
of sections 3 and 5. The inspection set forth in this specification shall
become a part of the contractor's overall inspection system or qualityprogram. The absence of any inspection requirements in the specification
shall not relieve the contractor of the responsibility of assuring that all
products or supplies submitted to the Government for acceptance comply with
all requirements of the contract. Sampling in quality conformance does notauthorize submission of known defective material, either indicated or actual.
nor does it commit the Government to acceptance of defective material.
4.2 Classification.
4.2.1 Classification of inspection. The inspection requirements specifiedherein are classified as follows:
1. First article inspection (see 4.2.1.1).2. Quality conformance inspection (see 4.2.1.2).
4.2.1.1 First article inspection. When required (see 6.2), the first
article samples submitted in accordance with 3.1, shall be examined for allthe provisions of this specification applicable to end item examination.
4.2.1.1.1 First article tests. First article tests shall consist of allthe tests specified in 4.6 (see 6.2.2).
4.2.1.1.2 First article ballistic test. Unless otherwise specified (see
3.1. 6.2 and 6.4), the first article ballistic test shall not be requiredprovided (a) the manufacturer, within 37 months, has produced acceptable
plates within the same nominal thickness ranges of table VI and (b) hisproduction conditions are the same as for previously accepted plates. A
supplier who has previously met the first article requirements will furnishthe procuring activity with the pertinent data relative to compliance withfirst article test.
4.2.1.2 Quality conformance (acceptance) inspection. The acceptance
examination under 4.5 and the tests under 4.6 shall serve as a basis for theacceptance of individual production lots.
4.3 Lot. A lot shall consist of all production and ballistic test platesof the same melt of steel, of the same thickness, having the same treatment,and heat-treated with the same thermal cycle in the same production furnaceks)in the same facility. When specified (see 4.3.1 and 6.2). production and
168

:4UL-A-46DiCD,( "4R j'
ballistic test plates may be allowed to be heat-treated separately. The testplate shall be heat-treated in a production furnace.
4.3.1 Separately heat treated ballistic test Dlate. When a ballistic testplate is allowed to be heat-treated separately from the production plates itrepresents, the production plates shall remain in the non-heat treatedcondition (as rolled condition only) until the results are received from thetesting activity showing that the ballistic test plate has passed (see 6.15).Note: If the ballistic teat plate is separately heat-treated it will be sostated in the data to be supplied in accordance with MIL-STD-367.
4.4 Sampling.
.4.4.1 For first article.
4.4.1.1 Chemical analysis samples. One sample for chemical analysis shallbe taken from each plate submitted.
4.4.1.2 Impact samples. At least two impact test specimens shall be takenfrom each test plate submitted for ballistic testing.
4.4.1.3 Ballistic samples. Two ballistic test plates of the same orderedthickness for each nominal thickness range shown in table VI below shall besubmitted for ballistic testing and shall represent any other thickness in therange. One sample shall be taken from the first plate heat treated and onefrom the last plate heat treated in the initial lot produced. When only oneplate is heat treated, a sample shall be taken from each end of the plate.The ballistic test plates shall be 12 inches by 36 inches.
TABLE VI. Thickness ranges and corresDonding test projectilesfor first article testing (a).
Nominal thickness Obliquity Testrange (inches) (degrees) Projectile
0.125 to 0.300 incl. 30 Cal .30 AP, M20.301 to 0.590 incl. 30 Cal .50 AP, ,420.591 to 0.765 incl. 30 14.5 mm API, B320.766 to 1.065 incl. 30 14.5 mm API, BS411.066 to 2.000 incl. 0 20 mm API-T, M602
(a) Minimum required ballistic limits are tabulated in tables VII through X ofthe Appendix. The plates are tested at 300 obliquity.
4.4.1.4 Bend test sammles. Unless otherwise specified (see 6.2), twosamples shall be taken from each submitted test plate and shall be tested inaccordance with 4.6.4 and shall meet the requirements of 3.2.5.
4.4.2 Sampling for'ouality conformance inspection.
4.4.2.1 For chemical analysis. At least one sample for chemical analysisshall be taken from each heat in accordance with the applicable methodspecified in ASTM A751 (see 6.5).
169
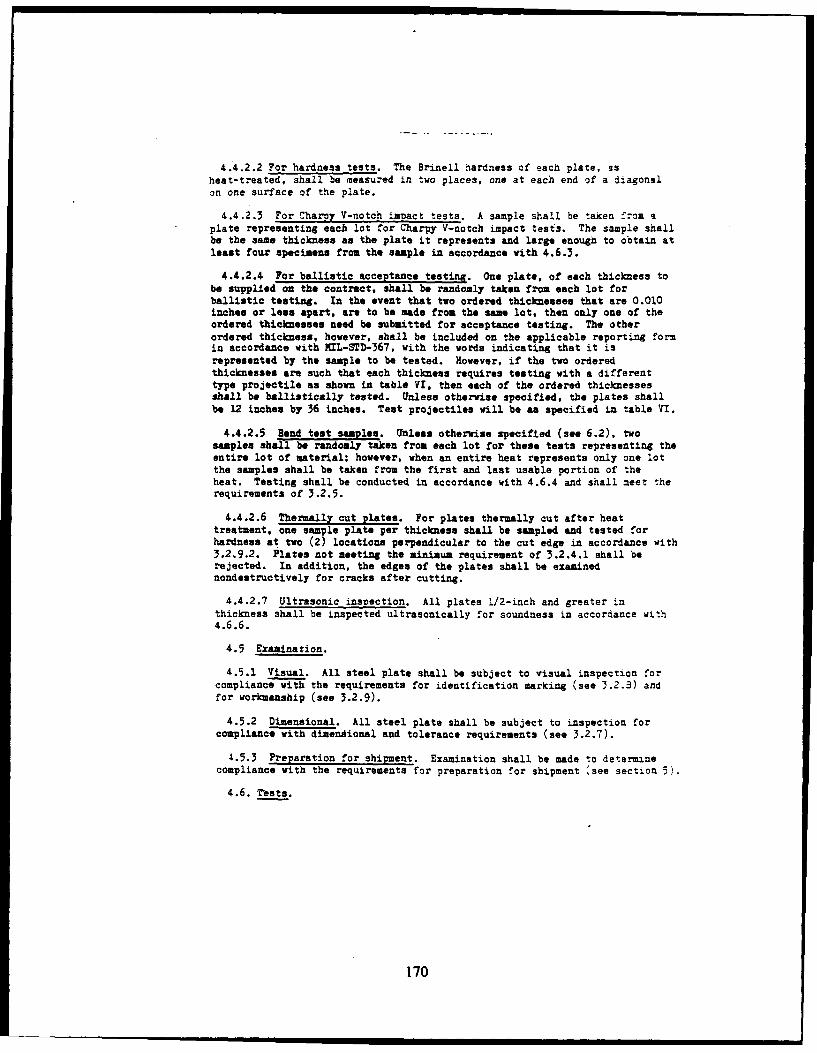
4.4.2.2 For hardness tests. The Brinell hardness of each plate, asheat-treated, shall be measured in two places, one at each end of a diagonalon one surface of the plate.
4.4.2.3 For CharDy V-notch impact tests. A sample shall be taken from aplate representing each lot for Charpy V-notch impact tests. The sample shallbe the same thickness as the plate it represents and large enough to ootain atleast four specimens from the sample in accordance with 4.6.3.
4.4.2.4 For ballistic acceptance testing. One plate, of each thickness tobe supplied on the contract, shall be randomly taken from each lot forballistic testing. In the event that two ordered thicknesses that are 0.010inches or less apart, are to be made from the same lot, then only one of theordered thicknesses need be submitted for acceptance testing. The otherordered thickness, however, shall be included on the applicable reporting formin accordance with MIL-STD-367, with the words indicating that it isrepresented by the sample to be tested. However, if the two orderedthicknesses are such that each thickness requires testing with a differenttype projectile as shown in table VI, then each of the ordered thicknessesshall be ballistically tested. Unless otherwise specified, the plates shallbe 12 inches by 36 inches. Test projectiles will be as specified in table VI.
4.4.2.5 Bend test samples. Unless otherwise specified (see 6.2), twosamples shall be randomly taken from each lot for these tests representing theentire lot of material; however, when an entire heat represents only one lotthe samples shall be taken from the first and last usable portion of theheat. Testing shall be conducted in accordance with 4.6.4 and shall meet therequirements of 3.2.5.
4.4.2.6 Thermally cut plates. For plates thermally cut after heattreatment, one sample plate per thickness shall be sampled and tested forhardness at two (2) locations perpendicular to the cut edge in accordance with3.2.9.2. Plates not meeting the minimum requirement of 3.2.4.1 shall berejected. In addition, the edges of the plates shall be examinednondestructively for cracks after cutting.
4.4.2.7 Ultrasonic inspection. All plates 1/2-inch and greater inthickness shall be inspected ultrasonically for soundness in accordance with4.6.6.
4.5 Examination.
4.5.1 Visual. All steel plate shall be subject to visual inspection forcompliance with the requirements for identification marking (see 3.2.5) andfor workmanship (see 3.2.9).
4.5.2 Dimensional. All steel plate shall be subject to inspection forcompliance with dimendional and tolerance requirements (see 3.2.7).
4.5.3 Preparation for shipment. Examination shall be made to determinecompliance with the requirements for preparation for shipment ýsee section 5).
4.6. rests.
170

MIL-A-4610OD(MR)
4.6.1 Chemical analysis. Chemical analysis shall be conducted inaccordance-with the applicable method specified in ASTM A751 (see 6.5). Theanalysis shall comply with the declared composition established in accordancewith the requirements of table I (see 3.2.1).
4.6.2 Hardness tests. Brinell hardness tests (HB) shall be conducted inaccordance with ASTM ElO, using a l0=a carbide ball and a 3000 kilogram load.Surface scale and decarburization shall be removed from the areas where thetests are to be made. However, no more that 0.060" shall be removed from thetest area. Hardness tests may be made on the surfaces of pieces cut from theplate after heat treatment.
4.6.2.1 Rockwell hardness tests. For plates less than 3/16 inch inthickness, Rockwell - C hardness tests (HRC) shall be substituted for HBtests. Tests shall be conducted in accordance with ASTM El8 and the readingsshall be converted to HB.
4.6.3 Charpy V-notch impact tests. At least four Charpy V-notch impacttest specimens shall be taken from the sample and shall be prepared and testedin accordance with ASTM E23. Charpy V-notch impact test specimens shall betaken in both the TL orientation and in the LT orientation from locationsmidway between the top and bottom surfaces of the plate and at least 4 inchesor 2T, whichever is less, from any quenched edge as well as outside the heataffected zone of any oxygen-cut edge. The largest attainable subsize CharpyV-notch impact specimens shown in figure 7 of ASTW E23 shall be used.
4.6.4 Bend test: The bend test shall be conducted in accordance withASTM E290 using method Arrangement C.
4.6.5 Ballistic tests. Ballistic testing of armor plate shall be conductedat a Government test facility specified in the contract or order (see 6.2).Testing shall be conducted in accordance with the requirements of the appendixof this specification.
4.6.6 Ultrasonic examination.
4.6.6.1 Inspection eauirment. The ultrasonic'soundness inspectionequipment shall conform to ASTM A578.
4.6.6.2 Procedure. Unless otherwise specified (see 6.2) the ultrasonicexamination shall be carried out in accordance with ASTM A578 with thefollowing exceptions.
(a) Scanning shall be continuous over 100' of the plate surface.
(b) Scanning rate shall be at a speed where recordable discontinuitiescan be detected.
(c) The testing frequency shall be a minimum of 2-1/4 megahertz (O(z).
(d) Any area within a plate where a discontinuity produces a continuoustotal loss of back reflection accompanied by continuous indications on thesame plane that cannot be encompassed within a circle whose diameter is i-In.shall be cause for rejection of that plate. All discontinuities will beevaluated using a frequency of 2-1/4 megahertz (•!Hz).
171

4.6.6.3 Certification of inspection personnel. Unless otherwize snecified(see 6.2), personnel performing u-trasor.-c innpection shall comply wi~b thequalification requirements of "4IL-STZ-410. level II. or equivalent, as!etermined by QSTAG 335 (see 6.11).
4.7 Reduced testing. At the discretion of the procuring activity, theamount of testing may be reduced provided the results on consecutive lotsindicate that a satisfactory uniform product meeting the testing requirementsis being produced (see 6.2). Reduced testing shall be in accordance with asystem previously approved or established by the procuring activity involved.
4.8 Rejection and retest.
4.8.1 Rejection. Unless otherwise specified in the contract or order (see6.2), failure of the first article samples to meet the requirements of thisspecification shall be cause for rejection of the process, failure of theacceptance samples to meet the requirements of this specification shall because for rejection of the lot (see 4.8.2).
4.8.2 Retest. Unless specific retest procedure is specified in thecontract or order (see 6.2), two retest samples shall be submitted for eachfailed sample. Failure of either of the retest samples (plates) shall because for rejection of the material. First article retests shall not bepermitted until the supplier has made the necessary corrections in theprocessing of the material to the satisfaction of the procuring activity.
5. PACKAGING
5.1 Preservation and Packaging. Preservation and packaging shall be levelA or C as specified (see 6.2).
5.1.1 Level A. Cleaning, drying, preservation, and packaging shall be inaccordance with MIL-STD-163.
5.1.2 Level C. Cleaning, drying, preservation, and packaging shall be in
accordance with manufacturer's commercial practice.
5.2 Packing. Packing shall be level A or level C as specified (see 6.2).
5.2.1 Level A. Packing shall be in accordance with MIL-STD-163.
5.2.2 Level C. Packing shall be in accordance with commercial practiceadequate to ensure acceptance and safe delivery by the carrier for the modeof transportation employed.
5.3 Marking. In addition to any special marking specified in the contractor order, shipments shall be marked in accordance with the requirements ofMIL-STD-129.
6. NOTES
6.1 Intended use. The steel armor covered by this specification isintended for lightweight applications where resistance to ball and armorpiercing types of ammunition and multiple hit capability are required.
172

MIL-A-46100D0(R)
6.2 Ordering data.
6.2.1 Procurement requirements. Procurement documents should specify :nefollowing:
a. Title, number and date of this specificationb. If first article samples are to be made available (see 3.1).c. If additional heat treatment may be performed (see 3.2).d. If plate* may be furnished in a condition other than in 3.2.2.e. Dimensions (see 3.2.7).f. Name of inspection agency when inspection shall be performed by
other than the contractor (see 4.1).g. If first article testing is required (see 4.2.1.1).h. When a special first article ballistic tested is required
(aee 3.1, 4.2.1.1.2 and 6.9).i. If lot is different than 4.3.J. Production sampling if other than in 4.4.2.5.k. If different certification of inspection personnel is required
(see 4.6.6.3).i. Where ballistic testing is to be conducted (see 4.6.5).a. The reduced testing plan when applicable (see 4.7).n. If rejection and retest differ from 4.8.o. Preparation for delivery requirements (see section 5).p. If different ultrasonic test procedures are required
(see 4.6.6.2).
6.2.2 Data reouirements. When this specification is used in an acquisitionand data are required to be delivered, the data requirements identifi.A belowshall be developed as specified by an approved Data Item Description (DD Form1664) and delivered in accordance with the approved Contract Data RequirementsList (CDRL), incorporated into the contract. When the provisions of DOD FARsupplement, Part 27, Sub-Part 27.475-1 (DDPorm 1423) are invoked and the DDForm 1423 is not used, the data specified below shall be delivered by thecontractor in accordance with the contract or purchase order requirements.Deliverable data required by this specification are cited in the followingparagraphs.
Paragraph No. Data Reauirement Title Avolicable DID No. Ontion
3.1, 4.2.1.1.1 Report, First Article UDI-T-23790Test
3.2.1 Armor Material Test DI-MISC-80073 Format IReports
(Copies of DID's required by contractors in connection with specificacquisition functions should be obtained from the Naval Publication and FormsCenter or as directed by the contracting officer.)
6.3 Fabfication. The armor plate covered by this specification is subjectto fabrication involving cutting, drilling, forming, and welding. It isintended that selection and control of chemical composition, cleanliness, andplate processing will be such that the armor will be suitable for fabricationunder procedures and controls such as specified in .IL-STD-1185, Welding HighHardness Armor.
173

"UT1L-A-461COD( MR)
6.3.1 Plate Cutting. To reduce the totential f:r plate c:ac-.~:n, :t :3important that plates should not be cut by cold sheartng after final heat
treatment.
6.4 Soecial First Article ballistic test. Special first article bal__sUic
tests are required when the manufacturer changes either the heat treatment orthe declared chemistry of the armor.
6.5 Chemical analysis. Suggested ASTM instrumental methods that can beused for chemical analysis are E415, E282, E484 and E322. ASTM A751 should beconsulted for a complete list of methods.
6.6 KEL-STD-367. MIL-STD-367 replaces Form NIL 46100 and TAC Form 3983.
6.7 Potential suppliers. Potential suppliers who have not previouslysupplied armor plate to NIL-A-46100 and wish to have their materialballistically tested, may do so at their own expense. It is recommended thatinquiries for such testing be directed to Commander, US Army CSTA, ATTN:AMSTE-TO-0, Aberdeen Proving Ground, MD 21005.
6.8 Metric units. When metric dimensions are required, units for inch,foot, foot-pounds and feet per second may be coverted to the metric equivalentby multiplying them by the following conversion factors:
English Multiply by Equals Metric SI unit
inch 0.0254 * meter (m)foot 0.3048 meter (m)foot-lb 1.3558 - joule (J)feet/sec 0.3048 - meter per second (m/s)
Note: Conversion factors can be associated with ASTM E380 entitled "MetricPractice Guide."
6.9 New contracts sponsored by government agencies. At the time that a newcontract is initiated for the production of combat vehicles, the contractor'ssupplier is to estimate the number, size and delivery schedule ofthe ballistic test plates which are to be submitted for first article oracceptance testing (see-6.2). A lead time of 60 days after the contract hasbeen signed is to be allowed prior to shipment of the first ballistic test(s)to APG to insure that all administrative functions for the establishment of anew CSTA project have been completed in preparation for the test. Thecontracting government activity is to initiate the new project through aletter to Commander, US Army CSTA, ATTN: ANSTE-TO-0. Aberdeen Proving Iround,MD 21005-5059 requesting a cost estimate for the ballistic testing of theapplicable number and sizes of plates. In the case of increases in scope ofexisting projects, similar correspondence is needed.
6.10 Definitions.
6.10.1 Slivers. An imperfection consisting of a very thin elongated pieceof metal attached by only one end to the parent metal into whose surface ithas been worked.
174

6.10.2 La.s. A surface imperfection with the appearance of a seam, causedby hot metal, fins or sharp corners being folded over and thus being forged orrolled into the surface but without being welded.
6.10.3 Checks. Numerous very fine cracks at the surface of a metal part.Checks may appear during processing or during service and are most oftenassociated with thermal cycling or thermal treatment. Also called checkmarks, checking, heat checks.
6.10.4 Seams. An unwelded fold or lap that appears as a crack, usuallyresulting from a discontinuity on a metal surface.
6.10.5 Blisters. A raised area, often dome shaped, resulting fromdelamination under pressure of expanding gas trapped in metal in a nearsub-surface zone. Very small blisters may be called pinhead blisters orpepper blisters.
6.10.6 Snakes. Any crooked surface imperfection in a metal plate,resembling a snake.
6.10.7 Cold shuts. A lap cn the surface of a forging or billet that wasclosed without fusion during deformation.
6.10.8 Burning. Permanently damaged metal due to overheating enough tocause incipient melting or intergranular oxidations. Note: This condition isusually obscured by normal cleaning methods and would require deep picklingand/or metallography to note the continuous oxidation (chicken wire effect) ofthe enlarged grain boundaries. This defect is usually not limited to thesurface and may be sub-surface or at interior locations when associated withheavy mechanical working. Metal with these conditions shall be scrapped.
6.10.9 Laminations. A type of discontinuity with separation or weaknessgenerally aligned parallel to direction of the worked surface of the metal andmay be the result of pipe blisters, seams, inclusions, or segregationelongated and made directional by working.
6.10.10 Linear indication. For nondestructive examination purposes, alinear indication is evidence of a discontinuity that requires interpretationto determine its significance.
6.11 Quadripartite standardization agreement (ýSTAG). QSTAG 335,pertaining to the certification of personnel for ultrasonic inspection, statesthat level I of Canadian Government specification Board Standard 48-GP-7M ýsequivalent to KEL-STD-410, level I1.
6.12 Certain provisions of this specification (see 6.11) are the subsect ofinternational standardization agreement (QSTAG 335). When amendment,revision, or cancellation of this specification is proposed which will modifythe international agreement concerned, the preparing activity will takeappropriate action through international standardization channels includingdepartmental standardizational offices to change the agreement or make otherappropriate accommodations.
175

6.13 Plates in the as-rolled condition. When the fabrinator zerfo.-rs :hefinal quench and temper of plates, it shall be his responsibility that tremechanical and ballistic requirements of the plates, •eet this spec:fia:-cn.
6.14 Subject term (key word) listing.
Armor - lightweight Heat-treated armor platesBallistic testing Wrought steel, high-hardness
6.15 Caution for production plates. Material made to this specificationhas a tendency to develop stress cracks if not tempered as soon as possibleafter austenizing. To avoid this situation where plates may be left in theaustenized condition and in the untempered state while waiting to receive theresults of the ballistic test plate representing the lot, all the plates inthe lot shall be left in the as-rolled (unheat-treated) condition.
Custodian: Preparing activity:Army - MR Army -MR
Review activities: Project 9515-AO02Army - AT, EA, AR, TEDLA - IS
(WP# ID-29OIA/DISC-0393A. FOR XTL USE ONLY)
176

MIL-A-461OOD(MR)
APPENDIX
BALLISTIC TESTING OF A14OR PLATE, STEEL, 'WROUGHTHIGH HARDNESS
10. SCOPE
10.1 This appendix covers the requirements for ballistic testing of highhardness steel armor plate.
20. DEFINITIONS
20.1 Fair impact. A fair impact is an impact resulting from the strikingof the test plate by a projectile in normal flight (no yawing or tumbling) andseparated from another impact or the edge of the plate, hole, crack, orspalled area by an undisturbed area of at least two test projectile diameters.
20.2 Witness sheet. A witness sheet is normally a 0.014 inch thick sheetof 5052 H36 aluminum alloy (or a 0.020 inch thick sheet of 2024-T3 aluminumalloy) placed 6 inches (+1/2 inch) behind and parallel to the test plate orother ballistic sample.
20.3 Complete penetration, protection, CP(P). A protection completepenetration is a penetration in which the projectile or oue or more fragmentsof the projectile or plate pass beyond the back of the test plate andperforates the witness plate.
20.4 Partial penetration, protection, PP(P). A partial penetration is anyimpact that is not a complete pentration.
20.5 Cap. The difference in velocity between the high partial penetrationvelocity and the low complete penetration velocity used in computing theballistic limit where the high partial penetration velocity is lower than thelow complete penetration velocity..
20.6 V50 protection ballistic limit, BL(P). The protection V50ballistic limit is defined as the average of 6 fair impact velocitiescomprising the three lowest velocities resulting in complete penetration andthe three h-ghest velocities resulting in partial penetration. A maximumspread of 150 feet per second shall be permitted between the lowest andhighest velocities employed in determination of ballistic limits. In onlythose cases where the lowest complete penetration velocity is lower than thehighest parital penetration velocity by more than 150 fps will the ballisticlimit be based on 10 velocities (the 5 lowest velocities that resulted incomplete penetration and the 5 highest velocities that resulted in partialpenetrations). When the 10-round excessive spread, ballistic limit is used,the velocity spread will be reduced to the lowest partical level (as close to150 fps as possible). -When a 10-round ballistic limit is used, this will benoted in all reports. The normal up-and-down firing method will be used inthe determination of all BL(P)'s, all velocities being corrected to strikingvelocity. In the event that the ballistic limit computed is less than 30 fpsabove the minimum required and if a gap (high partial penetration velocitybelow the low complete penetration velocity) of 30 'pa or more exists, firingwill continue as needed to reduce this gap to 25 .ps or less. (This procedurewill insure better evaluation of the steel when the ballistic limit is nearthe minimum required.)
177

20.7 Thickness. imoact area. The thickness of ballistic :est plates asedfor determining ballistic ii.its sha2. te that of the area sucjected :o :heballistic testing.
30. REQUIREMENTS
30.1 Resistance to penetration. The minimum ballistic limits shall be inaccordance with the values shown in tables VII, VIII, IX, X or XI asapplicable.
30.2 Resistance to cracking. Ballistic test plates when visually examinedafter testing shall not develop any through-crack greater in length than fivecalibers of the projectile.
40. TESTS
40.1 Ballistic tests. V5 0 ballistic tests shall be performed inaccordance with USATECON TOP 2-2-170, Ballistic Tests of Armor Materials todetermine compliance with the requirements of tables VII through XI.
40.1.1 Plate thickness as measured by the ballistic test agency shall beused to determine the required ballistic limit for the plate. Individualthickness measurements are to be read from a micrometer to the nearest 0.001inch and the average of the-e readings reported to the nearest 0.001 inch. Atleast one measurement shall be taken along each edge of the plate at adistance of at least one inch from the edge. but preferably in the area whicnwill be impacted. The average of the measurements to the nearest 0.001 inchwill be used to determine the minimum ballistic limit requirements ý.n -heappropriate tables (tables VII through XI). -The required ballistic limit willbe determined by interpolation, if necessary, in the tables in the appendix.
40.1.2 Rejection and retest of ballistic plates.
40.1.2.1 First article tests (rejection). Unless noted otherwise in thecontract or order, failure of either of the first article test plates to meetthe minimum ballistic requirements as specified in the appendix to thisspecification indicates failure of the product and process.
40.1.2.2 First article (retests). Resubmission of ballistic retest platesshall not be made until the manufacturer has made the necessary corrections nthe processing of the material to the satisfaction of the procuring activity.Two retest plates must be submitted for first article testing and both mustpass.
40.1.2.3 Acceptance tests (rejection). Unless otherwise noted in thecontract or order, failure of a test plate to meet the ballistic requirementsindicates failure of the lot, however, the final decision will depend on theoutcome of retests, if submitted.
40.1.2.4 Acceptance tests (retests). if a test plate representing a lotfails to meet the ballistic requirements, the manufacturer has the follow•.agoptions: Immediately upon notification of the failure, he may:
(1) At his own expense submit two additional test plates from the samelot for ballistic retest, or
178

(2) Te may first re-heat-treat (quenching and tempering) the lot and
then submit a test plate from the re-treated lot, or
(3) He may scrap the lot and submit a plate representing a new -- t for
acceptance.
If he chooses any one of these options and the ballistic retest plate (or
plates) meet the requirements, then the lot represented is acceptable. If he
chooses option (1) and one or both of the retest plates fail, the manufacturer
may re-heat-treat the lot and submit a test plate from the retreated lot. If
this plate fails, the lot is rejected. If he chooses option (3) and the test
plate fails, he may again resort to any one of the three options. Themanufacturer shall report the processing used on the failed plates.
40.1.3 DisPostion of ballistic test plates.
40.1.3.1 First article test plates. Upon request of the applicant within
15 days after ballistic testing, first article plates will be returned "as is"
to the applicant, at his expense, unless the plates were destroyed in testing.
40.1.3.2 Acceptance test plates. Acceptance test plates that comply with
the requirements of this specification are considered as part of the lot of
steel they represent and ownership of then passes to the Government with the
acceptance of that lot. Acceptance test plates that fail to comply with the
requirements of this specification are considered as part of the lot thej
represent and remain the property of the producer Just as the rejectable lot
does. The failed plates will be returned, upon request, as in 40.1.3.1.
179

TABLE VII. 4inimum recui•ed balljstic lizmits - ^..-'ber .30AT '2 ?rc-ec:1.e it -0 legrees 7b=7ozity.
Thickness Required Thickness Required Thickness Requa-.-edinches BL(P) FPS inches BL(P) FPS inches BL(P) FPS
0.100 994 0.185 1799 0.265 23280.105 1057 0.190 1836 0.270 23570.110 1116 0.195 1872 0.275 23860.115 1172 0.200 1908 0.280 24150.120 1226 0.205 1943 0.285 2443
1/ 0.125 1279 0.210 1978 0.290 24710.130 1329 0.215 2012 0,295 24990.135 1378 0.220 2046 0.300 25260.140 1425 0.225 2079 0.305 25540.145 1471 0.230 2111 0.310 25810.150 1515 0.235 2144 2/ 0.315 26070.155 1558 0.240 2175 0.320 26340.160 1601 0.245 2207 0.325 26600.165 1642 0.250 2237 0.330 26860.170 1682 0.255 2268 0.335 27110.175 1722 0.260 2298 . 4U 27370.180 1761
I/ Specification requirements begin for this ordered thickness.2/ Specification requirements end for this ordered thickness.
Note: Numbers above and below upper and lower limits are requirements forwithin the tolerance limits.
180

TABLE VII. Minimum required ballistic limits - Caliber .50AP r42 ?rojectile at 30 degrees Obliquity.
Thickness Required Thickness Required Thickness Required
inches EL(P) FPS inches BL(P) FPS inches BL(P) FPS
0.290 1783 0.400 2151 0.515 24810.295 1801 0.405 2166 0.520 24940.300 1820 0.410 2182 0.525 25080.305 1837 0.415 2197 0.530 25210.310 1855 0.420 2212 0.535 25340.315 1873 0.425 2227 0.540 2547
l/ 0.316 1876 0.430 2242 0.545 2560
0.320 1890 0.435 2256 0.550 25730.325 1907 0.440 2271 0.555 2586
0.330 1925 0.445 2286 0.560 2599
0.335 1942 0.450 2300 0.565 26120.340 1958 0.455 2314 0.570 2625
0.345 1975 0.460 2329 0.575 26380.350 1992 0.465 2343 0.580 26500.355 2008 0.470 2357 0.585 26630.360 2025 0.475 2371 2/ 0.590 26750.365 2041 0.480 2385 0.595 2688
0.370 2057 0.485 2399 0.600 27000.375 2073 0.490 2413 0.605 27713
0.380 2089 0.495 2427 0.610 27250.385 2104 0.500 2440 0.615 2737
0.390 2120 0.505 2454 0.620 2750
0.395 2136 0.510 2468 0.625 2762
I/ Specification requirements begin for this ordered thickness.j/ Specification requirements end for this ordered thickness.
Note: Numbers above and below upper and lower limits are requirements forvithin the tolerance limits.
181

TABLE IX. '~inimum resuired bailis•:c limits - 14.5 mmAPI 3 32 ?rczect:e at "0 degrees )blicui:Z.
Thickness Required Thickness Required Thickness Requlredinches BL(P) FPS inches BL(P) FPS inches BL,'?) FPS
0.575 2320 0.645 2469 0.720 26210.580 2331 0.650 2480 0.725 26300.585 2342 0.655 2490 0.730 26400.590 2353 0.660 2500 0.735 2650
1/ 0.591 2355 0.665 2511 0.740 26590.595 2364 0.670 2521 0.745 26690.600 2374 0.675 2531 0.750 26790.605 2385 0.680 2541 0.735 26880.610 2396 0.685 2551 0.760 26980.615 2407 0.690 2561 2/ 0.765 27070.620 2417 0.695 2571 0.770 27170.625 2428 0.700 2581 0.775 27260.630 2438 0.705 2591 0.780 27360.635 2449 0.710 2601 0.785 27450.640 2459 0.715 2611 0.790 2754
I/ Specification requirements begin for this ordered thickness.T/ Specification requirements end for this ordered thickness.
Note: Numbers above and below upper and lower limits are requirements forwithin the tolerance limits.
182

TABLE X. Kinimum required ballistic limits - 14.5 mmAPI •S41 Pro.jectile at 30 degrees Obliouity.
Thickness Required Thi.ckness Required Thickness Requiredinches BL(P) FPS inches BL(P) FPS inches BL(P) FPS
0.740 2212 0.855 2505 0.975 27790.745 2225 0.860 2517 0.980 27900.750 2239 0.865 2529 0.985 28000.755 2252 0.870 2540 0.990 281.10.760 2265 0.875 2552 0.995 28220.765 2278 0.880 2564 1.000 (i )
1/ 0.766 2281 0.885 2576 1.005 28430.770 2292 0.890 2588 1.010 28540.775 2305 0.895 2599 1.015 28650.780 2318 0.900 2611 1.020 28750.785 2331 0.905 2622 1.025 28860.790 2343 0.910 2634 1.030 28960.795 2356 0.915 2645 1.035 29070.800 2369 0.920 2657 1.040 29170.805 2382 0.925 2668 1.045 29270.810 2394 0.930 2679 1.050 29380.815 2407 0.935 2690 1.055 29480.820 2419 0.940 2702 1.060 29580.825 2431 0.945 2713 2/ 1.065 29680.830 2444 0.950 2724 1.070 29790.835 2456 0.955 2735 11.075 29890.840 2468 0.960 2746 1.080 29990.845 2481 0.965 2757 1.085 30090.850 2493 0.970 2768 1.090 3019
I/ Specification requirements begin for this ordered thickness.V Specification requirements end for this ordered thickness.
Note: Numbers above and below upper and lower limits are requirements forwithin the tolerance limits.
183

NIL-A-4613OD( MR)
TABLE XI. Minimum required ballistic limits - 20 maAPI-T, lb,;2 ?rojectile at 0 degrees Obliouitv.
Thickness Required Thickness Required Thickness Requ-redinches BL(PY FPS inches BL(P) FPS inches 3L1?) FPS
1.020 1758 1.215 2088 1.415 23821.025 1767 1.220 2096 1.420 23891.030 1776 1.225 2104 1.425 23961.035 1785 1.230 2112 1.430 24021.040 1794 1.235 2120 1.435 24091.045 1804 1.240 2127 1.440 24161.050 1813 1.245 2135 1.445 2423
1.055 1821 1.250 2143 1.450 24301.060 1830 1.255 2150 1.455 24361.065 1839 1.260 2158 1.460 2443
1/ 1.066 1841 1.265 2165 1.465 24501.070 1848 1.270 2173 1.470 24571.075 1857 1.275 2180 1.475 24631.080 1866 1.280 2188 1.480 24701.085 1874 1.285 2195 1.485 24771.090 1883 1.290 2203 1.490 24831.095 1892 1.295 2210 1.495 24901.100 1900 1.300 2218 1.500 24961,105 1909 1.305 2225 1.505 25031.110 1917 1.310 2232 1.510 25101.115 1926 1.315 2240 1.515 25!61.120 1934 1.320 2247 1.520 25231.125 1943 1.325 2254 1.525 25291.130 1951 1.330 2262 1.530 25361.135 1959 1.335 2269 1.535 25421.140 1968 1.340 2276 1.540 25491.145 1976 1.345 2283 1.545 25551.150 1984 1.350 2290 1.550 25611.155 1992 1.355 2298 1.555 25681.160 2001 1.360 2305 1.560 25741.165 2009 1.365 2312 -1.565 25811.170 2017 1.370 2319 1.570 25671.175 2025 1.375 2326 1.575 25931.180 2033 1.380 2333 1.580 26001.185 2041 1.385 2340 i.585 26061.190 2049 1.390 2347 1.590 26121.195 2057 1.395 2354 1.595 26191.200 2065 1.400 2361 1.600 26251.205 2073 1.405 2368 1.605 26311.210 2081 1.410 2375 1.610 2637
184

TABLE X1. Minimum required ballistic limits - 20API-T. M602 Projectile at 0 degrees Oblicuit'-. (Continued)
Thickness Required Thickness Required Thickness Requiredinches EL(P) FPS inches BL(P) FFS inches BL(P) FPS
1.615 2644 1.805 2871 1.995 30821.620 2650 1.810 2877 2.000 30881.625 2656 1.815 2883 2.005 30931.630 2662 1.820 2888 2.010 30981.635 2669 1.825 2894 2.015 31041.640 2675 1.830 2900 2.020 31091.645 2681 1.835 2905 2.025 31141.650 2687 1.840 2911 2.030 31201.655 2693 1.845 2917 2.035 31251.660 2699 1.850 2922 2.040 31301.665 2705 1.855 2928 2.045 31351.670 2711 1.860 2934 2.050 31411.675 2718 1.865 2939 2.055 31461.680 2724 1.870 2945 2.060 31511.685 2730 1.875 2951 2.065 31561.690 2736 1.880 2956 2.070 31621.695 2742 1.885 2962 2.075 31671.700 2748 1.890 2967 2.080 31721.705 2754 1.895 2973 2.085 31771.710 2760 1.900 2978 2.090 31831.715 2766 1.905 2984 2.095 31981.720 2772 1.910 2990 2/ 2.100 31931.725 2778 1.915 2995 2.105 31981.730 2784 1.920 3001 2.110 32031.735. 2789 1.925 3006 2.115 32081.740 2795 1.930 3012 2.120 32141.745 2801 1.935 3017 2.125 32191.750 2807 1.940 3023 2.130 32241.755 2813 1.945 3028 2.135 32291.760 2819 1.950 3033 2.140 32341.765 2825 1.955 3039 2.145 32391.770 2831 1.960 3044 2.150 32441.775 2836 1.965 3050 2.155 32501.780 2842 1.970 3055 2.160 32551.785 2848 1.975 3061 2.165 32601.790 2854 1.980 3066 2.170 32651.795 2860 1.985 3071 2.175 32701.800 2865 1.990 3077
I/ Specification requirements begin for this ordered thickness.2/ Specification requiremeans end for this ordered thickness.
Note: Tabulated values on either side of the specification requirements arefor interpolation of iL(?) requirements on undersize or oversze plates.
185