hynix initiation
45
EQUITY RESEARCH Technology | Asia ex-Japan Semiconductors | 21 November 2011 HYNIX SEMICONDUCTOR Initiate with a 1-OW: Re-armed and ready We initiate on Hynix with a 1-OW rating and PT of KRW27,000 based on 1.92x 2012E P/B, the 5-year average. The DRAM industry is experiencing its worst slowdown since 2008 due to falling global PC demand growth, exacerbated by recent flooding in Thailand, which has affected the whole PC supply-chain. Although the global DRAM industry is undergoing a structural de-rating, we have confidence that Hynix will emerge stronger from these changes for a number of reasons, including increased scale and use of more advanced technology, a shift towards greater NAND exposure, a reinvigorated balance sheet following the recent rights issue, and a well capitalized majority shareholder in SK Telecom. HDD supply disruption to deepen trough but quicken turnaround: We expect the DRAM cycle to start to recover in 2Q12 following a severe downturn during 4Q11-1Q12E due to the impact of HDD shortage on PC production. Our view is based on: 1) significant pent-up demand for PC DRAM from 2Q12 after the material contraction during 4Q11- 1Q12E; and 2) further supply cuts by DRAM manufacturers, especially when DRAM spot prices reach the variable cost level of second-tier players. Well positioned in DRAM survival game: We expect stronger DRAM manufacturers like Hynix to increase market share into the recovery. We look for: 1) increasing earnings contribution from NAND; 2) better execution in DRAM compared with peers (other than Samsung Electronics [SEC]); and 3) significantly improved balance sheet due to the recent rights offering to SK Telecom. Target P/B of 1.92x 2012E BVPS: For valuation, we use historical P/B for the cyclical context, applying the mid-cycle average, as we expect an upcycle for NAND and a downcycle for DRAM. Our price target represents 54.0x 2012E P/E and 11.4x 2013E P/E. Key risks include: 1) potential new owner SK Telecom’s lack of experience in running a highly cyclical business; 2) mistimed execution of DRAM and NAND production. 000660.KS: Financial and Valuation Metrics KRW FY Dec 2009 2010 2011 2012 2013 EPS -590.00A 4486.00A -23.00E 430.00E 2034.00E Previous EPS N/A N/A N/A N/A N/A P/E N/A 5.2 N/A 54.0 11.4 BPS 8,897 12,914 12,014 13,956 15,779 ROE -6.6 32.4 -0.2 3.3 12.7 Source: Barclays Capital Barclays Capital does and seeks to do business with companies covered in its research reports. As a result, investors should be aware that the firm may have a conflict of interest that could affect the objectivity of this report. Investors should consider this report as only a single factor in making their investment decision. This research report has been prepared in whole or in part by research analysts based outside the US who are not registered/qualified as research analysts with FINRA. PLEASE SEE ANALYST CERTIFICATION(S) AND IMPORTANT DISCLOSURES BEGINNING ON PAGE 37 FOR IMPORTANT FIXED INCOME RESEARCH DISCLOSURES, PLEASE SEE PAGE 37 FOR IMPORTANT EQUITY RESEARCH DISCLOSURES, PLEASE SEE PAGE 38. Stock Rating 1-OVERWEIGHT from N/A Sector View 3-NEGATIVE Unchanged Price Target KRW 27000.00 from N/A Price (17-Nov-2011) KRW 23200.00 Potential Upside/Downside +16% Tickers 000660 KS / 000660.KS Market Cap (KRW mn) 13738381 Shares Outstanding (mn) 592.17 Free Float (%) 89.73 52 Wk Avg Daily Volume (mn) 10.6 Dividend Yield (%) N/A Return on Equity TTM (%) N/A Current BVPS (KRW) 0.00 Source: FactSet Fundamentals Price Performance Exchange-KRX 52 Week range KRW 37400.00- 15500.00 Jan- 11 Apr- 11 Jul- 11 Oct- 11 12K 16K 20K 24K 28K 32K 36K 40K Link to Barclays Capital Live for interactive charting Asia ex-Japan Semiconductors SC Bae +82 2 2126 2932 [email protected] BCSL, Seoul Sunwoo Kim +82 2 2126 2934 [email protected] BCSL, Seoul
-
Upload
manastir2000 -
Category
Documents
-
view
68 -
download
4
description
hynix initiation
Transcript of hynix initiation

EQUITY RESEARCH Technology | Asia ex-Japan Semiconductors | 21 November 2011
HYNIX SEMICONDUCTOR Initiate with a 1-OW: Re-armed and ready
We initiate on Hynix with a 1-OW rating and PT of KRW27,000 based on 1.92x 2012E P/B, the 5-year average. The DRAM industry is experiencing its worst slowdown since 2008 due to falling global PC demand growth, exacerbated by recent flooding in Thailand, which has affected the whole PC supply-chain. Although the global DRAM industry is undergoing a structural de-rating, we have confidence that Hynix will emerge stronger from these changes for a number of reasons, including increased scale and use of more advanced technology, a shift towards greater NAND exposure, a reinvigorated balance sheet following the recent rights issue, and a well capitalized majority shareholder in SK Telecom.
HDD supply disruption to deepen trough but quicken turnaround: We expect the DRAM cycle to start to recover in 2Q12 following a severe downturn during 4Q11-1Q12E due to the impact of HDD shortage on PC production. Our view is based on: 1) significant pent-up demand for PC DRAM from 2Q12 after the material contraction during 4Q11-1Q12E; and 2) further supply cuts by DRAM manufacturers, especially when DRAM spot prices reach the variable cost level of second-tier players.
Well positioned in DRAM survival game: We expect stronger DRAM manufacturers like Hynix to increase market share into the recovery. We look for: 1) increasing earnings contribution from NAND; 2) better execution in DRAM compared with peers (other than Samsung Electronics [SEC]); and 3) significantly improved balance sheet due to the recent rights offering to SK Telecom.
Target P/B of 1.92x 2012E BVPS: For valuation, we use historical P/B for the cyclical context, applying the mid-cycle average, as we expect an upcycle for NAND and a downcycle for DRAM. Our price target represents 54.0x 2012E P/E and 11.4x 2013E P/E. Key risks include: 1) potential new owner SK Telecom’s lack of experience in running a highly cyclical business; 2) mistimed execution of DRAM and NAND production.
000660.KS: Financial and Valuation Metrics KRW
FY Dec 2009 2010 2011 2012 2013
EPS -590.00A 4486.00A -23.00E 430.00E 2034.00E
Previous EPS N/A N/A N/A N/A N/A
P/E N/A 5.2 N/A 54.0 11.4
BPS 8,897 12,914 12,014 13,956 15,779
ROE -6.6 32.4 -0.2 3.3 12.7
Source: Barclays Capital
Barclays Capital does and seeks to do business with companies covered in its research reports. As a result,investors should be aware that the firm may have a conflict of interest that could affect the objectivity ofthis report. Investors should consider this report as only a single factor in making their investment decision. This research report has been prepared in whole or in part by research analysts based outside the US whoare not registered/qualified as research analysts with FINRA. PLEASE SEE ANALYST CERTIFICATION(S) AND IMPORTANT DISCLOSURES BEGINNING ON PAGE 37 FOR IMPORTANT FIXED INCOME RESEARCH DISCLOSURES, PLEASE SEE PAGE 37 FOR IMPORTANT EQUITY RESEARCH DISCLOSURES, PLEASE SEE PAGE 38.
Stock Rating 1-OVERWEIGHTfrom N/A
Sector View 3-NEGATIVEUnchanged
Price Target KRW 27000.00from N/A
Price (17-Nov-2011) KRW 23200.00Potential Upside/Downside
+16%
Tickers 000660 KS / 000660.KS
Market Cap (KRW mn) 13738381Shares Outstanding (mn) 592.17Free Float (%) 89.7352 Wk Avg Daily Volume (mn) 10.6Dividend Yield (%) N/AReturn on Equity TTM (%) N/ACurrent BVPS (KRW) 0.00Source: FactSet Fundamentals
Price Performance Exchange-KRX52 Week range KRW 37400.00-
15500.00
Jan- 11 Apr- 11 Jul- 11 Oct- 1112K
16K
20K
24K
28K
32K
36K
40K
Link to Barclays Capital Live for interactive charting
Asia ex-Japan Semiconductors SC Bae +82 2 2126 2932 [email protected] BCSL, Seoul Sunwoo Kim +82 2 2126 2934 [email protected] BCSL, Seoul

Barclays Capital | Hynix Semiconductor
21 November 2011 2
COMPANY SNAPSHOT
Hynix Semiconductor Asia ex-Japan Semiconductors
Income statement (KRWbn) 2010A 2011E 2012E 2013E CAGRRevenue 12,099 10,039 9,782 11,954 -0.4% Stock Rating 1-OVERWEIGHTEBITDA 6,100 3,643 3,758 4,905 -7.0% Sector View 3-NEGATIVEEBIT 3,273 224 227 1,538 -22.3% Price (17-Nov-2011) KRW23,200Pre-tax income 2,696 7 300 1,413 -19.4% Price Target KRW27,000Net income 2,656 (12) 300 1,413 -19.0% Ticker 000660 KSEPS (KRW) 4,486 (23) 430 2,034 -23.2%Diluted EPS (KRW) 4,487 (23) 430 2,034 -23.2% Investment case
Diluted shares (mn) 590.3 591.8 693.6 693.6 5.5%Dividend per share (KRW) 150 0 50 100 -12.6%
Margin and return data (%) AverageGross margin 39.5 14.3 14.9 25.5 23.6 EBITDA margin 50.4 36.3 38.4 41.0 41.5 EBIT margin 27.1 2.2 2.3 12.9 11.1 Pre-tax margin 22.3 0.1 3.1 11.8 9.3 Net margin 22.0 (0.1) 3.1 11.8 9.2 Upside case KRW32,000ROIC 18.8 1.5 1.3 7.7 7.3 ROA 15.6 (0.1) 1.8 7.5 6.2 ROE 32.4 (0.2) 3.3 12.7 12.1
Balance sheet and cash flow statement (KRWbn) CAGRTangible fixed assets 10,817 10,494 10,378 10,529 -0.9%Intangible fixed assets 549 691 754 815 14.1%Cash and equivalents 2,196 1,711 2,517 3,852 20.6% Downside case KRW18,100Total assets 17,584 16,235 17,525 20,048 4.5%Short and long-term debt 6,160 6,173 4,418 4,933 -7.1%Net debt/(funds) 3,963 4,461 1,901 1,081 -35.1%Other long-term liabilities 53 66 66 66 7.6%Total liabilities 9,415 8,434 7,091 8,289 -4.2%Shareholders' equity 8,169 7,801 10,435 11,760 12.9%Change in working capital 96 (488) (270) (494) NACash flow from operations 5,908 3,033 3,848 4,629 -7.8% Upside/downside scenarios
Capital expenditure (3,421) (3,400) (3,400) (3,500) NAFree cash flow 2,487 (367) 448 1,129 -23.1%
Valuation and leverage metrics AverageP/E (x) 5.2 (994.4) 54.0 11.4 (231.0)EV/EBITDA (x) 2.9 5.0 4.2 3.0 3.8 FCF yield (%) 18.1 (2.7) 3.3 8.2 6.7 P/B (x) 1.8 1.9 1.7 1.5 1.7 Dividend yield (%) 0.6 0.0 0.2 0.4 0.3 Total debt/capital (%) 43.0 44.2 29.7 29.6 36.6 Source: Thomson Reuters Datastream, Barclays Capital est.
Net debt/equity (%) 48.5 57.2 18.2 9.2 33.3 Operating profit forecast by product
Selected operating metricsInventory days 57.9 49.0 49.5 56.4 Accounts receivable days 50.3 53.2 53.4 53.2 Accounts payable days 40.2 33.8 34.2 39.0 Cash-conversion cycle 67.9 68.3 68.7 70.7
Source: Company data, Barclays Capital estimates Note: FY end Dec.
Why a 1-Overweight? Well positioned to come outahead in the game of survival in the DRAM industrygiven: 1) its relatively advanced process technologyand better product mix in DRAM; and materialexposure (32% of total revenue) to NAND flash,which we believe has a much brighter supply-demand outlook.
Assumes: 1) higher-than-expected global PCshipments; 2) much faster-than-expectedpenetration of Ultrabooks, leading to higer demandfor SSD; and 3) stronger-than-expected execution ofnew owner. Based on 2.3x 2012E BVPS ofKRW13,956.
Assumes: 1) double dip in the global economy,which would impact demand across the board; 2)slower-than-expected normalization of HDDproduction resulting in severe disruption of PCsupply; 3) any failure of technology migration. Basedon 1.1x 2012E BVPS of KRW13,956.
(1,000)0
1,0002,0003,0004,000
2010 2011E 2012E 2013E
DRAM NAND
(KRWbn)
DownsideCase
KRW18100
(-19.0%) PriceTarget
KRW27000
(20.8%)
UpsideCase
KRW32000
(43.1%)
10000
15000
20000
25000
30000
35000
40000
7-Dec-10 17-Nov-11
DownsideCase
KRW18100
(-19.0%) PriceTarget
KRW27000
(20.8%)
UpsideCase
KRW32000
(43.1%)
10000
15000
20000
25000
30000
35000
40000
7-Dec-10 17-Nov-11

Barclays Capital | Hynix Semiconductor
21 November 2011 3
INVESTMENT SUMMARY
We initiate coverage of Hynix with a 1-Overweight rating and a price target of KRW27,000, applying a historical average P/B of 1.92x to 2012E BVPS. While we anticipate potential weakness in the shares in the next few months, we believe the shares look attractive on a 12-month horizon. We expect the DRAM industry downcycle to extend into 1Q12 due to the negative impact of the flooding in Thailand on the PC industry, in addition to structural decline in PC DRAM demand growth. But we expect this should be followed by quick recovery in pent-up demand with normalization of HDD production. We believe Hynix is well positioned to come out ahead in the game of survival in the DRAM industry given: 1) its relatively advanced process technology and better product mix in DRAM; and 2) material exposure (32% of total revenue) to NAND flash, which we believe has a much brighter supply-demand outlook.
Expect a deeper trough but quicker turnaround of DRAM cycle
Near-term negative impact from Thailand’s floods on PC DRAM demand According to our channel checks, as well as comments from our colleague Masaru Koshita, who covers the Japan Electronic Components sector, in Nidec (6594.OS, 1-OW): Takeaway from the briefing; aiming for a sharp HDD-SPM recovery in 4Q, dated 26 October, disruption of global HDD production due to flooding in Thailand will significantly limit global PC production during 4Q11-1Q12E. Our global PC forecasts assume 92.9mn and 97.3mn units of PC shipments during the period, which implies 10.7% and 4.8% q/q growth; however, we believe growth in production could be well below this due to the HDD shortage (we expect a significant inventory reduction of PCs during the period).
In addition to shrinking PC production, we are especially concerned about growth in DRAM content per box during the period, as we think a significantly inflated HDD price (up by 30-40%) will decrease the motivation for PC OEMs to increase DRAM content regardless of the DRAM price.
We forecast that the price of 2Gb DDR3 chips will bottom in 1Q12 at US$0.9 on a quarterly average basis. However, we are concerned that the commodity DRAM price might even reach the variable cost of second-tier players on a temporary basis of US$0.7, compared with the current spot price of US$0.72, on our estimates.

Barclays Capital | Hynix Semiconductor
21 November 2011 4
Figure 1: Variable and cash cost of 3x/4xnm DRAM
0.0
0.2
0.4
0.6
0.8
1.0
1.2
1.4
3xnm 4xnm
Variable cost Cash cost
(US$)
Current contract
price
Current spot price
Source: Barclays Capital estimates
Quick recovery expected from 2Q12 on production cut and pent-up demand However, as has been the case in the past, we believe a deeper trough in the cycle will be followed by a quicker turnaround, even amid a secular downturn. We think most of the second-tier players will have difficulty with the 3xnm transition and will have to cut utilization rates in 1Q11, especially when the DRAM price reaches their variable cost, in which case cash burn will happen on a real-time basis. We estimate roughly 30% of global commodity DRAM supply is exposed to such risk.
On the other hand, we expect PC DRAM demand to show a strong recovery from 2Q12 into 3Q12 (although it might be regarded as a temporary recovery from a long-term perspective), given: 1) inventory-building demand for PCs with the normalization of HDD supply and the launch of Windows 8 in 2H12; and 2) resumption in growth of DRAM content per box with the normalization of the HDD price, which will expand DRAM budget.
We forecast the price of 2Gb DDR3 chips will recover to the US$1.1 level in 2H12, leading to our estimate of 4.7% DRAM budget per PC COGS.

Barclays Capital | Hynix Semiconductor
21 November 2011 5
Figure 2: Historical average of DRAM costs as a percentage of a total cost of a PC
0%
2%
4%
6%
8%
10%
12%
1Q02 1Q03 1Q04 1Q05 1Q06 1Q07 1Q08 1Q09 1Q10 1Q11 1Q12E
Source: Barclays Capital estimates
Well positioned in the DRAM survival game
However, on a longer-term basis, we believe the DRAM industry is still on a secular downcycle regardless of the near-term up and down given: 1) the lack of a driver for growth in DRAM content per box; 2) the nature of the DRAM industry whereby cost cutting is achievable only through supply growth; and 3) a still crowded supply side, with five suppliers. Therefore, we think the DRAM industry will have to undergo a game of survival until the weakest players give up. We think Hynix will be one of the players to survive, for the following reasons.
One of the lowest-cost producers in DRAM with superior product mix With its recent successful migration to 38nm technology, we believe Hynix has proven itself as one of the technology leaders in the DRAM industry, second only to Samsung Electronics. We estimate that Hynix is roughly 6-9 months behind Samsung Electronics in technology migration, but is more advanced than Elpida by 2-3 months and Inotera by 6-12 months. We believe Hynix has competitive advantage in costs of around a 30% over its second-tier peers.
Figure 3: Portion of 3xnm DRAM technology by vendor
4Q11E 3xnm and below
SEC 55%
Hynix 30%
Micron 1%
Elpida 20%
Source: Barclays Capital estimates
A well-diversified product mix also gives Hynix a distinctive edge over its peers. We estimate that commodity DRAM revenue accounts for only 30% of the total DRAM revenue of Hynix, while higher value-add products of specialty DRAM, such as mobile DRAM, server DRAM and graphic DRAM, account for 25%, 21% and 12% of total DRAM revenue respectively. We think this is why Hynix has recorded relatively better profitability in DRAM compared to its peers, except for Samsung. Given that supply of specialty DRAM is much less crowded

Barclays Capital | Hynix Semiconductor
21 November 2011 6
than for commodity DRAM, with only 2-3 major players, we think specialty DRAM will continue to have a higher-value profile compared to commodity DRAM.
Figure 4: DRAM technology node at Hynix
1Q11 2Q11 3Q11 4Q11E 1Q12E 2Q12E 3Q12E 4Q12E
66nm 10% 0% 0% 0% 0% 0% 0% 0%
54nm 40% 25% 20% 10% 0% 0% 0% 0%
44nm 50% 70% 70% 60% 60% 45% 40% 30%
38nm 0% 5% 10% 30% 40% 50% 50% 50%
29nm 0% 0% 0% 0% 0% 5% 10% 20%
Note: On a wafer basis. Source: Company data, Barclays Capital estimates
Figure 5: DRAM makers – operating profits and margins for 3Q11
(800)
(600)
(400)
(200)
0
200
400
600
800
SEC Hynix Nanya Inotera Elpida(150)(120)(90)(60)(30)0
306090120150
Operating profit (LHS) Operating margin (RHS)
(USDmn) (%)
Note: SEC and Hynix DRAM operating profit only. Source: Company data, Barclays Capital estimates
Getting better positioned to benefit from secular growth of NAND flash In good contrast to DRAM, we think the global NAND flash industry is on secular growth trend on the back of supply discipline by the leading suppliers and robust DRAM growth from new applications such as smart devices and SSDs. We think Hynix is also set to benefit from the secular growth of the industry although it might not be the biggest beneficiary.
As of 3Q11, the revenue from NAND flash accounts for roughly 30% of total revenue and we estimate that the operating margin from NAND flash was well exceeding that of DRAM at 13% vs -26% for DRAM. We think the revenue and profit contribution from NAND will increase further as: 1) Apple, the global no.1 NAND flash consumer, is trying to diversify NAND suppliers, while we believe SEC is not aggressive about supplying NAND to Apple; and 2) Hynix has shown better-than-expected execution in technology migration in NAND, although it is not the lowest-cost producer. As shown in Figure 6, we estimate that the difference in profitability of NAND flash among players is relatively less than for DRAM.

Barclays Capital | Hynix Semiconductor
21 November 2011 7
Figure 6: NAND flash operating margin by vendor in 3Q11E
0%
5%
10%
15%
20%
25%
SEC Hynix Toshiba
Source: Barclays Capital estimates
Figure 7: Revenue contribution from DRAM/NAND flash at Hynix
0%
20%
40%
60%
80%
100%
120%
2004 2005 2006 2007 2008 2009 2010 2011E 2012E 2013E
% revenue contribution (DRAM) % revenue contribution (NAND)
Source: Company data, Barclays Capital estimates
Figure 8: OP contribution from DRAM/NAND flash at Hynix
-200%
-150%
-100%
-50%
0%
50%
100%
150%
200%
250%
2004 2005 2006 2007 2008 2009 2010 2011E 2012E 2013E
% OP contribution (DRAM) % OP contribution (NAND)
Source: Company data, Barclays Capital estimates

Barclays Capital | Hynix Semiconductor
21 November 2011 8
Recent rights offering a significant help for balance sheet Hynix announced on 14 November that it would issue 101,850,000 new shares at KRW23,000 to SK Telecom, which has been chosen as a preferred bidder for a stake sale by existing major shareholders of creditor banks. After these deals (new shares plus the purchase of existing shares from creditor banks), SK Telecom would secure a 21.1% stake of Hynix, as the major shareholder, and Hynix would get a cash injection of about KRW2.34trn. With this cash injection and some free cash flow, we estimate that the company’s net debt would be lowered to KRW1.90trn until 4Q12E, from KRW5.12trn in 3Q11, assuming the company would not be aggressive about capacity expansion. We then estimate Hynix’s net debt-to-equity ratio would be lowered to 18% at end-2012E from 64% in 3Q11, enhancing its balance sheet substantially. Please refer to page 37 for Barclays Capital’s credit view on Hynix and recommendation on the convertible bond.
Figure 9: Net debt-to-equity ratio comparison among DRAM makers (3Q11)
0
20
40
60
80
100
120
140
160
Inotera Elpida Hynix(before rights
offering)
Hynix(after rights offering,
1Q12E)
(%)
Source: Company data, Barclays Capital estimates
Historical valuation suggests upside from here
For valuation, we use historical P/B for the cyclical context, applying the mid-cycle average as we expect an upcycle for NAND and a downcycle for DRAM. Our price target represents 54.0x 2012E P/E and 11.4x 2013E P/E. We acknowledge the shares may not appear attractive to some investors from the perspective of ROE rather than P/B or P/E. However, we focus on the fact that the share price performance of DRAM manufacturers has been driven by a relatively short-term earnings outlook. Therefore, we recommend investors focus on the company’s quarterly earnings outlook.

Barclays Capital | Hynix Semiconductor
21 November 2011 9
Figure 10: P/B target multiple in a historical quarterly context
0.0
0.5
1.0
1.5
2.0
2.5
3.0
-100% -80% -60% -40% -20% 0% 20% 40% 60% 80%
ROE
P/B (x)
Current share price
Target multiplebased on 4Q12E ROE: 12.3%
Note: Based on estimated quarter-end BVPS and quarterly average P/B multiple Source: Barclays Capital estimates
Key risks include: 1) potential new owner SK Telecom’s lack of experience in running a highly cyclical business; 2) mistimed execution in DRAM and NAND production; and 3) too aggressive capacity expansion on NAND could drive market share competition.

Barclays Capital | Hynix Semiconductor
21 November 2011 10
Figure 11: Hynix – Peer valuation comparison
Price Potential up/
downside P/E (x) P/B (x) ROE (%)
Ticker Rating (Local) PT to PT (%) 2010 2011E 2012E 2010 2011E 2012E 2010 2011E 2012E
Hynix 000660 KS 1-OW/3-Neg 23,200 27,000 16.4 5.2 (994.4) 54.0 1.80 1.93 1.66 32.4 (0.2) 3.3 Peers' AVG 21.9 55.9 18.7 1.1 1.1 1.0 8.7 (8.8) (9.7)Samsung Electronics
005930 KS 1-OW/3-Neg 980,000 1,250,00
027.6 10.6 12.3 9.7 2.01 1.74 1.49 20.4 14.7 16.1
Micron MU US 2-EW/1-Pos 6.74 8.00 18.7 3.6 144.0 36.2 0.84 0.82 0.81 16.3 0.6 2.2 Elpida AAPL US NR 348 n/a nm 64.3 n/a n/a 0.29 0.43 0.47 0.8 (31.2) (5.1)Inotera 3474 TT NR 4.47 n/a nm n/a n/a n/a 0.39 0.56 0.91 (20.9) (44.9) (77.3)Sandisk SNDK US NR 51.07 n/a nm 9.1 11.4 10.1 2.09 1.80 1.55 26.8 16.9 15.6
Note: Stock Rating: 1-OW: 1-Overweight, 2-EW: 2-Equal Weight, 3-UW: 3-Underweight. Sector View: 1-Pos: 1-Positive, 2-Neu: 2-Neutral, 3-Neg: 3-Negative. Estimates for not rated stocks (NR) are Bloomberg estimates. For full disclosures on each rated company, including details of company-specific valuation methodology and risks, please refer to: http://publicresearch.barcap.com. Share prices as of the close on 17 November 2011 in local currency. Source: Bloomberg, Barclays Capital estimates
Figure 12: Asia Pacific semiconductors – valuation comparison
Price
Pot. up/downside
to PT Mkt Cap EPS P/E (x) P/BV (x) ROE (%) Stock Sector Ticker Rating (Local) PT (%) (US$bn) FY11E FY12E FY11E FY12E FY11E FY12E FY11E FY12E
Hynix IDM 000660 KS 1-OW/3-Neg 23,200 27,000 16.4 12.1 (23) 430 (994.4) 54.0 1.93 1.66 (0.2) 3.3 Samsung Electronics IDM 005930 KS 1-OW/3-Neg 980,000
1,250,000 27.6 147.9 79,932
101,477 10.6 12.3 1.74 1.49 14.7 16.1
TSMC Foundry 2330 TT 2-EW/3-Neg 75.7 63 (16.8) 64.9 5.2 5.2 14.7 14.5 3.09 2.83 21.1 19.5
UMC Foundry 2303 TT 3-UW/3-Neg 12.85 10.5 (18.3) 5.6 0.8 0.8 16.6 16.2 0.79 0.78 4.8 4.8
Vanguard Foundry 5347 TT 3-UW/3-Neg 11.4 10.5 (7.9) 0.6 0.4 0.5 30.2 21.4 0.88 0.85 2.9 4.0
ASE OSAT 2311 TT 2-EW/3-Neg 27.95 27 (3.4) 6.2 2.1 2.4 13.4 11.8 1.93 1.77 14.4 15.0
SPIL OSAT 2325 TT 2-EW/3-Neg 28.6 30 4.9 3.0 1.5 1.7 19.1 17.3 1.45 1.42 7.6 8.2
Kinsus Substrate 3189 TT 3-UW/3-Neg 98.5 85 (13.7) 1.5 6.4 6.6 15.3 14.8 1.92 1.70 12.5 11.5
Nan Ya PCB Substrate 8046 TT 1-OW/3-Neg 75.1 97 29.2 1.6 6.0 7.8 12.6 9.6 1.28 1.13 10.2 11.8
Shinko Substrate 6967 JP 3-UW/1-Pos 513 490 (4.5) 0.9 14.0 33.9 36.8 15.1 0.52 0.51 1.4 3.4
Ibiden Substrate 4062 JP 1-OW/1-Pos 1,667 2,400 44.0 3.3 97.3 164.3 17.1 10.1 0.85 0.79 5.0 7.8
NGK Spark Plug Substrate 5334 JP 2-EW/1-Pos 967 1,190 23.1 2.8 124.8 106.4 7.7 9.1 0.95 0.92 12.3 10.1
Mediatek Fabless 2454 TT 1-OW/3-Neg 308.5 400 29.7 11.8 12.7 16.8 24.2 18.4 3.27 3.16 13.5 17.2 MStar Fabless 3697 TT 1-OW/3-Neg 174 210 20.7 3.1 12.9 14.7 13.5 11.8 2.40 2.00 17.8 16.9
Note: For full disclosures on each rated company, including details of company-specific valuation methodology and risks, please refer to: http://publicresearch.barcap.com. Share prices as of the close on 17 November 2011 in local currency. Source: Bloomberg, Barclays Capital estimates

Barclays Capital | Hynix Semiconductor
21 November 2011 11
GLOBAL MEMORY INDUSTRY OUTLOOK IN 2012
DRAM: Deeper trough but quicker recovery likely
We expect the overall supply/demand situation of the global DRAM industry to stabilise in 2012 as supply growth continues to slow down. However, we do not expect a V-shaped recovery in 2012 due to the muted DRAM demand growth from PC applications despite the strong growth from mobile DRAM. We believe the disparity between PC DRAM and specialty DRAM (servers and mobile) will be continued.
Supply – We forecast that global DRAM supply will increase by 33% in 2012 vs our estimate of 43% for 2011, which is quite low in an historical context. We expect none of the DRAM makers to add new wafer capacity in 2012 while some of them, such as Powerchip and ProMos, have lowered their utilisation rates dramatically. We assume that most of the supply growth is coming from technology migration in 2012; therefore, our bit growth forecast could be vulnerable to changes depending on the execution of the DRAM makers. And, we believe, there could be some downside risk to our supply forecasts on a further decline of DRAM prices given that the current DRAM price is already lower than that of most of DRAM makers. By vendor, we forecast that SEC will still outgrow the market; however, its market share gains will be relatively smaller than that in 2011.
Demand – We forecast that global DRAM bit demand will increase 34% in 2012, slightly lower than our forecast of 40% for 2011. However, because our demand growth forecast for 2012 is more than our supply growth forecast of 33%, we expect the oversupply issue to moderately ease in 2012.
By application, we forecast that PC-related DRAM demand (including that for tablet PCs) will increase 29%, driven by servers and tablet PCs. We believe DRAM demand from servers and tablet PCs will outgrow the market, supported by the robust growth in content per box. However, we expect desktop and notebook PC DRAM demand will under grow the market due to the muted growth in content per box and slow growth in PC units.
Figure 13: Global PC shipments (excluding tablets)
Figure 14: Global PC shipments (including tablets)
050
100
150200250300
350400450
2005 2007 2009 2011E 2013E024
681012
141618
Desktops Notebooks
Netbook Growth (%)
(Mn units)
0
100
200
300
400
500
600
2005 2007 2009 2011E 2013E0
5
10
15
20
25
Desktops Notebooks Netbook
Tablet Growth (%)
(Mn units)
Source: IDC, Gartner, Barclays Capital estimates Source: IDC, Gartner, Barclays Capital estimates

Barclays Capital | Hynix Semiconductor
21 November 2011 12
We forecast global PC demand (excluding tablet PCs) to increase 5% in unit terms in 2012 following our forecast of 4% growth for 2011, which is still quite lower than the five-year average growth rate of 9.2%. We are concerned that consumer PC demand will be continue to remain slow due to potential cannibalisation by tablet PCs and macro issues, and we are also concerned that the growth momentum for corporate PC demand will also slow as the replacement cycle peaks and macro risks emerge.
However, we believe that the real swing factor in PC DRAM demand lies in the growth rate of content per box, which we believe faces structural challenges. We expect the consumer need for PC DRAM will not increase significantly from here (3.6GB on an average basis) as 4GB should be just enough near term to run current operating systems and applications. We also believe that PC OEMs will not be as aggressive in increasing DRAM content as they have been in the past because the DRAM impact on PC performance is not as powerful as it has been in the past and they have to deal with the rise in the cost of other components such as for storage, batteries and screens. We expect DRAM not to be prioritised in ultrabooks as manufacturers have to spend more on SSDs, polymer batteries and ultra-thin screens. As shown in Figure 15 and Figure 16, DRAM content per box for desktop PCs has not shown meaningful growth since 2010, according to US electrical goods retailer Best Buy, despite the collapse in DRAM prices, while for notebooks, it is showing some growth, indicating that the consumer need for DRAM has basically topped out at the 4GB level.

Barclays Capital | Hynix Semiconductor
21 November 2011 13
Figure 15: Historical DRAM content per box, and y/y growth
0
1
2
3
4
5
2006 2007 2008 2009 2010 2011E 2012E 2013E0
10
20
30
40
50
60
GB/System (LHS) Growth (% y-y, RHS)
(GB)(%)
Source: Barclays Capital estimates
Figure 16: Simple average of DRAM content per box at Best Buy
3
4
5
6
May 10 Sep 10 Jan 11 May 11 Sep 11
Desktop NBPC Linear (Desktop) Linear (NBPC)
(GB)
Source: Best Buy, Barclays Capital estimates
However, we forecast that DRAM demand from handsets will continue to show robust growth in 2012 thanks to the strong demand for smartphones. We forecast that handset-related demand for DRAMs will increase 81% in 2012 following our forecast of 121% for 2011 under the assumptions of 650mm smartphone shipments and 750MB of average content per box in 2012 vs our forecast of 480mn units and 500MB for 2011. Given our assumptions, we forecast that aggregated DRAM bit demand from handsets could account for 23% of total DRAM demand in 2012 and 25% in 2013 vs our estimate of 17% in 2011 and 11% in 2010.
In terms of the growth rate in DRAM content per box for handsets, we are optimistic near term given that most of the high-end smartphones are adopting 1GB of DRAM. However, on a longer term basis, we believe content will top out at the 1GB~1.5GB level on average as the proportion of low-end phones increases and even high-end phones may not need more than 2GB given the multi-tasking needs for 3-5 inch screens will not likely be significant and the efficiencies of operating systems are likely to increase.

Barclays Capital | Hynix Semiconductor
21 November 2011 14
Figure 17: Global DRAM demand for handsets and tablet PCs
(Mn units, 1GB) 2010 2011E 2012E 2013E
Non-smartphones (mn, GB) 114 168 216 260
Units (mn) 1,136 1,121 1,082 1,040
Content per box (GB) 0.10 0.15 0.20 0.25
Smartphones (mn, GB) 85 233 501 802
Units (mn) 283 467 668 845
Content per box (GB) 0.30 0.50 0.75 0.95
Tablet PCs (mn, GB) 5 43 95 149
Units (mn) 18 62 79 100
Content per box (GB) 0.28 0.70 1.20 1.50
Total Mobile DRAM demand (mn, GB) 203 445 812 1,212
Units (mn) 1,437 1,649 1,829 1,984
Content per box (GB) 0.14 0.27 0.44 0.61
Source: Barclays Capital estimates
Figure 18: Percentage of handset-related DRAM bit demand out of total DRAM demand
0
200
400
600
800
1,000
1,200
1,400
2010 2011E 2012E 2013E0
5
10
15
20
25
30
Global DRAM demand (mn,GB) % of global demand
(Mn units, 1GB) (%)
Source: Barclays Capital estimates
Price – In terms of price, we do not forecast a radical decline for DRAM prices in 2012 given that prices are already below the cash cost level for most DRAM manufactures except for SEC. We forecast that the price of 2GB DDR3 chips will hit bottom at US$0.90 in 1Q12 (vs the current price of US$1.06) and will show a moderate recovery to US$1.10 in 2H12.
We do not expect price of 2GB DDR3 chips to fall below $0.80 as it is the variable cost for second-tier players for which a production cut would then become much compelling. And we do not expect the price to go up beyond US$1.11-1.20 because we believe PC OEMs would not spend more than 5% of total COGS on DRAM given that DRAM demand is not as compelling as it has been in the past and that they will have to spend more on storage and displays than before to meet the specs of ultrabooks.

Barclays Capital | Hynix Semiconductor
21 November 2011 15
Figure 19: Forecasts of average sell prices for 2Gb DDR3
0
1
1
2
2
3
1Q11 2Q11 3Q11 4Q11E 1Q12E 2Q12E 3Q12E 4Q12E
(US$)
Source: Barclays Capital estimates
Figure 20: Historical average of DRAM costs as a percentage of a total cost of a PC
0%
2%
4%
6%
8%
10%
12%
1Q02 1Q03 1Q04 1Q05 1Q06 1Q07 1Q08 1Q09 1Q10 1Q11 1Q12E
Source: Barclays Capital estimates

Barclays Capital | Hynix Semiconductor
21 November 2011 16
Figure 21: Global DRAM supply/demand model
(Mn units, 1Gb equiv) 1Q11 2Q11 3Q11E 4Q11E 1Q12E 2Q12E 3Q12E 4Q12E 2010 2011E 2012E 10 y-y 11E y-y 12E y-y
Global demand 4,455 4,984 5,653 6,315 6,126 6,774 7,567 8,279 15,332 21,407 28,746 48% 40% 34%
PC related demand 2,966 3,271 3,770 4,300 3,909 4,335 4,836 5,411 10,562 14,307 18,491 42% 35% 29%
PC shipment including Tablet (mn units) 90.5 100.4 113.5 123.0 101.6 107.9 121.1 131.6 370.2 427.4 462.2 21% 15% 8%
PC shipment excluding Tablet (mn units) 84.0 86.8 95.3 98.6 87.1 91.3 101.2 103.9 352.2 364.7 383.5 15% 4% 5%
Desktops 33.6 35.5 37.0 37.3 33.2 36.3 38.0 37.9 140.5 143.3 145.4 11% 2% 1%
NBPC 42.0 42.2 49.3 50.9 45.8 45.9 54.7 55.8 169.0 184.4 202.2 24% 9% 10%
Netbook 5.7 6.2 6.1 6.5 5.2 6.0 5.4 6.0 31.0 24.5 22.6 -3% -21% -8%
Tablet 6.4 13.6 18.2 24.4 14.4 16.6 19.9 27.8 18.0 61.7 78.8 n.a. 248% 26%
Servers and workstations 2.8 2.9 3.0 3.9 2.9 3.0 3.2 4.2 11.7 12.5 13.3 18% 6% 6%
Avg PC contents per box (MB) 3,265 3,382 3,569 3,744 4,014 4,196 4,232 4,230 2,941 3,501 4,173 9% 19% 19%
Desktops 3,355 3,500 3,675 3,859 4,129 4,335 4,335 4,335 3,027 3,604 4,288 12% 19% 19%
NBPC 3,321 3,420 3,591 3,771 4,034 4,236 4,236 4,236 2,976 3,532 4,190 13% 19% 19%
Netbook 1,127 1,227 1,301 1,340 1,340 1,353 1,353 1,367 1,038 1,252 1,354 -3% 21% 8%
Tablet 383 575 604 634 761 1,027 1,099 1,154 261 553 1,019 n.a. 112% 84%
Servers and workstations 27,056 30,085 31,589 33,169 36,486 39,040 41,772 44,696 17,183 30,566 40,646 101% 78% 33%
Demand from other applications 1,489 1,712 1,884 2,015 2,217 2,439 2,731 2,868 4,770 7,100 10,255 61% 49% 44%
Global supply 5,014 5,229 5,671 6,456 6,632 7,025 7,709 8,347 15,696 22,370 29,714 53% 43% 33%
SEC 881 926 1,013 1,175 1,222 1,296 1,425 1,568 2,599 3,996 5,511 70% 54% 38%
Hynix 568 568 619 773 789 836 886 931 1,699 2,527 3,442 38% 49% 36%
Micron 262 259 316 354 372 372 424 483 879 1,191 1,650 49% 36% 39%
Elpida 421 482 570 622 663 714 792 822 1,423 2,094 2,989 35% 47% 43%
Nanya 163 167 155 170 179 206 247 296 414 655 928 15% 59% 42%
Winbond 79 81 80 81 79 77 76 74 334 321 307 286% -4% -4%
ProMOS 40 38 23 13 13 13 5 0 198 113 30 117% -43% -73%
Powerchip 94 95 60 40 0 0 0 0 304 289 0 53% -5% -100%
Supply/Demand (%) 12.6 4.9 0.3 2.2 8.3 3.7 1.9 0.8 2.4 4.5 3.4
Source: Barclays Capital estimates

Barclays Capital | Hynix Semiconductor
21 November 2011 17
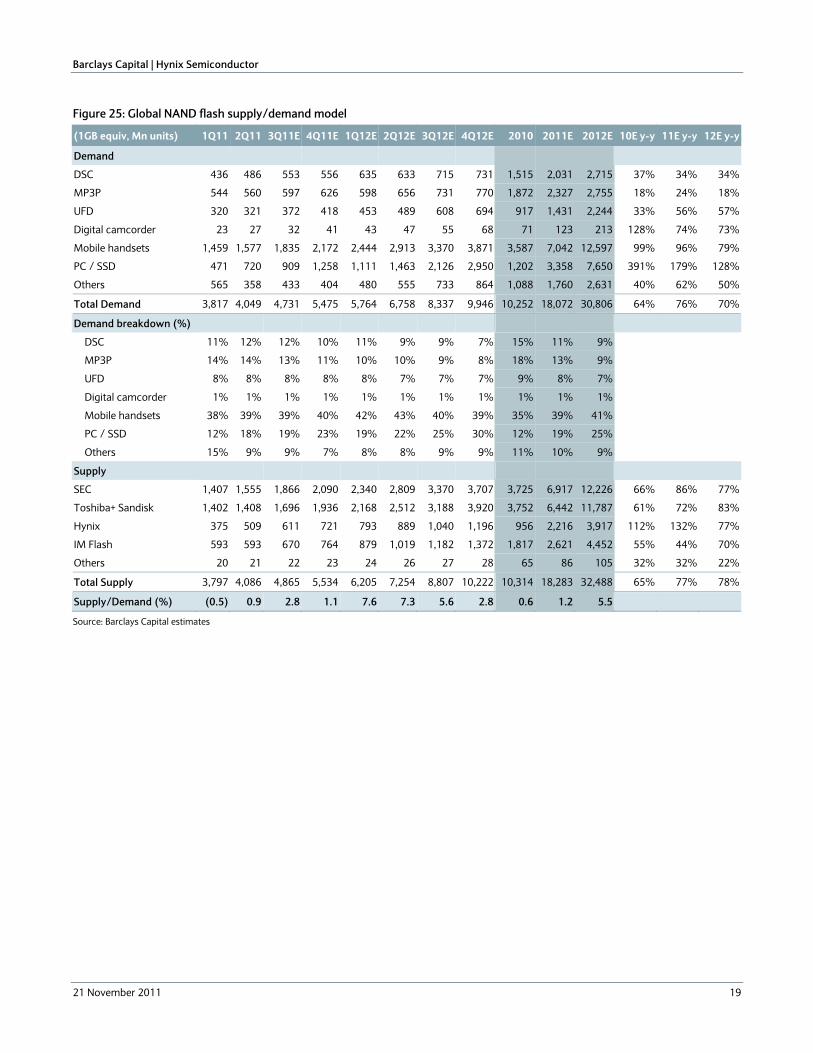
NAND: Secular growth to continue
We believe the cyclical fluctuations of the NAND industry have been significantly lowered since 2009 when supply dynamics entered into a duopoly status and new demand growth drivers such as smartphones and tablet PCs started to emerge. We believe such a situation should continue for a while given that supply dynamics still remain stable with no irrational market share competition and new growth drivers such as SSD emerge driven by the MacBook Air, ultrabooks and Windows 8 PCs.
Supply – We forecast global NAND supply will increase 78% in 2012 vs our estimate of 77% for 2011, which is quite stable in an historical context. We expect most of the NAND manufactures to expand their wafer capacity to meet the strong demand from smartphones and SSD. In terms of geometry node, we expect SEC to advance past Toshiba again as SEC started to ramp up its 16nm output starting in late 3Q11 with Toshiba remaining at 19nm. By vendor, we believe Hynix should emerge as a dark horse given that its execution has been stronger than we expected and that it has a strategic purpose given the demand from Apple. We assume that Hynix will not make any aggressive capacity expansion in 2012 due to the sluggish DRAM market, which should limit its capex budget. However, Hynix could turn out to be more aggressive that we assume if it secures a large enough capex budget through various sources of funding.
Demand – In terms of demand, we forecast 70% y-y growth in 2012 following our forecast of 76% for 2011, which would be largely in line with supply growth. By application, we expect mobile handsets and SSDs to continue to drive demand growth in 2012, accounting for 66% of total demand compared with our estimate of 58% for 2011 and 47% for 2010.
We especially focus on demand growth for the SSD segment in 2012. We believe the take-off of ultrabook will give a strong push to increase the penetration rate of SSDs in the PC storage space. And we expect the ongoing flood in Thailand to possibly result in severe supply shortages of HDD from early next year, which could result in increased sales of SSD next year based on the narrowing price gap between two devices.
We forecast that SSD demand (from PCs and tablets) will grow by 128% in 2012 to account for 25% of total demand, becoming the second-largest NAND consuming application after the 41% share for mobile handsets. We assume 50mn units of SSD shipment for PCs (including, notebooks, net-books and standalones but excluding tablet PCs) in 2012 with an average density of 100GB. However, as shown in Figure 22, our SSD sensitivity analysis suggests shipment growth of 10mn SSDs in 2012 will create an additional 3% of total NAND demand.
Figure 22: Global NAND demand – sensitivity analysis of SSD demand on total demand
Average NAND capacity of SSD (GB)
2012E 50 75 100
10 2% 3% 4%
30 7% 10% 12%
50 12% 16% 20%
70 17% 23% 28%
Uni
t sal
es (M
n un
its)
90 22% 29% 37%
Source: Barclays Capital estimates

Barclays Capital | Hynix Semiconductor
21 November 2011 18
Figure 23: SSD demand forecasts
0
5
10
15
20
1Q09 2Q09 3Q09 4Q09 1Q10 2Q10 3Q10 4Q10 1Q11 2Q11 3Q11E 4Q11E(10)
0
10
20
30
40
Total SSD (LHS) Growth (RHS)
(Mn units) (% y-y)
Source: Barclays Capital estimates
Figure 24: Demand by application
0%10%20%30%40%50%60%70%80%90%
100%
2005 2006 2007 2008 2009 2010 2011E 2012E
DSC MP3P UFD Digital camcorder Mobile handsets PC / SSD Others
Source: Barclays Capital estimates
Barclays Capital | Hynix Semiconductor
21 November 2011 19
Figure 25: Global NAND flash supply/demand model
(1GB equiv, Mn units) 1Q11 2Q11 3Q11E 4Q11E 1Q12E 2Q12E 3Q12E 4Q12E 2010 2011E 2012E 10E y-y 11E y-y 12E y-y
Demand
DSC 436 486 553 556 635 633 715 731 1,515 2,031 2,715 37% 34% 34%
MP3P 544 560 597 626 598 656 731 770 1,872 2,327 2,755 18% 24% 18%
UFD 320 321 372 418 453 489 608 694 917 1,431 2,244 33% 56% 57%
Digital camcorder 23 27 32 41 43 47 55 68 71 123 213 128% 74% 73%
Mobile handsets 1,459 1,577 1,835 2,172 2,444 2,913 3,370 3,871 3,587 7,042 12,597 99% 96% 79%
PC / SSD 471 720 909 1,258 1,111 1,463 2,126 2,950 1,202 3,358 7,650 391% 179% 128%
Others 565 358 433 404 480 555 733 864 1,088 1,760 2,631 40% 62% 50%
Total Demand 3,817 4,049 4,731 5,475 5,764 6,758 8,337 9,946 10,252 18,072 30,806 64% 76% 70%
Demand breakdown (%)
DSC 11% 12% 12% 10% 11% 9% 9% 7% 15% 11% 9%
MP3P 14% 14% 13% 11% 10% 10% 9% 8% 18% 13% 9%
UFD 8% 8% 8% 8% 8% 7% 7% 7% 9% 8% 7%
Digital camcorder 1% 1% 1% 1% 1% 1% 1% 1% 1% 1% 1%
Mobile handsets 38% 39% 39% 40% 42% 43% 40% 39% 35% 39% 41%
PC / SSD 12% 18% 19% 23% 19% 22% 25% 30% 12% 19% 25%
Others 15% 9% 9% 7% 8% 8% 9% 9% 11% 10% 9%
Supply
SEC 1,407 1,555 1,866 2,090 2,340 2,809 3,370 3,707 3,725 6,917 12,226 66% 86% 77%
Toshiba+ Sandisk 1,402 1,408 1,696 1,936 2,168 2,512 3,188 3,920 3,752 6,442 11,787 61% 72% 83%
Hynix 375 509 611 721 793 889 1,040 1,196 956 2,216 3,917 112% 132% 77%
IM Flash 593 593 670 764 879 1,019 1,182 1,372 1,817 2,621 4,452 55% 44% 70%
Others 20 21 22 23 24 26 27 28 65 86 105 32% 32% 22%
Total Supply 3,797 4,086 4,865 5,534 6,205 7,254 8,807 10,222 10,314 18,283 32,488 65% 77% 78%
Supply/Demand (%) (0.5) 0.9 2.8 1.1 7.6 7.3 5.6 2.8 0.6 1.2 5.5
Source: Barclays Capital estimates

Barclays Capital | Hynix Semiconductor
21 November 2011 20
EARNINGS FORECASTS
We expect Hynix’s operating profit to show moderate recovery in 2012E and more meaningful recovery in 2013E. We estimate operating profit of the company at KRW227bn for 2012E and KRW1,538bn for 2013E. On a quarterly basis, we expect OP to bottom in 1Q12E at -KRW286bn and show a turnaround from 3Q12E.
By division, we expect DRAM will remain unprofitable in 2012E with a full-year loss of KRW242bn but will turn profitable from 3Q12E on pent-up demand for PC DRAM with the normalization of HDD supply. For NAND flash, we forecast OP will continue to expand to KRW469bn in 2012E and KRWW715bn in 2013E on continued demand growth from smartphones and the new growth driver, SSD.
Figure 26: Hynix earnings forecast (annual)
(KRWbn) 2010 2011E 2012E 2013E
Revenue 12,099 10,039 9,782 11,954
DRAM 9,959 7,212 6,452 7,289
NAND 2,175 2,827 3,330 4,664
Gross Profit 4,779 1,436 1,458 3,051
SG&A 1,506 1,417 1,272 1,554
Operating Profit 3,273 224 227 1,538
DRAM 2,981 (331) (242) 823
NAND 240 356 469 715
Others 52 199 0 0
Pre-tax Profit 2,696 7 300 1,413
Net Profit 2,656 (12) 300 1,413
Operating margin 27% 2% 2% 13%
DRAM 30% -5% -4% 11%
NAND 11% 13% 14% 15%
Source: Company data, Barclays Capital estimates
Figure 27: Assumptions for Hynix earnings forecast (annual)
2010 2011E 2012E 2013E
Shipment (Mn, 1Gb equiv.)
DRAM 3,405 4,921 6,838 9,277
y/y growth 38% 44% 39% 36%
NAND 7,649 17,204 31,568 65,220
y/y growth 105% 125% 83% 107%
ASP (1Gb, US$)
DRAM 2.55 1.34 0.89 0.79
y/y growth 28% -47% -33% -12%
NAND 0.25 0.15 0.10 0.07
y/y growth -25% -39% -34% -28%
Source: Company data, Barclays Capital estimates

Barclays Capital | Hynix Semiconductor
21 November 2011 21
Figure 28: OP contribution by division
(3,000)
(2,000)
(1,000)
0
1,000
2,000
3,000
4,000
2004 2005 2006 2007 2008 2009 2010 2011E 2012E 2013E
DRAM NAND
(KRWbn)
Source: Company data, Barclays Capital estimates
Figure 29: OP contribution by division (portion)
-100%
-80%-60%
-40%-20%
0%
20%40%
60%80%
100%
2004 2005 2006 2007 2008 2009 2010 2011E 2012E 2013E
DRAM NAND
Source: Company data, Barclays Capital estimates

Barclays Capital | Hynix Semiconductor
21 November 2011 22
Figure 30: Hynix earnings forecast (quarterly)
(KRWbn) 1Q11 2Q11 3Q11 4Q11E 1Q12E 2Q12E 3Q12E 4Q12E 2011E 2012E 2013E y/y 11E y/y 12E y-y 13E
Revenue 2,793 2,758 2,291 2,266 2,184 2,346 2,609 2,644 10,039 9,782 11,954 -17% -3% 22%
DRAM 2,103 2,018 1,593 1,498 1,437 1,579 1,757 1,679 7,212 6,452 7,289 -28% -11% 13%
NAND 659 703 698 768 746 767 852 964 2,827 3,330 4,664 30% 18% 40%
Gross Profit 681 631 108 15 (12) 253 637 580 1,436 1,458 3,051 -70% 2% 109%
SG&A 348 374 400 295 284 305 339 344 1,417 1,272 1,554 -6% -10% 22%
Operating Profit 323 447 (277) (269) (286) (42) 308 246 224 227 1,538 -93% 1% 578%
DRAM 233 182 (365) (381) (383) (113) 190 63 (331) (242) 823 -111% -27% -440%
NAND 90 65 89 112 97 71 118 184 356 469 715 48% 32% 52%
Others (0) 200 (0) 0 0 0 0 0 199 0 0 283% nm nm
Pre-tax Profit 281 472 (553) (195) (355) 58 283 315 7 300 1,413 -100% 4514% 370%
Net Profit 274 473 (563) (195) (355) 58 283 315 (12) 300 1,413 -100% -2685% 370%
Operating margin 12% 16% -12% -12% -13% -2% 12% 9% 2% 2% 13%
DRAM 11% 9% -23% -25% -27% -7% 11% 4% -5% -4% 11%
NAND 14% 9% 13% 15% 13% 9% 14% 19% 13% 14% 15%
Source: Company data, Barclays Capital estimates
Figure 31: Assumptions for earnings forecast (quarterly)
1Q11 2Q11 3Q11 4Q11E 1Q12E 2Q12E 3Q12E 4Q12E 2011E 2012E 2013E
Shipment (Mn, 1Gb equiv.)
DRAM 1,139 1,135 1,231 1,416 1,529 1,651 1,767 1,891 4,921 6,838 9,277
q/q growth 15% 0% 9% 15% 8% 8% 7% 7%
y/y growth 49% 39% 47% 43% 34% 46% 44% 34% 44% 39% 36%
NAND 2,983 4,042 4,669 5,509 6,060 7,091 8,296 10,121 17,204 31,568 65,220
q/q growth 15% 36% 16% 18% 10% 17% 17% 22%
y/y growth 134% 160% 111% 111% 103% 75% 78% 84% 125% 83% 107%
ASP (1Gb, US$)
DRAM 1.68 1.65 1.17 0.94 0.85 0.91 0.95 0.87 1.34 0.89 0.79
q/q growth -13% -1% -29% -19% -10% 7% 4% -9%
y/y growth -40% -44% -56% -51% -49% -45% -19% -8% -47% -33% -12%
NAND 0.20 0.16 0.14 0.12 0.11 0.10 0.10 0.09 0.15 0.10 0.07
q/q growth 0% -20% -15% -10% -10% -8% -5% -5%
y/y growth -36% -45% -40% -38% -44% -36% -29% -25% -39% -34% -28%
Source: Company data, Barclays Capital estimates
Barclays Capital | Hynix Semiconductor
21 November 2011 23
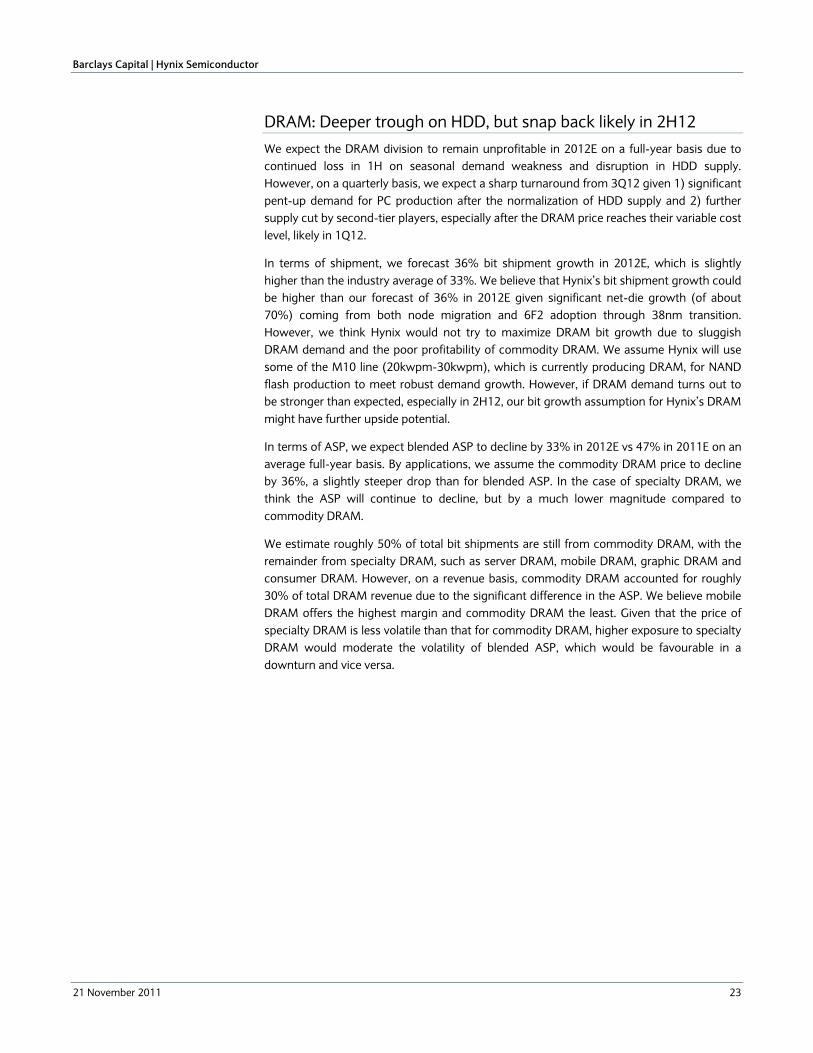
DRAM: Deeper trough on HDD, but snap back likely in 2H12
We expect the DRAM division to remain unprofitable in 2012E on a full-year basis due to continued loss in 1H on seasonal demand weakness and disruption in HDD supply. However, on a quarterly basis, we expect a sharp turnaround from 3Q12 given 1) significant pent-up demand for PC production after the normalization of HDD supply and 2) further supply cut by second-tier players, especially after the DRAM price reaches their variable cost level, likely in 1Q12.
In terms of shipment, we forecast 36% bit shipment growth in 2012E, which is slightly higher than the industry average of 33%. We believe that Hynix’s bit shipment growth could be higher than our forecast of 36% in 2012E given significant net-die growth (of about 70%) coming from both node migration and 6F2 adoption through 38nm transition. However, we think Hynix would not try to maximize DRAM bit growth due to sluggish DRAM demand and the poor profitability of commodity DRAM. We assume Hynix will use some of the M10 line (20kwpm-30kwpm), which is currently producing DRAM, for NAND flash production to meet robust demand growth. However, if DRAM demand turns out to be stronger than expected, especially in 2H12, our bit growth assumption for Hynix’s DRAM might have further upside potential.
In terms of ASP, we expect blended ASP to decline by 33% in 2012E vs 47% in 2011E on an average full-year basis. By applications, we assume the commodity DRAM price to decline by 36%, a slightly steeper drop than for blended ASP. In the case of specialty DRAM, we think the ASP will continue to decline, but by a much lower magnitude compared to commodity DRAM.
We estimate roughly 50% of total bit shipments are still from commodity DRAM, with the remainder from specialty DRAM, such as server DRAM, mobile DRAM, graphic DRAM and consumer DRAM. However, on a revenue basis, commodity DRAM accounted for roughly 30% of total DRAM revenue due to the significant difference in the ASP. We believe mobile DRAM offers the highest margin and commodity DRAM the least. Given that the price of specialty DRAM is less volatile than that for commodity DRAM, higher exposure to specialty DRAM would moderate the volatility of blended ASP, which would be favourable in a downturn and vice versa.

Barclays Capital | Hynix Semiconductor
21 November 2011 24
Figure 32: DRAM revenue mix of Hynix
0%10%
20%30%
40%50%60%
70%80%
90%100%
1Q10 2Q10 3Q10 4Q10 1Q11 2Q11 3Q11
Commodity (revenue basis) Server Graphic Consumer Mobile
Source: Barclays Capital estimates
Figure 33: DRAM technology node at Hynix
1Q11 2Q11 3Q11 4Q11E 1Q12E 2Q12E 3Q12E 4Q12E
66nm 10% 0% 0% 0% 0% 0% 0% 0%
54nm 40% 25% 20% 10% 0% 0% 0% 0%
44nm 50% 70% 70% 60% 60% 45% 40% 30%
38nm 0% 5% 10% 30% 40% 50% 50% 50%
29nm 0% 0% 0% 0% 0% 5% 10% 20%
Note: On a wafer basis Source: Barclays Capital estimates
NAND: Emerging as a new earnings contributor
We expect the NAND division’s operating profit to show meaningful growth in 2012E and 2013E. We estimate OP would reach KRW469bn in 2012E and KRW715bn in 2013E vs. KRW356bn in 2011E given: 1) favourable supply-demand dynamics in the NAND industry on the back of robust demand growth from new drivers such as SSD and still well-disciplined supply dynamics; 2) a relatively smaller gap in cost structure to first-tier players such as SEC and Toshiba; and 3) the potential opportunity if Apple will diversify its NAND flash supply source.
We focus on two facts about Hynix’s NAND flash business: 1) Hynix is supplying NAND flash to Apple for its iPhone4S, which implies that Hynix is technologically ready to supply other smartphone makers; and 2) operating margin was not materially different to that of SEC and Toshiba in its recent earnings result.
We expect 83% supply bit growth in 2012E and 107% in 2013E. We assume that a substantial part of bit growth in 2012E will be achievable from geometry migration to 26nm node and 20K-30K of wafer capacity increase helped by M10. Hynix could be a bit more aggressive about NAND flash capacity expansion from 2H12, in our opinion, given the recently increased capex budget due to the rights offering to SK Telecom. (Hynix made a public announcement on 14 November that it will raise roughly 101.9mn shares at KRW23,000, which is equivalent to rights of KRW2.34trn being offered to SK Telecom.)

Barclays Capital | Hynix Semiconductor
21 November 2011 25
Figure 34: DRAM technology node at Hynix
1Q11 2Q11 3Q11 4Q11E 1Q12E 2Q12E 3Q12E 4Q12E
16nm MLC 64G 0% 0% 0% 0% 0% 0% 0% 5%
20nm MLC 64G 0% 0% 0% 5% 20% 30% 40% 50%
26nm MLC 64G 20% 40% 50% 60% 50% 50% 45% 40%
32nm MLC 32G 65% 50% 45% 35% 30% 20% 15% 5%
41nm MLC 32G 10% 5% 0% 0% 0% 0% 0% 0%
48nm MLC 16G 5% 5% 5% 0% 0% 0% 0% 0%
Note: On a wafer basis Source: Barclays Capital estimates
Figure 35: NAND flash operating margin by vendor in 3Q11E
0%
5%
10%
15%
20%
25%
SEC Hynix Toshiba
Source: Barclays Capital estimates

Barclays Capital | Hynix Semiconductor
21 November 2011 26
VALUATION AND RISKS
Historical valuation suggests upside from here
For valuation, we use historical P/B for the cyclical context, applying the mid-cycle average as we expect an upcycle for NAND and a downcycle for DRAM. Our price target represents 54.0x 2012E P/E and 11.4x 2013E P/E. We acknowledge that the stock may not appear attractive to some investors from the perspective of ROE rather than P/B or P/E. However, we focus on the fact that the share price performance of DRAM manufacturers has been driven by a relatively short-term earnings outlook. Therefore, we recommend investors focus on the quarterly earnings outlook.
As shown in Figure 36, Hynix’s P/B multiple is not very sensitive to ROE change. We attribute this to the highly cyclical and volatile nature of the company’s earnings, which investors discount as extraordinarily higher or lower earnings. In our earnings model, we forecast ROE of 12.3% in 4Q12 and, based on our 2012E BVPS assumption, Hynix is trading at 1.66x, which is obviously lower than the historical trend line. Given our target P/B multiple of 1.92x is generally in line with the historical trend, we believe our price target is reasonable.
Figure 36: P/B target multiple in a historical quarterly context
0.0
0.5
1.0
1.5
2.0
2.5
3.0
-100% -80% -60% -40% -20% 0% 20% 40% 60% 80%
ROE
P/B (x)
Current share price
Target multiplebased on 4Q12E ROE: 12.3%
Note: Based on estimated quarter-end BVPS and quarterly average P/B multiple Source: Barclays Capital estimates
We believe Hynix’s share price has moved largely in correlation with DRAM ASP changes (Figure 37). In this regard, the anticipated DRAM ASP recovery from 2Q12 could be another indication of potential upward movement in the share price.

Barclays Capital | Hynix Semiconductor
21 November 2011 27
Figure 37: Hynix historical share price vs DRAM ASP change
0
10,000
20,000
30,000
40,000
50,000
60,000
Jan 02 Jan 04 Jan 06 Jan 08 Jan 10-40%
-20%
0%
20%
40%
60%
80%
100%
Share price (LHS) DRAM ASP change (3MMA, RHS)
(KRW)
Note: DRAM ASP change based on 3 month moving average of m/m ASP change Source: Barclays Capital
Risks
The key risks that could prevent our 12-month price target from being achieved, in our view, include the following:
Potential new owner SK Telecom’s lack of experience in running a highly cyclical business.
Mistimed execution in DRAM and NAND production.
Too aggressive capacity expansion on NAND could drive market share competition among players.
Figure 38: Hynix – Peer valuation comparison
Price Potential up/
downside P/E (x) P/B (x) ROE (%)
Ticker Rating (Local) PT to PT (%) 2010 2011E 2012E 2010 2011E 2012E 2010 2011E 2012E
Hynix 000660 KS 1-OW/3-Neg 23,200 27,000 16.4 5.2 (994.4) 54.0 1.80 1.93 1.66 32.4 (0.2) 3.3 Peers' AVG 21.9 55.9 18.7 1.1 1.1 1.0 8.7 (8.8) (9.7)Samsung Electronics 005930 KS 1-OW/3-Neg 980,000
1,250,000 27.6 10.6 12.3 9.7 2.01 1.74 1.49 20.4 14.7 16.1
Micron MU US 2-EW/1-Pos 6.74 8.00 18.7 3.6 144.0 36.2 0.84 0.82 0.81 16.3 0.6 2.2 Elpida AAPL US NR 348 n/a nm 64.3 n/a n/a 0.29 0.43 0.47 0.8 (31.2) (5.1)Inotera 3474 TT NR 4.47 n/a nm n/a n/a n/a 0.39 0.56 0.91 (20.9) (44.9) (77.3)Sandisk SNDK US NR 51.07 n/a nm 9.1 11.4 10.1 2.09 1.80 1.55 26.8 16.9 15.6
Note: Stock Rating: 1-OW: 1-Overweight, 2-EW: 2-Equal Weight, 3-UW: 3-Underweight. Sector View: 1-Pos: 1-Positive, 2-Neu: 2-Neutral, 3-Neg: 3-Negative. Estimates for not rated stocks (NR) are Bloomberg estimates. For full disclosures on each rated company, including details of company-specific valuation methodology and risks, please refer to: http://publicresearch.barcap.com. Share prices as of the close on 17 November 2011 in local currency. Source: Bloomberg, Barclays Capital estimates

Barclays Capital | Hynix Semiconductor
21 November 2011 28
Figure 39: Asia Pacific semiconductors – valuation comparison
Price
Pot. up/downside
to PT Mkt Cap EPS P/E (x) P/BV (x) ROE (%) Stock Sector Ticker Rating (Local) PT (%) (US$bn) FY11E FY12E FY11E FY12E FY11E FY12E FY11E FY12E
Hynix IDM 000660 KS 1-OW/3-Neg 23,200 27,000 16.4 12.1 (23) 430 (994.4
) 54.0 1.93 1.66 (0.2) 3.3 Samsung Electronics IDM 005930 KS 1-OW/3-Neg 980,000
1,250,000 27.6 147.9 79,932
101,477 10.6 12.3 1.74 1.49 14.7 16.1
TSMC Foundry 2330 TT 2-EW/3-Neg 75.7 63 (16.8) 64.9 5.2 5.2 14.7 14.5 3.09 2.83 21.1 19.5
UMC Foundry 2303 TT 3-UW/3-Neg 12.85 10.5 (18.3) 5.6 0.8 0.8 16.6 16.2 0.79 0.78 4.8 4.8
Vanguard Foundry 5347 TT 3-UW/3-Neg 11.4 10.5 (7.9) 0.6 0.4 0.5 30.2 21.4 0.88 0.85 2.9 4.0
ASE OSAT 2311 TT 2-EW/3-Neg 27.95 27 (3.4) 6.2 2.1 2.4 13.4 11.8 1.93 1.77 14.4 15.0
SPIL OSAT 2325 TT 2-EW/3-Neg 28.6 30 4.9 3.0 1.5 1.7 19.1 17.3 1.45 1.42 7.6 8.2
Kinsus Substrate 3189 TT 3-UW/3-Neg 98.5 85 (13.7) 1.5 6.4 6.6 15.3 14.8 1.92 1.70 12.5 11.5
Nan Ya PCB Substrate 8046 TT 1-OW/3-Neg 75.1 97 29.2 1.6 6.0 7.8 12.6 9.6 1.28 1.13 10.2 11.8
Shinko Substrate 6967 JP 3-UW/1-Pos 513 490 (4.5) 0.9 14.0 33.9 36.8 15.1 0.52 0.51 1.4 3.4
Ibiden Substrate 4062 JP 1-OW/1-Pos 1,667 2,400 44.0 3.3 97.3 164.3 17.1 10.1 0.85 0.79 5.0 7.8
NGK Spark Plug Substrate 5334 JP 2-EW/1-Pos 967 1,190 23.1 2.8 124.8 106.4 7.7 9.1 0.95 0.92 12.3 10.1
Mediatek Fabless 2454 TT 1-OW/3-Neg 308.5 400 29.7 11.8 12.7 16.8 24.2 18.4 3.27 3.16 13.5 17.2 MStar Fabless 3697 TT 1-OW/3-Neg 174 210 20.7 3.1 12.9 14.7 13.5 11.8 2.40 2.00 17.8 16.9
Note: For full disclosures on each rated company, including details of company-specific valuation methodology and risks, please refer to: http://publicresearch.barcap.com. Share prices as of the close on 17 November 2011 in local currency. Source: Bloomberg, Barclays Capital estimates
Figure 40: Hynix – historical valuations
2003 2004 2005 2006 2007 2008 2009 2010 5-Yr AVG
Share price (KRW)
High 10,000 15,150 35,300 40,300 40,000 31,950 23,400 29,400
Low 2,625 5,560 11,350 26,150 22,100 5,770 6,430 20,100
Average 5,930 10,761 18,628 33,428 31,348 21,140 15,293 24,099
PER (x)
High nm 3.9 8.6 9.0 53.0 nm nm 6.6 34.4
Low nm 1.4 2.7 5.8 29.3 nm nm 4.5 23.3
Average nm 2.8 4.5 7.5 41.6 nm nm 5.4 28.9
EPS (KRW) (4,755) 3,867 4,128 4,477 754 (10,269) (590) 4,486
PBR (x)
High 2.13 1.78 2.80 2.29 2.16 3.20 2.63 2.28 2.51
Low 0.56 0.65 0.90 1.49 1.19 0.58 0.72 1.56 1.25
Average 1.26 1.26 1.48 1.90 1.69 2.11 1.72 1.87 1.92
BVPS (KRW) 4,697 8,527 12,617 17,568 18,546 9,999 8,897 12,914
PBR/ROE (x)
High (3.81) 3.71 8.08 8.24 54.74 (0.86) (39.86) 7.02
Low (1.00) 1.36 2.60 5.35 30.24 (0.16) (10.95) 4.80
Average (2.26) 2.63 4.26 6.83 42.90 (0.57) (26.05) 5.76
ROE (%) -55.9% 47.9% 34.6% 27.8% 3.9% -370.9% -6.6% 32.4%
Source: Barclays Capital

Barclays Capital | Hynix Semiconductor
21 November 2011 29
COMPANY BACKGROUND
Organizational structure
Figure 41: Hynix – organizational structure
General Charge of R&D and ManufacturingGeneral Charge of R&D and Manufacturing
CEOCEO
R&D DivisionR&D Division Flash DevelopmentDivision
Flash DevelopmentDivision
FAB ManufacturingDivision
FAB ManufacturingDivision
M8 DivisionM8 Division Quality Assurance &Reliability Division
Quality Assurance &Reliability Division
Corporate FinanceDivision
Corporate FinanceDivision
AdministrationDivisionAdministrationDivision
DRAM DevelopmentDivision
DRAM DevelopmentDivision
Mobile DivisionMobile Division
PKG&TEST ManufacturingDivision
PKG&TEST ManufacturingDivision
Marketing & SalesDivision
Marketing & SalesDivision
Corporate StrategyDivision
Corporate StrategyDivision
Business TransformationDivision
Business TransformationDivision
HSCLHSCLBusiness CooperationDivision
Business CooperationDivision
ProcurementDivisionProcurementDivision
Source: Company data, Barclays Capital
Figure 42: Hynix – sales breakdown by region, 2Q11
Figure 43: Hynix – sales breakdown by product, 3Q11
Korea7%
China2%
South-East Asia50%
America31%
Europe10%
DRAM67%
NAND flash30%
Others3%
Source: Company data, Barclays Capital Source: Company data, Barclays Capital

Barclays Capital | Hynix Semiconductor
21 November 2011 30
Figure 44: Hynix – key events in the company’s history
Year Event
1983 Established Hyundai Electronics Co., Ltd
1985 Started pilot production of semiconductor
1996 Listed on Korea Exchange
1999 Took over large stockholder's share of LG Semiconductor and Merged Hyundai Semiconductor Co,. Ltd.
2001 Changed the Company name to 'Hynix Semiconductor Inc.' and completed separation from Hyundai Group
Early-to-mid 2001
Creditor financial institutions co-managed the company according to articles of the Corporate Restructuring Promotion Act from October 4, 2001 to July 12, 2005
2011 Stock Management Council announced its plan to receive preliminary bids for their controlling stake of Hynix in July. SK Telecom was named preferred bidder in November.
Source: Company data

Barclays Capital | Hynix Semiconductor
21 November 2011 31
Management team and major shareholders
Figure 45: Hynix – board members Figure 46: Hynix – major shareholders
Name Title
Oh Chul Kwon President & CEO
Sung Wook Park Executive VP / CTO
Min Chul Kim Chief Financial Officer
Boo Whan Han Outside Director
Kab Jong Paek Outside Director
In Baik Jeon Outside Director
Byung Tae Jung Outside Director
Jae Yong Song Outside Director
Hyun Myung Cho Outside Director
Dal Gon Lee Outside Director
Kap Hoi Kim Outside Director
Shareholders Stake (%)
Stock Management Council * 15.0
National Pension 9.2
Mirae Asset Investment Management 5.0
AllianceBerstein 4.3
Vanguard Group 3.1
Blackrock Fund Advisors 1.5
Samsung Investment Trust MGNT 1.1
Fidelity International 1.1
Maps Investment 1.1
Other 1.0 Source: Company data Note: * Creditor banks
Source: Bloomberg, FSS, Barclays Capital
Figure 47: Hynix – share price performance
Figure 48: Hynix – sales and EBITDA forecasts
0
5,000
10,000
15,000
20,000
25,000
30,000
0
5,000
10,000
15,000
20,000
25,000
30,000
35,000
40,000
Nov 10 Jan 11 Mar 11 Jun 11 Aug 11 Nov 11
Volume 5d Avg (RHS) Price (LHS)
(KRW) ('000)
0
2,000
4,000
6,000
8,000
10,000
12,000
14,000
2009 2010 2011E 2012E 2013E0%
10%
20%
30%
40%
50%
60%
Sales (LHS) EBITDA margin (RHS)
(KRWbn)
Source: Barclays Capital, DataStream Source: Company data, Barclays Capital estimates

Barclays Capital | Hynix Semiconductor
21 November 2011 32
FINANCIAL STATEMENTS
Figure 49: Hynix – income statement (2009-13E)
(KRWbn) 2009 2010 2011E 2012E 2013E
Total Revenue 7,906 12,099 10,039 9,782 11,954
COGS 6,280 7,319 8,603 8,325 8,903
Gross Profit 1,627 4,779 1,436 1,458 3,051
Operating Expenses 1,435 1,506 1,417 1,272 1,554
EBITDA 2,988 6,100 3,643 3,758 4,905
Depreciation and Amortization 2,796 2,827 3,419 3,531 3,367
EBIT 192 3,273 224 227 1,538
Interest income 51 81 41 75 69
Interest expense 451 441 329 297 240
Net Interest Income/ Expense (400) (360) (288) (221) (171)
FX Gains 275 (54) 27 258 (1)
Net gain in subsidiaries 0 0 9 6 6
Other net gains/losses (438) (163) 36 31 41
Pre-tax Profit (371) 2,696 7 300 1,413
Tax (38) 40 18 0 0
Discontinued operation 0 0 0 0 0
Net Profit (333) 2,656 (12) 300 1,413
Minority Interest 15 9 2 2 2
Average weighted # of ordinary shares (Mil) 590 590 592 694 694
Basic EPS (KRW) (590) 4,486 (23) 430 2,034
Fully diluted EPS (KRW) (620) 4,487 (23) 430 2,034
Note: K-GAAP based until 2010; K-IFRS based 2011 onward Source: Company data, Barclays Capital estimates

Barclays Capital | Hynix Semiconductor
21 November 2011 33
Figure 50: Hynix – balance sheet (2009-13E)
(KRWbn) 2009 2010 2011E 2012E 2013E
Cash and Equivalent 1,209 1,247 675 1,483 2,819
Short-term investments 310 949 1,036 1,035 1,033
Account receivables 1,730 1,604 1,322 1,542 1,945
Accrued receivables 238 152 125 146 185
Inventory 1,057 1,265 1,043 1,217 1,535
Other current assets 373 475 391 457 576
Total current assets 4,917 5,692 4,593 5,879 8,092
Investment assets 163 156 152 158 163
Tangible assets 10,143 10,817 10,494 10,378 10,529
Intangible assets 462 549 691 754 815
Other fixed assets 619 371 306 357 450
Total fixed assets 11,386 11,892 11,642 11,646 11,956
Total assets 16,304 17,584 16,235 17,525 20,048
Account payables 740 874 721 841 1,061
Accrued payables 577 655 540 630 794
Short term debt 1,419 511 1,278 500 500
Current portion of LT liabilities 1,552 2,044 1,685 1,966 2,480
Other current liabilities 1,482 1,257 592 736 931
Total current liabilities 5,769 5,342 4,815 4,672 5,765
Bonds 1,931 1,768 2,240 1,065 1,066
LT debt 2,152 1,836 971 887 887
Non-Current Provisions for Employee Benefits 352 416 343 400 505
Other liabilities 180 53 66 66 66
Total non-current liabilities 4,615 4,073 3,619 2,418 2,524
Total liabilities 10,384 9,415 8,434 7,091 8,289
Paid-in Capital 2,966 2,969 2,978 3,488 3,488
Capital Surplus 1,304 1,415 1,231 3,064 3,064
Retained Earning 1,006 3,654 3,726 4,018 5,343
Other reserves 6 6 6 6 6
Non-Controlling Interests Equity 467 (0) 0 0 0
Other 171 126 (141) (141) (141)
Total equity 5,919 8,169 7,801 10,435 11,760
Total liabilities and equity 16,304 17,584 16,235 17,525 20,048
Note: K-GAAP based until 2010; K-IFRS based 2011 onward Source: Company data, Barclays Capital estimates

Barclays Capital | Hynix Semiconductor
21 November 2011 34
Figure 51: Hynix – cash flow statement, 2009-13E
(KRWbn) 2009 2010 2011E 2012E 2013E
Net profit (333) 2,656 (12) 300 1,413
Depreciation 2,654 2,737 3,400 3,516 3,349
Deductions from Net Profit (1,041) (229) (331) (250) (250)
Total gross cash flow 1,280 5,165 3,058 3,566 4,512
Change in total working capital (894) 96 (488) (270) (494)
Other 954 647 463 552 611
Total operating cash flow 1,340 5,908 3,033 3,848 4,629
Net Tangible Asset (Increase) / Decrease (734) (3,383) (3,395) (3,400) (3,500)
Capex (1,013) (3,421) (3,400) (3,400) (3,500)
Net Current Financial Assets (Increase) / Decrease (125) (662) (86) 2 2
Net Investment Asset (Increase) / Decrease (130) (56) (6) 0 0
Intangible Asset (Increase) / Decrease (22) (149) (207) (229) (229)
Other 7 (459) 10 8 8
Total investment cash flow (1,004) (4,709) (3,685) (3,619) (3,719)
St. Debt Increase (Decrease) (110) (904) 0 (778) 0
Lt. Debt Increase (Decrease) (467) (145) 354 (84) 0
Bond Increase (Decrease) 199 857 69 (1,174) 0
Current Portion of Lt. Debt Increase (Decrease) (357) (949) (255) 281 514
IPO Issues 1,031 0 0 2,343 0
Dividend Paid 0 0 (89) (9) (89)
Other 58 0 0 0 0
Total financing cash flow 355 (1,140) 79 579 426
Other Cash Flows from Operating, Investing, Financing Activities (8) (20) (12) 0 0
Change of Consolidated Scope 0 0 0 0 0
Total cash flow 682 38 (585) 807 1,336
Cash balance at beginning of the Year 527 1,209 1,247 662 1,470
Cash balance at end of the Year 1,209 1,247 662 1,470 2,805
Free Cash Flow 328 2,487 (367) 448 1,129
Note: K-GAAP based until 2010; K-IFRS based 2011 onward Source: Company data, Barclays Capital estimates

Barclays Capital | Hynix Semiconductor
21 November 2011 35
Figure 52: Hynix –key ratios (2009-13E)
(KRWbn) 2009 2010 2011E 2012E 2013E
Profitability Gross margin (%) 20.6 39.5 14.3 14.9 25.5 Operating margin (%) 2.4 27.1 2.2 2.3 12.9 Pre-tax margin (%) (4.7) 22.3 0.1 3.1 11.8 Net margin (%) (4.2) 22.0 (0.1) 3.1 11.8
Financial Cash and Cash-equivalents (KRWbn) 1,519 2,196 1,711 2,517 3,852 ST Debt (KRWbn) 2,971 2,555 2,963 2,466 2,980 LT Debt (KRWbn) 4,083 3,604 3,210 1,952 1,953 Net Debt (KRWbn) 5,535 3,963 4,461 1,901 1,081 Net Debt/Equity (%) 93.5 48.5 57.2 18.2 9.2 Debt/Equity (%) 119.2 75.4 79.1 42.3 41.9 Current Ratio (x) 0.9 1.1 1.0 1.3 1.4 Quick Ratio (x) 0.6 0.7 0.7 0.9 1.0
Economic Value NOPAT (KRWbn) 154 3,313 242 227 1,538
Total Capital (KRWbn)
12,973 14,329
13,973
14,853
16,692 Gross Debt/Capital (%) 54.4 43.0 44.2 29.7 29.6 Equity/Capital (%) 45.6 57.0 55.8 70.3 70.4
Valuation P/E (X) (39.3) 5.2 (994.4) 54.0 11.4 P/BV (X) 2.6 1.8 1.9 1.7 1.5 P/CFPS (X) 10.2 2.3 4.5 4.2 3.5 EV/Sales (X) 2.4 1.5 1.8 1.6 1.2 EV/EBITDA (X) 6.4 2.9 5.0 4.2 3.0 EV/EBIT (X) 100.4 5.4 81.3 68.9 9.6
Performance ROA (%) (2.1) 15.6 (0.1) 1.8 7.5 ROE (%) (6.6) 32.4 (0.2) 3.3 12.7 ROIC (%) 0.9 18.8 1.5 1.3 7.7 Asset Turnover (X) 0.5 0.7 0.6 0.6 0.6 Working Capital/Sales (%) (10.8) 2.9 (2.2) 12.3 19.5 Inventory processing days 62.5 57.9 49.0 49.5 56.4 A/R collection days 57.2 50.3 53.2 53.4 53.2 A/P payment days 42.4 40.2 33.8 34.2 39.0
Coverage Interest Coverage (0.4) (7.4) (0.7) (0.8) (6.4)
Value Per Share (KRW) Earnings Per Share (590) 4,486 (23) 430 2,034 Book Value Per Share 8,897 12,914 12,014 13,956 15,779 Sales Per Share 13,409 20,497 16,964 14,103 17,234 Cash Flow Per Share 2,273 10,008 5,126 5,547 6,674 Gross Cash Per Share 2,576 3,721 2,892 3,629 5,553 Net Cash Per Share (9,387) (6,714) (7,539) (2,740) (1,558)
Note: K-GAAP based until 2010; K-IFRS based 2011 onward Source: Company data, Barclays Capital estimates

Barclays Capital | Hynix Semiconductor
21 November 2011 36
CREDIT AND CONVERTIBLE BOND PERSPECTIVE
CREDIT: Hynix ’17 bonds
From a credit perspective, Hynix’s (B1/B+/BB-) rights offering to SK Telecom is clearly positive for the company’s financial profile, especially if proceeds are used to deleverage. Indeed, all three rating agencies placed their ratings on review for upgrade on expectation that the capital increase will improve Hynix’s capital structure and financial flexibility. Yields on the Hynix ‘17s tightened 47bp following the announcement.
Notwithstanding the positive credit trajectory, we currently have an Underweight recommendation on the Hynix ’17 bonds due to rich valuations and weak near-term (3-6 months) operating outlook. Indicated at a mid-YTW of 6.68% (priced to June 2015 call), the bond trades closer to mid- to high-BB levels in the Asian high yield market context. Compared to its global technology peers, the Hynix ‘17s also trade closer to mid-BB yields despite its weaker high-B/low-BB credit profile.
CONVERTIBLES: Hynix $500mn 2.65% convertible due 2015 Hynix’s $500mn 2.65% convertible due 2015 is currently trading at 99.3 on mids versus a share price of KRW23,200 or parity, the value of the underlying shares, of 67.6, resulting in a conversion premium of 47%. The convertible is yielding 3.2% to its May 2013 put date, and has a 2.7% running yield, greater than the current 0.6% dividend yield on its shares.
Using a 500bp credit spread assumption, 1.5% stock borrow fee and 33% volatility (credit calibrated or 28% in a non-calibrated model) we value the 2015 convertible at 99.9, which equates to an implied volatility of 31% and a bond floor of 98.5. The bond has an equity delta of 32%. Hence we find the bond fair value at current levels. Using our equity analyst’s KRW27,000 12-month price target, our valuation would increase to 102.7, approximately 3% of potential upside. Therefore, rather than an outright equity alternative we find value in the convertible due to its asymmetry. Our convexity analysis indicates potential projected convertible total returns of +5.3%/-0.6% for +25%/-25% (approximately in line with our equity analyst’s upside and downside cases) potential moves in Hynix’s share price over a 12-month time horizon. These equate to participation rates of 0.21x/0.02x the equity moves, or an overall participation upside/downside ratio of 10.5x driven by the short-dated nature of the bond and its bondholder put option.
On a hedged basis we find the convertible attractive given its appealing asymmetric profile. In addition, we could see upside if Hynix credit tightens further due to the SK Telecom stake; an indication a 100bp tightening in credit spread would result in an increase of 1.8 points to theoretical valuation. We also view the bond as a potential short-term switch for equity investors given our analyst’s view that we could see some potential weakness in the shares in the next few months; the convertible has lower equity sensitivity and limited downside.
CREDIT RESEARCH Jit Ming Tan, CFA +65 6308 3210 [email protected]
CONVERTIBLES RESEARCH Heather Beattie +44 (0) 20 7773 5859 [email protected] Barclays Capital, London

Barclays Capital | Hynix Semiconductor
21 November 2011 37
ANALYST(S) CERTIFICATION(S)
In relation to our respective sections, we, SC Bae, Jitming Tan and Heather Beattie, hereby certify (1) that the views expressed in this research report accurately reflect my personal views about any or all of the subject securities or issuers referred to in this research report and (2) no partof my compensation was, is or will be directly or indirectly related to the specific recommendations or views expressed in this research report.
IMPORTANT FIXED INCOME DISCLOSURES
On September 20, 2008, Barclays Capital Inc. acquired Lehman Brothers' North American investment banking, capital markets, and private investmentmanagement businesses. During the transition period, disclosure information will be provided via the sources listed below. For complete information, investors are requested toconsult both sources listed below. https://ecommerce.barcap.com/research/cgi-bin/public/disclosuresSearch.pl or call 1-212-526-1072; http://www.lehman.com/USFIdisclosures/ Clients can access Barclays Capital research produced after the acquisition date either through Barclays Capital's research website or through LehmanLive.Barclays Capital does and seeks to do business with companies covered in its research reports. As a result, investors should be aware that Barclays Capital may have a conflict of interest that could affect the objectivity of this report. Any reference to Barclays Capital includes its affiliates. Barclays Capital and/or an affiliate thereof (the "firm") regularly trades, generally deals as principal and generally provides liquidity (as market maker orotherwise) in the debt securities that are the subject of this research report (and related derivatives thereof). The firm's proprietary trading accounts may have either a long and / or short position in such securities and / or derivative instruments, which may pose a conflict with the interests of investingcustomers. Where permitted and subject to appropriate information barrier restrictions, the firm's fixed income research analysts regularly interact with its trading desk personnel to determine current prices of fixed income securities. The firm's fixed income research analyst(s) receive compensation based onvarious factors including, but not limited to, the quality of their work, the overall performance of the firm (including the profitability of the investmentbanking department), the profitability and revenues of the Fixed Income Division and the outstanding principal amount and trading value of, the profitability of, and the potential interest of the firms investing clients in research with respect to, the asset class covered by the analyst. To the extent thatany historical pricing information was obtained from Barclays Capital trading desks, the firm makes no representation that it is accurate or complete. All levels, prices and spreads are historical and do not represent current market levels, prices or spreads, some or all of which may have changed since thepublication of this document. Barclays Capital produces a variety of different types of fixed income research, including fundamental credit analysis,quantitative credit analysis and trade ideas. Recommendations contained in one type of research may differ from recommendations contained in other types, whether as a result of differing time horizons, methodologies, or otherwise.
Explanation of the High Yield Sector Weighting System Overweight: Expected six-month total return of the sector exceeds the six-month expected total return of the Barclays Capital U.S. High Yield 2% Issuer Capped Credit Index, the Pan-European High Yield 3% Issuer Capped Credit Index excluding Financials, or the EM Asia USD High Yield Corporate CreditIndex, as applicable. Market Weight: Expected six-month total return of the sector is in line with the six-month expected total return of the Barclays Capital U.S. High Yield 2% Issuer Capped Credit Index, the Pan-European High Yield 3% Issuer Capped Credit Index excluding Financials, or the EM Asia USD High Yield CorporateCredit Index, as applicable. Underweight: Expected six-month total return of the sector is below the six-month expected total return of the Barclays Capital U.S. High Yield 2% IssuerCapped Credit Index, the Pan-European High Yield 3% Issuer Capped Credit Index excluding Financials, or the EM Asia USD High Yield Corporate CreditIndex, as applicable. Explanation of the High Yield Research Rating System The High Yield Research team employs a relative return based rating system that, depending on the company under analysis, may be applied to either some or all of the company's debt securities, bank loans, or other instruments. Please review the latest report on a company to ascertain the application ofthe rating system to that company. Overweight: The analyst expects the six-month total return of the rated debt security or instrument to exceed the six-month expected total return of the Barclays Capital U.S. 2% Issuer Capped High Yield Credit Index, the Pan-European High Yield 3% Issuer Capped Credit Index excluding Financials, or the EM Asia USD High Yield Corporate Credit Index, as applicable. Market Weight: The analyst expects the six-month total return of the rated debt security or instrument to be in line with the six-month expected total return of the Barclays Capital U.S. 2% Issuer Capped High Yield Credit Index, the Pan-European High Yield 3% Issuer Capped Credit Index excluding Financials, or the EM Asia USD High Yield Corporate Credit Index, as applicable. Underweight: The analyst expects the six-month total return of the rated debt security or instrument to be below the six-month expected total return of the Barclays Capital U.S. 2% Issuer Capped High Yield Credit Index, the Pan-European High Yield 3% Issuer Capped Credit Index excluding Financials, or the EM Asia USD High Yield Corporate Credit Index, as applicable. Rating Suspended (RS): The rating has been suspended temporarily due to market events that make coverage impracticable or to comply with applicableregulations and/or firm policies in certain circumstances including where Barclays Capital is acting in an advisory capacity in a merger or strategictransaction involving the company. Coverage Suspended (CS): Coverage of this issuer has been temporarily suspended. Not Rated (NR): An issuer which has not been assigned a formal rating

Barclays Capital | Hynix Semiconductor
21 November 2011 38
IMPORTANT EQUITY DISCLOSURES
When an equity research report covers six or more subject companies, Barclays Capital generally does not include specific conflict of interestdisclosures regarding the subject companies and instead provides the reader with instructions about how to view or obtain the applicable conflictof interest disclosures. In order to comply with the requirements of the Korea Financial Investment Association, specific disclosures aboutsubject companies with securities listed on the Korea Exchange are included herein. To access important disclosures, including, where relevant,price targets, regarding other companies that are the subject of this research report, please send a written request to: Barclays Capital Research Compliance, 745 Seventh Avenue, 17th Floor, New York, NY 10019 or refer to http://publicresearch.barcap.com or call 1-212-526-1072.
The analysts responsible for preparing this research report have received compensation based upon various factors including the firm's total revenues, a portion of which is generated by investment banking activities.
Research analysts employed outside the US by affiliates of Barclays Capital Inc. are not registered/qualified as research analysts with FINRA. These analysts may not be associated persons of the member firm and therefore may not be subject to NASD Rule 2711 and incorporated NYSERule 472 restrictions on communications with a subject company, public appearances and trading securities held by a research analyst’s account.
Barclays Capital produces a variety of research products including, but not limited to, fundamental analysis, equity-linked analysis, quantitative analysis, and trade ideas. Recommendations contained in one type of research product may differ from recommendations contained in other types of research products, whether as a result of differing time horizons, methodologies, or otherwise.
Convertible Risk Disclosure(s) The convertible valuations are based on Barclays Capital proprietary convertible valuation model, under which key assumptions relate to credit spread and equity volatility metrics. Material changes in any of these variables can have a significant impact on valuation. Upside/downside analysis takes into consideration likely future valuation and expected trading patterns, among others. It is based on a total return participation of the convertible relative to a +/- 25% (unless otherwise specified) change in the common stock’s price over a one‐year investment horizon. A material change in the company’s financial situation can significantly alter this assessment.
Primary Stocks (Ticker, Date, Price)
Hynix Semiconductor (000660.KS, 17-Nov-2011, KRW 23200.00), 1-Overweight/3-Negative
Materially Mentioned Stocks (Ticker, Date, Price)
Advanced Semiconductor Engineering (2311.TW, 17-Nov-2011, TWD 27.95), 2-Equal Weight/3-Negative
Kinsus Interconnect Technology (3189.TW, 17-Nov-2011, TWD 98.50), 3-Underweight/3-Negative
MediaTek Inc. (2454.TW, 17-Nov-2011, TWD 308.50), 1-Overweight/3-Negative
Micron Technology, Inc. (MU, 17-Nov-2011, USD 6.33), 2-Equal Weight/1-Positive
MStar Semiconductor, Inc. (3697.TW, 17-Nov-2011, TWD 174.00), 1-Overweight/3-Negative
Nan Ya Printed Circuit Board (8046.TW, 17-Nov-2011, TWD 75.10), 1-Overweight/3-Negative
Samsung Electronics (005930.KS, 17-Nov-2011, KRW 980000.00), 1-Overweight/3-Negative
Siliconware Precision Industries (2325.TW, 17-Nov-2011, TWD 28.60), 2-Equal Weight/3-Negative
TSMC (2330.TW, 17-Nov-2011, TWD 75.70), 2-Equal Weight/3-Negative
United Microelectronics Corp. (2303.TW, 17-Nov-2011, TWD 12.85), 3-Underweight/3-Negative
Vanguard International Semiconductor (5347.TWO, 17-Nov-2011, TWD 11.40), 3-Underweight/3-Negative
Guide to the Barclays Capital Fundamental Equity Research Rating System:
Our coverage analysts use a relative rating system in which they rate stocks as 1-Overweight, 2-Equal Weight or 3-Underweight (see definitions below) relative to other companies covered by the analyst or a team of analysts that are deemed to be in the same industry sector (the “sector coverage universe”).
In addition to the stock rating, we provide sector views which rate the outlook for the sector coverage universe as 1-Positive, 2-Neutral or 3-Negative (see definitions below). A rating system using terms such as buy, hold and sell is not the equivalent of our rating system. Investorsshould carefully read the entire research report including the definitions of all ratings and not infer its contents from ratings alone.
Stock Rating
1-Overweight - The stock is expected to outperform the unweighted expected total return of the sector coverage universe over a 12-month investment horizon.
2-Equal Weight - The stock is expected to perform in line with the unweighted expected total return of the sector coverage universe over a 12-month investment horizon.
3-Underweight - The stock is expected to underperform the unweighted expected total return of the sector coverage universe over a 12-month investment horizon.
RS-Rating Suspended - The rating and target price have been suspended temporarily due to market events that made coverage impracticable orto comply with applicable regulations and/or firm policies in certain circumstances including when Barclays Capital is acting in an advisory capacity in a merger or strategic transaction involving the company.

Barclays Capital | Hynix Semiconductor
21 November 2011 39
Sector View
1-Positive - sector coverage universe fundamentals/valuations are improving.
2-Neutral - sector coverage universe fundamentals/valuations are steady, neither improving nor deteriorating.
3-Negative - sector coverage universe fundamentals/valuations are deteriorating.
Below is the list of companies that constitute the "sector coverage universe":
Asia ex-Japan Semiconductors
Advanced Semiconductor Engineering (2311.TW)
Hynix Semiconductor (000660.KS) Kinsus Interconnect Technology (3189.TW)
MediaTek Inc. (2454.TW) MStar Semiconductor, Inc. (3697.TW) Nan Ya Printed Circuit Board (8046.TW)
Samsung Electronics (005930.KS) Siliconware Precision Industries (2325.TW) TSMC (2330.TW)
United Microelectronics Corp. (2303.TW) Vanguard International Semiconductor (5347.TWO)
U.S. Semiconductors
Advanced Micro Devices (AMD) Altera Corp. (ALTR) Analog Devices (ADI)
Atmel Corp. (ATML) Avago Technologies Ltd. (AVGO) Broadcom Corp. (BRCM)
Cavium Inc. (CAVM) Cypress Semiconductor Corp. (CY) Entropic Communications Inc. (ENTR)
Freescale Semiconductor Holdings (FSL) Integrated Device Technology, Inc. (IDTI) Intel Corp. (INTC)
Linear Technology (LLTC) LSI Corp. (LSI) MagnaChip Semiconductor (MX)
Marvell Technology Group, Ltd. (MRVL) Maxim Integrated Products (MXIM) Microchip Technology (MCHP)
Micron Technology, Inc. (MU) Netlogic Microsystems (NETL) NVIDIA Corp. (NVDA)
NXP Semiconductors NV (NXPI) RF Micro Devices (RFMD) Silicon Laboratories, Inc. (SLAB)
Skyworks Solutions, Inc. (SWKS) Spansion Inc. (CODE) Texas Instruments, Inc. (TXN)
Triquint Semiconductor (TQNT) Volterra Semiconductor Corp. (VLTR) Xilinx, Inc. (XLNX)
Distribution of Ratings:
Barclays Capital Inc. Equity Research has 1991 companies under coverage.
43% have been assigned a 1-Overweight rating which, for purposes of mandatory regulatory disclosures, is classified as a Buy rating; 56% ofcompanies with this rating are investment banking clients of the Firm.
42% have been assigned a 2-Equal Weight rating which, for purposes of mandatory regulatory disclosures, is classified as a Hold rating; 50% ofcompanies with this rating are investment banking clients of the Firm.
12% have been assigned a 3-Underweight rating which, for purposes of mandatory regulatory disclosures, is classified as a Sell rating; 37% ofcompanies with this rating are investment banking clients of the Firm.
Guide to the Barclays Capital Price Target:
Each analyst has a single price target on the stocks that they cover. The price target represents that analyst's expectation of where the stock willtrade in the next 12 months. Upside/downside scenarios, where provided, represent potential upside/potential downside to each analyst's pricetarget over the same 12-month period.
Barclays Capital offices involved in the production of equity research:
London
Barclays Capital, the investment banking division of Barclays Bank PLC (Barclays Capital, London)
New York
Barclays Capital Inc. (BCI, New York)
Tokyo
Barclays Capital Japan Limited (BCJL, Tokyo)
São Paulo
Banco Barclays S.A. (BBSA, São Paulo)
Hong Kong
Barclays Bank PLC, Hong Kong branch (Barclays Bank, Hong Kong)
Toronto
Barclays Capital Canada Inc. (BCC, Toronto)

Barclays Capital | Hynix Semiconductor
21 November 2011 40
Johannesburg
Absa Capital, a division of Absa Bank Limited (Absa Capital, Johannesburg)
Mexico City
Barclays Bank Mexico, S.A. (BBMX, Mexico City)
Taiwan
Barclays Capital Securities Taiwan Limited (BCSTW, Taiwan)
Seoul
Barclays Capital Securities Limited (BCSL, Seoul)
Mumbai
Barclays Securities (India) Private Limited (BSIPL, Mumbai)
Singapore
Barclays Bank PLC, Singapore branch (Barclays Bank, Singapore)

Barclays Capital | Hynix Semiconductor
21 November 2011 41
IMPORTANT DISCLOSURES CONTINUED
Hynix Semiconductor (000660 KS / 000660.KS) Stock Rating Sector View
KRW 23200.00 (17-Nov-2011) 1-OVERWEIGHT 3-NEGATIVE
Rating and Price Target Chart - KRW (as of 17-Nov-2011) Currency=KRW
Closing Price
Jan- 09 Jul- 09 Jan- 10 Jul- 10 Jan- 11 Jul- 114K
6K
8K
10K
12K
14K
16K
18K
20K
22K
24K
26K
28K
30K
32K
34K
36K
38K
Date Closing Price Rating Price Target
Link to Barclays Capital Live for interactive charting
Barclays Bank PLC and/or an affiliate trades regularly in the securities of Hynix Semiconductor.
Valuation Methodology: We use P/B valuation for the cyclical context, where we apply the historical mid-cycle (average) P/B of 1.92x to our2012E BVPS since we expect an upcycle for NAND and downcycle for DRAM.
Risks which May Impede the Achievement of the Price Target: 1) Potential new owner SK Telecom's lack of experience in running a highlycyclical business. 2) Mistimed execution in DRAM and NAND production. 3) Too aggressive capacity expansion on NAND could drive marketshare competition.

Barclays Capital | Hynix Semiconductor
21 November 2011 42
IMPORTANT DISCLOSURES CONTINUED
Samsung Electronics (005930 KS / 005930.KS) Stock Rating Sector View
KRW 980000.00 (17-Nov-2011) 1-OVERWEIGHT 3-NEGATIVE
Rating and Price Target Chart - KRW (as of 17-Nov-2011) Currency=KRW
Date Closing Price Rating Price Target
Closing Price Target Price Rating Change
Jan- 09 Jul- 09 Jan- 10 Jul- 10 Jan- 11 Jul- 11
400.0K
500.0K
600.0K
700.0K
800.0K
900.0K
1.0M
1.1M
1.2M
1.3M
08-Nov-2011 993000.00 1-Overweight 1250000.00
Link to Barclays Capital Live for interactive charting
Barclays Bank PLC and/or an affiliate trades regularly in the securities of Samsung Electronics.
Valuation Methodology: Our 12-month price target of KRW1.25mn for SEC is based on a cyclical context historical P/B valuation. In our valuation, we apply a target P/B multiple of 1.9x to our estimate for the BVPS for 2012. Our target multiple is the stock's historical average for thepast five years. We use the average P/B since 2006 to reflect the ongoing de-rating of the P/B multiple since 2006. However, we believe that the de-rating will stop from 2012 and that a re-rating will start from 2013 assuming a successful launch of a large-size OLED business, which might significantly improve SEC's ROE profile on a long-term basis. Our price target is roughly equivalent to a P/E of 12.3x for 2012, which is slightlylower than the stock's historical average P/E for the past five years of 12.9x.
Risks which May Impede the Achievement of the Price Target: Key risks to our positive call on SEC include: 1) double dip in global economy,which might impact demand across the board; 2) much slower-than-expected (flexible) OLED ramp up, which is the key to market share gains insmart devices, in our view; and 3) materially negative results from any kind of lawsuit.

DISCLAIMER:
This publication has been prepared by Barclays Capital, the investment banking division of Barclays Bank PLC, and/or one or more of its affiliates as provided below. It isprovided to our clients for information purposes only, and Barclays Capital makes no express or implied warranties, and expressly disclaims all warranties ofmerchantability or fitness for a particular purpose or use with respect to any data included in this publication. Barclays Capital will not treat unauthorized recipients of this report as its clients. Prices shown are indicative and Barclays Capital is not offering to buy or sell or soliciting offers to buy or sell any financial instrument.
Without limiting any of the foregoing and to the extent permitted by law, in no event shall Barclays Capital, nor any affiliate, nor any of their respective officers, directors,partners, or employees have any liability for (a) any special, punitive, indirect, or consequential damages; or (b) any lost profits, lost revenue, loss of anticipated savings or loss of opportunity or other financial loss, even if notified of the possibility of such damages, arising from any use of this publication or its contents.
Other than disclosures relating to Barclays Capital, the information contained in this publication has been obtained from sources that Barclays Capital believes to bereliable, but Barclays Capital does not represent or warrant that it is accurate or complete. The views in this publication are those of Barclays Capital and are subject to change, and Barclays Capital has no obligation to update its opinions or the information in this publication.
The analyst recommendations in this publication reflect solely and exclusively those of the author(s), and such opinions were prepared independently of any otherinterests, including those of Barclays Capital and/or its affiliates. This publication does not constitute personal investment advice or take into account the individualfinancial circumstances or objectives of the clients who receive it. The securities discussed herein may not be suitable for all investors. Barclays Capital recommends thatinvestors independently evaluate each issuer, security or instrument discussed herein and consult any independent advisors they believe necessary. The value of andincome from any investment may fluctuate from day to day as a result of changes in relevant economic markets (including changes in market liquidity). Theinformation herein is not intended to predict actual results, which may differ substantially from those reflected. Past performance is not necessarily indicative of futureresults.
This communication is being made available in the UK and Europe primarily to persons who are investment professionals as that term is defined in Article 19 of the Financial Services and Markets Act 2000 (Financial Promotion Order) 2005. It is directed at, and therefore should only be relied upon by, persons who have professionalexperience in matters relating to investments. The investments to which it relates are available only to such persons and will be entered into only with such persons.Barclays Capital is authorized and regulated by the Financial Services Authority ('FSA') and member of the London Stock Exchange.
Barclays Capital Inc., U.S. registered broker/dealer and member of FINRA (www.finra.org), is distributing this material in the United States and, in connection therewithaccepts responsibility for its contents. Any U.S. person wishing to effect a transaction in any security discussed herein should do so only by contacting a representativeof Barclays Capital Inc. in the U.S. at 745 Seventh Avenue, New York, New York 10019.
Non-U.S. persons should contact and execute transactions through a Barclays Bank PLC branch or affiliate in their home jurisdiction unless local regulations permitotherwise.
This material is distributed in Canada by Barclays Capital Canada Inc., a registered investment dealer and member of IIROC (www.iiroc.ca). To access Barclays Capital policy on the dissemination of research reports, please go to http://www.barcap.com/Client+offering/Research/Research+Policy.
Subject to the conditions of this publication as set out above, Absa Capital, the Investment Banking Division of Absa Bank Limited, an authorised financial services provider (Registration No.: 1986/004794/06), is distributing this material in South Africa. Absa Bank Limited is regulated by the South African Reserve Bank. Thispublication is not, nor is it intended to be, advice as defined and/or contemplated in the (South African) Financial Advisory and Intermediary Services Act, 37 of 2002, orany other financial, investment, trading, tax, legal, accounting, retirement, actuarial or other professional advice or service whatsoever. Any South African person orentity wishing to effect a transaction in any security discussed herein should do so only by contacting a representative of Absa Capital in South Africa, 15 Alice Lane,Sandton, Johannesburg, Gauteng 2196. Absa Capital is an affiliate of Barclays Capital.
In Japan, foreign exchange research reports are prepared and distributed by Barclays Bank PLC Tokyo Branch. Other research reports are distributed to institutionalinvestors in Japan by Barclays Capital Japan Limited. Barclays Capital Japan Limited is a joint-stock company incorporated in Japan with registered office of 6-10-1 Roppongi, Minato-ku, Tokyo 106-6131, Japan. It is a subsidiary of Barclays Bank PLC and a registered financial instruments firm regulated by the Financial Services Agency of Japan. Registered Number: Kanto Zaimukyokucho (kinsho) No. 143.
Barclays Bank PLC, Hong Kong Branch is distributing this material in Hong Kong as an authorised institution regulated by the Hong Kong Monetary Authority.Registered Office: 41/F, Cheung Kong Center, 2 Queen's Road Central, Hong Kong.
This material is issued in Taiwan by Barclays Capital Securities Taiwan Limited. This material on securities not traded in Taiwan is not to be construed as'recommendation' in Taiwan. Barclays Capital Securities Taiwan Limited does not accept orders from clients to trade in such securities. This material may not bedistributed to the public media or used by the public media without prior written consent of Barclays Capital.
This material is distributed in South Korea by Barclays Capital Securities Limited, Seoul Branch.
All equity research material is distributed in India by Barclays Securities (India) Private Limited (SEBI Registration No: INB/INF 231292732 (NSE), INB/INF 011292738(BSE), Registered Office: 208 | Ceejay House | Dr. Annie Besant Road | Shivsagar Estate | Worli | Mumbai - 400 018 | India, Phone: + 91 22 67196363). Other research reports are distributed in India by Barclays Bank PLC, India Branch.
Barclays Bank PLC Frankfurt Branch distributes this material in Germany under the supervision of Bundesanstalt für Finanzdienstleistungsaufsicht (BaFin).
This material is distributed in Malaysia by Barclays Capital Markets Malaysia Sdn Bhd.
This material is distributed in Brazil by Banco Barclays S.A.
This material is distributed in Mexico by Barclays Bank Mexico, S.A.
Barclays Bank PLC in the Dubai International Financial Centre (Registered No. 0060) is regulated by the Dubai Financial Services Authority (DFSA). Barclays Bank PLC-DIFC Branch, may only undertake the financial services activities that fall within the scope of its existing DFSA licence.
Barclays Bank PLC in the UAE is regulated by the Central Bank of the UAE and is licensed to conduct business activities as a branch of a commercial bank incorporatedoutside the UAE in Dubai (Licence No.: 13/1844/2008, Registered Office: Building No. 6, Burj Dubai Business Hub, Sheikh Zayed Road, Dubai City) and Abu Dhabi(Licence No.: 13/952/2008, Registered Office: Al Jazira Towers, Hamdan Street, PO Box 2734, Abu Dhabi).
Barclays Bank PLC in the Qatar Financial Centre (Registered No. 00018) is authorised by the Qatar Financial Centre Regulatory Authority (QFCRA). Barclays Bank PLC-QFC Branch may only undertake the regulated activities that fall within the scope of its existing QFCRA licence. Principal place of business in Qatar: Qatar FinancialCentre, Office 1002, 10th Floor, QFC Tower, Diplomatic Area, West Bay, PO Box 15891, Doha, Qatar.
This material is distributed in Dubai, the UAE and Qatar by Barclays Bank PLC. Related financial products or services are only available to Professional Clients as definedby the DFSA, and Business Customers as defined by the QFCRA.

This material is distributed in Saudi Arabia by Barclays Saudi Arabia ('BSA'). It is not the intention of the Publication to be used or deemed as recommendation, option oradvice for any action (s) that may take place in future. Barclays Saudi Arabia is a Closed Joint Stock Company, (CMA License No. 09141-37). Registered office Al Faisaliah Tower | Level 18 | Riyadh 11311 | Kingdom of Saudi Arabia. Authorised and regulated by the Capital Market Authority, Commercial Registration Number:1010283024.
This material is distributed in Russia by OOO Barclays Capital, affiliated company of Barclays Bank PLC, registered and regulated in Russia by the FSFM. Broker License#177-11850-100000; Dealer License #177-11855-010000. Registered address in Russia: 125047 Moscow, 1st Tverskaya-Yamskaya str. 21.
This material is distributed in Singapore by the Singapore branch of Barclays Bank PLC, a bank licensed in Singapore by the Monetary Authority of Singapore. Formatters in connection with this report, recipients in Singapore may contact the Singapore branch of Barclays Bank PLC, whose registered address is One Raffles QuayLevel 28, South Tower, Singapore 048583.
Barclays Bank PLC, Australia Branch (ARBN 062 449 585, AFSL 246617) is distributing this material in Australia. It is directed at 'wholesale clients' as defined byAustralian Corporations Act 2001.
IRS Circular 230 Prepared Materials Disclaimer: Barclays Capital and its affiliates do not provide tax advice and nothing contained herein should be construed to be taxadvice. Please be advised that any discussion of U.S. tax matters contained herein (including any attachments) (i) is not intended or written to be used, and cannot beused, by you for the purpose of avoiding U.S. tax-related penalties; and (ii) was written to support the promotion or marketing of the transactions or other matters addressed herein. Accordingly, you should seek advice based on your particular circumstances from an independent tax advisor.
Barclays Capital is not responsible for, and makes no warranties whatsoever as to, the content of any third-party web site accessed via a hyperlink in this publication and such information is not incorporated by reference.
© Copyright Barclays Bank PLC (2011). All rights reserved. No part of this publication may be reproduced in any manner without the prior written permission of Barclays Capital or any of its affiliates. Barclays Bank PLC is registered in England No. 1026167. Registered office 1 Churchill Place, London, E14 5HP. Additional informationregarding this publication will be furnished upon request.

US08-000001