Free and Open Source GIS software successful case studies Worldwide

The S2P Secret Sauce:Ingredients for Successful
Source to Pay Transformation
Presented by:
Today’s Presenters
Richard Waugh, VP Corporate Development, Zycus Inc.
Richard has an extensive background in B2B E-Commerce. He
helped launch GE's Trading Process Network (TPN), the first on-
line Marketplace for Sourcing and Procurement. He was also Co-
Founder of B2eMarkets, one of the first SaaS (Software as a
Service) Sourcing Suite providers and later covered the Supply
Management market as an Industry Analyst for the Aberdeen
Group.
Ben comes with over fifteen years+ experience gained in multiple
industries, having worked in Australia, United States and throughout
Asia. A proven track record of being able to deliver results locally,
regionally and globally both on the procurement and sales fronts. He
leads a team of 90+ people to maximize group-wide procurement
and supply chain efficiency with the primary objective of delivering
sustained year on year improved cost, quality, delivery and
technological benefits to the business.
Ben Briggs, Group GM - Procurement and Supply at Crown
Resorts Limited
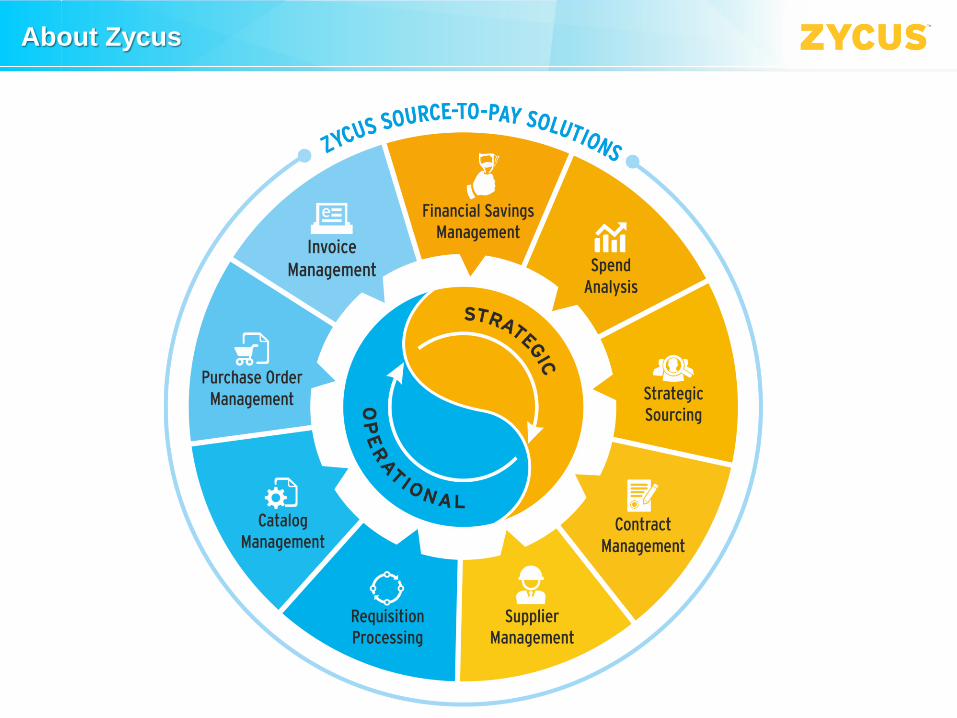
About Zycus

Agenda
Initiating Project - Catalysts for
Change
Benchmarking Current State
Performance
Building the Business Case –
Identify Value Levers
Implementing – Adoption Best
Practices

Catalysts for Change – Market Pressures

Catalysts for Change – Business Pressures
Business Pressures for Technology Adoption
0% 10% 20% 30% 40% 50% 60% 70% 80% 90% 100%
Press coverage about the value of EPTs
Colleagues using EPTs for their work
Management directive
Encouragement by senior leadership
Better integration and visibility externally
Revamping of outdated legacy systems
Enhanced contract compliance
Conviction about the value of EPTs
Common information repository & dashboard
Achievement of savings targets
Identification of opportunities
Better integration and visibility internally
5 - strongly agree
4
3 - neutral
2
1 - strongly disagree

Catalysts for Change – Peer Pressures
Mimetic pressure
0% 10% 20% 30% 40% 50% 60% 70% 80% 90% 100%
The competitiveness of our competitors has increaseddue to their use of procurement technologies
Competitors that have adopted procurementtechnologies for supply management have benefited
greatly
Best-in-class companies use procurementtechnologies
5 - strongly agree
4
3 - neutral
2
1 - strongly disagree

Poll Question #1
Which of the following has been or is likely to be the
most significant catalyst for transforming your
procurement organization?
a. Market pressures (e.g. price change, regulatory,
industry restructuring, disruptive technology)
b. Business pressures (e.g. savings/efficiency goals,
visibility & integration, management directives)
c. Peer pressures (e.g. best-in-class or competitors)
d. None of the above – no impetus for change currently

Initiating Project - Catalysts for
Change
Benchmarking Current State
Performance
Building the Business Case –
Identify Value Levers
Implementing – Adoption Best
Practices
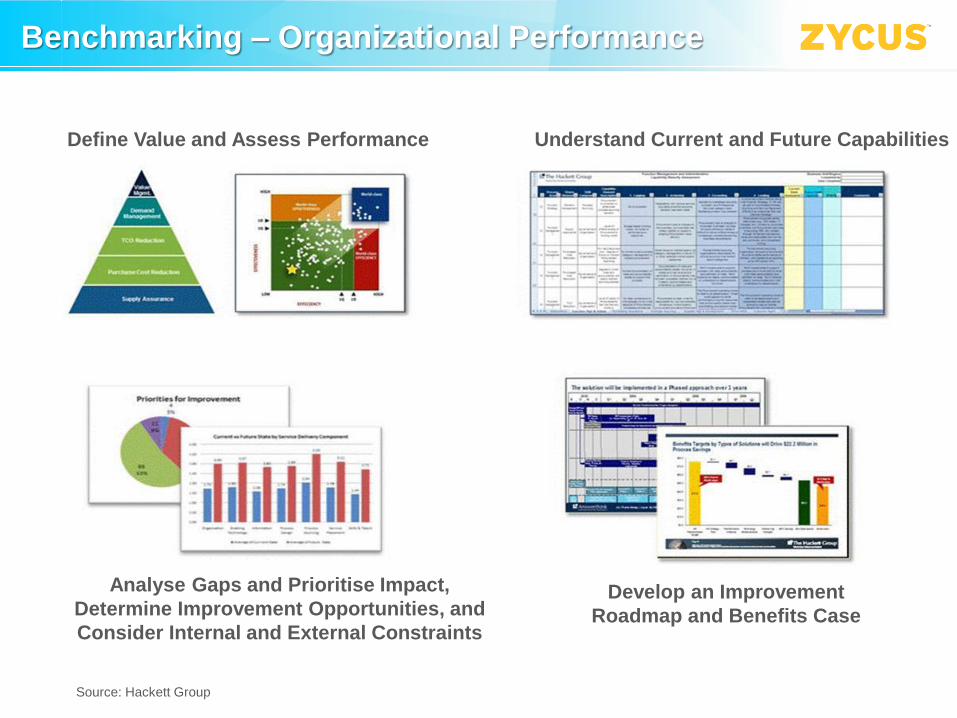
Benchmarking – Organizational Performance
Define Value and Assess Performance Understand Current and Future Capabilities
Analyse Gaps and Prioritise Impact,
Determine Improvement Opportunities, and
Consider Internal and External Constraints
Develop an Improvement
Roadmap and Benefits Case
Source: Hackett Group
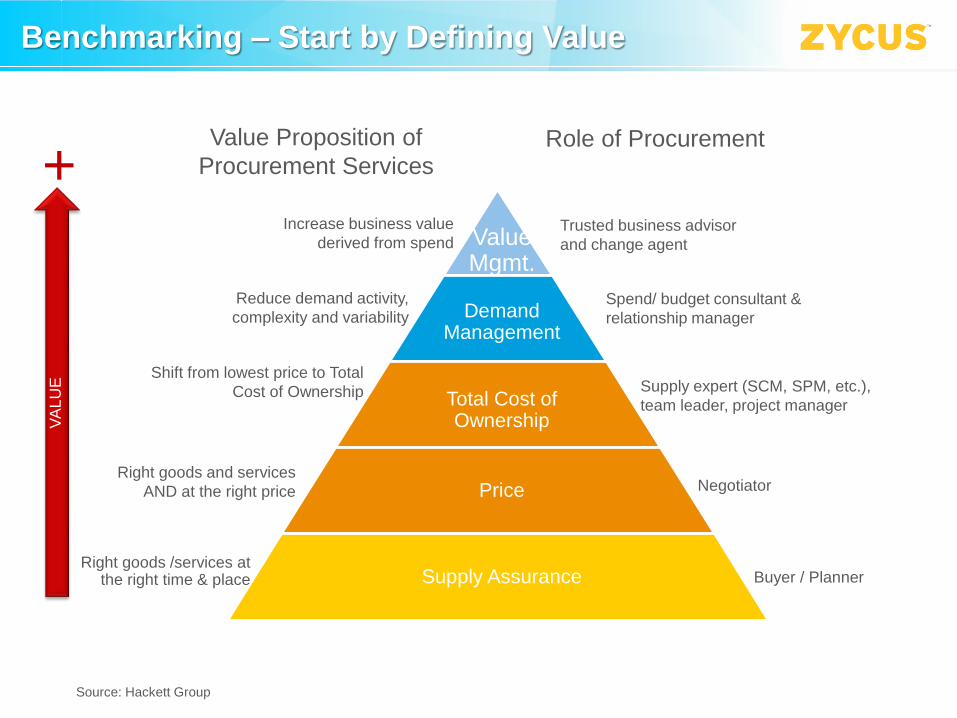
Benchmarking – Start by Defining Value
Value Proposition of
Procurement ServicesRole of Procurement
Right goods /services at the right time & place
Right goods and services
AND at the right price
Shift from lowest price to Total
Cost of Ownership
Reduce demand activity,
complexity and variability
Increase business value
derived from spend
Supply Assurance Buyer / Planner
Negotiator
Supply expert (SCM, SPM, etc.),
team leader, project manager
Spend/ budget consultant &
relationship manager
Trusted business advisor
and change agent
Price
Total Cost of Ownership
DemandManagement
Value Mgmt.
VA
LU
E
+
Source: Hackett Group

Poll Question #2
Which of the following best describes the
current value proposition for your procurement
organization?
a. Supply Assurance
b. Price
c. Total Cost of Ownership
d. Demand Management
e. Value Management

Benchmarking – Assessing Performance
Selected Industry Benchmarks – Strategic Procurement
Source: 2014 CAPS Research Cross-Industry Benchmarks
MetricAerospace
& Defense
Financial
Services
Industrial
Mfg.Petroleum Utilities
% SUM 93.8% 76.2% 89.0% 92.2% 74.8%
Cost Reduction Savings as % SUM 3.8% 5.3% 2.5% 2.8% 2.2%
Cost Avoidance Savings as % SUM 1.6% 1.8% 1.3% 1.6% 1.4%
SM Operating Expense as % Spend 1.6% 0.4% 1.2% 0.9% 0.7%
SM ROI% 318.5% 1397.6% 410.7% 483.4% 425.4%
% Active Suppliers Account for 80% Total
Spend6.5% 8.5% 7.0% 3.5% 4.5%

Benchmarking – Assessing Performance
Performance Area Peer Group World- Class
% of Indirect on E-Catalog (Spend)**
% Indirect on E-Catalog (Transactions)
5%
25%
22%
45%
Order Cycle- Catalog (days)**
Order Cycle- Ad-hoc (days)**
4
19
1
16
POs per FTE** 3,738 12,620
Cost per Invoice** $5.54 $2.06
Invoices per FTE** 9,091 25,047
Source: Hackett Group Procurement Benchmark 2014*, Hackett Group P2P Performance Study 2013**,
Spend Under Management* 66% 85%
Cost per PO** $18 $4.80
Cost Savings as % of Spend* 2.97% 5.34%
Invoice Cycle – PO (days)**
Invoice Cycle – Non- PO (days)**
7
10
5
7
Early Payment Discount Taken as % of Spend** .002% 0.16%
Cross-Industry Benchmarks – Operational Procurement

Poll Question #3
Relative to strategic and operational
procurement benchmarks, which level best
approximates your current performance?
a. World Class/Best-in-Class
b. Average/Peer Group
c. Below Average/Laggard
d. No Idea
Initiating Project - Catalysts for
Change
Benchmarking Current State
Performance
Building the Business Case –
Identify Value Levers
Implementing – Adoption Best
Practices

Source-to-Pay Value Levers
Increase SUM – Discover
Savings Opportunities
Higher Sourcing
Throughput & Savings ID
Rationalize Supply
Base – Increase Spend
w/Preferred
Visibility & Compliance
to Preferred AgreementsReduce/Eliminate
Maverick Purchases
Capture Prompt Pay
Discounts/
P-Card Rebates
Reduce Transaction
Process Costs
Track Finance-
Approved Savings

Business Case Justification
`
Pro-Forma Business Case
Total Sourceable Spend $600,000,000 Esitmated Spend Not Under Management (%) 40%Estimated Spend Under Management (SUM - %) 60% Targeted SUM (%) 85%Current Realized Savings on SUM (%) 2.97% Targeted Realized Savings on SUM 5.34%# Total Active Suppliers 2,500 % Annual Supply Management Time Savings 20%# Supplier Management FTEs 25.42 Target Potential Supply Risk as % Spend 0.15%$ Annual Supplier Management FTE Cost $120,756 Supply Risk % Probalitity Mititgation 50%% Current Total Addressable Spend wth Strategic Suppliers 10% Taregt # Days Supplier On-boarding Cycle 10% Current Potential Supply Risk (as % Spend) 0.3% Target Contract Compliance % 88%Contract Compliance % 43% Target Contract Savings Leakage % 4%Contract Savings Leakage % 17% Target # Days Supplier Scorecard Cycle 10# Days Current Supplier On-boarding Cycle 30 Target # Days Contract (Creation to Approval) Cycle 33# Days Current Supplier Scorecard Cycle 45# Days Contract (Creation to Approval) Cycle 40
ComponentCurrent Incremental
Improvement
Target Performance Incremental Savings
Sourcing Savings on Incremental SUM($) 60% 25% 85% $8,010,000Incremental Sourcing Savings on Current SUM ($) 2.97% 2.37% 5.34% $8,532,000 Subtotal Incremental Sourcing Savings $16,542,000Incremental Contract Compliance 43% 105% 88%
Reduction in Contract Savings Leakage 17% -13% 4% (661,680)$
Supplier Management Productivity Savings 0% 20% 20% $614,014
Supply Risk Mitigation 0.3% 0.1500% 0.15% $900,000
Total Savings $17,394,334
Business Metrics
Business Value

Poll Question #4
How important is a business case in getting
budget approval for a procurement
transformation initiative in your organization?
a. Critical – formal business case review
required to obtain funding
b. Considered – business case a part of the
process but no formal review
c. Casual – may or may not be required
d. N/A – does not apply

Initiating Project - Catalysts for
Change
Benchmarking Current State
Performance
Building the Business Case –
Identify Value Levers
Implementing – Adoption Best
Practices

Best Practice Technology Sequencing
Spend analysis E-Sourcing SBM
Map external spendNegotiate Strategic
AgreementsManage compliance
Manage Supplier
Relationships
Key Success Factors• Identify and use data from
relevant transaction systems
• Deduplicate and classify
• Assign ownership of spend
categories
Key Success Factors• Promote a culture of control
and responsibility
• Involve stakeholders in
category plans, work flow and
templates
Key Success Factors• Build a pipeline of cost reduction
opportunities
• Create a center of excellence
• Make use of e-sourcing
mandatory
Key Success Factors• Segment supplier base to
rightsize management
• Deploy solutions that support
supplier collaboration
CLM
VMSP2P
Source: Gartner “Best Practices for Sequencing Procurement Solution Investments” December 2014
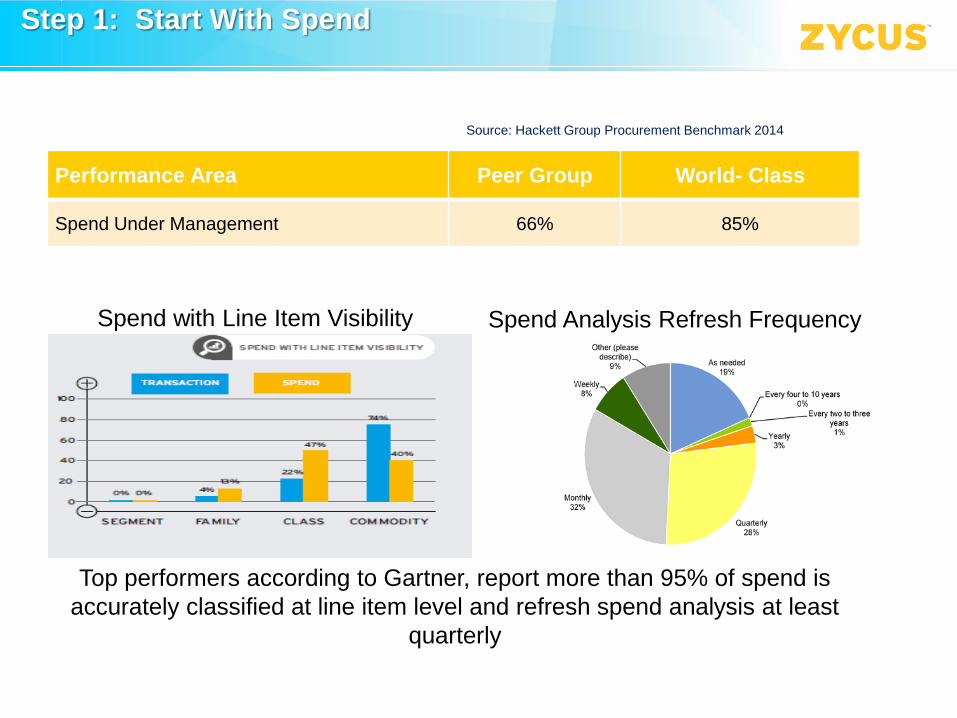
Step 1: Start With Spend
Spend Analysis Refresh Frequency
Performance Area Peer Group World- Class
Spend Under Management 66% 85%
Source: Hackett Group Procurement Benchmark 2014
Spend with Line Item Visibility
Top performers according to Gartner, report more than 95% of spend is
accurately classified at line item level and refresh spend analysis at least
quarterly

Step 2: Drive Sourcing Savings
65%
23%
12%
RFQ/RFP RFI Auction Average Savings 12%
Average Cycle Time
Reduced 17%
Source: Zycus eSourcing Usage Statistics
Deploy eSourcing Tools
Performance Area Peer Group World- Class
Cost Savings as % of Spend 2.97% 5.34%
Source: Hackett Group Procurement Benchmark 2014

Step 3: Sustain Savings
Deploy Compliance Tools
Contract Management
Procure-to-Pay
Supplier Management
Set Performance Targets
Performance AreaPeer
GroupWorld- Class
Cost per PO $18 $4.80
Cost per Invoice $5.54 $2.06
Contract Compliance 43% 88%
Contract Savings Leakage 17% 4%
Suppliers per $1B Spend 5,806 1,959
Revenue from Supplier
Innovation (as % of Total)3.5% 7.4%
Source: Hackett Group
P2P Performance Study
2013
Source: Aberdeen
Group Contract
Benchmarks
Source: Hackett Group
Procurement
Benchmark 2014

Step 4: Track Savings
Source: Aberdeen Group Benchmarks
Set Performance Targets
Deploy Financial Savings Management Process and Tools
2/3 of Best-in-Class track Procurement’s impact
to Financial Statements - well below 50% for
all other
.
Finance Collaboration 4.35
out of 5 for Best-in-Class
• Most Organizations Tracking with
Spreadsheets/Home-grown Tools
• Lack Finance Collaboration and
Approval Workflow
• Standardized Savings
Calculations and Life-Cycle
Tracking a Challenge
Source: Gartner/Rutgers s University Survey, 2013

Case Study: Advanced Micro Devices
Spend Analysis
SourcingSupplier Mgmt.
Create a “Single Version of the
Truth” for Spend Analytics to
identify supplier rationalization and
sourcing opportunities and
standardize payment terms on Net
60
Deployed easy-to-use, intuitive e
Sourcing platform to power all RFX
activities driving 15% higher
adoption over previous toolset,
increasing sourcing throughput
and savings achievement
Standardized Supplier
Performance Measurement with
100% adoption of tool and
methodology for tracking and
reporting supplier KPIs
Transformation Solution:• Drive cost reduction and gross
margin improvement during a
period of intense market
pressures due to slowing demand
in traditional PC Market
• Mitigating supplier & financial risk
by rationalizing the supply base
and preventing supply chain
disruptions which had marred the
Semiconductor Industry over the
past five years
• Increase productivity – despite
head count below industry
benchmarks, mandate to reduce
procurement headcount in the
wake of recession and corporate
restructuring
Savings Per FTE Up 26%
Procurement Labor Reduced 23%
Supply Base Cut 30%
Business Challenges:

Contact Information
Thank You for attending this Web Seminar!
For more information, please contact:
Richard Waugh,
VP Corporate Development
Zycus Inc.