Osservatorio News-Italia: Informazione, social TV e serialità

Informazione
Regolamentata n.
0262-39-2019
Data/Ora Ricezione
16 Luglio 2019
07:37:18
MTA
Societa' : TREVI GROUP
Identificativo
Informazione
Regolamentata
: 120719
Nome utilizzatore : TREVIN02 - Cocco
Tipologia : 1.1
Data/Ora Ricezione : 16 Luglio 2019 07:37:18
Data/Ora Inizio
Diffusione presunta
: 16 Luglio 2019 07:37:19
Oggetto : Trevi Group_PR July 15, 2019
Testo del comunicato
Vedi allegato.

APPROVED THE 2017 AND 2018 STATUTORY AND CONSOLIDATED FINANCIAL STATEMENTS. CONVENED THE SUBSEQUENT SHAREHOLDERS’ MEETING FOR RENEWAL OF CORPORATE BODIES FOUNDATION SECTOR POSITIVE OPERATING MARGINS IN 2018 CONSOLIDATED GROUP LOSSES, RECORDED PRIMELY IN 2017, MAINLY RECONDUCIBLE TO WRITE-DOWNS AS A RESULT OF IMPAIRMENT TEST GROUP SHAREHOLDER’S EQUITY AT DECEMBER 31, 2018 NEGATIVE FOR 148.1 MILLION EUROS, MAINLY RELATED TO WRITE-DOWNS AND ACCOUNTING ADJUSTMENTS FOUNDATION SECTOR ORDER BACKLOG, GROWING AT 497 MILLION EUROS IN 2018, ESPECIALLY THANKS TO THE USA AND EUROPE MARKETS APPROVED THE DISPOSAL OF GROUP COMPANIES OPERATING IN THE OIL&GAS SECTOR Milan, July 15, 2019 – The Board of Directors of Trevi - Finanziaria Industriale S.p.A. (“Trevifin” or the “Company”) – the Trevi Group’s holding company – today approved, through a majority decision, the statutory financial statements and consolidated financial statements for both the financial years 2017 and 2018. The financial statements were prepared and approved on a going concern basis, given that - as better clarified in the Management’ Report - the Board of Directors of Trevifin considers that the current uncertainties may reasonably be overcome through the implementation of the financial restructuring set out in the agreements currently under definition. The results for the two financial years 2017 and 2018 are briefly described herein below. The Board of Directors consequently resolved to call the shareholders’ meeting for the approval of the financial statements and the renewal of the corporate boards (which will cease from their office) for September 23, 2019 in first call and, where required, for September 30, 2019 in second call. With respect to what has been previously announced to the market (see the press release of December 4, 2018) and with a view to the imminent approval of the agreements relating to the capital strengthening and debt restructuring transaction, the Board of Directors also unanimously resolved to confirm the approval of the transaction relating to the sale of Drillmec S.p.A., Petreven S.p.A. and the other companies of the Trevi Group operating in the the oil&gas Sector to the Indian group headed by Megha Engineering & Infrastructures Ltd (“MEIL”), approving the main terms and conditions of the agreements currently under definition with MEIL and granting powers to the CRO to finalize the negotiations and to execute the definitive agreements. The saletransaction is, on the one hand, strictly necessary for implementing the business plan and the expected refocusing of the Trevi Group on the Foundation Sector and, on the other, for the relaunch of

the Oil&Gas division as a result of the activities to be carried out by the MEIL Group. More specifically, the main terms of the sale and purchase agreement regulating the Oil & Gas disposal include:
(i) an enterprise value – on a debt free basis – equal to Euro 140 million, which is subject to certain adjustments upon the occurrence of certain events, including any changes in the working capital of the companies of the Oil & Gas Division against the reference value taken for the purposes of valuing the division;
(ii) the obligation of the Trevi Group to assume the financial indebtedness of the companies discharging the companies from such indebtedness (being a "debt free basis" transaction);
(iii) in line with market practice for similar transactions, the granting by the sellers of certain representations and warranties on the companies and the assets being sold, and a consequent obligation to indemnify, which is also subject to certain financial and time limitations.
It is also provided that the effectiveness of the sale and purchase agreement will be subject to the occurrence of certain conditions precedent, including, among others: (a) the implementation by the sellers of a number of intercompany transactions aimed at transferring to the group all the assets being sold, and (b) the execution and subsequent approval of the Trevi Group debt restructuring agreement pursuant to Article 182-bis of the IBL, which is currently under definition by the Company. On the basis of the information currently available, it may be assumed that the binding legal documentation for the implementation of the disposal transaction, including the related sales and purchase agreement, may be executed within the first week of August, with the closing of the disposal expected by the end of November 2019. Finally, the Board has called a new meeting for July 17, 2019, to be held in Milan, in order to approve the agreements relating to the capital strengthening and debt restructuring transaction (including the aforementioned debt restructuring agreement), to exercise the delegation for capital increase pursuant to Article 2443 of the Italian Civil Code, with has been granted to the Board by the Shareholders’ Meeting on July 30, 2018, to approve all the ancillary and related resolutions, as well as to approve the resolutions deriving from the imminent completion of the examination of the request of the shareholder THSE, pursuant to Article 2367 of the Italian Civil Code.
*** 2017 Group Key Financial Highlights
FY 20171 reported total consolidated revenues of approx. Euro 949.2 million, compared to Euro 1,083 million in 2016, a contraction therefore of approx. Euro 134 million. The Foundation Sector (the Group’s core business) reported a reduction in revenues over 2016 (Euro 756.6 million in 2017, compared to Euro 829.9 million in 2016, -Euro 73.3 million gross of intersegment eliminations), mainly stemming from a volume contraction in the markets in which Trevi Group traditionally operates. The Oil&Gas Sector, due to the ongoing global crisis, reported lower revenues than 2016 (2017 total Sector revenues of Euro 202.1 million, compared to Euro 274.2 million in 2016, -Euro 72.1 million net of intersegment eliminations). This decrease mainly owes to the Drillmec division which was impacted by the failure of the YPFB contract for the supply of three drilling plant in Bolivia to progress, following the cancellation of the contract by the client, in addition to the less significant orders acquired by the division in 2017 compared to 2016. 1 Methodological note: Some of the 2016 financial statement items were amended in the 2017 Annual report. The company and the Group, in accordance with IAS 8 and for maximum transparency, established the extent of the adjustments to the financial statements at December 31, 2016, amending the comparative figures at that date and including a third balance sheet column at January 1, 2016.

The above drop in volumes, together with an altered mix and of the relative margin on orders worked on in the period, mainly in the Foundation Sector, alongside the accruals made to the inventory obsolescence provision in the period and the costs incurred for the financial restructuring, resulted in an EBITDA loss of Euro 81.4 million, down Euro 169.9 million compared to a profit of Euro 88.5 million in 2016 (8.2% on total revenues). EBIT reported a loss of Euro 336.6 million, compared to a loss of Euro 32.3 million in 2016, reducing Euro 304.3 million. This contraction, while also resulting from the issues outlined above, related to the doubtful debt provision and contractual risks provision accruals, in addition to the write-down of development costs capitalised and of property, plant and equipment following impairment tests.
The Group Net Result in 2017 was a loss of Euro 432.8 million, increasing Euro 348.3 million on 2016 which reported a loss of Euro 84.5 million. This result was impacted also by the write-down of deferred tax assets (deriving from tax losses and temporary changes) for approx. Euro 47.2 million following the recoverability assessment at December 31, 2017. Consolidated net capital employed at December 31, 2017 was Euro 618.8 million, compared to a restated amount of Euro 981.3 million at December 31, 2016: the decrease of Euro 362.5 million mainly relates to the impacts from the write-down of working capital and fixed asset items following the specific recoverability analyses carried out, in addition to the results of the impairment tests. At December 31, 2017, the Net Financial Position was a debt position of Euro 619.8 million, compared to a restated amount of Euro 500.1 million at December 31, 2016, increasing Euro 119.7 million. The lower volume of without recourse factoring in 2017 is highlighted (approx. Euro 33 million) compared to the end of 2016 (approx. Euro 105 million), in addition to the benefit to the Net Financial Position in 2016 from the significant advance received on the Mosul order. At December 31, 2017, in continuity with June 30, 2017, the majority of bank payables were reclassified to short-term, as the Group at 31 December 2017 was in violation of the covenants applicable to almost all financing, which therefore became immediately payable. To address the risk of launching actions aimed at obtaining immediate repayment of loans, in the first few months of 2017 the Company began a negotiation process with the lending banks aimed at restructuring its debt exposures. Finally, in 2017 the negotiations successfully continued with the lending banks for the signing of a standstill agreement and in a broader context the agreement of the credit lines proposed within the overall financial restructuring. The standstill agreement was effectively signed in 2018, with the Trevi Group therefore at December 31, 2017 de facto operating within the scope of a standstill agreement.
BUSINESS PERFORMANCE
Foundation Sector The total value of production of the special Foundation Services Sector in 2017 was approx. Euro 557 million (Euro 612 million in 2016, -Euro 55 million). The contraction mainly related to the reduced volumes of activities on markets whose economies were impacted by oil Sector weakness (Nigeria and Venezuela).
Soilmec The Soilmec Division in 2017 reported a revenue contraction of approx. 9% over the previous year. This contraction was mainly due to a significant reduction in Trevi Division investments (-53%) and a significant drop in Middle East and Africa sales (-42%) following the completion in 2016 of the Egyptian army supplies contract, and particularly the considerable weakening of the local Egyptian currency (-80%).

On the other hand, sales volumes significantly increased in the Asia/Pacific area (+40%), mainly due to strong Chinese market growth (+70%), owing principally to the boring product, alongside a significant boost to South-East Asian sales (+50%). Volumes were stable in Europe and the Americas. Division operations, as for the rest of the Group, were impacted by the financial uncertainties concerning the restructuring process. The limited possibility to rely on the credit system and the related management of working capital impacted the margin. Therefore, it may be stated that the poor Division performance was due both to market conditions and the Group’s financial crisis. Oil&Gas Sector In 2017, the Oil&Gas market continued to be subject to cost-cutting programmes, organisational restructuring and corporate restructurings and transactions in order to optimise operating efficiency.
The ongoing crisis significantly impacted the Group companies’ key economic-financial results compared to previous years. Oil&Gas Sector revenues in 2017 amounted to approx. Euro 202.1 million, compared to Euro 274.2 million in 2016 (down Euro 72.1 million on the previous year, -26,3%).
Drillmec
Continued oil price volatility and geopolitical instability in the Middle East prevented the Division from consolidating revenue levels. Further impacts were felt from the cancellation of a major supply contract in Bolivia which stipulated the delivery of three 2000 and 3000 HP Drilling Plant.
Total revenues of approx. Euro 91 million were reported in 2017, compared to Euro 158.5 million in the previous year (-42,6%). Europe and CSI were the main market with nearly 40% of revenues, followed by the Middle East, North Africa and the Far East. The “Spare and Services” segment contributed 36% of revenues (Euro 34 million), followed by the On-shore, Components and Offshore segment.
The drop in revenues, together with a lower margin due to significant competition, led to the organisation significantly downsizing its production capacity. The workforces at both the Houston and Piacenza facilities were significantly cut back.
Petreven
The continually low oil price impacted Division revenues. Revenues were down 4% on the previous year (Euro 117 million) to Euro 112.3 million (approx. -Euro 4.7 million). Argentina was confirmed as the main revenue driver with Euro 65 million (58% of revenues), followed by Venezuela, Chile and Peru.
The Division operated in South America on behalf of the leading Major and National Oil Companies. There were 17 operative plants located in the following countries: 10 in Argentina, 2 in Venezuela, 1 in Chile, 3 in Peru and 1 in Colombia. In addition, in Chile, 1 third party plant was utilised.
Operations saw average plant usage of 65% (69% in 2016) and the drilling of 278 wells.
2018 Group Key Financial Highlights
FY 20182 reported total consolidated revenues of approx. Euro 618,1 million, compared to Euro 772.6 million in 2017 (-Euro 154.5 million). The Foundation Sector (the Group’s core business) saw revenues reduce over 2017 (Euro 616 million in 2018, compared to Euro 757.8 million in 2017, -Euro 141.8 million net of intersegment eliminations), mainly due to reduced operations in the Middle East, in Africa and in
2 Methodological note: the stated data, except where specifically indicated, reflect the reclassification as per IFRS 5 in view
of the expected disposal of Oli&Gas sector operations.
.

South America, where the market was impacted by numerous general economic and socio-political uncertainties which significantly impinged commercial opportunities. Very strong performances however continued on markets such as the United States, with a very significant backlog and the acquisition of the first major orders in Europe and in Australia. 2018 EBITDA and EBIT were respectively approx. Euro 50.1 million and Euro 14.2 million. The 2017 figures were in particular impacted by significant inventory and receivable write-downs, in addition to the impacts from the impairment tests. The above figures were reclassified as per IFRS 5 and therefore mainly concern the Foundation Sector (excluding therefore the Oil&Gas Sector fully represented in the discontinued operations). The Group Net Result for 2018 was a loss of Euro 143.4 million, substantially improving by Euro 396.2 million on 2017, which reported a loss of Euro 539.6 million. The 2017 figures were impacted by the write-down of deferred tax assets, subject to a recoverability test. The Restated Consolidated Net Capital Employed was Euro 545.4 million, compared to Euro 618.8 million at December 31, 2017: the decrease of Euro 73.5 million is mainly due to the planned disposal of the Oil & Gas Sector which led to the classification of the assets and liabilities of the Sector in a single line as assets to be discontinued, not included in the aforementioned analysis. The Restated Net Financial Position at December 31, 2018 was a debt position of Euro 692.6 million, increasing Euro 72.8 million on December 31, 2017 (Euro 619.9 million); the increased debt position is mainly due to the reduction in cash and cash equivalents, together with lesser without recourse factoring at December 31, 2018 (approx. Euro 1.2 million) compared to the end of 2017 (approx. Euro 33 million). At December 31, 2018, in continuity with December 31, 2017, the majority of bank debt was reclassified to short-term as the Group was in violation of the covenants applicable to almost all financing, which therefore became immediately payable. To address the risk of launching actions aimed at obtaining immediate repayment of loans, the Company has completed its negotiations with the lending banks for the signing of a restructuring agreement to enable the Group to focus its efforts on developing its business plan and managing the Oil&Gas Sector disposal process. The Consolidated Backlog including the Oil&Gas Sector at December 31, 2018 was Euro 713.5 million, increasing on the previous year by Euro 534.8 million (+Euro 178.7 million, +33%). The Foundation Sector backlog was Euro 497.1 million (Euro 383 million at December 31, 2017); the increase of Euro 114.1 million over December 2017 was due to the significant amount of orders acquired in 2018, particularly in the United States and in the Middle East, where we highlight, among others, the acquisition of phase 2 of the securitisation of the Mosul dam for approx. Euro 90 million, and in Europe, where major orders were acquired in France and Germany. Solely for disclosure purposes, the orders acquired in 2018 at consolidated level, including the Oil&Gas Sector, amounted Euro 943 million, increasing on the previous year’s figure of Euro 651.4 million (+Euro 291.6 million, +45%). Foundation Sector orders were acquired in 2018 amounting to approx. Euro 696.2 million (Euro 462 million in 2017, +Euro 234.2 million, +51%).
BUSINESS PERFORMANCE
Foundation Sector Special Foundation Services Sector production in 2018 totalled approx. Euro 418.6 million (Euro 557 million in 2017, reducing Euro 138.4 million). The contraction mainly owes to reduced operations in the Middle East, related to lower volumes on the Mosul order, despite the acquisition of phase two of the order, which included in 2017 significant volumes related to the mobilisation and construction of the residential area and of the office buildings. Generalised reductions were reported also in Dubai due to

the conclusion of the Expo 2020 projects and the spending and investment cuts in Saudi Arabia, which impacted the Trevi Group managed projects in the country. Volume reductions were reported also in Africa with the conclusion of the order in Egypt at Port Said and in South America, where the ongoing crises in operating countries impinged on commercial opportunities.
Developed nation market opportunities however remained very strong, with a highly significant backlog in the United States and the initial major orders acquired in Europe and in Australia particularly: the NorthEast Boundary Tunnel in Washington, the Fenway Center Building 1 & 2, the Children’s Hospital, the MBTA Jet Grouting and the Wood River Lower Cutoff Wall (Phase 2) in Boston for the United States and the executive design for the usage reconversion of the Molo Pagliari in La Spezia (Italy). Soilmec
The Soilmec Division in 2018 reported slightly lower revenues (-5,7%) compared to the previous year, mainly due to the drop in Water division sales (-80%) and a further contraction in Trevi division equipment investment.
Volumes across all geographic areas were mostly stable, despite again in 2018 the lack of leasing finance and financial support for suppliers.
The sale of large diameter high-tonnage and boring machinery however increased significantly. The success of this latter in Far East, Europe and North Africa was particularly significant.
Working capital management again in 2018, and in particular the management of suppliers, was impacted by the financial and liquidity uncertainties related to the Group situation. Soilmec handles this situation through specific rescheduling plans for the financial positions with the main suppliers, also in view of the expected finalisation of the restructuring process.
Soilmec was highly engaged in 2018 while however consolidating very strong positions on key future markets, such as Far East and North America.
Oil&Gas Sector
Total Sector revenues in 2018 amounted to Euro 181 million, compared to Euro 202.1 million in 2017, decreasing therefore Euro 21,1million (-11,6%).
In 2018, the average price of Brent was USD 70 per barrel, substantially increasing on USD 50 in 2017. Oil prices were however impacted by continued extreme volatility in the year. It should be recalled that in the final part of the year the price fell below USD 60 per barrel, losing over 30% of its value over the course of one month.
Sector investment however has gradually begun to pick up, with a significant focus on environmentally sustainable sources and technologies.
2018 was again a particularly complex year for the company, beginning with the decision to dispose of Oil&Gas Sector operations, which led during the year to the beginning of M&A processes and Due Diligence by possible investors.
Drillmec
The price of Brent was again volatile in 2018 amid ongoing significant market competition which, together with the Group’s financial situation, did not allow the Division to consolidate revenues at forecast levels.
In 2018, total revenues of approx. Euro 98 million were reported, up on Euro 91 million in the previous year (+7%). The main market was Europe and CSI with over 45% of revenues, followed by the Americas and the Middle East. The “Onshore” segment contributed over 50% of revenues (Euro 51 million), followed by the Spare and Services and Components segment.

The Group’s main commitment was to gradually reduce the working capital employed by finished products in order to generate the cash flow necessary to manage the Group’s extended financial stress situation.
Despite this, the division during the year brought forward the completion of engineering on 2 new products (Striker 800 and Stinger) in line with the Division’s technological objectives.
In addition, as a result of accumulated HOD (head of drilling) technology on the two real Offshore cases, it was possible to implement major design improvements to the entire system, making it more efficient and more reliable and ready for market distribution.
Petreven
Extreme oil price volatility impacted Division revenues. Revenues reduced 26% on the previous year (Euro 112.3 million) to Euro 83 million (-Euro 29.3 million). Argentina was confirmed as the main revenue driver with Euro 58 million (65% of revenues), followed by Peru, Chile and Venezuela.
The Division operates in South America on behalf of the leading Major and National Oil Companies. There were 17 operative plants located in the following countries: 10 in Argentina, 2 in Venezuela, 1 in Chile and 4 in Peru. In addition, in Argentina 1 third party drilling plant transferred from Chile in the final part of the year was used.
Operations saw average plant usage of 60% (65% in 2017) and the drilling of 304 wells.
***
The Board finally remembered the figure of Mr. Marco Andreasi, until a few months ago CFO of the Group, of which the Board appreciated the personal and professional contribution made.
*** About Trevi: Trevi Group is a worldwide leader in the field of soil engineering (special foundations, tunnel excavation, soil consolidation and the building and marketing of special rigs and equipment relevant to this engineering Sector); the Group is also active in the drilling Sector (oil, gas and water) both in the production of plant and the supply of services, and it also builds automated underground car parks. The Group was established in Cesena in 1957 and today has more than 30 branches and is present in over 80 countries. Its success is due to the vertical integration of the main divisions making up the Group: Trevi, the division that supplies special services in the field of soil engineering, Petreven, the oil drilling division of the Group, Soilmec, the division that produces and develops plant and machinery for soil engineering and Drillmec the division that produces and develops drilling rigs (oil, gas and water). The parent company has been listed on the Milan stock exchange since July 1999. About MEIL (Megha Engineering and Infrastructures Ltd.): MEIL has proven experience in mega projects, has an overseas presence in prestigious refinery projects in countries like Kuwait, Jordan, Bangladesh and Singapore. MEIL is known for its timely execution of mega projects with highest quality standards, particularly related to creating infrastructure for establishing raw processing units, compressor plants; gas-based captive power plants etc. MEIL Hydro Carbons division's Engineering Technical Team is using sophisticated modern technology for fabrications, installations, and hook up operations.

For further information:
Investor Relations: Francesca Cocco - e-mail: [email protected]
Group Communications Office: Franco Cicognani - e-mail: [email protected] - tel: +39/0547 319503
Press Office: Community - Strategic communication advisers - T. +39 02 89404231
Auro Palomba - [email protected]
Roberto Patriarca - T. +39 335 65 09568 - [email protected]

2017 Group Key Financial Highlights
The above income statement, commented upon in the notes, is a reclassified summary of the Consolidated Income Statement.
(3) The value of production includes the following accounts: revenues from sales and services, increase in internal work capitalised, other operating revenues and changes in inventories of finished goods and work in progress. (4) “Consumption of raw materials and external services” includes the following accounts: raw materials and consumables, change in inventory of raw materials, consumables and goods for re-sale and other operating costs not including miscellaneous operating charges (note 28). (5) For the balance of “Miscellaneous operating charges”, reference should be made to note 28 of the consolidated income statement. (6) Value added is the sum of the value of production, consumption of raw materials and external services and miscellaneous operating charges. (7) EBITDA is an indicator not covered by IFRS, adopted by the Trevi Group from the consolidated financial statements at December 31, 2005. EBITDA is a measure utilized by Trevi’s management to monitor and assess the Group performance. Management consider that EBITDA is an key parameter in measuring the performance of the Group as it is not impacted by volatility due to the effects of differing criteria in determining taxable income, the amount and characteristics of the capital utilised, as well as the relative depreciation policies. EBITDA is currently (after further study of the development of alternative performance measures) defined by Trevi as the Profit/(loss) for the period before depreciation and amortisation, provisions and write-downs, financial charges and income and income taxes. (8) EBIT is an indicator not covered by IFRS, adopted by the Trevi Group from the consolidated financial statements at December 31, 2005. EBIT is a measure utilized by Trevi’s management to monitor and assess the Group performance. Management consider that EBIT is a key parameter in measuring the performance of the Group as it is not impacted by volatility due to the effects of differing criteria in determining taxable income, the amount and characteristics of the capital utilised, as well as the relative depreciation policies. EBIT is defined by Trevi as the Profit/(loss) for the period before financial charges and income and income taxes. (9) “Financial income/(charges)” is the sum of the following accounts: financial income (note 30) and (financial charges) (note 31).
TREVI GROUP
Consolidated Income Statement
(IN EURO THOUSANDS)
2017 2016
restated Changes
TOTAL REVENUES 949,197 1,083,044 (133,847)
Changes in inventories of finished goods and work in progress (75,724) 60,919 (136,643)
Increase in internal work capitalised 17,129 7,922 9,207
VALUE OF PRODUCTION (3) 890,602 1,151,885 (261,283)
Consumption of raw materials and external services (4) 689,899 800,631 (110,732)
Miscellaneous operating charges (5) 30,921 19,248 11,673
VALUE ADDED (6) 169,782 332,006 (162,224)
Personnel costs 251,224 243,555 7,668
EBITDA (7) (81,442) 88,451 (169,892)
Depreciation & amortisation 57,525 66,069 (8,543)
Provisions & write-downs 197,612 54,660 142,952
EBIT (8) (336,579) (32,278) (304,301)
Financial income/(charges) (9) (29,406) (29,280) (125)
Exchange gains/(losses) (18,103) (13,159) (4,944)
Impairments on financial assets (3,055) (104) (2,951)
LOSS BEFORE TAXES (387,142) (74,821) (312,322)
Income taxes 52,195 7,564 44,631
Minority interest result (6,498) 2,098 (8,596)
GROUP NET LOSS (432,839) (84,483) (348,356)

TREVI GROUP
BREAKDOWN BY REGION AND SECTOR (in Euro thousands) Region 2017 % 2016 % Changes %
Italy 59,528 6.3% 67,315 6.2% (7,787) -11.6%
Europe
(excluding Italy) 85,567 9.0% 83,069 7.7% 2,497 3.0%
U.S.A and Canada 108,840 11.5% 115,143 10.6% (6,303) -5.5%
Latin America 181,866 19.2% 216,797 20.0% (34,931) -16.1%
Africa 86,064 9.1% 179,963 16.6% (93,899) -52.2%
Middle East
and Asia 345,933 36.4% 327,345 30.2% 18,587 5.7%
Far East and
Rest of the world 81,400 8.6% 93,412 8.6% (12,012) -12.9%
TOTAL REVENUES 949,197 100% 1,083,044 100% (133,847) -12.4%
The total Revenue performance by sector was as follows:
2017 % 2016
restated % Changes Cge. %
Oil, gas and water well drilling machinery 90,901 10% 158,468 15% (67,585) -42.6%
Drilling operations 112,287 12% 117,016 11% (4,730) -4.0%
Inter-segment eliminations and adjustments (1,095) (1,277) 182
Oil &Gas Sector Sub-total 202,092 21% 274,208 25% (72,133) -26.3%
Special foundation works 556,979 59% 612,045 57% (55,065) -9.0%
Special foundation machinery production 217,233 23% 239,102 22% (21,869) -9.1%
Inter-segment eliminations and adjustments (17,609) (21,218) 3,429
Foundations Sector Sub-total (Core Business) 756,604 80% 829,929 77% (73,506) -8.9%
Parent company 28,261 26,581 1,679 6.3%
Inter-segment eliminations and with parent company (37,760) (47,674) 10,113
TREVI GROUP 949,197 100% 1,083,044 100% (133,847) -12.4%

TREVI GROUP
Reclassified Consolidated Statement of Financial Position (in Euro thousands)
31/12/2017 31/12/2016
restated Changes %
A) Fixed Assets
- Property, plant and equipment (10) 339,535 420,572 (81,037)
- Intangible assets 5,127 65,226 (60,099)
- Financial assets (11) 4,169 6,927 (2,758)
348,831 492,725 (143,894) -29.2%
B) Net working capital
- Inventories 328,090 502,889 (174,798)
- Trade receivables (12) 304,261 361,659 (57,398)
- Trade payables (-) (13) (235,219) (260,586) 25,367
- Advances (-) (14) (91,594) (141,465) 49,871
- Other assets/(liabilities) (15) (18,943) 45,816 (64,759)
286,596 508,312 (221,717) -43.6%
C) Capital employed less operating liabilities (A+B) 635,427 1,001,037 (365,610) -36.5%
D) Post-employment benefits (-) (16,668) (19,729) 3,061 -15.5%
E) NET CAPITAL EMPLOYED (C+D) 618,759 981,308 (362,549) -36.9%
Funded by:
F) Group shareholders' equity (1,466) 472,301 (473,767) -100.3%
G) Minority interest shareholders' equity 374 8,893 (8,519)
H) Net Financial Debt (16) 619,850 500,113 119,737 23.9%
I) TOTAL FUNDING SOURCES (F+G+H) 618,758 981,308 (362,549) -36.9%
(10) The balance of property, plant and equipment takes account also of investment property (note 3). (11) The balance of financial assets include investments (note 4) and other long-term financial receivables (note 7). (12) The balance of trade receivables includes: receivables from customers, both long-term (note 9) and short-term (note 11), short-term receivables from associates (note 11). (13) The balance of trade payables includes: short-term payables to customers (note 20), short-term payables to associates (note 20). (14) The balance of advances includes both the long term (note 20) and short-term (note 20) portions. (15) The balance of other assets/(liabilities) includes: other receivables/(payables), prepayments and accrued income/(accrued liabilities and deferred income), tax receivables/(payables) and both short-term and long-term risk provisions (notes 5-9-11-11.a-16-19-20-21-25). (16) The Net Financial Debt utilised as a financial debt indicator is the sum of the following positive and negative Statement of Financial Position items:
- positive short and long-term positive components: cash and cash equivalents (cash, cheques and banks), working capital liquid securities and financial receivables
- negative short and long-term components: bank payables, payables to other lenders (leasing and factoring companies) and payables to shareholders for loans. For further details, reference should be made to the table in the notes.

A reconciliation follows between the data reported in the reclassified balance sheet that does not take
into account the application of IAS 11 against the consolidated financial statements in which this effect
is reflected.
(in Euro thousands)
Net working capital 31/12/2016
restated IAS 11
31/12/2016
restated 31/12/2017 IAS 11 31/12/2017
- Inventories 502,889 (148,169) 354,720 328,090 (95,432) 232,659
- Trade receivables 361,659 76,409 438,068 304,261 22,159 326,420
- Trade payables (-) (260,586) 0 (260,586) (235,219) 0 (235,219)
- Advances (-) (141,465) 74,695 (66,770) (91,594) 47,661 (43,933)
- Other assets/(liabilities) 45,816 (2,936) 42,880 (18,942) 25,612 6,669
Total 508,312 () 508,312 286,596 (1) 286,595
TREVI GROUP
Consolidated Net Financial Position (in Euro thousands)
31/12/2017 31/12/2016
restated Changes
Bank payables (short-term) (645,292) (610,324) (34,968)
Other lenders (short-term) (40,244) (40,035) (210)
Short-term derivative financial instruments (173) (447) 274
Current financial assets 0 0 0
Short-term cash and cash equivalents 146,090 301,133 (155,043)
Total short-term (539,619) (349,672) (189,947)
Bank payables (medium/long-term) (11,206) (62,798) 51,591
Other lenders (medium/long-term) (69,025) (86,518) 17,493
Long-term derivative financial instruments 0 (1,126) 1,126
Total medium/long-term (80,231) (150,441) 70,210
Net financial debt (619,850) (500,113) (119,737)

2018 Group Key Financial Highlights
(17) The value of production includes the following accounts: revenues from sales and services, increase in internal work capitalised, other operating revenues and changes in inventories of finished goods and work in progress. (18) “Consumption of raw materials and external services” includes the following accounts: raw materials and consumables, change in inventory of raw materials, consumables and goods for re-sale and other operating costs not including miscellaneous operating charges (note 28). (19) For the balance of “Miscellaneous operating charges”, reference should be made to note 28 of the consolidated income statement. (20) Value added is the sum of the value of production, consumption of raw materials and external services and miscellaneous operating charges. (21) EBITDA is an indicator not covered by IFRS, adopted by the Trevi Group from the consolidated financial statements at December 31, 2005. EBITDA is a measure utilized by Trevi’s management to monitor and assess the Group performance. Management consider that EBITDA is an key parameter in measuring the performance of the Group as it is not impacted by volatility due to the effects of differing criteria in determining taxable income, the amount and characteristics of the capital utilised, as well as the relative depreciation policies. EBITDA is currently (after further study of the development of alternative performance measures) defined by Trevi as the Profit/(loss) for the period before depreciation and amortisation, provisions and write-downs, financial charges and income and income taxes. (22) EBIT is an indicator not covered by IFRS, adopted by the Trevi Group from the consolidated financial statements at December 31, 2005. EBIT is a measure utilized by Trevi’s management to monitor and assess the Group performance. Management consider that EBIT is a key parameter in measuring the performance of the Group as it is not impacted by volatility due to the effects of differing criteria in determining taxable income, the amount and characteristics of the capital utilised, as well as the relative depreciation policies. EBIT is defined by Trevi as the Profit/(loss) for the period before financial charges and income and income taxes. (23) “Financial income/(charges)” is the sum of the following accounts: financial income (note 30) and (financial charges) (note 31).
TREVI GROUP
Consolidated Income Statement
(IN EURO THOUSANDS)
2018 2017 Changes
TOTAL REVENUES 618,080 772,544 (154,464)
Changes in inventories of finished goods and work in progress 11,380 (22,203) 33,583
Increase in internal work capitalised 12,580 14,134 (1,554)
VALUE OF PRODUCTION (17) 642,040 764,475 (122,435)
Consumption of raw materials and external services (18) 417,408 531,427 (114,020)
Miscellaneous operating charges (19) 9,635 30,921 (21,286)
VALUE ADDED (20) 214,998 202,127 12,871
Personnel costs 164,846 184,813 (19,967)
EBITDA (21) 50,151 17,314 32,838
Depreciation & amortisation 31,501 38,047 (6,546)
Provisions & write-downs 4,440 112,050 (107,610)
EBIT (22) 14,210 (132,784) 146,993
Financial income/(charges) (23) (15,664) (14,436) (1,228)
Exchange gains/(losses) (16,002) (3,332) (12,669)
Impairments on financial assets (123) (3,056) 2,932
Gains/(losses) from discontinued operations (119,510) (363,350) 243,800
LOSS BEFORE TAXES (137,128) (516,957) (379,828)
Income taxes 7,036 29,118 (22,018)
Minority interest result (737) (6,498) 5,761
GROUP NET LOSS (143,428) (539,576) 396,148

TREVI GROUP
BREAKDOWN BY REGION AND SECTOR (in Euro thousands)
Region 2018 % 2017 % Changes %
Italy 45,346 7.3% 74,728 9.7% (29,382) -39.3%
Europe (excluding Italy) 73,751 11.9% 45,210 5.9% 28,541 63.1%
U.S.A and Canada 113,847 18.4% 110,294 14.3% 3,552 3.2%
Latin America 36,953 61% 67,838 8.8% (30,884) -45.5%
Africa 51,302 8.3% 73,135 9.5% (21,833) -29.9%
Middle East and Asia 203,469 32.9% 326,696 42.3% (123,227) -37.7%
Far East and Rest of the World 93,412 15.1% 74,645 9.7% 18,768 25.1%
TOTAL REVENUES 618,081 100% 772,545 100% (154,464) -20.0%
The total Revenue performance by sector was as follows: 31/12/2018 % 31/12/2017 % Changes Cge. % Special foundation works 418,574 68% 556,979 72% (138,405) -24.8% Special foundation machinery production 204,748 33% 217,233 28% (12,485) -5.7% Inter-segment eliminations and adjustments (7,363) (16,399) 9,036 Foundations Sector Sub-total (Core Business) 615,960 100% 757,813 98% (141,854) -18.7% Parent company 27,481 28,261 (780) -2.8% Inter-segment eliminations and with parent company (25,359) (13,529) (11,830) TREVI GROUP 618,081 100% 772,545 100% (154,464) -20.0%

TREVI GROUP
Consolidated Statement of Financial Position (in Euro thousands)
31/12/2018 31/12/2017 Changes
A) Fixed Assets
- Property, plant and equipment (24) 224,972 339,535 (114,563)
- Intangible assets 6,397 5,127 1,271
- Financial assets (25) 4,611 4,169 442
235,980 348,831 (112,851)
B) Net working capital
- Inventories 187,794 328,090 (140,296)
- Trade receivables (26) 274,952 304,261 (29,309)
- Trade payables (-) (27) (193,803) (235,219) 41,416
- Advances (-) (28) (29,928) (91,594) 61,666
- Other assets/(liabilities) (29) (26,697) (18,943) (7,755)
212,317 286,596 (74,278)
C) Assets and liabilities held-for-sale 111,000 - 111,000
D) Capital employed less operating liabilities (A+B+C) 559,298 635,427 (76,129)
E) Post-employment benefits (-) (13,994) (16,668) 2,674
F) NET CAPITAL EMPLOYED (D+E) 545,304 618,759 (73,455)
Funded by:
G) Group shareholders' equity (148,075) (1,466) (146,609)
H) Minority interest shareholders' equity 740 374 366
I) Net Financial Debt (30) 692,640 619,850 72,789
L) TOTAL SOURCES OF FINANCING (G+H+I) 545,304 618,759 (73,455)
(24) The balance of property, plant and equipment takes account also of investment property (note 3). (25) The balance of financial assets include investments (note 4) and other long-term financial receivables (note 7). (26) The balance of trade receivables includes: receivables from customers, both non-current (note 9) and current (note 11), current receivables from associates (note 11). (27) The balance of trade payables includes: short-term payables to customers (note 20), short-term payables to associates (note 20). (28) The balance of advances includes both the long term (note 20) and short-term (note 20) portions. (29) The balance of other assets/(liabilities) includes: other receivables/(payables), prepayments and accrued income/(accrued liabilities and deferred income), tax receivables/(payables) and both short-term and long-term risk provisions (notes 5-9-11-11.a-16-19-20-21-25). (30) The Net Financial Debt utilised as a financial debt indicator is the sum of the following positive and negative Statement of Financial Position items:
- positive short and long-term positive components: cash and cash equivalents (cash, cheques and banks), working capital liquid securities and financial receivables
- negative short and long-term components: bank payables, payables to other lenders (leasing and factoring companies) and payables to shareholders for loans. For further details, reference should be made to the table in the notes.
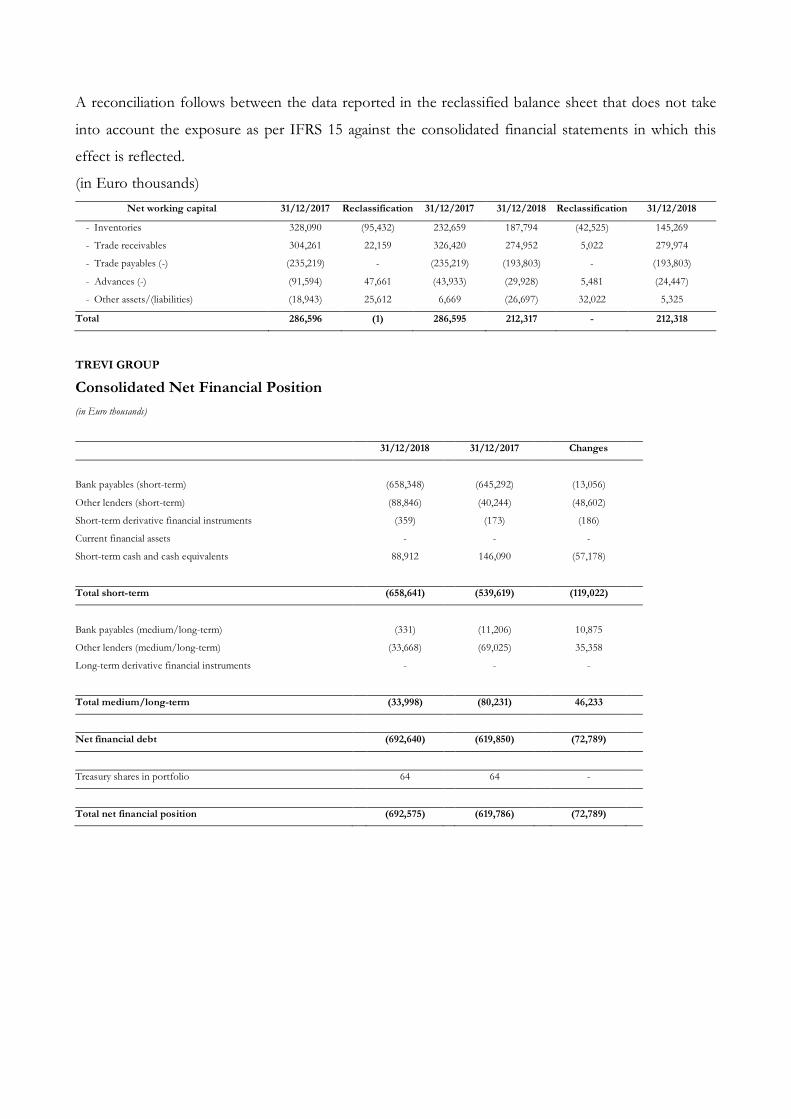
A reconciliation follows between the data reported in the reclassified balance sheet that does not take
into account the exposure as per IFRS 15 against the consolidated financial statements in which this
effect is reflected.
(in Euro thousands) Net working capital 31/12/2017 Reclassification 31/12/2017 31/12/2018 Reclassification 31/12/2018
- Inventories 328,090 (95,432) 232,659 187,794 (42,525) 145,269
- Trade receivables 304,261 22,159 326,420 274,952 5,022 279,974
- Trade payables (-) (235,219) - (235,219) (193,803) - (193,803)
- Advances (-) (91,594) 47,661 (43,933) (29,928) 5,481 (24,447)
- Other assets/(liabilities) (18,943) 25,612 6,669 (26,697) 32,022 5,325
Total 286,596 (1) 286,595 212,317 - 212,318
TREVI GROUP
Consolidated Net Financial Position (in Euro thousands)
31/12/2018 31/12/2017 Changes
Bank payables (short-term) (658,348) (645,292) (13,056)
Other lenders (short-term) (88,846) (40,244) (48,602)
Short-term derivative financial instruments (359) (173) (186)
Current financial assets - - -
Short-term cash and cash equivalents 88,912 146,090 (57,178)
Total short-term (658,641) (539,619) (119,022)
Bank payables (medium/long-term) (331) (11,206) 10,875
Other lenders (medium/long-term) (33,668) (69,025) 35,358
Long-term derivative financial instruments - - -
Total medium/long-term (33,998) (80,231) 46,233
Net financial debt (692,640) (619,850) (72,789)
Treasury shares in portfolio 64 64 -
Total net financial position (692,575) (619,786) (72,789)

Fine Comunicato n.0262-39 Numero di Pagine: 18


![PO specification 0262-MI20-80PO-9120-4-0[1]](https://static.fdocuments.in/doc/165x107/54780b8d5806b501198b46f6/po-specification-0262-mi20-80po-9120-4-01.jpg)