Inflation Report - Central Bank of Armenia 2-15eng.pdf · Inflation Report Monetary Policy Program,...
36
THE CENTRAL BANK OF THE REPUBLIC OF ARMENIA Approved under Board of the Central Bank Resolution No. 127A; Dated 21.05.2015 Inflation Report Monetary Policy Program, Q2, 2015 Status Report on Implementation of the Monetary Policy Program Q1, 2015
Transcript of Inflation Report - Central Bank of Armenia 2-15eng.pdf · Inflation Report Monetary Policy Program,...

T HE C ENT RAL B AN K
O F T HE
REPU BL IC O F ARM EN IA
Approved under Board of the Central Bank
Resolution No. 127A;
Dated 21.05.2015
Inflation Report
Monetary Policy Program, Q2, 2015
Status Report on Implementation
of the Monetary Policy Program
Q1, 2015

2
T ab le o f Con ten ts
1. Executive Summary ........................................................................... 4
2. Forecast, forecast changes, risks ..................................................... 7
2.1. External environment .................................................................. 7
2.2. Aggregate supply and Aggregate demand ................................ 9
2.3. Inflation forecasts and monetary policy directions in 3-year forecast horizon ............................................................... 15
3. Actual Developments in Q1 2015 ................................................... 18
3.1. Inflation ......................................................................................... 18
3.1.1. Actual inflation and fulfilment of the inflation target ......... 18
3.1.2. Import prices and producer prices ...................................... 20
3.1.3. Inflation and interest rate expectations ............................... 21
3.2. Aggregate supply and Aggregate demand ................................. 22
3.2.1. Aggregate supply .................................................................... 22
3.2.2. Aggregate demand ................................................................. 23
3.2.3. Labor market .......................................................................... 24
3.2.4. Fiscal policy ............................................................................. 25
3.3. Money and financial market developments ............................ 26
3.3.1. Financial market, money and credit .................................... 26
3.3.2. Exchange rate ......................................................................... 29
3.4. Balance of payments ................................................................... 31
3.4.1. Current account ...................................................................... 31
3.4.2. Capital and financial account ............................................... 32
3.5. External environment .................................................................. 33
4. Conclusion ......................................................................................... 35

3
Since January 2006, the Central Bank of Armenia has
moved to a fully-fledged inflation targeting strategy, which
highlights the importance of communicating of the Bank to
the general public by publishing, inter alia, quarterly
inflation reports. First section of the inflation report
includes next quarter’s monetary policy program that
provides new forecasts of inflation and other
macroeconomic indicators and main directions of the
monetary policy in the forecast horizon. Second section
includes status report on implementation of the monetary
policy program of the previous quarter, which covers
actual economic and monetary developments.
Publishing of inflation forecast and assumptions
underlying it makes the monetary policy of the Bank more
transparent, understandable and predictable, which
considerably increases the public confidence in the Bank.
The Bank believes that a clear and trusted monetary policy
positively affects the anchoring of inflation expectations
and maintaining financial stability in terms of cost
reduction.
Starting from the second quarter of 2012, the Bank has
been publishing forecasts of non-conditional inflation in a
3-year time horizon, in implementation of the inflation
targeting strategy, whereby the monetary policy is steered
to minimize any deviations of potential inflation from a 4
% target. Projections in this report are based on the factual
information available by May 12, 2015, i.e. the day of
setting of the refinancing rate, the results of a survey
conducted by the Bank and the judgment made pursuant
to the information on future macroeconomic
developments.
All inflation reports which have been published to date
are available on the Bank’s website which also contains
monetary policy-related publications.

4
1 . E X E C U T I V E S U M M A R Y
According to the Central Bank forecasts, in the course of
2015 the 12-month inflation rate will be in the upper bound of
the confidence band of 4%+1.5 pp; starting from 2016, it will
stabilize around the target. Economic growth for 2015 is
forecast to be higher relative to the previous projection, which is
determined by positive developments in economic activity in the
first quarter. In 2016, economic growth rates will remain the
same but will speed up later, gradually approaching the long-
term equilibrium.
In the 1st quarter of 2015, the domestic demand grew
somewhat relative to the projection attributable to lesser
declined private consumption. However, investment activity has
been consistent with an expected low level mainly due to
weaker construction sector activity and slower growth rate in
credit to enterprises. It is estimated that in the 1st quarter of
2015, compared to the same reference period last year, private
consumption spending will decrease by 1.3% and private
investment, by 7.4%. Lagged effect from implemented
expansionary fiscal and monetary policies and expansionary
impact of the fiscal policy implemented in 1st quarter of 2015
somehow offset the negative impact of these factors on the
aggregate demand. Some growth in economic activity in terms of
supply this quarter was due to higher-than-expected growth in
agricultural output and lesser decline in construction. As a
result, the 1st quarter economic growth is estimated in the range
of 2.1%-2.5%.
In 2015, both private consumption and private investment
will reduce by 2.5% and 8.0%, respectively, according to the
Central Bank forecasts. The fiscal impulse [calculated in relation
to the previous year] is estimated to be 2.0-2.5 expansionary
during the year. Given that the information on the 1st quarter
2015 foreign trade indicators is not complete, forecasts of real
growth of export and import of goods and services for 2015
remained unrevised. This means that the real growth of export
of goods and services is expected within 7.0%-9.0% while the
decline in import of goods and services in real terms in the
range of 4.0%-6.0%. Moreover, about 25% net reduction in
remittances of individuals in dollar terms is anticipated. This is,
however, some improvement in relation to the former forecast,
as the Russian ruble started appreciating at higher rates than
expected.
As a result, the 2015 economic growth has been revised
upside relative to the former forecast to be in the range of
1.6%-2.6%, which will be driven by further maintaining financial
stability, loosening monetary conditions in the 1st quarter, more
stimulating fiscal policy implementation and positive
developments in agriculture.
In the forecast horizon, the 2016 economic growth rates will
persist at the same level. Then the economic growth will speed
up, owing to a bunch of programs the Government plans to carry
out in the tradable sector and reflecting continued improvement
in external economic environment, and approach its long-term
The Central Bank predicts that in the course of 2015 the 12-month inflation rate will be in the
upper bound of the confidence band of 4%+1.5 pp; starting 2016, it will be going to stabilize
around the target.
Economic growth for 2015 is forecast to be higher in comparison with the previous projection, which
is determined by positive developments in economic activity in the first quarter. In 2016, economic growth rates will persist at the same
level but then will speed up, gradually approaching the long-term equilibrium.
In the 1st quarter of 2015, economic growth will be in the range of 2.1%-2.5%.
The economic growth for 2015 has been revised upside relative to the former forecast to be in the
range of 1.6%-2.6%.

5
equilibrium. In view of long-term economic growth equilibriums
declining1 amid growing uncertainties about further economic
development in Armenia’s main trade partners and slowing
foreign capital investment as well as still sluggish domestic
economic activity, the Armenian long-term economic growth
equilibrium has been revised downside, ranging 4%-5%.
Thus, in the forecast horizon, with stabilizing private demand
and mostly a neutral impact of the fiscal policy, the impact of
the aggregate demand on domestic prices will be neutral.
Economic activity in Armenia’s main trade partners further
demonstrated slow-growth patterns over the 1st quarter of 2015,
in which case the external demand remains at a low level.
International commodities and food product markets continue
observing deflationary developments, mainly driven by
appreciating U.S. dollar as well as expectations of high crops.
In the forecast horizon, amid gradually accelerating global
economy and rebounding growth in Armenia’s main trade
partners, a steady price rise in international commodities and
food products markets as well as relative stabilization of
exchange rates and expectations of further appreciation will
transmit positive effects onto the Armenian economy. Under
these conditions, however, significant inflationary pressures
from the external sector are not likely.
In the 1st quarter of 2015, the 12-month inflation rate
behaved cumulatively, as was expected. As a result, at the end
of March the 12-month inflation rate was 5.8%, staying closer to
the upper bound of the confidence band.
Despite high 12-month inflation rate, decisive actions of the
Central Bank taken on in late 2014 helped to get inflationary
expectations anchored as soon as the 1st quarter of 2015,
which in turn contributed to the elimination of tension in the
domestic financial and commodity markets. This prompted the
Central Bank to ease monetary conditions notably during the 1st
quarter of 2015 by gradually lowering the Lombard Repo Facility
Rate from 20% to 12%. However, in order to maintain Armenia’s
monetary position in a long-term perspective amid investment
risks and growing interest rate trends in developing countries,
the Central Bank raised the Refinancing Rate to 10.5% in the 1st
quarter of 2015. These actions helped the Lombard Repo
Facility Rate to again uphold an accepted 1.5 percentage point
spread from the Refinancing Rate and pushed short-term market
rates down. A zero or weak mechanism of reserve requirement
for long-term funds attracted by banks became effective and
some other macro-prudential measures were taken on in the 1st
quarter (see details in section “3.1.1 Actual inflation and
fulfillment of the inflation target”).
In conclusion, the 1st quarter of 2015 saw generally an
easing of monetary conditions.
In consideration of possible rise in electricity price in the
upcoming period, the prediction is that the 12-month inflation
rate would remain in the upper bound of the confidence band
but would then reduce gradually fuelled by a greater seasonal
drop in food prices owing to positive developments in
agriculture as well as expected weak demand in both external
and domestic sectors.
1 See details in section 2.1 “External environment”.
At the end of March, the 12-month inflation rate was 5.8%.
In the 1st quarter of 2015, the Central Bank loosened monetary conditions notably by gradually lowering the Lombard Repo Facility Rate from 20%
to 12%.
In view of possible rise in electricity price in the upcoming period, the prediction is that the
12-month inflation rate would remain in the upper bound of the confidence band
Real GDP cumulative growth projection probability distribution a for 3-year horizon
February 2015 projection
Current projection

6
The Central Bank estimates that keeping the Refinancing
Rate’s current level in the 2nd quarter of 2015 would facilitate
the 12-month inflation to stabilize, since 2016, around the
target. Later, as economic developments unfold, the Central
Bank will adjust its monetary policy directions, while fulfilling the
inflation target in the medium-term perspective.
Risks to inflation deviating from the projected value are
estimated as balanced in both short and medium-term
perspectives. External sector risks are primarily associated with
global economic growth rates bouncing back as well as price
developments in world commodity and food product markets.
Risks deriving from the domestic environment are attributable to
the pace at which the domestic demand would recover, the
Government-led projects, economic effects from regional
integration processes as well as the developments in agriculture
sector which is largely reliant on weather conditions. At the
same time, the lack of information about the size and timing of
possible increase in electricity tariffs adds to the uncertainties
over inflation developments. If such risks materialize, the
Central Bank will react accordingly by maintaining the inflation
target in the medium run.
Inflation (12-month) forecast probability distribution chart for a 3-year horizon
012345678910111213
20
09
/03
20
10
/01
20
10
/03
20
11
/01
20
11
/03
20
12
/01
20
12
/03
20
13
/01
20
13
/03
20
14
/01
20
14
/03
20
15
/01
20
15
/03
20
16
/01
20
16
/03
20
17
/01
20
17
/03
20
18
/01
The quarter's forecast
Actual inflation
The previous quarter's forecast
7
2 . F O R E C A S T , F O R E C A S T C H A N G E S , R I S K S
2.1. External environment2
In 2015, the global economy and economies in Armenia’s
main trade partner countries will further see slow growth rates.
This will be noticeable mostly in developing countries, whereas
some economic activity is anticipated on developed countries.
In the external sector, deflationary patterns will be persisting
in the short run due to slower global economic growth, whereas
weak inflationary trends will be observable in the forecast
medium run horizon, as the global demand grows gradually.
In its Global Economic Outlook report, released in April
2015, the IMF revised long-term sustainable economic growth
rates downside for both developed and developing countries
due to the problem of aging of population and slower pace of
capital growth. Based on the results of the analysis in the report,
estimations of long-term sustainable economic growth in the
U.S.A. and EU were lowered by about 0.5 percentage point.
In early 2015, the U.S. economic growth slowed down. It is
estimated at nearly 2.6%, which is predicted to accelerate in the
forecast horizon to about 3.2% in 2017. Notwithstanding the
inflation that was declining later the previous year, the U.S.
Federal Reserve System is expected to raise the policy rates
starting from the middle of 2015 as the economic activity and
demand rebound.
In the Eurozone, the growth in 2015 is expected to somewhat
accelerate after a slowdown in economic activity in 2014. A
significant decline in oil prices, exchange rate depreciation and
the European Central Bank’s extensive asset purchase program
will certainly contribute positively to the acceleration of
economic growth. The latter will make up 1.5% in 2015 and
stabilize around it in the forecast horizon. In the face of
increasingly deflationary environment, the ECB will continue its
low-interest-rates policy up until mid-2016. In the meanwhile,
the asset purchases programs will continue by September 2016,
resulting in a more expansionary monetary policy with the aim to
handle inflation.
In Russia, substantially volatile patterns in economy observed
in late 2014 and early 2015 make it to expect economic
slowdown in 2015 by roughly 2.2% (later the year, the economic
decline is predicted to even deepen to 4%). Recession in the
economy will continue up until mid-2016, and some positive
growth of about 0.7% will only be observable in the end of the
forecast horizon. It is expected that the effects of reduced oil
2 The forecasts of external sector were based on the information provided from international reputable analytical, research, ratings organizations and financial institutions as well as various news agencies worldwide (including the IMF, World Bank, The Economist, Economist Intelligence Unit, Global Insight, Financial Times, and so on).
In 2015, the global economy and main trade partners’ economies will further see slow growth
rates. This will be noticeable mostly in developing countries.
In the external sector, deflationary patterns will persist in the short run while weak inflationary
trends will be observable in the forecast medium run horizon, as the global demand grows gradually.

8
prices and economic sanctions, already visible in late 2014,
would be even more pronounced this year and over 2016. With
an anticipated decrease in demand during 2015, import
substitution will however factor favorably into the economic
growth, and this will somewhat alleviate the shock resulting from
deteriorated terms of foreign trade. At the same time, exchange
rate depreciation and trade restrictions will positively affect the
output growth in some manufacturing areas, the improvement of
the country’s external position suffered from plunging oil prices,
the economic growth recovery and the retaining of the rate of
employment. High 12-month inflation rate, fuelled by steep
depreciation of the ruble, will be persisting throughout 2015,
which is predicted to reach 12% later the year. In the forecast
horizon however, the exchange rate is predicted to somehow
stabilize as oil prices are expected to grow and capital flows to
rebound.
In addition, the IMF April 2015 report predicted a 3.5%
growth of global economy for 2015 and 3.8% growth for 2016
(which is almost unchanged in comparison with the previous,
i.e. the January, release of the report).
Relative to the previous year, the expected prospects for
developed economies have improved, whereas economic
growth in developing countries is expected to slow down.
With the global economy growing at a slow rate, deflation in
world commodity and food product markets will continue up
until mid-2015, yet some signs of recovery are anticipated in the
forecast horizon as production and supply reduce to a certain
extent driven by lower prices and the global demand rebounds
slowly. In the meantime, individual commodity markets are
predicted to develop under the influence of fundamental factors
inherent in any such markets. Specifically, risks associated with
energy price developments will be determined by geopolitical
events, whereas prices of food products will depend on weather
conditions.
Risks to the further pace of the global economy remain
essential yet they have become more balanced relative to
former prediction. Thus, the international prices of raw materials
and food products staying at a low level will provide positive
effects in terms of global demand. Risks to economic
developments in Russia mostly relate to further and lasting
recession associated with risks to even stricter economic
sanctions and more capital outflow.
Downside risks to economic growth in the Eurozone are still
noteworthy, which is due to a slowing pace of structural reforms
and geopolitical developments in member states.
As the global economy rebounds and economic growth in
Armenia’s main trade partners gradually accelerates in the
medium run, a steady price rise in international commodities
and food products markets as well as trends of some
appreciation and relative stabilization of exchange rates will
transmit positive effects on to the Armenian economy.
-15
-10
-5
0
5
10
15
I 08
III
I 09
III
I 10
III
I 11
III
I 12
III
I 13
III
I 14
III
I 15
III
I 16
III
I 17
III
USA EU Russia
Economi c growth i n mai n trade partners (%)
0
50
100
150
200
250
300
350
400
450
I 08
III
I 09
III
I 10
III
I 11
III
I 12
III
I 13
III
I 14
III
I 15
III
I 16
III
I 17
III
0
5
10
15
20
25
30
Wheat Sugar (right-hand scale)
Food p roducts (USD)
0
2000
4000
6000
8000
10000
12000
I 08
III
I 09
III
I 10
III
I 11
III
I 12
III
I 13
III
I 14
III
I 15
III
I 16
III
I 17
III
0
20
40
60
80
100
120
140
Copper Oil (righ-hand scale)
Bas i c commod i ti es (USD)

9
Box 1
Developments in commodities markets in
the forecast horizon
The OPEC April 2015 report of the oil market predicts that the global oil demand will grow in 2015 by 1.17 million b/d and consumption will reach 92.45 million b/d. In 2015, oil production outside OPEC is predicted to grow by 0.68 million b/d compared to the growth of 0.18 million b/d last year, while oil production by OPEC will grow by 0.19 million b/d against the growth of 0.18 million b/d the year before. Though oil prices are expected to remain low in the short run and capital investment in the oil industry is starting to slacken, the inflation environment will incur these effects only in the medium term perspective. At the same time, there were further uncertainties in oil product markets associated with oil producers’ decisions about extraction volumes as well as geopolitical developments.
In base metals markets, prices are expected to grow unhurriedly amidst slowing of potential economic growth in China and a slow pace of global economic growth.
According to April estimates of the U.S. Department of Agriculture, in the 2014/2015 marketing year some 726.5 million tons of wheat crops is expected (the volume of crop has increased by about 9.7 million tons in comparison with the previous year). The wheat stock will amount to 199 million tons in 2015, which will represent roughly 11.0% (20.0 million tons) increase in relation to 2014. Positive developments with wheat production will be observed in all producer regions. In the short-term perspective, wheat prices will trend down due to a lag in demand in expectation of increased production volumes and deflationary patterns.
In the 2014/2015 marketing year, world production of rice will reach 474.6 million tons (about 2.28 million tons less compared to the previous year). According to the Food and Agriculture Organization data, the world rice stock will amount to 176 million tons in 2015, with a y/y decrease of 0.8%. Despite an expected reduction in rice production, the slowing of demand in the short run will result in the falling of the rice price.
Brazil, a leading sugar producer and exporter, expects high cane crops in 2015, which will lead to a short-term decrease in international sugar prices. The Brazilian real depreciating against the U.S. dollar will in turn contribute to the deflationary environment.
2.2. Aggregate supply and Aggregate demand
Aggregate supply
Economic growth forecasts for 2015 were revised slightly
upside, driven mainly by loosened monetary conditions in the
1st quarter, more stimulating fiscal policy implementation and
positive developments in agriculture. As a result, economic
growth in 2015 is anticipated in the range of 1.6%-2.6%3. It
should be noted however that slow global economic growth
rates are maintained, Armenia’s domestic demand is still
sluggish and international ore and mineral prices persist at their
low levels.
3 See the 30% range in the Real GDP Growth (Cumulative) Projection Probability Distribution Chart.
The 2015 economic growth is anticipated in the range of 1.6%-2.6%.

10
Effective implementation of export- and investment-oriented
program of the Government, improving external economic
environment and structural reforms are among the key factors
that will speed up the economic growth starting from 2017,
amid a steady inflation environment. Based on the above
mentioned developments, it is expected that economic growth
would speed up to be within 3.5%-5% in the end of the forecast
horizon, which would be driven greatly by the tradable sector.
Given reduced long-term economic growth equilibriums4
amid growing uncertainties associated with economic
developments in Armenia’s main trade partners, anticipated
slowing of foreign capital investment, and weak investment
activity persisting in the domestic economy, Armenia’s long-term
economic growth equilibrium has been revised downside to
4%-5%.
For Industry, the 2015 forecasts of value added were revised
slightly upside, with food processing growth rate adjusted as a
result of positive developments in agriculture. Thus, in 2015
value added in industry is expected to grow in the range of
1.5%-2.5%. Exploiting Teghout mine and exploring new export
markets will significantly contribute to the expected moderate
growth in 2015.
In the forecast horizon, the industry growth will speed up and
stabilize within 3.5%-4.5%. This will be underpinned by
implementing a handful of investment projects and broadening
export capacities as the Government carries out an export-
oriented policy.
For Construction, the forecasts of value added were also
revised upside, mainly based on somewhat higher activity in the
1st quarter relative to the prediction. Anticipated shrinking in
volumes of household funded construction will somehow be
mitigated by construction activities for roads, irrigation, water
supply and sewage systems, renewable energy and Yerevan
underground modernization, which are planned to be carried out
using funds of the central and local community budgets and of
international organizations. As a result, value added is expected
to decrease in 2015 in the range of 0.5%-1.5%.
In the forecast horizon, the growth is expected to stabilize
within 0%-2% as the supply and demand imbalance in
construction phases out. The growth will be driven mainly by
large construction projects designed for infrastructure
improvement.
For Services, the forecasts of value added were revised
slightly downside, mostly due to factual negative developments
in trade. As a result, real growth of value added in services in
2015 is predicted in the range of 0.6%-1.6%. Note that expected
growth of the tourism industry could substantially contribute to
an anticipated moderate growth during the year.
In the forecast horizon, growth rates in services are expected
to accelerate and stabilize within 4%-5% as the domestic
demand recovers steadily and travel services grow.
For Agriculture, the forecasts of value added were revised
upside, primarily due to factual positive developments in the
sector in the 1st quarter on the one hand and favorable weather
on the other. As a result, the real growth of value added in the
sector in 2015 is predicted in the range of 6.5%-7.5%.
4 See details in section 2.1 “External environment”.
Starting from 2017, the economic growth is predicted to accelerate to be in a 3.5%-5% range in
the end of the forecast horizon, which would be driven largely by the tradable sector.

11
In the forecast horizon, the growth in agriculture will stabilize
within 5%-6%. Relatively high growth rates in the medium run
will be possible to maintain due to more house farming facilities,
arable land, crops and cattle as a result of consistent complex
measures which the Government has taken on lately.
In the forecast horizon, risks to the economic growth are dual
sided and come in mostly balanced. In particular, they depend
on how the global economy would develop further and what
economic effects could be expectable from integration
processes in the region, on the one hand, and on how
investment activity in the tradable sector of the domestic
economy would unfold, on the other.
Real GDP Growth (Cumulative) Projection Probability Distribution
Period
30% probability interval 90% probability interval
Min Max Min Max
January-December 2015 / January-December 2014 1.6% 2.6% -0.1% 4.1%
January-December 2016 / January-December 2015 1.4% 2.8% -0.9% 5.1%
January-December 2017 / January-December 2016 3.4% 5% -0.9% 7.5%
Labor market:5 Forecasts of labor market indicators for
2015-2017 have improved relative to the previous forecasts,
reflecting the adjustment in economic growth forecasts.
Specifically, in the forecast horizon average wage is expected to
have higher growth rates and the unemployment rate to be
lower. Thus, average nominal wage is expected to grow by 8.3%
in 2015, by 6.1% in 2016 and by about 6.5% in 2017.
On the back of wage increases in the public sector since July
of 2014, average wage growth rates are expected to remain
strong over the first half of 2015, making up 10.4%. The effect,
however, will wane out in the second half of the year. Note that
starting from the mid-2015, the minimum wage threshold will
rise to AMD 55,000. As a result, the predicted average wage
growth for 2015 is nearly 8.3%.
With an expected economic growth, stabilizing inflation rate
and the Government policy further steered to minimum wage
increases, the average nominal wage is predicted to grow by
6.0%-6.5% annually in the period 2016-2017.
The nominal wage increase of 8.1% in 2014 is higher than
the average wage growth reported in recent years. The wage
increase during the year was attributable to the minimum wage
threshold increased up to AMD 50,000, the increase in wages in
some undertakings in the private sector in the context of the
funded pension reform and wage increases in the public sector
during the second half of the year.
The wage growth expected in 2015 is consistent with the
productivity growth projected for the year. Thus, one may
conclude that pressures from the labor market on the inflation
are estimated neutral in the forecast horizon.
5 The labor market data for the 1st quarter of 2015 are the Central Bank estimates which are based on the 4th quarter of 2014 data and actual January-February 2015 figures. The growth indicators presented in this sub-section are relative to the same reference period last year, unless otherwise specified.
Average nominal wage is expected to grow by 8.3% in 2015, by 6.1% in 2016 and by about 6.5% in
2017.
Real GDP cumulative growth projection probability distribution a for 3-year horizon
February 2015 projection
Current projection
0%
2%
4%
6%
8%
10%
2010 2011 2012 2013 2014 2015 2016 2017
Actual Projection
Average nomi nal wage growth , y /y
12%
14%
16%
18%
20%
2008
2009
2010
2011
2012
2013
2014
2015
2016
2017
Actual Projection
Unemp l oy men t rate

12
The unemployment forecasts were revised somewhat
downside relative to former forecasts. In 2015, the average
unemployment rate is expected to amount to 18.2%. In
anticipation of faster economic growth, a trend of steadily
subduing unemployment rate will be observable in 2016-2017.
In the forecast horizon however the unemployment rate will be
above its equilibrium, reflecting a small negative GDP gap and
minor deflationary pressures it will generate in the meantime.
Aggregate demand6
Driven by an anticipated decline in remittances from Russia,
a main trading partner, and weak investment activity in the
domestic economy, the private sector spending in Armenia is
likely to reduce by 3.5% in 2015. However, anticipated
slackening of private spending will diminish in 2015 relative to
previous forecasts, which will be determined by an expansionary
fiscal policy to be implemented this year.
A tight monetary policy in late 2014, carried out to maintain
price and financial stability, was geared up for considerable
easing of monetary conditions since the start of 2015. This will
enable to mitigate the expected decline of the level of private
spending in 2015.
In the period 2016-2017, the private spending will bounce
back, growing at a moderate rate. The negative impact of private
spending on economic growth during this period will alleviate
owing to persisting effect from expansionary fiscal policy to be
implemented in 2015 and a positive contribution from net
exports.
Although such a development with private spending will
somewhat negatively affect the economic growth, it will however
contribute to the long-term equilibrium and stability of the
economy in future.
Estimates suggest that final consumption expenditures of
households will reduce in 2015 by 2.5% in real terms resulting
from considerable reduction in remittances from Russia and
anticipated slowing of growth rates of credit to the economy.
Note, however, that the shrinkage of private transfers is
estimated to be smaller compared to former forecasts, which is
attributable to higher economic activity to be seen in 2015,
fiscal and monetary stimuli as well as much slower pace of
decline in remittances.
The above factors, as well as current and expected
sluggishness in investment activity will lead to almost 8%
reduction in private investment in 2015, which is significantly
lower compared to the previous forecasts. Expected decline in
private investment in 2015 will be determined by reduced
investment in companies engaged in construction and other
non-tradable sectors of the economy, which will outweigh the
investments in the tradable sector. The expected growth of
investments in the tradable sector is due to increased
profitability there as a result of the dram exchange rate
depreciation in late 2014.
6 The data of real growth of private consumption and investments for 2015-2017 are the Central Bank estimates. These actual figures are as of the 4th quarter 2014 published by the Republic of Armenia National Statistics Service. The real growth indicators represented in this sub-section are relative to the same reference period last year, unless otherwise specified.
In 2015, final consumption expenditures by households will reduce by 2.5% and private
investment, by 8%, in real terms.
-4%
-2%
0%
2%
4%
6%
8%
10%
2010 2011 2012 2013 2014 2015 2016 2017
Actual Projection
Pri vate cons ump ti on growth , y /y

13
The 2015 expansionary fiscal policy, considerable easing of
monetary conditions in the forecast horizon, as well as
improving external economic environment and Russia’s
economic recovery, in particular, will cushion the decline in
private consumption and investment in 2015 and even stimulate
their growth in 2016-2017. As a result, the private consumption
is expected to grow in 2016 and 2017 by 2.0%-2.5% and
2.5%-3%, respectively.
The private investment in 2016-2017 is expected to post a
3%-4% growth. There will be more investments owing to the
ones expected in the tradable sectors of the economy, for which
recent depreciation of the dram exchange rate and continued
structural changes in the economy will be an important
incentive. On the back of these developments, investment
activity in the non-tradable sector is expected to recover in
2016-2017, although rather slowly than in the tradable sector.
In the forecast horizon, Armenia as a Eurasia Economic
Community member will benefit from more private investment
flowing into its economy as a result of implementation of a
variety of projects to be carried out with EEC member countries
and a free access to the EEC markets. In view of the aforementioned developments with private
consumption and investment, in 2015 the private sector
expenditures will reduce by 3.5%. Starting from 2016, private
spending will gradually recover and in the end of the forecast
horizon will increase by 2.5%-3.0%. As a result, the private
spending gap for the period 2015-2016 is estimated to be still
negative, although the level of private spending is estimated to
be higher in relation to former forecasts.
The expansionary fiscal policy to be implemented in the
domestic economy, gradual easing of monetary policy, as well as
acceleration of economic growth in Armenia’s main trading
partners will gradually reduce the negative private spending gap
and help these imbalances phase out in the end of the forecast
horizon.
From the 1st quarter 2015 to the 2nd quarter 2016, the
private spending will create some 2.0 pp - 2.3 pp of
contractionary impact on the inflation. In the period from the
second half of 2016 up to the end of 2017, the private spending
will leave no considerable impact on the inflation.
Current account
The information on foreign trade developments during the 1st
quarter of 2015 is not complete due to shortage in compiling of
trade indicators, which is why the export and import growth
forecasts were left unrevised. Thus, according to the previous
forecast, the real export growth of goods and services in 2015
will be in the range of 7.0%-9.0%, while the real decline in
import of goods and services in the range of 4.0%-6.0%. On the
part of trade of goods, revisions only relate to dollar values,
which, according to the Central Bank, is attributable to improved
terms of trade (estimations suggest that in 2015 average export
prices will decline at a slower pace than average import prices).
In 2015, there will be somewhat a lower decline in
remittances of individuals compared with the previous forecast,
which is attributable to the Russian ruble with its higher-than
expected rate of appreciation. As a result, the dollar value of
In 2016-2017, private consumption is expected to grow by 2%-3% and private investment, by 3%-4%.
-40%
-20%
0%
20%
2008
2009
2010
2011
2012
2013
2014
2015
2016
2017
Actual Projection
Pri vate i n ves tmen t growth , y /y

14
remittances of individuals is projected to reduce by about
25.0% against the previous decline of 30.0%.
On the back of these revisions, the Current Account Deficit-
to-GDP ratio, which was 8.0% in 2014, will drop to stay within
6.0%-7.0% in 2015. It is noteworthy that the current account will
improve mostly owing to the improvement of the balance of
trade, in spite of negative developments with private transfers.
The current account position will continue improving in the
medium-term perspective, and the Current Account Deficit-to-
GDP ratio will reach a 5.0%-6.0% range.
The fiscal policy’s impact on the aggregate demand for 2015
was assessed using the adjusted indicators of the Republic of
Armenia Law on State Budget 2015. According to the
assessment, the Tax-to-GDP ratio is expected to stay unchanged
but the Expenditure-to-GDP ratio7 to somehow increase in
relation to the preliminary indicators of 2014, with projected
increase of expenditures owing to current expenses. As a result,
the Deficit-to-GDP ratio in 2015 will be greater than 2.3% as
provided for by the law.
In 2015, relative to 2014, the budget revenues are projected
to leave a neutral impact and budget expenditures an
expansionary impact on the aggregate demand. Meanwhile,
expansionary effects are anticipated during all quarters of the
year, and based on annual results the expansionary impact will
amount to 2-2.5. It is worth mentioning that domestic economic
developments will be largely determined by how the state
budget will be performed.
The projections of the fiscal policy in the forecast horizon are
based on underlying macroeconomic indicators in the Republic
of Armenia Medium-Term Public Expenditures Program for 2016-
2018. In the medium run the fiscal policy is steered to reduce
the budget deficit. The fiscal policy’s impact is estimated to be
contractionary in 2016, neutral in 2017-2018, and generally
non-inflationary in the medium run.
Medium-term fiscal policy impact assessment
% in GDP 20148 2015 2016 2017 2018
Budget revenues 24.3 24.2 24.6 25.0 24.9
Budget expenditures 26.4 27.9 27.4 27.3 26.8
Debt interest payment 1.4 1.5 1.9 1.9 1.9
Budget balance -2.1 -3.7 -2.8 -2.3 -1.9
Primary balance* -0.7 -2.2 -0.9 -0.4 -0.0
One-off flows** -0.6 0.3 -0.7 -0.6 -0.5
Adjusted balance*** -0.1 -2.5 -0.2 0.2 0.4
Cyclical balance**** 0.2 -0.2 -0.6 -0.2 -0.1
Cyclically adjusted primary balance (structural balance sheet) -0.3 -2.3 0.4 0.4 0.5
Fiscal stance***** 0.7 2.0 -2.6 0.0 -0.1
* Budget balance less debt interest payments. ** Temporary or one-off budget entries. In this case net credit is considered; the sign “+” means resources allocated and the sign “–” means resources repaid. *** Primary balance sheet adjusted by temporary or one-off entries. **** Central Bank estimate: a part of the budget balance which depends directly on the business cycles. The latter’s components depend on the GDP gap and revenues and expenditures elasticity coefficients on GDP gap. ***** Central Bank estimate: y/y change in the structural budget balance that reflects a discretionary nature of the fiscal policy (the positive sign denotes fiscal expansion and the negative sign denotes fiscal contraction).
7 The 2015 GDP is the estimation of the Central Bank. 8 The 2014 state budget indicators presented exclude records of off-budgetary funds.
In 2015, the fiscal impulse is forecast to be 2-2.5 expansionary.
-30
-20
-10
0
10
20
30
200720082009 20102011 201220132014 201520162017
Real export Real import
Real expo rt and real i mpo rt (goods and
s erv i ces ), y /y , %

15
To sum-up, from the 1st quarter of 2015 up to the 1st quarter
of 2016 the combined impact of the fiscal policy, private
demand and labor market on domestic prices will be
deflationary, in the range of 0.4-0.5 pp, which will be
determined primarily by deflationary impact of private spending.
Also, given the 0.2-0.3 percentage point deflationary impact of
net external demand, one may conclude that overall aggregate
demand and labor market developments in the above-
mentioned period will create an average 0.6-0.8 percentage
point deflationary pressures in the consumer market.
Starting from the second half of 2016 up until the end of the
forecast horizon, the impact of overall aggregate demand and
labor market on the inflation is estimated to be neutral.
2.3. Inf lation forecasts and monetary policy
directions in 3-year forecast hor izon
In the 1st quarter of 2015, global economic growth persisted
at a slow pace. This, coupled with increased supply factors and
expectations in the commodity markets, as well as with the
appreciation of the U.S. dollar, has led to deflationary patterns in
basic commodity and food product markets of the world.
In the forecast horizon, global economic growth will continue
at a slow pace, which will be observed mostly in developing
countries, whereas developed countries will anticipate certain
revival of economic activity. It is worth mentioning that in the
time of geopolitical and domestic economic developments the
Russian economic growth forecast has not changed significantly
compared to the previous one. In particular, a 2.2% economic
decline is expected in 2015, which will continue until mid-2016,
gradually approaching the 0.7% level in the forecast horizon. In
the meanwhile, external sector-driven uncertainties are still
persisting although they have toned down. With the global
economy growing slowly, the external environment will remain
deflationary in the short run but certain signs of recovery are
expectable in the forecast horizon due to some reduction in
supply and gradual increase in global demand.
Economic growth had higher-than-expected growth rates in
the 1st quarter of 2015 due to even more positive
developments reported in agriculture and construction. The
estimation is that the annual economic growth in the meantime
will be within 2.1%-2.5%, with agriculture and services sectors
remaining the main driving forces.
At the time of significant economic slowdown in Russia when
the ruble depreciated against the U.S. dollar, in the 1st quarter
of 2015 net inflow of private remittances and seasonal worker
wages has reduced notably, as was expected, resulting in a deep
negative gap in remittances. The latter was concomitant with a
decrease in private consumption expenditures during the
quarter, which is however lower than estimated, owing to more
stimulating fiscal policy as well as higher-than-predicted
economic activity. In the 1st quarter of 2015, the investment
climate was further weak due to persistently low activity in the
construction industry.
In the 1st quarter of 2015, global economic growth persisted at a slow pace while the world
commodity and food product markets saw deflationary patterns.
In the 1st quarter of 2015, economic growth rates were higher than expected; growth is estimated in
the range of 2.1-2.5%.

16
The above-mentioned factors pushed the domestic demand
down in the 1st quarter of 2015, which contributed to shaping a
negative GDP gap. However, influenced by lagged effects from
end-year exchange rate depreciation, the 12-month inflation rate
somewhat accelerated, as was expected (it approached the
upper bound of the confidence band, amounting to 5.8% in late
March).
In the 1st quarter of 2015, the Central Bank loosened the
monetary conditions remarkably after the situation in financial
and commodity markets stabilized and inflation expectations
diminished as a result of the Bank’s action at the end of the
year. Specifically, early in the year the Bank lowered the
Lombard Repo Facility Rate from 20.0% to 12.0% and lifted the
Refinancing Rate by 2.0 pp to 10.5% in response to investment
risks and interest rate trends in developing countries in a long-
term perspective. These actions helped the Lombard Repo
Facility Rate to again uphold an accepted 1.5 percentage point
spread from the Refinancing Rate and curtailed the spread
between the policy rate and short-term market rates. Monetary
conditions were loosened also in the context of other macro-
prudential measures. Specifically, a zero or weak mechanism of
reserve requirement for long-term funds attracted by banks,
made effective from the 1st quarter of 2015, somehow offset
the effect of the reserve requirement mechanism that had been
tightened at the end of the last year.
Regarding the Central Bank’s macroeconomic forecasts, the
2015 economic growth forecasts have been revised somewhat
upward in consideration of maintained financial stability,
significantly loosened monetary policy conditions in the 1st
quarter of 2015, fewer uncertainties in the external sector, a
more-than-expected stimulating fiscal policy implementation and
positive developments reported in agriculture. At the same time,
in view of higher appreciation of the Russian ruble in
comparison with the anticipation, the dollar value of private
remittances is expected to decline at a slower rate. As a result,
the 2015 economic growth is forecast in the range of
1.6%-2.6%, with agriculture and services sectors to be the main
drivers. Influenced by the aforementioned factors, the decline in
private spending will be slower in 2015 while positive
developments in construction will facilitate weak investment
climate to decline lesser than anticipated.
In the forecast horizon, the 2016 economic growth rates will
persist at the same level then will speed up, owing to a bunch of
programs the Government programs to carry out in the tradable
sector and continued improvement in external economic
environment. The above developments will prompt the private
spending to gradually rebound in the period 2016-2017. This,
coupled with net export’s positive contribution, will cause the
negative GDP gap to shrink and finally phase out at the end of
the forecast horizon. It is expected that the economic growth, to
be very much driven by the developments in the tradable sector,
will be in the range of 3.5%-5.0% at the end of the forecast
horizon. Yet, economic growth projections in the forecast
horizon will largely depend on the extent, course and efficiency
of the Government’s programs.
In the 1st quarter of 2015, the Central Bank loosened the monetary conditions remarkably by
lowering the Lombard Repo Facility Rate from 20.0% to 12.0% as well as taking on some other
macro-prudential measures.
Influenced by lagged effects from end-year exchange rate depreciation, the 12-month inflation
rate somewhat expanded to approach the upper bound of the confidence band; in late March it was
5.8%
The 2015 economic growth is forecast in the range of 1.6%-2.6%, with agriculture and services sectors
to be the main drivers.
Economic growth will be in the range of 3.5%-5.0% at the end of the forecast horizon.

17
As for inflation developments in 2015, a likely increase in
electricity price would keep the 12-month inflation rate around
the upper bound of the confidence band. Nevertheless, greater
seasonal decline in food prices in anticipation of positive
developments in agriculture as well as the expected weak
demand in domestic and external economies might partly
moderate the inflationary impact of the electricity price increase.
As a result, the Central Bank estimates that maintaining the
Refinancing Rate at the current level in the 2nd quarter of 2015
would make it possible for the 12-month inflation rate to
stabilize, since 2016, around the target. Later, as economic
developments unfold, the Central Bank will adjust its monetary
policy directions, while fulfilling the inflation target in the
medium-term perspective.
Risks to inflation deviating from the projected value are
estimated as balanced in both short and medium-term
perspectives. External sector risks are primarily associated with
global economic growth rates bouncing back as well as price
developments in world commodity and food product markets.
Risks deriving from the domestic environment are attributable to
the pace at which the domestic demand would recover, the
Government-led projects, economic effects from regional
integration processes as well as the developments in agriculture
sector which is largely reliant on weather conditions. At the
same time, the lack of information about the size and timing of
possible increase in electricity tariffs adds to the uncertainties
with regard to inflation developments. If such risks materialize,
the Central Bank will react accordingly by maintaining the
inflation target in the medium run.
In the forecast horizon, as the economic activity declines
further, the forecasts of smaller demand for credit resources
hence slower credit growth rates will remain unchanged. This
will somewhat be compensated by various lending programs
under a number of international financial institutions (World
Bank, Asian Development Bank, KfW Bank, European Investment
Bank) carried out through the Central Bank in cooperation with
the Armenian Government, and by low-interest loan projects
under a handful of social programs (Housing for Youth, the
National Mortgage Company).
In a longer term, the Central Bank will look to the target level
of the policy rate to adequately react to any shifts in liquidity to
make sure money supply is consistent with demand.
Period Inflation forecast probability distribution chart
<1.0% 1.0-2.5% 2.5-5.5% 5.5-7.0% >7.0%
Q2, 2015 0.0% 0.0% 8.0% 80.8% 11.2%
Q3 0.1% 2.4% 63.0% 30.8% 3.7%
Q4 1.1% 10.7% 73.2% 13.5% 1.6%
Q1, 2016 5.5% 21.9% 64.5% 7.3% 0.8%
Q2 4.1% 17.6% 65.6% 10.9% 1.8%
Q3 2.2% 11.2% 62.4% 18.8% 5.5%
Q4 3.9% 15.3% 62.8% 14.5% 3.5%
Q1, 2017 4.0% 15.2% 62.2% 14.8% 3.8%
Q2 5.0% 16.0% 59.8% 14.8% 4.4%
Q3 7.0% 17.1% 55.9% 14.6% 5.3%
Q4 8.0% 18.0% 55.0% 13.9% 5.0%
Q1, 2018 9.2% 18.9% 54.0% 13.1% 4.7%
A possible increase in electricity price would keep the 12-month inflation rate around the upper
bound of the confidence band over 2015.
The Central Bank estimates that keeping the Refinancing Rate at its current level in the 2nd
quarter of 2015 would help the 12-month inflation rate stabilize, since 2016, around the target.
Inflation (12-month) forecast probability distribution chart for a 3-year horizon
012345678910111213
20
09
/03
20
10
/01
20
10
/03
20
11
/01
20
11
/03
20
12
/01
20
12
/03
20
13
/01
20
13
/03
20
14
/01
20
14
/03
20
15
/01
20
15
/03
20
16
/01
20
16
/03
20
17
/01
20
17
/03
20
18
/01
The quarter's forecast
Actual inflation
The previous quarter's forecast

18
3 . A C T U A L D E V E L O P M E N T S I N Q 1 2 0 1 5
3.1. Inf lation
3.1.1. Actual inflation and fulfillment of the inflation target
There was 2.3% inflation recorded in the 1st quarter of 2015,
with the 12-month inflation rate having grown to a certain
extent, as was expected, to 5.8%, i.e. closer to the upper bound
of the confidence band of 4.0+/-1.5 pp. The quarter’s inflation
was mainly due to food and non-food price increases by 2.8%
and 3.6%, respectively, with their total contribution of 2.1 pp to
inflation. In particular, the increase in food prices was fuelled by
seasonal increase in fruit, vegetable and potato prices, by 9.4%
and 10.0% respectively (with their total contribution of 0.9 pp
inflation). Also, there has been price inflation on bread products,
meat products and pastry, making 0.4 pp of contribution to the
inflation.
Non-food price inflation was driven primarily by increased
prices of household appliances, footwear, clothing, knitwear and
medicament, which was somewhat offset by 9.0% decline in
gasoline and diesel prices. The growth of prices in rest and
leisure (up by 17.9%) and medical services (up by 3.4%) also
contributed to the quarter’s inflation.
The 12-month inflation by commodity groups as most important contributors
Commodity group
December 2014 (y/y)
March 2015 (y/y)
Q1 2015
Gro
wth
Contr
ibution
Gro
wth
Contr
ibution
Gro
wth
Contr
ibution
CPI 4.6 5.8 2.3
Food products 6.3 3.4 6.8 3.3 2.8 1.4
Bread products 5.9 0.6 8.1 0.8 1.6 0.2
Dairy products 13.1 0.6 10.8 0.5 0.6 0.0
Meat products 3.3 0.3 7.6 0.7 1.3 0.1
Fruits 14.6 0.5 21.9 0.7 9.4 0.3
Vegetables and potato 7.9 0.5 -3.2 -0.2 10 0.6
Fats and oils 1.9 0.1 2.7 0.1 -3.4 -0.1
Egg 2.1 0.0 2.9 0.0 -0.5 0.0
Sugar 6.9 0.1 7.7 0.1 -0.02 0.0
Pastry 5.93 0.1 16.8 0.2 9.7 0.1
Non-food products 1.6 0.3 5.8 1.2 3.6 0.7
Services 3.0 0.9 3.7 1.1 0.8 0.2
In the 1st quarter of 2015, core inflation was 1.1%, with the
12-month rate having expanded by 1.6 pp to 4.4% in late March.
In the previous year’s short-term horizon, in a time-span from
the 2nd quarter of 2014 up to the 2nd quarter of 2015, the
Central Bank considered the inflation would further reduce to
approach the lower bound of the confidence band in the 3rd
quarter of 2014 as the impact of energy price increases had
In the 1st quarter of 2015, inflation was 2.3%, with the 12-month inflation rate having
amounted to 5.8%.
0
2
4
6
8
10
J
13
F M A M J J A S O N D J
14
F M A M J J A S O N D J
15
F M
12-month inflation
rate
In the 1s t quarter, the i n fl at i on env i ronmen t
expanded fu rther
%

19
phased out in July 2013. In the 2nd quarter of 2014, the Central
Bank was planning to continue easing the monetary conditions,
which, combined with the monetary policy carried out by that
time and expansionary fiscal policy to be implemented during
the year, had to lead to expanded aggregate demand and
rebounded inflation rates, helping the inflation stabilize around
its target in the forecast horizon.
Actual developments showed that over the 2nd and 3rd
quarters of 2014 the 12-month inflation rate had declined faster
than anticipated, reflecting weaker external and domestic
demand. Based on the aforementioned, the Central Bank chose
a down-trending path for the inflation for these quarters.
In the 2nd and 3rd quarters of 2014, there was 1.9%
deflation against 0.3% inflation of the same reference period last
year. Subdued gradually, the 12-month inflation rate reached
1.5% in late September 2014, stepping below the lower bound
of the confidence band. The 12-month inflation further declined
due to sluggish economic growth and a notable decrease in
some food prices amid a low level of investment and slowing
private consumption growth rates. In the meantime though, the
12-month core inflation rate had declined from 1.8% at the end
of the 1st quarter to 1.0% at the end of the 3rd quarter of 2014.
Given persisting low inflation environment and in anticipation
of non-inflationary pressures from the external and domestic
sectors in the medium run, the Central Bank further loosened
the monetary conditions: in the period April-September 2014
the refinancing rate has reduced a total of 0.75 pp to 6.75% in
late September.
The inflationary patterns varied dramatically in the 4th
quarter of 2014 in the light of escalated geopolitical issues
globally and, particularly, at the regional level. On the other
hand, many developed and developing countries saw their
currencies depreciating and inflation environment expanding
further as the U.S. economic growth accelerated and the dollar
strengthened. The effect of these events was observed in the
domestic currency market in the first place, which reported a
steep depreciation of the dram amidst notable reduction of
foreign currency transfers from abroad and Russia, a main trade
partner. This was immediately reflected on the commodity
market, expanding the inflation environment and creating
inflationary expectations. As a result, the 12-month inflation
rate, expected to amount to 3.2% late in the year, reached
4.6%, staying near to the confidence band.
The Central Bank responded to the situation intensely: in late
November the Bank raised the Lombard Repo Facility Rate from
8.25 to 21.0%, followed by a mid-December increase of the
Reserve Requirement Ratio for funds attracted in foreign
currency from 12.0 to 24.0%. The short-term dram market rates
reacted to the Bank’s tightening of financial conditions in the
financial market by rising and staying around the Lombard Repo
Facility Rate. This drove the Lombard Repo Facility Rate to take
the role of financial market’s leading interest rate. In the
meantime, to moderate future inflationary pressures and have
the inflationary expectations anchored around the target, in late
December the Central Bank raised the Refinancing Rate by
1.75 pp.
5.8
4.6
1.5
3.4
8.2
6.5
5.6
3.8
1.8
0
2
4
6
8
10
2013/1
2013/2
2013/3
2013/4
2014/1
2014/2
2014/3
2014/4
2015/1
2015/2
2015/3
2015/4
2016/1
2016/2
2016/3
2016/4
2017/1
2017/2
2017/3
2017/4
The Cen tral Bank fo recas ts th at o ver the next
two quarters the 12 -mon th i n fl at i on rate wi l l
hover around the upper bound o f the
con fi dence band , then i t w i l l s tab i l i z e
around the 4% target i n the fo recas t ho ri z on
%
12-month core inflation rate
Q1 2015 forecast
12-month inflation rate
Q3 2014 forecast
Q4 2014 forecast
Q2 2014 forecast

20
Following these actions, the currency and product markets
were able to see some signs of stabilization, which is why in late
December the Central Bank lowered the Reserve Requirement
Ratio for funds attracted in foreign currency from 24.0 to 20.0%
and the Lombard Repo Facility Rate from 21.0 to 20.0%.
A strong response by the Central Bank later in 2014 secured
anchoring of inflation expectations in the 1st quarter of 2015,
which led to an easing of the tension in the domestic financial
and commodity markets. In view of this development, the
Central Bank loosened the monetary conditions considerably in
the 1st quarter of 2015 by gradually cutting the Lombard Repo
Facility Rate from 20% to 12%.
In the 1st quarter of 2015, the Central Bank lifted the
Refinancing Rate to 10.5% with the aim to retain the monetary
position of the Republic of Armenia over a longer run, reflecting
upward trends of investment risk and interest rates in
developing countries.
These actions helped the Lombard Repo Facility Rate to again
uphold an accepted 1.5 percentage point spread from the
Refinancing Rate and pushed short-term market rates down.
A zero or weak mechanism of reserve requirement, effective
from the 1st quarter of 2015, means that the funds borrowed
from international financial institutions as well as the 2-year and
longer maturity funds borrowed through bonds issued by
domestic banks will be subject to reservation at a zero or
reduced rate. Other macro-prudential measures included
mitigating the requirements to resident non-financial
corporations and reducing risk weights ascribed to foreign
currency loans to borrowers active in export businesses, if they
have external credit rating.
It can be stated that the above measures taken on by the
Central Bank were of expansionary nature in general.
The changes made will allow the effective rate of the reserve
requirement to reduce in a short period of time while creating
real incentives for banks to borrow long-term funds. This will
expand lending opportunities in the framework of various
programs of the World Bank, Asian Development Bank, KfW
Bank, European Investment Bank, carried out through the
Central Bank and the Armenian Government for a handful of
social programs in the field of SME support, agriculture,
renewable energy, housing, etc., thereby creating favorable
conditions for a healthy growth of economic activity.
3.1.2. Import prices and producer prices
Import prices: in the 1st quarter of 2015, the dollar prices of
import of goods and services fell even faster, making up 8.5%
q/q, with y/y reduction of 15.7%. The decrement in dollar prices
was attributable in general to the U.S. dollar having reported
high appreciation rates at the end of 2014. Overall, the y/y
decrement in dollar prices was driven by 12.0 pp drop in prices
of goods and 3.7 pp falling in service prices (in the 1st quarter
of 2015, the dollar prices of import of services and import of
goods plunged by 9.1% q/q and 8.3% q/q, respectively).
The Central Bank loosened the monetary conditions considerably in the 1st quarter of 2015;
starting early the year, it gradually reduced the Lombard Repo Facility Rate from 20% to 12%.
In the 1st quarter of 2015, the Central Bank actions helped the Lombard Repo Facility Rate to
again uphold an accepted 1.5 percentage point spread from the Refinancing Rate thus restoring the latter’s leading role in the financial market.
Loosened monetary conditions and other macro-prudential measures will facilitate lending, thereby
creating favorable conditions for a sound economic activity.

21
Reduced prices of intermediate goods, including food products
and raw materials, was the main contributor to the y/y falling in
dollar prices of import of goods.
The falling in dollar prices of consumer goods was driven by
y/y decrement in dollar prices in Russia, the European Union
and Ukraine because of y/y/exchange rate depreciation there. As
a result, consumer goods made 3.4 pp of negative contribution.
Producer prices9: in the 1st quarter of 2015, all sectors of the
economy posted increased price indices, with the GDP deflator
having reached y/y 104 in the period January-March, according
to the Central Bank estimates.
Industry posted quarterly price increases of 5.4% y/y during
the 1st quarter, owing to growths in processing industry (6.7%)
and energy and gas production and distribution (8.3%). Note
that a lower growth of the latter in comparison with previous
periods is a result of an increased share of electricity (which is
the lowest tariff10) used by the nuclear plant in the structure of
electricity consumed by industrial enterprises.
Agriculture reported 3.7% y/y increase in prices11 during the
1st quarter, fuelled by 5.3% y/y price increases in animal
breeding. The 7.1% drop of prices in plant growing was due to
decreased prices in groups “potato and gourds” (12%), and
“grains” (6.5%), whereas price inflation in animal breeding was
mainly attributable to the increases in milk and dairy products,
egg and meat by 10.4%, 4.7% and 2.6%, respectively.
Construction reported 6.1% y/y price increases during the 1st
quarter, determined by increased costs in construction works
(4.8%), equipment & materials (2.7%) and other expenses
(17.1%). Note that the inflation on other expenses is primarily
due to a wage growth.
Carriage posted 2.9% y/y rise in tariffs during the 1st quarter,
owing to increased tariffs for railroad transport (13%) and truck
transportation (1.3%). Note that higher railroad tariffs are mainly
attributable to the energy prices having risen since August 1,
2014.
3.1.3. Inflation and interest rate expectations
The Central Bank’s Q1 2015 survey on financial sector and
household expectations of selected macroeconomic indicators
suggests that inflationary expectations for an upcoming one-year
horizon have somewhat eased as the Bank succeeded in
anchoring such expectations in the domestic financial market
after a series of actions it took later in 2014 in response to
geopolitical developments in the world and the region. Thus,
most banks have their expectations of the 12-month inflation
rate anchored around the 4.8% level against the 5.8% indicator
reported in the previous survey and the households in the region
of 3.7%, representing a downside adjustment relative to the
previous indicator.
9 The price index change as of January-March 2015 is relative to the same reference period last year, unless otherwise specified. 10 Public Services Regulation Commission’s Decision No. 232A, dated July 1, 2014, on “Electric Energy System Tariffs”. 11 Sales prices of producers of agricultural product are presented.
-20
-15
-10
-5
0
5
10
15
20
I 11 II III
IV
I 12 II III
IV
I 13 II III
IV
I 1
4 II III
IV
I 15
Import of services Import of goods
Consumer goods Intermediate goods
Import total
In the 1s t quarter, the do l l ar p ri ces o f
i mpo rt o f goods and s erv i ces dec l i ned
rather qu i ckl y (y /y , %).
%
80
90
100
110
120
GD
P d
eflato
r
Industr
y
Agriculture
Constr
uction
Carr
iage
2012 2013 2014 2015
In the 1s t quarter, the h i ghes t p ri ces were
repo rted i n cons tructi on
%

22
The results of the survey predict a certain rise in interest rates
of dram deposits in a one-year horizon whereas interest rates of
foreign currency deposits are expected to go a downward path,
which is, again, explained by the end-year measures taken by
the Central Bank. In the upcoming one-year horizon, interest
rates of dram and foreign currency funds allocated by the
financial sector are likely to increase, too.
3.2. Aggregate supply and Aggregate demand
3.2.1. Aggregate supply12
The economic growth indicator published by the National
Statistics Service for 2014 was 2.7% y/y, in which case the
January-December growth has been 3.4% y/y, consistent with
the economic growth indicator as outlined in previous two
forecasts of the Central Bank.
In the 1st quarter of 2015, the economic activity indicator
was 2.5% y/y, representing a slight increase against expectations
as a result of higher-than expected output growth in agriculture
and construction sectors.
In the 1st quarter of 2015, the economic growth is estimated
to be in the range of 2.1%-2.5%13.
Given an increased output of 2% y/y reported in Industry in
the 1st quarter of 2015, the growth of value added is estimated
in the range of 0.5%-1.0% y/y, mainly due to increased
production in ore mining (28%), metallurgy (3.5%), tobacco
production (48.3%), pharmaceuticals (46.5%), production of
building materials (8.3%), and water supply (8.9%). High growth
in ore mining is determined by the exploiting of Teghout mine.
Based on an actually increased output of 0.8% y/y recorded
in Construction for the period January-March 2015, the growth
of value added is estimated within 0-0.5%. Exclusive of reduced
volumes of construction financed by households (9.9%),
organizations (0.7%) and local community budgets (28.2%), all
other sources of construction financing posted growths as
follows: state budget (12.3%), international credit (57.1%), and
humanitarian aid (8.6%).
In Services, the growth of value added in the 1st quarter of
2015 is estimated in the range of 0.7%-1.2% y/y, attributable to
the volumes of services rendered and trade turnover having
reduced by 3.9% and 6.3%, respectively. Note that the increase
in the volume of services rendered was driven largely by growth
reported in banking services (20.9%), events, leisure and rest
(88.3%), information technologies (8.3%), hotel and
accommodation (7.4%), and entrepreneurship (0.6%). The
12 The indicators of real growth of value added in sectors of the economy for January-March 2015 y/y are the Central Bank forecasts whereas the indicators of sub-sectors represent y/y growth rates in output volumes for January-March 2015, unless otherwise specified. 13 See the 50% range in the Real GDP Growth (Cumulative) Projection Probability Distribution Chart.
In the 1st quarter of 2015, the economic growth is estimated to be within 2.1%-2.5%.

23
decline in trade was attributable to the turnover in retail,
wholesale and passenger car trade having reduced by 6.4%,
5.1% and 16.1%, respectively, due to real disposable household
income reduced largely as a result of an abruptly narrowed net
inflow of private transfers.
In Agriculture, the growth of value added for the 1st quarter
of 2015 is estimated in the range of 6.4%-6.9% y/y, fostered by
increased outputs in animal breeding, plant growing and fishing
by 3.5%, 28.9% and 23.1%, respectively. Reported increases in
milk production and slaughtered animal and poultry production
by 5% and 4.5%, respectively, contributed to the overall growth
in animal breeding. Similarly, as much as a 2.3-fold increase in
the production of vegetables contributed positively to plant
growing.
3.2.2. Aggregate demand14
In the 1st quarter of 2015, the decline in private spending is
estimated to be slower compared with forecasts and amounts to
1.3%. The revision is based on the lagged effect of expansionary
monetary and fiscal policies carried out in 2014 as well as a
more stimulating fiscal policy the Government implemented in
the reporting period.
Reduced private remittances from Russia have notably
diminished the households’ disposable income, which, in turn,
led to the shrinkage of private spending in the 1st quarter of
2015. Nonetheless, the first quarter contraction of private
consumption was mitigated by the above-mentioned factors.
The results of the Central Bank surveys15 as well as trade
turnover indices, as calculated by the National Statistics Service,
also point to the contracted private consumption. Thus, in the
1st quarter of 2015 the Consumer Confidence Index was 41.4 –
below its stability range – reflecting a declined consumer
spending. In the first quarter, compared to the same reference
period last year, the trade has shrunk by 6.3%, with the decline
reported in wholesale and retail trade as well as motor vehicle
trade.
In the 1st quarter of 2015, the investment climate in the
economy was weaker, just in line with anticipation, with an
estimated 7.4% decline in the private investment in relation to
the same reference period last year. The decline is determined
by weak activity in construction, slower growth rates in company
lending as well as a sluggish business environment in general.
The results of the Central Bank’s investment survey on
Armenian companies point to the decline in investment in t
period under review. Thus, only 16% of the companies surveyed
invested during the 1st quarter of 2015, which is 2 pp smaller
than the indicator reported in the same reference period last
year.
14 The private spending, private consumption and private investment data for the 1st quarter 2015 are the Central Bank estimates based on the actual 4th quarter 2014 data. Growth estimates in this sub-section are relative to the same reference period last year, unless otherwise specified. 15 See https://www.cba.am/am/SitePages/statsscci.aspx.
?
In the 1st quarter of 2015, private consumption will slow down by 1.3% and private investment, by
7.4%.
-21
-13
-5
3
11
19
I 12 II III
IV
I 13 II III
IV
I 14 II III
IV
I 15
Industry Agriculture
Construction Services
Tax on manufacture GDP
Actual real GDP and economi c s ecto r
cumu l ati ve growth rates , y /y , %
estimate

24
With private consumption and investment developments
described above, private spending contracted by 2.1% in the 1st
quarter, which, coupled with a 2.2% increase in public
expenditures, pushed the domestic demand down by 1.4%.
In the 1st quarter of 2015, the private spending gap is
estimated negative, and it left 1.0 pp - 1.2 pp of contractionary
impact on the inflation.
The information on foreign trade developments during the 1st
quarter of 2015 is not complete due to shortage in compiling of
trade indicators.
In the 1st quarter of 2015, the net inflow of non-commercial
remittances of individuals via the banking system slowed down
by as much as 48.0% against the same reference period last
year due to an abrupt depreciation of the Russian ruble against
the U.S. dollar amid unfavorable developments in the Russian
economy.
3.2.3. Labor market16
In the 1st quarter of 2015, the average nominal wage growth
rate run slightly above former forecasts of the Central Bank,
amounting to 10.6%. In the period under review, the growth rate
in wages of public sector has been slightly faster than the wage
growth in the private sector.
The wage increase in some areas of the public sector since
July of 2014 has pushed the average public sector wage up to
persist above the post-crisis level over the second half of 2014
and the 1st quarter of 2015. As a result, the average annual
wage growth in the public sector in the 1st quarter was 13.7%.
In the 1st quarter of 2015, the average nominal wage growth
rate in the private sector was 7.1%, somewhat slower than the
wage growth of 7.4% recorded in the previous year, due to a
relatively weak economic activity.
A sluggish economic activity recorded in the 4th quarter of
2014 and the 1st quarter of 2015 dragged the demand for labor
market behind the supply for that market. This trend has been
observable since the 1st quarter and grown deeper later in 2014
and the 1st quarter of 2015. As a result, in the 1st quarter of
2015, relative to the same reference period last year, the
unemployment rate has grown by 1.4 pp to 19.2%. Compared to
previous forecasts, the unemployment rate is somewhat lower in
the 1st quarter as the economic activity is slightly higher from
the expectations.
In the period under review, the wage growth has been in line
with the productivity indictor, so the labor market’s impact on
the inflation during the 1st quarter of 2015 is estimated neutral.
16 The labor market data for the 1st quarter of 2015 are the Central Bank estimates which are based on the 4th quarter of 2014 data and actual January-February 2015 figures. The growth indicators represented in this sub-section are relative to the same reference period last year, unless otherwise specified.
-20%
-15%
-10%
-5%
0%
5%
10%
15%
I 13 II III IV I 14 II III IV I 15
Private consumption growth Private investment growth
Pri vate cons ump ti on and i n ves tmen t growth ,
y /y
0%
5%
10%
15%
20%
M
14
A M J J A S O N D J
15
F
Private Public Total
Nomi nal wage growth , y /y

25
3.2.4. Fiscal policy17
In the 1st quarter of 2015, the State Budget performed with
revenues collected in proportion to quarterly projections and
resources saved on certain expenditure items. The fiscal sector’s
impact on aggregate demand was slightly more than projected,
making up 2.4 expansionary. The revenue impulse was 0.4
expansionary and the expenditure impulse, 2.0 expansionary.
In the period under review, relative to the same reference
period last year, revenues of the consolidated budget have
grown by 3.5% mainly owing to tax receipts. Compared to the
1st quarter of 2014, tax revenue and state duty have grown by
3.8% largely due to income tax and customs duty. As a result,
the state budget over-performed the quarterly projection by
0.3% for tax and state duty. In the 1st quarter of 2015, relative
to the same reference period last year, indirect taxes and direct
taxes have grown by 3.5% and 4.3% but other tax revenues
decreased by 2.7%, respectively, in the tax and duty portfolio of
the consolidated budget. Moreover, the share of indirect taxes
and direct taxes has grown by 0.1 pp and 0.4 pp to 52.8% and
39.4% but the share of other taxes reduced by 0.4 pp to 7.8%,
respectively.
Other revenues posted a 40.1% increase in comparison with
the same reference period last year thus outstripping the
quarterly projection.
In the 1st quarter of 2015, actual expenditures amounted to
89.9% of the program specified for the quarter. However,
compared to the same reference period last year, consolidated
budget posted a 14.2% growth of expenditures mainly due to
current expenditures. In the current expenditures structure,
public consumption has grown by 24.4% compared to the same
reference period last year. The item “transactions with non-
financial assets” posted a 7.5% decrease due to reduced
spending under both foreign-funded and domestic projects.
With revenues and expenditures figures shown above, the
state budget reported a deficit of AMD 22.2 billion for the 1st
quarter of 2015 instead of AMD 51.3 billion projected for the
quarter under an adjusted plan. The deficit has been fully
financed by external sources.
The placement of foreign currency government bonds
brought in AMD 229.9 billion worth of proceeds for the state
budget in the 1st quarter of 2015, of which AMD 94.2 billion
was spent to repurchase the foreign currency government bonds
issued back in 2013. The said placement and repurchase of
government bonds have generated free domestic resources.
In the 1st quarter of 2015, the fiscal policy had an
expansionary impact on aggregate demand due primarily to
increased costs.
17 The review of the fiscal sector was done using the preliminary actual consolidated budget indicators prepared on the basis of the preliminary actual indicators of the 1st quarter of 2015 (PIU funds included), excluding off-budgetary funds. The impact of revenues was calculated in respect of the nominal GDP indicator while the impact of expenditures, in respect of the estimated economic potential.
In the 1st quarter of 2015, the fiscal policy’s impact on aggregate demand was 2.4
expansionary.
-3.4-2.9
-2.0
-0.5
1.5
0.2
2.41.9
3.0
-6
-4
-2
0
2
4
I 13 II III IV I 14 II III IV I 15
Revenue impulse Expenditure impulse
Fiscal impulse
In the 1s t quarter, the f i s cal po l i cy ' s i mpact
i s expans i onary due to expans i onary effect
o f expend i tu res
%
-50000
0
50000
100000
150000
200000
250000
300000
I 15 I 14 I 13
Revenues and grants of consolidated budget
Expenditures of consolidated budget
Deficit of budget, deficit (-) surplus (+)
Cons o l i d ated budget i nd i cato rs
billion AMD
0
20000
40000
60000
80000
100000
120000
140000
Public
consum
ption
Inte
rest
fees
Socia
l
benefits
and
pensio
n
Subsid
ies
Tra
nsfe
rs
Tra
nsactions
on n
on-
financia
l
I 15 I 14
In the 1s t quarter, budget expend i tu res
pos ted an i n creas e i n cu rren t expend i tu res
billion AMD

26
Summary: reduced private transfers from Russia as well as
sluggish investment activity in the domestic economy pushed
private spending down in the 1st quarter of 2015. However, the
contraction of expenditures in private sector has diminished
owing to lagged impact of the expansionary monetary and fiscal
policies implemented in the course of 2014 and, particularly,
new fiscal and monetary incentives provided to the domestic
economy in the 1st quarter of 2015, which, in turn, mitigated
the domestic economic slowdown and the deflationary
environment.
In the 1st quarter of 2015, the private spending gap is
estimated to be negative. Given also the behavior of the labor
market and public expenditures, it is estimated that the above
factors combined created 0.4 pp - 0.5 pp of deflationary
pressures in the consumer market in the 1st quarter of 2015.
3.3. Money and f inancial market developments
3.3.1. Financial market, money and credit
In pursuit of its statements made with the aim to ease the
tension and stabilize the situation in the domestic financial
market resulted from the events in late 2014, the Central Bank
looked to change the interest rates more often during the 1st
quarter of 2015. The financial market saw at the time high
interest rates closer to the Lombard Repo Facility Rate of the
Central Bank. In view of achieving lower interest rates along with
financial market stabilization, the Central Bank gradually
reduced the Lombard Repo Facility Rate from 20% to 12%
during the 1st quarter of 2015. However, driven by investment
risks and growing interest rate trends in developing countries,
the Central Bank raised the Refinancing Rate in January and
February each time by 1 pp to 10.5%. This action helped the
Lombard Repo Facility Rate to again uphold an accepted 1.5
percentage point spread from the Refinancing Rate and reduce
the spread between the policy rate and short-term market rates
in order to restore the leading role of the Refinancing Rate in the
market thus contributing to the stabilization of the financial
market and fulfillment of the inflation target in the medium run.
The actions successfully taken by the Central Bank during the
quarter to weather the tension spilled over from the outside
world in November-December 2014 brought about reduced
short-term interest rates, on the one hand, and relatively a stable
domestic exchange rate behavior, on the other.
In the 1st quarter of 2015, the 7-day Repo Rate, the main
policy instrument of the Central Bank, floated around the
Lombard Repo Facility Rate of the Central Bank. As a result, the
average March rate has reduced by 7.4 pp against December
and amounted to 13.16%.
-20000 -15000-10000 -5000 0 5000 10000 15000
IV 14
IV 13
External sources Other domestic sources
Government securities
The 1s t quarter s aw a budget defi c i t , un l i ke
f i rs t quarters o f the l as t two y ears (billion
AMD)
468
101214161820222426
02/0
4/2
014
24/0
4/2
014
16/0
5/2
014
07/0
6/2
014
29/0
6/2
014
21/0
7/2
014
12/0
8/2
014
03/0
9/2
014
25/0
9/2
014
17/1
0/2
014
08/1
1/2
014
30/1
1/2
014
22/1
2/2
014
13/0
1/2
015
04/0
2/2
015
26/0
2/2
015
20/0
3/2
015
Average repo of CBA Interbank repo
Overnight credit CBA refinancing
CBA deposit facility CBA lombard facility
In the 1s t quarter, s ho rt -term i n teres t rates
came i n around l obmard repo fac i l i ty rate o f
the Cen tral Bank
%

27
Operations carried out by the Central Bank (average value)
Period Repo (up to 7 days) Funds attracted Lombard repo
Value (million
AMD)
Weighted average
%
Value (million
AMD)
Weighted average
%
Value (million
AMD)
Weighted average
%
Q1 2013 63652.16 8.09 2518.46 6.50 14.53 9.50
Q2 71467.51 8.19 2712.31 6.50 45.74 9.50
Q3 86238.94 8.42 2712.31 6.75 20.30 9.50
Q4 76070.53 8.31 6035.38 6.71 7.69 10.0
Q1 2014 58769.52 7.80 8230.77 6.17 297.76 9.05
Q2 41619.24 7.79 9908.46 5.88 41.38 8.75
Q3 37331.05 7.16 3270.00 5.47 16.08 8.43
Q4 34048.94 10.60 1765.67 5.25 41550.14 19.69
Q1 2015 95454.55 14.25 63.75 8.04 104521.49 16.27
The situation in the financial market in the 1st quarter of
2015 was consistent with the policy of the Central Bank. There
were only few transactions executed in the interbank market at
the time, and it was difficult for the Central Bank to identify the
short-term interest rate. However, the volume of transactions in
the interbank repo market was maintained, and gradual lowering
of interest rate of the Lombard Repo Facility by the Central Bank
prompted a phase by phase reduction of interest rates in the
interbank market. The average monthly rate decline in March
was nearly 7 pp against December.
Box 2
Government securities market
The situation in the financial market certainly affected the
government bonds’ market. The average quarterly yield of short-
term T-bills has grown by 7.6 pp to 14.7% in relation to the
previous quarter and the March yield of mid-term notes and long-
term bonds has increased by about 2.0 pp against the December
yield.
The financial market turmoil in November-December 2014 did
not have a significant impact on the secondary market of
government bonds on the market perhaps due to the lack of
transactions in the market. Though in December, compared to
November, the yield curve rose by around 2.0 pp the entire length,
it did not, however, reflect the developments in the financial
markets. The situation changed in January and February when the
curve came in inverted as a result of new issues of short-term
bonds, reflecting market participants’ high risks to the current
uncertainties in the short term segment. Along with stabilizing
financial market, the situation normalized in the bonds market, as
in the end of the quarter the yield curve got back to its original
shape of upslope. In late March, compared to December, the total
yield curve indicator has grown: the long-term interest rate reached
14.9%, up by 0.5 pp, while the long-term and short-term interest
rates spread narrowed in March by 4.0 pp to 1.6 pp.
-50000
0
50000
100000
150000
200000
250000
J
12
M M J S N J
13
M M J S N J
14
M M J S N J
15
M
Deposit
Deposit auctions
Reverse repo
Foreign currency swap (attraction)
Repo (up to 7 days)
Lombard repo
Structured repo (91-day)
Foreign currency swap (allocation)
Net liquidity
Operati ons carri ed ou t by the Cen tral Bank
(average mon th l y vo l ume)
million AMD
6
9
12
15
18
21
24
D
13
J
14
F M A M J J A S O N D F
15
M
T-bills (up to 1-year) Interbank repo Overnight
Sho rt-term i n teres t rates du ri n g the 1s t
quarter
%
5
7
9
11
13
15
17
0 1 2 3 4 5 6 7 8 9 10 11 1213 1415 1617 1819 20
N 14 D 14 F 15 M 15
In the T-b i l l s market i n the 1s t quarter,
i n teres t rates ro s e
Due to maturity,
%
Period (year)
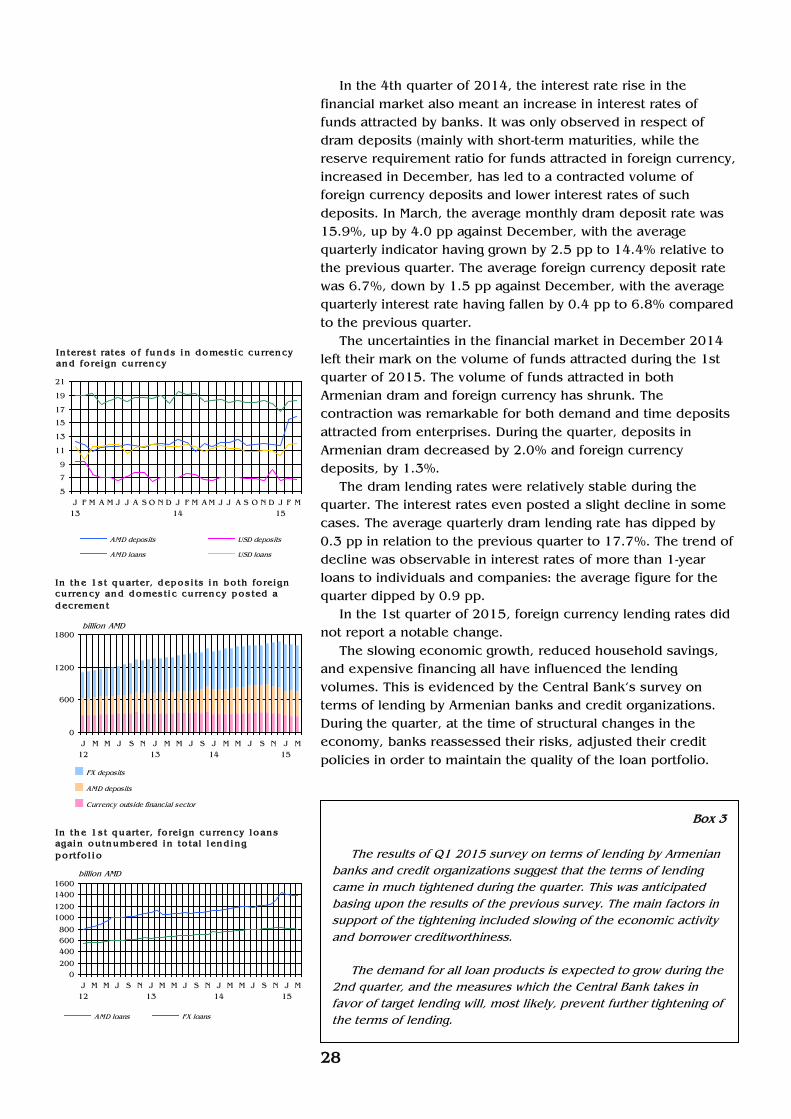
28
In the 4th quarter of 2014, the interest rate rise in the
financial market also meant an increase in interest rates of
funds attracted by banks. It was only observed in respect of
dram deposits (mainly with short-term maturities, while the
reserve requirement ratio for funds attracted in foreign currency,
increased in December, has led to a contracted volume of
foreign currency deposits and lower interest rates of such
deposits. In March, the average monthly dram deposit rate was
15.9%, up by 4.0 pp against December, with the average
quarterly indicator having grown by 2.5 pp to 14.4% relative to
the previous quarter. The average foreign currency deposit rate
was 6.7%, down by 1.5 pp against December, with the average
quarterly interest rate having fallen by 0.4 pp to 6.8% compared
to the previous quarter.
The uncertainties in the financial market in December 2014
left their mark on the volume of funds attracted during the 1st
quarter of 2015. The volume of funds attracted in both
Armenian dram and foreign currency has shrunk. The
contraction was remarkable for both demand and time deposits
attracted from enterprises. During the quarter, deposits in
Armenian dram decreased by 2.0% and foreign currency
deposits, by 1.3%.
The dram lending rates were relatively stable during the
quarter. The interest rates even posted a slight decline in some
cases. The average quarterly dram lending rate has dipped by
0.3 pp in relation to the previous quarter to 17.7%. The trend of
decline was observable in interest rates of more than 1-year
loans to individuals and companies: the average figure for the
quarter dipped by 0.9 pp.
In the 1st quarter of 2015, foreign currency lending rates did
not report a notable change.
The slowing economic growth, reduced household savings,
and expensive financing all have influenced the lending
volumes. This is evidenced by the Central Bank’s survey on
terms of lending by Armenian banks and credit organizations.
During the quarter, at the time of structural changes in the
economy, banks reassessed their risks, adjusted their credit
policies in order to maintain the quality of the loan portfolio.
Box 3
The results of Q1 2015 survey on terms of lending by Armenian
banks and credit organizations suggest that the terms of lending
came in much tightened during the quarter. This was anticipated
basing upon the results of the previous survey. The main factors in
support of the tightening included slowing of the economic activity
and borrower creditworthiness.
The demand for all loan products is expected to grow during the
2nd quarter, and the measures which the Central Bank takes in
favor of target lending will, most likely, prevent further tightening of
the terms of lending.
5
7
9
11
13
15
17
19
21
J
13
F M A M J J A S O N D J
14
F M A M J J A S O N D J
15
F M
AMD deposits USD deposits
AMD loans USD loans
In teres t rates o f funds i n domes ti c cu rrency
and fo rei gn cu rrency
0
600
1200
1800
J
12
M M J S N J
13
M M J S J
14
M M J S N J
15
M
FX deposits
AMD deposits
Currency outside financial sector
In the 1s t quarter, depos i ts i n bo th fo rei gn
cu rrency and domes ti c cu rrency pos ted a
decremen t
billion AMD
0
200
400
600
800
1000
1200
1400
1600
J
12
M M J S N J
13
M M J S N J
14
M M J S N J
15
M
AMD loans FX loans
In the 1s t quarter, fo rei gn cu rrency l o ans
agai n ou tnumbered i n to tal l end i ng
po rtfo l i o
billion AMD
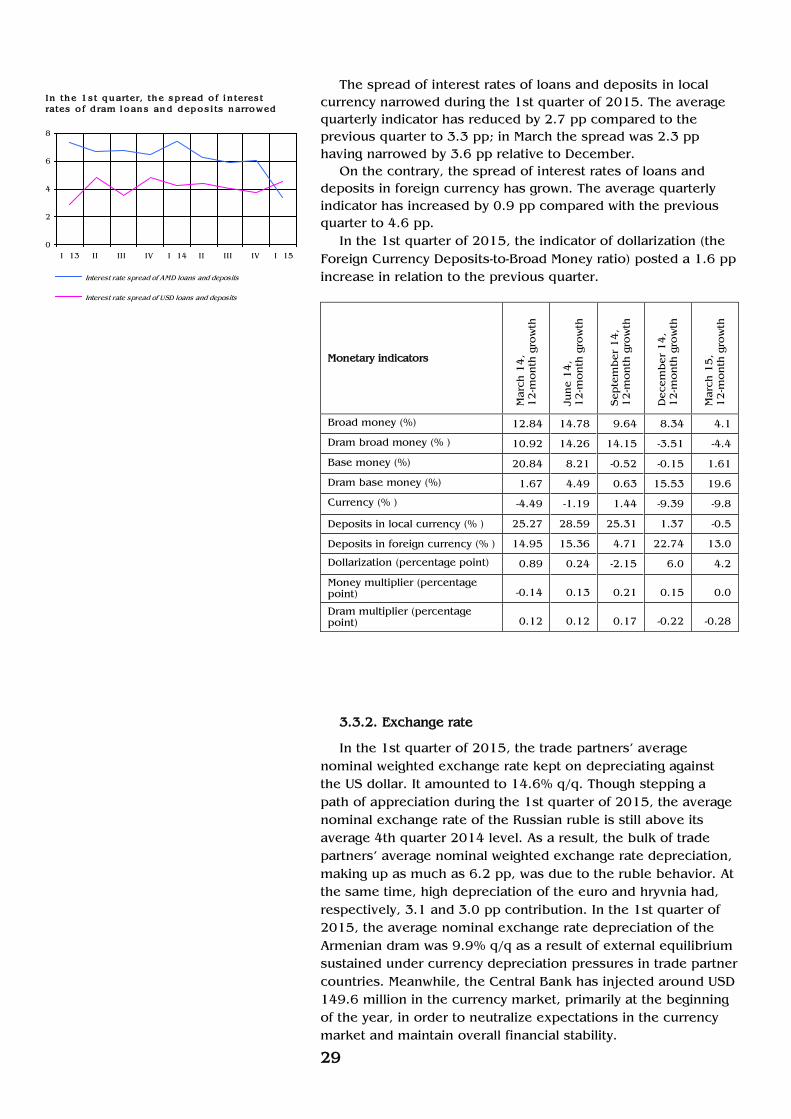
29
The spread of interest rates of loans and deposits in local
currency narrowed during the 1st quarter of 2015. The average
quarterly indicator has reduced by 2.7 pp compared to the
previous quarter to 3.3 pp; in March the spread was 2.3 pp
having narrowed by 3.6 pp relative to December.
On the contrary, the spread of interest rates of loans and
deposits in foreign currency has grown. The average quarterly
indicator has increased by 0.9 pp compared with the previous
quarter to 4.6 pp.
In the 1st quarter of 2015, the indicator of dollarization (the
Foreign Currency Deposits-to-Broad Money ratio) posted a 1.6 pp
increase in relation to the previous quarter.
Monetary indicators
Marc
h 1
4,
12
-month
gro
wth
June 1
4,
12
-month
gro
wth
Septe
mber
14
, 1
2-m
onth
gro
wth
Decem
ber
14
,
12
-month
gro
wth
Marc
h 1
5,
12
-month
gro
wth
Broad money (%) 12.84 14.78 9.64 8.34 4.1
Dram broad money (% ) 10.92 14.26 14.15 -3.51 -4.4
Base money (%) 20.84 8.21 -0.52 -0.15 1.61
Dram base money (%) 1.67 4.49 0.63 15.53 19.6
Currency (% ) -4.49 -1.19 1.44 -9.39 -9.8
Deposits in local currency (% ) 25.27 28.59 25.31 1.37 -0.5
Deposits in foreign currency (% ) 14.95 15.36 4.71 22.74 13.0
Dollarization (percentage point) 0.89 0.24 -2.15 6.0 4.2
Money multiplier (percentage point) -0.14 0.13 0.21 0.15 0.0
Dram multiplier (percentage point) 0.12 0.12 0.17 -0.22 -0.28
3.3.2. Exchange rate
In the 1st quarter of 2015, the trade partners’ average
nominal weighted exchange rate kept on depreciating against
the US dollar. It amounted to 14.6% q/q. Though stepping a
path of appreciation during the 1st quarter of 2015, the average
nominal exchange rate of the Russian ruble is still above its
average 4th quarter 2014 level. As a result, the bulk of trade
partners’ average nominal weighted exchange rate depreciation,
making up as much as 6.2 pp, was due to the ruble behavior. At
the same time, high depreciation of the euro and hryvnia had,
respectively, 3.1 and 3.0 pp contribution. In the 1st quarter of
2015, the average nominal exchange rate depreciation of the
Armenian dram was 9.9% q/q as a result of external equilibrium
sustained under currency depreciation pressures in trade partner
countries. Meanwhile, the Central Bank has injected around USD
149.6 million in the currency market, primarily at the beginning
of the year, in order to neutralize expectations in the currency
market and maintain overall financial stability.
0
2
4
6
8
I 13 II III IV I 14 II III IV I 15
Interest rate spread of AMD loans and deposits
Interest rate spread of USD loans and deposits
In the 1s t quarter, the s p read o f i n teres t
rates o f d ram l oans and depos i ts narrowed

30
Influenced by dramatic currency depreciation in trade
partners, the nominal effective exchange rate of the Armenian
dram posted 3.5% appreciation q/q and the real effective
exchange rate18, 5.6% appreciation q/q during the 1st quarter of
2015. The 11.6% y/y appreciation of the real effective exchange
rate was attributable to the average nominal weighted exchange
rate highly depreciated in trade partner countries since the end
of the previous year.
y/y growth, %
Q1, 2
01
3
Q2
Q3
Q4
Q1, 2
01
4
Q2
Q3
Q4
Q1, 20
15
Real effective exchange rate (+ means appreciation) -6.4 -1.6 7.9 6.8 8.5 7.8 3.1 9.2 11.6
Average inflation in Armenia 3.0 5.2 8.7 6.4 4.6 3.3 1.0 3.2 5.2
AMD/USD average nominal exchange rate (+ means appreciation) -5.1 -3.3 0.5 0.2 -0.4 0.5 0.0 -5.7 -13.9
Average weighted inflation in trade partner countries 4.5 4.4 4.3 4.0 3.7 4.4 4.6 5.1 6.7
Trade partners’ average weighted nominal exchange rate (+ means appreciation versus dollar) -0.4 -1.1 -3.2 -4.3 -8.0 -8.6 -7.0 -18.5 -32.1
Real exchange rate appreciation = Inflation in Armenia + Nominal exchange
rate appreciation – Trade partners’ average weighted inflation – Trade partners’
average nominal weighted exchange rate appreciation.
Box 4 Foreign exchange market
As of end Q1 2015, the average market exchange rate of
AMD/USD was 471.13, having appreciated by 0.82% relative to the
end of the previous quarter.
The table shows the Armenian dram’s behavior versus the U.S. dollar, Euro and Russian ruble during the 1st quarter of 2015:
The Armenian dram’s exchange rate, q/q
Currency pair
Exchange rate as of 30.12.2014
(AMD)
Exchange rate as of 31.03.2015
(AMD)
% (appreciation “+”, depreciation “-“)
USD/AMD 474.97 471.13 +0.82
EUR/AMD 577.47 505.29 +14.28
RUB/AMD 8.15 8.13 +0.25
The Armenian dram’s average exchange rate, y/y
Currency pair Average exchange rate,
Q1, 2014
Average exchange rate,
Q1, 2015
% (appreciation “+”, depreciation “-“)
USD/AMD 411.05 477.26 -13.87
EUR/AMD 562.97 538.40 +4.56
RUB/AMD 11.72 7.61 +54.01
18 The 1st quarter 2015 indicator of the real exchange rate is the Central Bank estimate.
-25
-15
-5
5
15
25
I
06
III I
07
III I
08
III I
09
III I
10
III I
11
III I
12
III I
13
III I
14
III I
15
Real effective exchange rate
Nominal effective exchange rate
In the 1s t quarter, real effecti ve exchange
rate app rec i ated y /y , (%)
300
350
400
450
500
550
600
650
700
08.0
1.1
4
07.0
2.1
4
10.0
3.1
4
08.0
4.1
4
13.0
5.1
4
11.0
6.1
4
10.0
7.1
4
08.0
8.1
4
08.0
9.1
4
07.1
0.1
4
05.1
1.1
4
04.1
2.1
4
12.0
1.1
5
11.0
2.1
5
12.0
3.1
5
7.0
8.0
9.0
10.0
11.0
12.0
13.0
14.0
USD/AMD EUR/AMD RUB/AMD
Armen i an d ram exchange rate vers u s US
do l l ar, Eu ro and Rus s i an rub l e
USD/AMD
EUR/AMD RUB/AMD

31
The aggregate volume of U.S. dollar/Armenian dram transactions
in the foreign exchange market during the 1st quarter of 2015
amounted to USD 2.45 billion, which represents an 11.55%
decrease in relation to USD 2.77 billion reported in the same
reference period last year.
The aggregate volume of Euro/Armenian dram transactions
carried out during the quarter reached EUR 199.42 million against
EUR 192.7 million recorded in the 1st quarter of 2014.
The aggregate volume of Russian ruble/Armenian dram
transactions in the 1st quarter of 2015 totaled RUB 9.6 billion,
which represents a 5.5% growth y/y compared to RUB 9.1 billion
recorded in the 1st quarter of 2014.
3.4. Balance of payments 19
The information on developments in foreign trade during the
1st quarter of 2015 is not complete due to shortage in compiling
of trade indicators, and export and import figures by commodity
group are not presented in the report, as a result. The overall
export and import figures are the forecasts set out in the
previous quarter’s program, adjusted to actual developments in
dollar prices of export and import.
In the 1st quarter of 2015, the declining rates in remittances
of individuals remained high, since the Russian ruble further felt
the effect of steep exchange rate depreciation against the U.S.
dollar, compared to the same reference period last year, in the
course of adverse developments in the Russian economy. The
current account deficit reduction on the back of the
aforementioned developments and forecasts was mainly
attributable to the narrowed trade balance deficit. The 1st
quarter also saw the placement of Eurobonds by the Armenian
Government, resulting in a large net inflow of funds through the
Capital and Financial Account. Net foreign assets of the Central
Bank have grown as a result of the balance of payment
developments.
3.4.1. Current account
In the 1st quarter of 2015, relative to the same reference
period last year, the current account deficit has reduced by USD
175.5 million to USD 271.5 million, which was determined by a
large one-off transaction in the item “Income on investment”
carried out during the 1st quarter of the previous year.
According to the 1st quarter 2015 forecasts, the export of
goods has decreased by 11.2% y/y and the import of goods, by
22.6% y/y, reflecting a notable drop in export and import
prices20.
19 The 1st quarter 2015 indicators are the Central Bank forecasts and estimates. 20 The dollar prices of export and import reported considerable decrement in the 1st quarter of 2015, according to the Central Bank estimates.
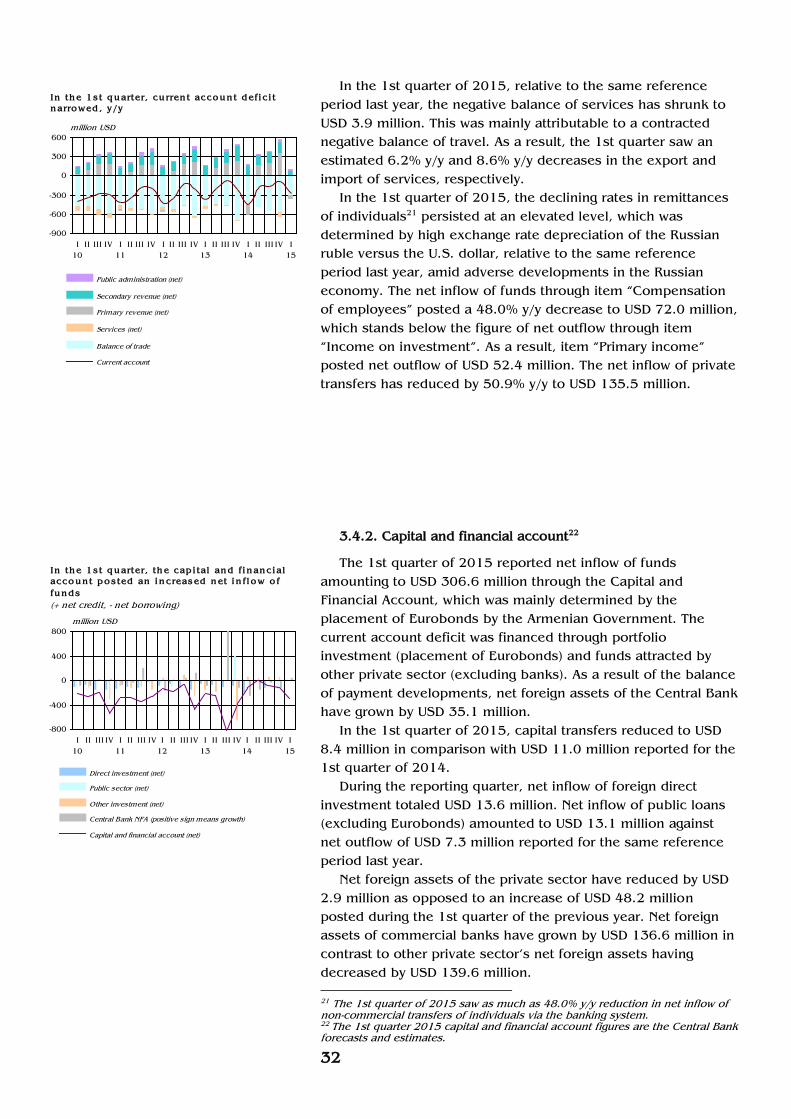
32
In the 1st quarter of 2015, relative to the same reference
period last year, the negative balance of services has shrunk to
USD 3.9 million. This was mainly attributable to a contracted
negative balance of travel. As a result, the 1st quarter saw an
estimated 6.2% y/y and 8.6% y/y decreases in the export and
import of services, respectively.
In the 1st quarter of 2015, the declining rates in remittances
of individuals21 persisted at an elevated level, which was
determined by high exchange rate depreciation of the Russian
ruble versus the U.S. dollar, relative to the same reference
period last year, amid adverse developments in the Russian
economy. The net inflow of funds through item “Compensation
of employees” posted a 48.0% y/y decrease to USD 72.0 million,
which stands below the figure of net outflow through item
“Income on investment”. As a result, item “Primary income”
posted net outflow of USD 52.4 million. The net inflow of private
transfers has reduced by 50.9% y/y to USD 135.5 million.
3.4.2. Capital and financial account22
The 1st quarter of 2015 reported net inflow of funds
amounting to USD 306.6 million through the Capital and
Financial Account, which was mainly determined by the
placement of Eurobonds by the Armenian Government. The
current account deficit was financed through portfolio
investment (placement of Eurobonds) and funds attracted by
other private sector (excluding banks). As a result of the balance
of payment developments, net foreign assets of the Central Bank
have grown by USD 35.1 million.
In the 1st quarter of 2015, capital transfers reduced to USD
8.4 million in comparison with USD 11.0 million reported for the
1st quarter of 2014.
During the reporting quarter, net inflow of foreign direct
investment totaled USD 13.6 million. Net inflow of public loans
(excluding Eurobonds) amounted to USD 13.1 million against
net outflow of USD 7.3 million reported for the same reference
period last year.
Net foreign assets of the private sector have reduced by USD
2.9 million as opposed to an increase of USD 48.2 million
posted during the 1st quarter of the previous year. Net foreign
assets of commercial banks have grown by USD 136.6 million in
contrast to other private sector’s net foreign assets having
decreased by USD 139.6 million.
21 The 1st quarter of 2015 saw as much as 48.0% y/y reduction in net inflow of non-commercial transfers of individuals via the banking system. 22 The 1st quarter 2015 capital and financial account figures are the Central Bank forecasts and estimates.
-900
-600
-300
0
300
600
I
10
II III IV I
11
II III IV I
12
II III IV I
13
II III IV I
14
II III IV I
15
Public administration (net)
Secondary revenue (net)
Primary revenue (net)
Services (net)
Balance of trade
Current account
In the 1s t quarter, cu rren t accoun t defi c i t
n arrowed , y /y
million USD
-800
-400
0
400
800
I
10
II III IV I
11
II III IV I
12
II III IV I
13
II III IV I
14
II III IV I
15
Direct investment (net)
Public sector (net)
Other investment (net)
Central Bank NFA (positive sign means growth)
Capital and financial account (net)
In the 1s t quarter, the cap i tal and f i n anc i al
accoun t pos ted an i n creas ed net i n fl ow o f
funds
(+ net credit, - net borrowing)
million USD

33
3.5. External environment
A slow growth of economic activity was observable in
Armenia’s main trade partner countries during the 1st quarter of
2015, too.
According to preliminary estimates of the U.S. Department of
Commerce Bureau of Economic Analyses, in the United States of
America in the 1st quarter of 2014 the annualized economic
growth was 0.2% q/q instead of the previous quarter’s 2.2%
growth (3.0% y/y economic growth was recorded in the 1st
quarter). The slowing of the growth in the 1st quarter was mainly
driven by reduced private spending, slowed down exports,
investment and public expenditures. These were only partly
offset by slowing imports and added private investment in
inventories.
There was average quarterly deflation of 0.06% y/y in the
U.S.A during the 1st quarter of 2015 against 1.2% inflation
recorded in the previous quarter. The inflation rate persisted
below its target due in part to decreased prices of oil products
and imported non-oil products. In the 1st quarter of 2015, the
U.S. Fed kept the policy rates in the range of 0%-0.25%.
In Eurozone in the 1st quarter of 2015, there was 1.0%
economic growth relative to the same reference period last year,
according to preliminary estimates provided by the Eurostat. The
reporting quarter also saw an average 0.3% deflation y/y against
0.2% inflation recorded in the previous quarter.
In the 1st quarter of 2015, the European Central Bank kept
the policy rate at 0.05% and the deposit facility rate at 0.2%
levels. In addition to the program for buying asset-backed
securities and covered bonds launched in late 2014, the ECB
started another program in early 2015 aimed at buying
sovereign bonds, with a total monthly purchase volume reaching
EUR 60 billion.
In the currency market in the 1st quarter of 2015, Euro
depreciated versus the U.S. dollar by 9.8% (y/y depreciation was
17.8%), with the average dollar exchange rate reaching 1.126
for one Euro.
In Russia in the 1st quarter of 2015, the economy posted
1.9% decline y/y, according to the preliminary estimates of the
Russia State Statistics Service. This was the first decline after
2009, which was driven by the effect of plunged oil price and
applied sanctions. However, based on annual results, positive
developments were reported in processing industry and
construction, with 2.1% and 1.1% growths reported there,
whereas agriculture posted a 5.7% decline. In the time of
slackened economic activity, consumption growth rates slowed
down to 1.3% compared to the previous 1st quarter’s 1.5%
growth and aggregate investment reduced further, amounting to
6.0% against the previous quarter’s 2.8% decline.
Consumer Price Index in Russia posted an average 16.2% y/y
growth (compared to a 9.6% growth last quarter) on the back of
as much as 43.8% y/y depreciation of the ruble in the 1st
quarter of 2015. In view of fewer risks to inflation yet persisting
risks to a significant slowdown in economic growth, the Central
Bank of Russia cut the policy rate to 14.0% in the 1st quarter of
2015 from 17.0% in the end of the previous quarter.
-6
-4
-2
0
2
4
I
09
II III IV I
10
II III IV I
11
II III IV I
12
II III IV I
13
II III IV I
14
II III IV I
15
Economic growth Average quarterly inflation
Defl ati on was reco rded i n the USA i n the 1s t
quarter
%
-6
-4
-2
0
2
4
I
09
II III IV I
10
II III IV I
11
II III IV I
12
II III IV I
13
II III IV I
14
II III IV
Economic growth Average quarterly inflation
In Eu ro z one, i n fl at i on s ubdued i n the 1s t
quarter
%

34
In the 1st quarter of 2015, the price of Brent crude at
Intercontinental Exchange plunged by as much as 25.6% against
the previous quarter to roughly USD 54.0 a barrel (with 49.5% y/y
decrease), amidst increased U.S. extraction volumes and relevant
anticipations in the financial markets.
In the 1st quarter of 2015, the price of copper at the London
Metal Exchange fell by 11.7% (with 17.1% decline y/y) to USD
5801 per ton on average. The drop in the price was explained by
the slowing of demand in China, on the one hand, and the
effects of appreciating U.S. dollar, on the other.
In the 1st quarter of 2015, export price of hard red wheat
dropped by 7.4% q/q to USD 6.5 a bushel (with 19.6% decline
y/y), according to the U.S. Department of Agriculture data. The
price fell during the quarter in anticipation of abundant crops
this year.
In the 1st quarter of 2015, the price index of unprocessed
sugar at the New York Board-Intercontinental Exchange reported
a 10.4% fall (with 13.9% decline y/y), mostly attributable to
anticipated abundant crops in Brazil, the main producer of this
commodity, and the Brazilian real’s depreciation against the U.S.
dollar.
In the 1st quarter of 2015, the price of rice at the Chicago
Board of Trade fell by 12.0% to USD 10.9 per U.S.
hundredweight (45.4 kg) (with 29.2% decline y/y) in spite of a
certain reduction in the production volumes. The reduced price
was driven by the slowing demand.
There were further deflationary trends observable in world
commodity and food product markets during the 1st quarter of
2015, primarily attributable to a low level of global demand,
appreciating U.S. dollar as well as world food markets’
anticipations for heavy crops.
Substantial deflationary patterns were observable in world commodity and food product markets
during the 1st quarter of 2015 primarily driven by sluggish global demand, appreciating U.S. dollar
and anticipations for abundant harvest.
35
4 . C O N C L U S I O N
In the external sector in the 1st quarter of 2015, the external
demand remained sluggish while deflationary patterns were
observable in basic commodity and food product markets of the
world. In the forecast horizon, considerable inflationary
pressures from the external environment are not likely.
In the 1st quarter of 2015, the economic activity accelerated
to some extent owing to more-than-expected growth in
agricultural output and a lesser decline in construction. Under
this circumstance, the economic growth in the 1st quarter of
2015 is estimated in the range of 2.1%-2.5%.
In the forecast horizon, the economic growth rates will persist
at the same level, and then the growth will gradually approach
its long-term equilibrium, determined by a bunch of programs
the Government plans to carry out in the tradable sector and
continued improvement in external economic environment. In
the forecast horizon, the impact of the domestic economy on
aggregate demand will be non-inflationary as a result of
stabilizing private demand as well as mostly a neutral impact of
the fiscal policy.
In the 1st quarter of 2015, the 12-month inflation rate
behaved cumulatively; at the end of March the 12-month
inflation rate was 5.8%, staying around the upper bound of the
confidence band.
In the forecast horizon, the 12-month inflation rate will
stabilize around the 4% target. The probable rise in electricity
price in the upcoming period will prompt the 12-month inflation
rate to remain around the upper bound of the confidence band
in the course of 2015. Then it will reduce gradually fuelled by a
greater seasonal drop in food prices owing to positive
developments in agriculture as well as expected weak demand
in both external and domestic sectors.
The Central Bank estimates that keeping the Refinancing
Rate’s current level in the 2nd quarter of 2015 would facilitate
the 12-month inflation to stabilize around the target since 2016.
Later, as economic developments unfold, the Central Bank will
adjust its monetary policy directions, while fulfilling the inflation
target in the medium-term perspective.
Risks to inflation deviating from the projected value are
estimated as balanced in both short and medium-term
perspectives. External sector risks are primarily associated with
global economic growth rates bouncing back as well as price
developments in world commodity and food product markets.
Risks deriving from the domestic environment are attributable to
the pace at which the domestic demand would recover, the
Government-led projects, economic effects from regional
integration processes as well as the developments in agriculture
sector which is largely reliant on weather conditions. At the
same time, the lack of information about the size and timing of
possible increase in electricity tariffs adds to the uncertainties
over inflation developments. If such risks materialize, the
Central Bank will react accordingly by maintaining the inflation
target in the medium run.

36
The Central Bank of the Republic of Armenia
Yerevan - 0010, V. Sargsyan 6. http:// www.cba.am