INFLATION ANALYSIS AND PRICE SITUATION
67
VOLUME VOLUME VOLUME VOLUME II MID MID MID MID-OCTOBER OCTOBER OCTOBER OCTOBER 2007 2007 2007 2007 NUMBER NUMBER NUMBER NUMBER 1 INFLATION ANALYSIS AND PRICE SITUATION INFLATION ANALYSIS AND PRICE SITUATION INFLATION ANALYSIS AND PRICE SITUATION INFLATION ANALYSIS AND PRICE SITUATION (Special Issue on Labor Cost and Employment) NEPAL RASTRA BANK RESEARCH DEPARTMENT PRICE DIVISION Baluwatar, Kathmandu Web : www.nrb.org.np Email : [email protected] Phone/Fax: 977-1-4411782
Transcript of INFLATION ANALYSIS AND PRICE SITUATION

VOLUME VOLUME VOLUME VOLUME IIIIIIII MIDMIDMIDMID----OCTOBER OCTOBER OCTOBER OCTOBER 2007200720072007 NUMBER NUMBER NUMBER NUMBER 1111
INFLATION ANALYSIS AND PRICE SITUATIONINFLATION ANALYSIS AND PRICE SITUATIONINFLATION ANALYSIS AND PRICE SITUATIONINFLATION ANALYSIS AND PRICE SITUATION
(Special Issue on Labor Cost and Employment)
NEPAL RASTRA BANK
RESEARCH DEPARTMENT
PRICE DIVISION Baluwatar, Kathmandu
Web : www.nrb.org.np
Email : [email protected]
Phone/Fax: 977-1-4411782
2
CONTENTCONTENTCONTENTCONTENT
1. Price Situation : Mid-October 2007 ( Including Mid-August and Mid-September 2007)
* Consumer Price
* Wholesale Price
* Salary and Wage Rate 2. Boxes
1. Overview of Global Output and Inflation
2a. Annual World Inflation (1991-2006)
2 b. Annual Inflation of SAARC Countries (1991-2006)
3. Inflation in India and Policy Responses
4. Food Prices and Headline Inflation
5. Global Oil Market
6. Global Commodity Market
7. Labor Force and Employment in Different Countries
8. Growth of Employment and Labor Cost in Advanced Economies
9. A Discussion on World Employment
10. Price Collection Centers and Number of Collected Items in Nepal
11. Publication "Inflation in Nepal"
12. Household Budget Surveys and Relative Weights of Different Groups in CPI
13. Computing Consumer Price Index and Core Inflation in Nepal
14. Computing Wholesale Price Index in Nepal
15. Computing Salary and Wage Rate Index in Nepal
16. CPI Matrix of Some Selected Countries
3. Tables
* Consumer Price Index (CPI)
* Wholesale Price Index (WPI)
* Salary and Wage Rate Index (SWRI)
* Average Retail Prices of Selected Commodities in Boarder Markets * Weekly Average Retail Prices of Some Essential Commodities * Average Wage Rates of Nepal (1977/78 – 2006/07)
INFLATION AND PRICE SITUATION : AT A GLANCE
2005/06 2006/07
• World Inflation+
• Inflation in India (based on WPI)*
• Inflation in Nepal (based on CPI)
3.7
4.1
8.0
3.2
5.7
6.4
CPI (Nepal)
• CPI
- Year-on-Year Index
- Change in CPI
• Food and Beverages Group
- Year-on-Year Index
- Change in Index
• Non Food and Services Group
- Year-on-Year Index
- Change in Index
Mid Oct 2006
186.9
7.5
181.9
7.8
192.7 7.2
Mid Oct 2007
198.7 6.3
199.2 9.5
198.2 2.9
WPI and NSWRI (Nepal)
• WPI
- Year-on-Year Index
- Change in Index
• NSWRI
- Year-on-Year Index
- Change in Index
Mid Oct 2006
149.0 10.4
110.4 8.0
Mid Oct 2007
164.3 10.3
123.5 11.9
Note : All Expressed in Percent (Other Than Index) + Calendar Years 2006 and 2007 (Source : IMF) * Source : RBI
Pages
3-6
7-11
12-15
3-4
5
5
6
7
8
9
10
11
12
13
14
15
16
17
18
19-20
1-25
26-32
33-35
36-38
39-44
45

3
INFLATION ANALYSIS AND INFLATION ANALYSIS AND INFLATION ANALYSIS AND INFLATION ANALYSIS AND PRICE SITUATIONPRICE SITUATIONPRICE SITUATIONPRICE SITUATION
Consumer Price
(a) Consumer Price Inflation
The average y-o-y inflation, based on consumer price index,
moderated to 6.3 percent in mid-October 2007 from 7.5 percent
in the corresponding period of the preceding year. This deceleration was on account of the removal of base-effect of the hike in prices of petroleum products in March 2006 and the appreciation of the Nepalese currency against the US dollar.
Likewise, the y-o-y inflation was 7.0 percent in mid-September and
6.3 percent in mid-August 2007. These rates were 6.6 percent and 7.3
percent respectively in the corresponding periods last year.
Box 1 : Overview of Global Output and Inflation Global Output
Following strong growth through the third quarter of 2007, the global economic growth is projected to decelerate from 4.9 percent in 2007 to 4.1 percent in 2008. The projections for the advanced economies have been reduced significantly. Projected growth in the United States in 2008 has been lowered to 1.5 percent on a year-on-year basis, down from 2.2 percent in 2007 because of the weakening of manufacturing, export and housing sector activity, employment, and consumption. In Japan, growth has been dampened by a tightening in building standards, while consumer and business sentiment have weakened. Growth has also slowed in western-Europe, and confidence indicators have deteriorated. Growth in emerging market and developing economies is also expected to ease, moderating from 7.8 percent in 2007 to 6.9 percent in 2008. Despite some slowing of export growth, emerging market and developing economies have thus far continued to expand strongly, led by China and India. These economies have benefited from the strong momentum of domestic demand, more disciplined macroeconomic policy frameworks, and for commodity exporters, from high food and energy prices as well. In China, growth is projected to decelerate from 11.4 percent to 10 percent, which should help alleviate overheating concerns.
(Annual Percentage Change)
Countries
2005
2006
2007
2008*
World Output 4.4 5.0 4.9 4.1 Advanced Economies 2.5 3.0 2.6 1.8 - USA 3.1 2.9 2.2 1.5 - Euro Area 1.5 2.8 2.6 1.6 - UK 1.8 2.8 3.1 2.3 - Japan 1.9 2.4 1.9 1.5 Emerging Markets and Developing Economies 7.0 7.7 7.8 6.9 - Russia 6.4 6.7 7.0 6.5 Developing Asia 9.0 9.6 9.6 8.6 - ASEAN-4 (Indonesia, Thailand, the Philippines, Malaysia) 5.1 5.4 5.6 5.6 - China 10.4 11.1 11.4 10.0 - Afghanistan 14.0 7.5 13.0 8.4 - Bangladesh 6.3 6.4 5.8 6.0
- Bhutan 6.9 11.0 22.4 7.8 - India 9.0 9.7 8.9 8.4 - Maldives -4.5 19.1 5.5 4.5 - Nepal 3.1 2.8 2.5 4.0 - Pakistan 7.7 6.9 6.4 6.5 - Sri Lanka 6.0 7.4 6.5 6.5
Source (Text and Table) : World Economic Outlook (WEO) October 2007 and WEO Update January 2008, IMF * IMF Projections
Global Inflation Inflation has been contained in the advanced economies in 2007. Headline inflation generally edged up in major economies during the third quarter of 2007 mainly reflecting hardening of food and fuel prices in the US, and clothing and education in the euro area. The headline inflation in September 2007 was 2.8 per cent in USA, 1.8 per cent in the UK and 2.1 per cent in the euro area as compared with 2.7 per cent, 2.4 per cent and 1.9 per cent, respectively in June 2007. Inflation fell to 1.8 per cent in August 2007 in the OECD countries from 2.2 per cent in June 2007 and 2.4 per cent in March 2007. Core inflation also remained firm reflecting the combined impact of high commodity prices and strong demand conditions. On the other hand, South Asia has the higher rate of inflation than ASEAN group. The annual average consumer price inflation in some of the major countries are given below:
Consumer Price Inflation
(Annual Percentage Change)
Countries
2005
2006
2007*
Advanced Economies 2.3 2.3 2.1 - USA 3.4 3.2 2.7 - EU 2.3 2.3 2.3 - Japan -0.3 0.3 - ASEAN-4 (Indonesia, Thailand, Philippines, Malaysia) 7.3 8.2 4.0 - China 1.8 1.5 4.5 South Asia 5.0 6.4 6.6 - Afghanistan 12.3 5.1 8.3 - Bangladesh 7.0 6.5 7.2 - Bhutan 5.3 5.0 4.9 - India 4.2 6.1 6.2
- Maldives 3.3 3.7 7.0 - Nepal 4.5 8.0 6.4 - Pakistan 9.3 7.9 7.8 - Sri Lanka 10.6 9.5 17.0
Source (Text and Table) : World Economic Outlook, October 2007, IMF * : Projections
Y-O-Y CPI Inflation
0
2
4
6
8
10
Overall Food and Beverages Non-food and Services
Mid-Oct 2006 Mid-Oct 2007

4
(b) Food and Beverages Group
The y-o-y food and beverages index rose by 9.5 percent in the
review year compared to an increase of 7.8 percent in the
previous year. A significant rise in the prices of vegetables and fruits by 17.7 percent, pulses 14.6 percent, oil and ghee 12.8 percent, and grains and cereal products 11.2 percent exerted a pressure on the prices of this group compared to that of the previous year. However, the prices of sugar and sugar-related products declined by 18.4 percent during this period.
Likewise, the y-o-y index of food and beverages group surged up by
10.9 percent in mid-September and 9.7 percent in mid-August 2007.
These rates in the corresponding period last year were 6.0 percent
and 6.1 percent, respectively.
(c) Non-food and Services Group
The index of non-food and services group rose by 2.9 percent compared to a rise of 7.2 percent last year. This moderation was mainly on account of the elapse of the base effect of previous year's hike in petroleum prices.
Likewise, the index of non-food and services group increased by 2.8 percent each in mid-September and mid-August
2007.These rates were 7.4 and 8.6 percent in the
corresponding periods last year.
Box 1 : Overview of Global Output and Inflation (Contd.....)
In the policy front, many countries like England, Canada, Australia, New Zealand, Norway, Sweden, Korea and China further tightened their monetary policy during this quarter against the backdrop of persistent inflationary pressures represented by core inflation, especially in view of continued strength of demand, ample liquidity and possible pass-through from past and present increases in oil and other commodity prices. The Bank of England raised its policy rate by 25 basis points on July 5, 2007 to 5.75 per cent – a cumulative increase of 125 basis points since the tightening began in August 2006. Likewise, European Central Bank last raised its policy rate by 25 basis points on June 6, 2007 – a cumulative increase of 200 basis points since the tightening began in December 2005. The US Fed Bank cut its target for the federal funds rate by 50 basis points to 4.75 per cent on September 18, 2007. It had kept the rate unchanged since June 2006. The discount rate was also cut by 50 basis points each on August 17, 2007 and September 18, 2007 to 5.25 per cent to improve market liquidity. Japan, on the other hand, raised the un-collateralized overnight call rate by 25 basis points to 0.50 per cent.
CPI (y-o-y) Countries
Key Policy Rate
Policy Rates
(As on October 24, 2007) 2006 September 2007 September
Advanced Economies
- Australia Cash Rate 6.50 (Aug 8, 2006) 4.0 2.1#
- Canada Overnight Rate 4.50 (July 10, 2007) 2.1 1.7*
- Euro area Main Refinancing 4.00 (June 6, 2007) 1.7 2.1
- Japan Overnight Call Rate 0.50 (Feb. 21, 2007) 0.9 -0.2*
- UK Official Bank Rate 5.75 (July 5, 2007) 2.4 1.8
- USA Federal Funds Rate 4.75 (Sep 18, 2007) 2.1 2.8
Developing Economies
- Brazil Selic Rate 11.25 (Sep 5, 2007) 3.7 4.1
- India
- Reverse Repo Rate - Repo Rate
6.00 (July 25, 2006) 7.75 (Mar. 30, 2007)
6.3
7.3*
- China Benchmark 1-year Lending Rate 7.29 (Sep 18, 2007) 1.5 6.2
- Indonesia BI Rate 8.25 (July 5, 2007) 14.5 7.0
- Korea Overnight Call Rate 5.00 (Aug 9, 2007) 2.5 2.3
- Philippines Reverse Repo Rate 5.75 (Oct 4, 2007) 5.7 2.7
- Russia Refinancing Rate 10.00 (Jun 19, 2007) 9.5 9.5
- Thailand 14-day Repo Rate 5.00 (June 7, 2006) 2.7 2.1
Source (Text and Table) : International Monetary Fund, RBI, Websites of Respective Central Banks and the Economist. * Aug 2007 # 2007 Q2 Amongst the major emerging economies, consumer price inflation in China increased to 6.2 per cent in September 2007 (from 4.4 per cent in June 2007 and 1.5 per cent a year earlier) partly on the back of higher food prices. Its GDP growth accelerated to 11.5 per cent during the second quarter of 2007 from 10.9 per cent a year ago. In view of strong growth in money supply and credit, China increased the benchmark 1-year lending rate by 72 basis points since end-June 2007 to 7.29 per cent (27 basis points effective July 21, 2007, 18 basis points effective August 22, 2007 and 27 basis points effective September 18, 2007), a total hike of 171 basis points since April 2006. It raised the CRR by another 150 basis points since end-June 2007 to 13.0 per cent (50 basis points each effective August 15, 2007 and September 25, 2007 and another 50 basis points to be effective October 25, 2007). The CRR in China has, thus, been increased by 550 basis points since July 2006. Regarding other developing countries, Thailand, Indonesia, Turkey and Brazil have eased their monetary policy in view of easing of inflationary pressures.
Indices of Food and Beverages Group
0.0
50.0
100.0
150.0
200.0
250.0
300.0
Mid-Oct 2006 Mid-Oct 2007
Indices of Non-food and Services Group
0
50
100
150
200
250
300
Mid-Oct 2006 Mid-Oct 2007

5
(d) Regional Indices
Region-wise, the price level in Kathmandu Valley, Terai and the Hills
rose by 6.1 percent, 6.5 percent and 6.1 percent respectively in the review
period. Last year, the respective inflation rates were 6.7 percent, 7.8
percent and 7.8 percent. The supply bottleneck-ness due to the continuous unrest contributed for a relatively higher inflation in Terai region, compare to other regions.
Likewise, the price indices of Kathmandu valley, Terai and Hills increased by
6.3 percent, 7.5 percent and 6.8 percent in mid-September 2007 respectively. These rates were 6.0 percent, 6.7 percent and 7.2 percent in the corresponding period last year. In mid-August 2007, the respective regions
recorded the rates of 5.8 percent, 6.8 percent and 6.1 percent as against 6.6 percent, 7.8 percent and 6.9 percent in the corresponding periods last year.
(e) Core CPI inflation
In mid-October, 2007, the y-o-y core inflation decelerated to 4.7 percent
from 6.2 percent a year ago.
Likewise, the y-o-y core inflation was 5.4 percent in mid-September and 5.5 percent in mid-August 2007. The respective rates were 5.6 percent and 5.2 percent in the corresponding periods last year.
Regionwise Consumer Price Indices
165
170
175
180
185
190
195
200
205
210
Overall Kathmandu Terai Hills
Mid-Oct 2006 Mid-Oct 2007
Box 2 (a) : Annual World Inflation (1991-2006) (in percent)
Year World Developed Countries
Transition Countries
Aisa and Pacific
Latin America and Carribean
Sub-Saharian Africa
Middle East and North Africa
1991 18.9 5.5 92.6 13.2 158.3 15.8 13.0
1992 26.8 4.1 567.1 10.2 141.1 22.2 14.0
1993 28.4 3.6 436.7 6.7 183.9 24.2 11.6
1994 28.7 3.7 271.0 8.2 233.5 26.4 16.0
1995 15.0 3.8 128.9 8.7 45.1 28.3 21.5
1996 8.6 3.5 39.6 7.5 19.4 25.3 12.3
1997 6.4 3.2 26.6 6.4 11.9 13.8 6.2
1998 6.3 2.6 20.3 13.3 9.0 9.5 6.7
1999 6.2 2.4 43.8 6.0 8.2 10.0 6.3
2000 5.1 3.3 20.1 3.7 7.5 11.7 4.2
2001 4.4 3.0 16.0 4.9 6.1 11.8 3.8
2002 3.9 2.2 9.9 4.1 9.3 12.8 4.7
2003 4.1 2.3 8.5 3.6 10.9 14.8 5.7
2004 3.8 2.2 8.2 4.2 6.8 11.0 7.6
2005 4.2 2.7 8.3 5.3 6.6 11.5 5.5
2006 3.7 2.5 4.6 6.0 6.0 7.7 5.9
Source : International Labor Organization
The annual world inflation (1991-2006) shows that the highest inflation registered in the world was 28.7 percent in 1994. The two-digit world inflation during 1990-1995 was mainly attributed to the hyper-inflationary pressure in transition economies as well as in Latin American countries. The transition economies and the Latin American countries witnessed almost 3-digit inflation during 1991-1995. Since 1996, the global inflation remained stable with in a range of single digit.
Box 2 (b) : Annual Inflation of SAARC Countries (1991-2006) (in percent)
Year World Bangladesh Bhutan India Maldives Nepal* Pakistan Sri Lanka
1991 18.9 - 12.3 13.8 7.2 9.7 11.9 12.3
1992 26.8 - 16.0 12.0 4.6 21.1 9.5 11.4
1993 28.4 - 11.3 6.7 10.5 8.8 10.0 11.8
1994 28.7 7.4 7.0 9.1 7.4 9.0 12.4 8.6
1995 15.0 10.2 9.5 9.8 6.0 7.7 12.4 7.8
1996 8.6 2.3 8.8 8.7 1.4 8.1 10.4 15.9
1997 6.4 5.1 6.5 7.6 7.6 8.1 11.4 9.7
1998 6.3 8.5 10.6 11.0 -1.3 8.3 6.2 9.5
1999 6.2 6.3 6.8 5.7 3.1 11.4 4.2 4.7
2000 5.1 2.2 4.0 5.2 -1.1 3.5 4.4 6.2
2001 4.4 1.5 3.4 5.4 0.8 2.4 3.2 14.2
2002 3.9 3.8 2.5 4.0 1.0 2.9 4.0 9.5
2003 4.1 5.8 1.6 3.7 -2.8 4.8 2.9 6.4
2004 3.8 6.1 2.7 3.6 6.4 4.0 7.4 7.6
2005 4.2 7.0 5.4 4.5 3.4 4.5 9.1 11.7
2006 3.7 6.2 - 5.9 2.0 8.0 7.9 11.5
Source : International Labor Organization * : Nepal Rastra Bank ( Mid-July to Mid-July)
In the SAARC region, inflation has hovered significantly around single to double digit during 1991-2006. In this period, the highest inflation registered was 21.1 percent in 1992. Contrarily, Maldives observed deflationary trend with a negative inflation of -2.8 percent in 2003. The country also witnessed negative inflations in 1998 (-1.3 percent) and 2000 (-1.1 percent) as well. Overall, the SAARC countries had faced comparatively higher inflation before 1999. Except Sri Lanka, all the other SAARC countries experienced single-digit inflation after 1998. However, Sri Lankan inflation is still hovering around double-digit.
6
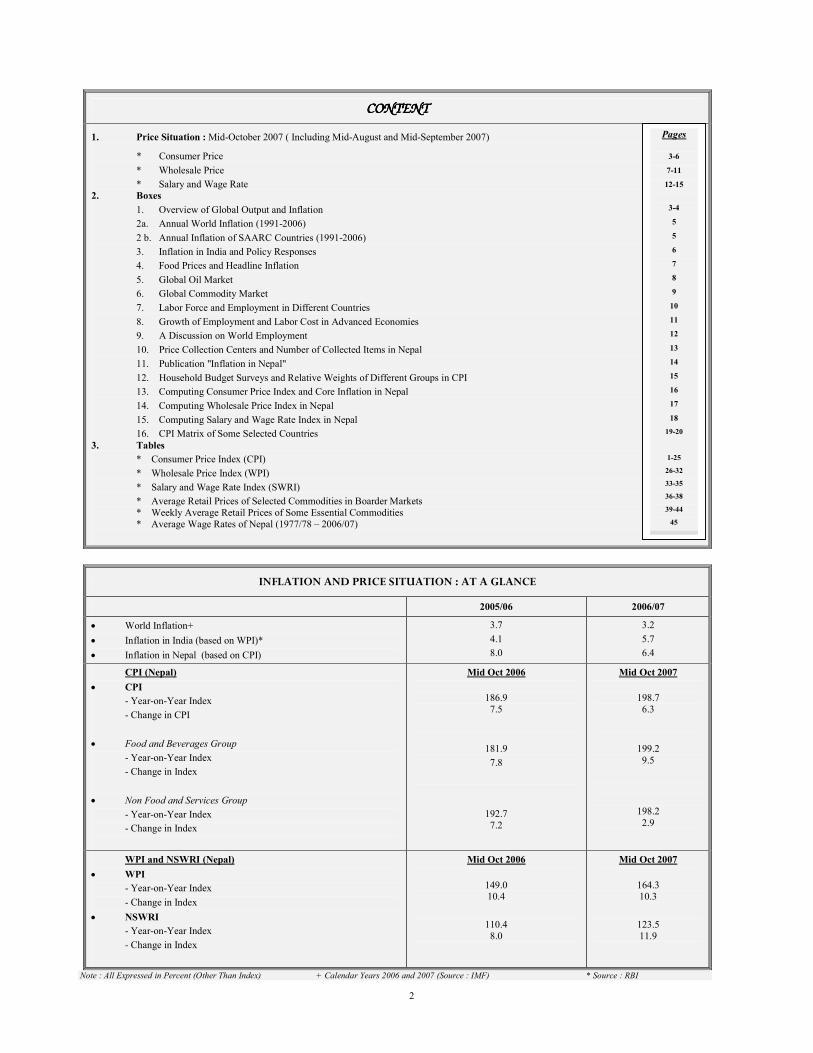
(f) M-O-M CPI Inflation
The overall M-O-M price index in mid-October 2007 increased
by 0.5 percent compare to that of mid-September 2007. During the review period, the indices of food and beverages increased by 0.9 percent while the non-food and services group increased by 0.1 percent. The indices of Kathmandu valley, Terai and Hills also increased by 0.6 percent, 0.5 percent and 0.2 percent during this month, respectively. Likewise as compared to respective previous months, the overall M-
O-M price indices increased by 1.6 percent in mid-September and
2.6 percent in mid-August 2007. During those two months, the
indices of Kathmandu recorded the increase of 1.8 percent and 2.2
percent where as the prices in the Terai increased by 1.5 percent and
3.0 percent. In the Hills, it increased by 1.5 percent and 2.1 percent
during these two months.
M-O-M CPI Inflation
0.0
0.5
1.0
1.5
2.0
2.5
3.0
3.5
Overall Food and Beverages Non-food and Services
Groups
Inflation
Mid-Sept 2007 Mid-Oct 2007
Box 3 : Inflation in India and Policy Responses
The RBI Annual Policy Statement for 2007-08 (April 2007) stated that the inflation in India would be contained close to 5.0 per cent in 2007-08. Assuming that aggregate supply management would continue to receive public policy attention and that a more active management of the capital account would be demonstrated, the outlook for inflation in 2007-08 was left unchanged. The inflation in India, based on the wholesale price index (WPI), eased below 4 per cent from mid-August 2007 to 3.1 per cent by October 6, 2007, partly due to base effects and negative contribution from fuel prices. Pre-emptive monetary measures since mid-2004 accompanied by fiscal and supply-side measures have helped in containing inflation. It was 4.4 per cent at end-June 2007 and 5.4 per cent a year ago. It was 5.9 per cent at end-March 2007. The y-o-y inflation excluding fuel, at 4.6 per cent, was above the headline inflation rate. Headline inflation has moved in a range of 3.1-6.4 per cent during 2007-08 so far. The annual average WPI inflation rate for the week ended October 6, 2007 eased to 5.2 per cent from 5.6 per cent at end-June 2007, but was higher compared with 4.6 per cent a year ago. Overall, manufactured products which hold a weighted contribution of 74% were the major driver of domestic inflation followed by primary articles (42% weightage) in India. The fuel group’s contribution, on the other hand, was negative at 17%. Consumer price inflation, however, remained firm during the second quarter of 2007-08 and continued to be above the WPI inflation, mainly reflecting the impact of higher food prices. Various measures of consumer price inflation were placed in the range of 5.7-7.9 per cent during August/ September 2007 as compared with 5.7-7.8 per cent in June 2007 It was ranged at 6.7-9.5 per cent in March 2007.
Wholesale Price Inflation in India (Percent)
Year
WPI
(Overall)
WPI
(Primary
Articles)
WPI
(Fuel
Group)
WPI
(Manufactur
ed)
Year
WPI
(Overall)
WPI
(Primary
Articles)
WPI
(Fuel Group)
WPI
(Manufact
ured)
1995-96 4.4 3.1 5.1 4.7 2001-02 1.6 3.9 3.9 0.0
1996-97 5.4 9.2 13.3 2.4 2002-03 6.5 6.1 10.8 5.1
1997-98 4.5 4.6 13.7 2.3 2003-04 4.6 1.6 2.5 6.7
1998-99 5.3 7.6 3.2 4.9 2004-05 5.1 1.3 10.5 4.6
1999-00 6.5 4.0 26.7 2.4 2005-06 4.1 5.4 8.9 1.7
2000-01 4.9 -0.4 15.0 3.8 2006-07 5.7 10.7 1.0 5.8
Source (Text and Table) : RBI
On a review of the liquidity situation, RBI announced to increase the cash reserve ratio (CRR) by another 50 basis points with effect from the fortnight beginning August 4, 2007. The CRR was earlier raised by 50 basis points in two stages of 25 basis points each effective April 14, 2007 and April 28, 2007. The major policy response by the Reserve Bank of India in different point of time is provided in the table below:
Indian Monetary Policy Response to Inflation
(Percent)
Effective Since
Reverse
Repo Rate
Repo
Rate
CRR
WPI
Inflation
Effective Since
Reverse
Repo Rate
Repo
Rate
CRR
WPI
Inflation
March 31, 2004 4.5 6.0 4.5 4.6 December 23, 2006 6.0 7.25 5.25 5.8
September 18, 2004 4.5 6.0 4.75 7.9 January 6, 2007 6.0 7.25 5.5 6.4
October 2, 2004 4.5 6.0 5.0 7.1 January 31, 2007 6.0 7.50 5.5 6.7
October 27, 2004 4.75 6.0 5.0 7.4 February 17, 2007 6.0 7.50 5.75 6.0
April 29, 2005 5.0 6.0 5.0 6.0 March 3, 2007 6.0 7.50 6.00 6.5
October 26, 2005 5.25 6.25 5.0 4.5 March 31, 2007 6.0 7.75 6.00 5.9
January 24, 2006 5.5 6.5 5.0 4.2 April 14, 2007 6.0 7.75 6.25 6.3
June 9, 2006 5.75 6.75 5.0 4.9 April 28, 2007 6.0 7.75 6.50 6.0
July 25, 2006 6.0 7.0 5.0 4.7 August 4, 2007 6.0 7.75 7.00 4.4
October 31, 2006 6.0 7.25 5.0 5.3 Note : With effective from October 29, 2004, nomenclature of repo and reverse repo was changed in keeping with international usage. Now, reverse repo indicates absorption of liquidity and repo signifies injection of liquidity. Prior to October 29, 2004, repo indicated absorption of liquidity while reverse repo meant injection of liquidity. The nomenclature provided is based on the new use of terms even for the period prior to October 29, 2004.
Source (Text and Table) : RBI

7
Wholesale Price
(a) Wholesale Price Inflation
The y-o-y wholesale price inflation showed marginal decline to
10.3 percent in mid-October 2007 from the level of 10.4 percent a
year ago. Such moderation in the wholesale price inflation was basically on account of a decline in the prices of imported commodities.
Likewise, the y-o-y wholesale price index increased at a rate of 11.1
percent in mid-September and 12.4 percent in mid-August 2007. The
corresponding rates in the same period last year were 9.1 percent
and 6.7 percent respectively.
National Wholesale Price Inflation
-0.5
0.0
0.5
1.0
1.5
2.0
2.5
3.0
Overall Index Agricultural
Commodities
Domestic
Manufactured
Commodities
Imported
commodities
Groups
Inflation
Mid-Oct 2006 Mid-Oct 2007
Box 4 : Food Prices and Headline Inflation Inflation has picked up in a number of emerging market economies in recent years, reflecting strong growth of domestic demand and the greater weight of rising food prices in the consumer price index. In a number of countries the acceleration in food prices - notably corn, soybeans, and wheat has reflected pressure from increasing use of corn and other food items for bio-fuel production in an effort to reduce their dependency upon petroleum imports. Besides, poor weather conditions and supply disruptions have also pushed the food prices up. The recent boom in food prices reflects a combination of factors such as: a) strong expansion in bio-fuel production has also indirectly buoyed prices of other non fuel-related food items by providing incentives for farmers to switch away from other crop plantings and by increasing the cost of livestock feed; b) increased food consumption by emerging market economies; and c) adverse supply shocks such as unfavorable weather conditions have reduced the global harvest for some food items. However the increase in food prices may have a significant impact on net trade balances of many countries, it has relatively larger impact on headline inflation. Because higher international food prices put upward pressure on the cost of living, both directly and through their possible impact on nonfood prices. Regarding its direct impact on inflation, food item accounts for a significant share of total consumer expenditure and the headline CPI for many developing countries. In-fact, the share across countries tends to be negatively correlated with income levels. Food prices also increases headline CPI indirectly by raising nonfood prices too. Higher food prices could have other macro- economic and distributional effects such as: a) an inflation -targeting central bank may have to control inflationary pressure form higher food prices when the effect on nonfood prices is significant; b) higher food prices are also likely to adversely affect income distribution within a net-food-importing economy, because food tends to absorb a greater share of expenditure for poorer people. In many countries, monetary policy decisions focus on core inflation, because food price movements are often uncertain, supply driven, and have transient effects on overall inflation. However, central banks- particularly in developing countries where food prices do significantly affect nonfood prices- will need to monitor food prices carefully and respond quickly if food price movements are threatening achievement of inflation goals.
The index of world food prices showed an increasing trend since 2000. The highest increase in food prices has been observed in 2004 with 14.3 percent. It has increased by a higher rate of 9.8 percent in 2006 as well. Comparing the trend of global food prices with Nepal, it is more or less similar. Figures indicate that the food and beverage prices in Nepal have also shown a stable upward trend after 2000. The price index is being increased by a higher rate of 7 to 8 percent since 2005. The highest increase in this index in Nepal was 16.2 percent in 1998.
Direct Contribution of Food Prices on Headline Inflation
2000-2006 (%) 2007* (%)
World 26.6 36.4
Advanced Economies 14.2 18.4
Africa 46.5 37.9
CIS 41.3 26.9
Developing Asia 34.1 55.9
Central and Eastern Europe 29.9 33.0
Middle East 37.4 52.2
Western Hemisphere 25.6 37.2
Sources (Text and Table) : World Economic Outlook, IMF, October 2007 * January- April
From the table, it is observed that the direct contribution of food item to inflation for the world as a whole has risen from about 1/4 (26.6 per cent) in 2000-06 to more than 1/3 (36.4 per cent) in 2007. It has risen quite drastically in developing Asia from nearly 34% to 56%. This contribution has also risen in most other developing regions, except Africa. In Africa, it has fallen but it still remains high.
Food Item Index (World)
Food Item Index (Nepal)
Year
Food
Index*
Annual
Change (%)
Year
Food
Index*
Annual
Change (%)
1995 126.6 5.7 1995 100.0 8.9
1996 137.4 8.5 1996 108.2 8.2 1997 125.6 -8.6 1997 116.6 7.8 1998 111.7 -11.1 1998 135.5 16.2 1999 97.6 -12.6 1999 136.1 0.4
2000 100.0 2.5 2000 133.0 -2.3 2001 100.1 0.1 2001 137.9 3.7 2002 103.6 3.5 2002 144.0 4.4
2003 108.9 5.1 2003 148.8 3.3
2004 124.5 14.3 2004 154.7 4.0 2005 124.1 -0.3 2005 166.8 7.8 2006 136.3 9.8 2006 178.8 7.2
Source: International Financial Statistics, Yearbook 2007, IMF * Food Price Index
Source: Nepal Rastra Bank * Food and Beverages
Change in Food Prices : World and Nepal
-15
-10
-5
0
5
10
15
20
1995 1996 1997 1998 1999 2000 2001 2002 2003 2004 2005 2006
YearWorld Nepal
8
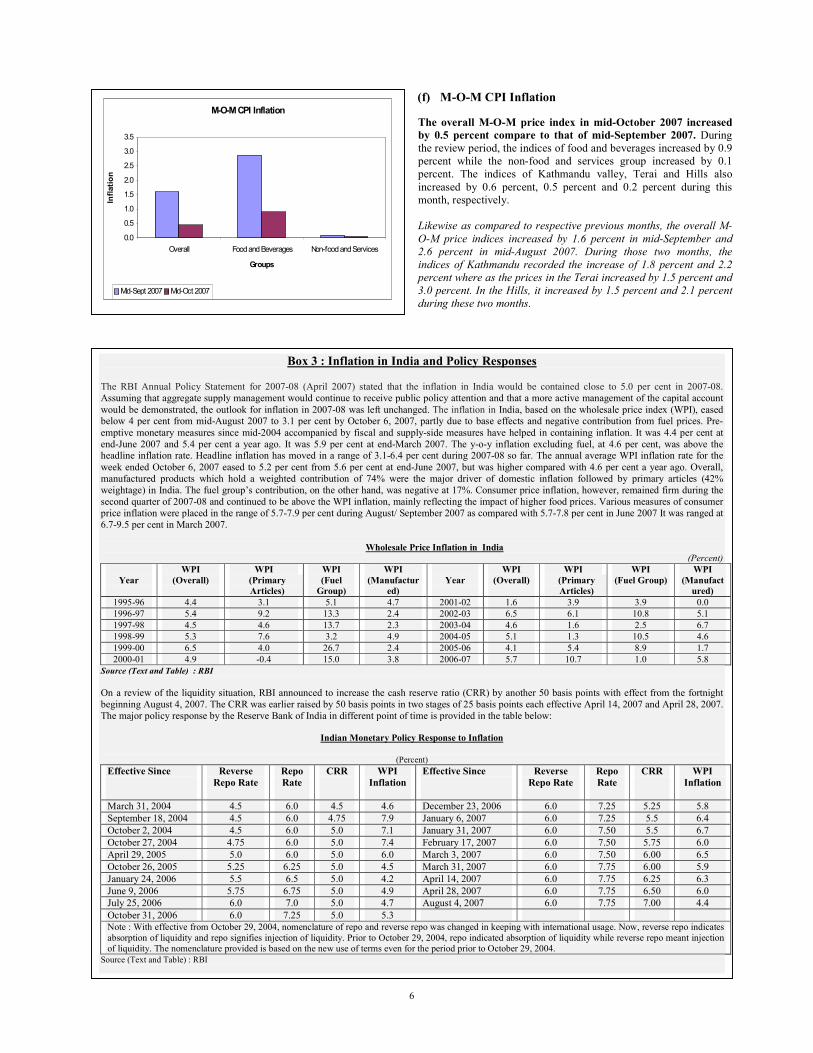
(b) Agricultural Commodities
The price of agriculture commodities slightly declined to
14.1 percent in October 2007 from 14.6 percent last year.
In this group, the price of fruits and vegetables rose significantly by 41.7 percent, followed by pulses 13.0 percent, cash crops 8.3 percent and food grains 7.4 percent.
Likewise, the index of agriculture commodities increased by
the rate of 16.6 percent in mid-September and 20.0 percent in
mid-August 2007. These rates were 11.8 and 4.5 percent in the
corresponding periods last year.
Sub-group Indices of Agricultural Commodities
0
50
100
150
200
250
300
Commodities
Index
Mid-Oct 2006 Mid-Oct 2007
Box 5 : Global Oil Market
International crude oil prices (WTI), rose further during the third quarter of 2007, reflecting limited spare capacity and fall in US crude inventories. It crossed US $ 80 a barrel by mid-September 2007 and reached a historical peak on October 18, 2007 at US $ 89.5 a barrel. The decision by the OPEC to raise output by 0.5 million barrels per day effective November 1, 2007 also could not alleviate the pressures on oil prices due to the tight demand-supply conditions. The OPEC had earlier cut production during November 2006 (1.2 mb/d) and February 2007 (0.5 mb/d) to support prices. Looking forward, the International Energy Agency expects the oil prices (WTI) to average US $ 68.8 a barrel in the calendar year 2007, higher than that of US $ 66.0 during 2006. For 2008, the EIA expects prices to average US $ 73.5 a barrel. The average International crude oil prices are given as below :
(US $ Per Barrel)
Date Dubai UK Brent US WTI Average Indian Basket Price
2001-02 21.8 23.2 24.1 23.0 22.4
2002-03 25.9 27.6 29.2 27.6 26.6
2003-04 26.9 29.0 31.4 29.1 27.8
2004-05 36.4 42.2 45.0 41.3 38.9
2005-06 53.4 58.0 59.9 57.1 55.4
2006-07 60.9 64.4 64.7 63.3 62.4
January 2007 52.0 54.3 54.2 53.5 53.0
February 2007 55.7 57.8 59.3 57.6 56.6
March 2007 59.1 62.1 60.6 60.6 60.4
April 2007 63.8 67.4 63.9 65.1 65.3
May 2007 64.5 67.5 63.5 65.2 65.8
June 2007 65.8 71.3 67.5 68.2 68.1
July 2007 69.5 77.2 74.1 73.6 72.7
August 2007 67.2 70.8 72.4 70.1 68.7
September 2007 73.3 77.1 79.9 76.8 74.9 Source (Text and Table) : IMF and the World Bank
Global Oil Supply and Demand
Regarding global oil supply and consumption, global oil demand in 2006 grew by 0.8 million barrels a day (mbd) below the 1.3 mbd growth in 2005. Demand growth in developing countries rose to 1.3 mbd in 2006. Consumption was stronger than projected in China and India. Demand growth in emerging markets was generally stronger in countries with administered prices, which typically have been lower than market prices in recent years. In Europe and Japan, conservation measures and increased utilization of nuclear and coal power plants, along with some fuel switching to natural gas have helped reduce oil demand. In line with the weakening demand, overall oil production growth fell to 0.8 mbd in 2006 from 1.3 mbd in 2005. OPEC's output declined in late 2006 reflecting a 0.7 mbd production cut in the fourth quarter following OPEC's decision to cut quotas by 1.2 mbd starting in November. According to the US Energy Information Administration, global demand of oil was expected to remain 1.1 million barrels a day above the global supply during 2007. Notwithstanding the announced increase in OPEC supply, oil market fundamentals are likely to remain under pressure reflecting rising consumption, moderate growth in non-OPEC supply and falling inventories. Looking forward, the international energy agency has projected the global consumption growth of 1.6 mbd in 2007 owing to continued robust demand from emerging markets such as China and the Middle East, and a planned buildup of official stocks by China and the USA.
World Balance of Oil (million barrel per day)
Item
2003
2004
2005
2006
2007 Q1
2007 Q2
2007 Q3
Demand
OECD 48.7 49.5 49.6 49.2 49.5 48.1 49.1
Non-OECD 31.2 33.0 34.4 35.5 36.1 36.4 36.5
- of which : China 5.6 6.5 6.9 7.3 7.4 7.6 7.7
Total Demand 79.9 82.5 84.0 84.7 85.6 84.5 85.6
Supply
Non-OPEC 48.9 50.1 50.3 49.3 49.8 49.9 49.6
OPEC 30.7 32.9 34.2 35.3 34.5 34.6 34.9
Total Supply 79.6 83.1 84.5 84.6 84.3 84.5 84.5
Stock Changes 0.3 -0.6 -0.5 0.1 1.3 0.0 1.1
Source (Text and Table) : US Energy Information Administration * 2007 Figures are Provisional

9
(c) Domestic Manufactured Commodities
The wholesale prices of domestic manufactured commodities
group rose by 8.0 percent during the review period compared to
a growth of 6.7 percent in the previous year. Within this group, the prices of construction material rose by 15.5 percent, food-related products by 5.9 percent and that of beverages and tobacco by 5.4 percent. The upward pressure on prices of this sub-group was on account of the hike in the excise as well as customs duties of cigarettes, liquors, cement and paints by the government through the budget of 2007-08.
Likewise, the indices of this group increased by 7.8 percent in mid-
September, and 7.7 percent in mid-August 2007.The respective rates
in the corresponding periods last year were 7.3 percent and 7.2
percent.
Sub-group Indices of Domestic Manufactured Commodities
0
20
40
60
80
100
120
140
160
180
200
Overall Food-Related
Products
Beverages and
Tobacco
Construction
Materials
Others
Mid-Oct 2006 Mid-Oct 2007
Box 6 : Global Commodity Market
International commodity prices remained firm during the third quarter of 2007-08 led by food and crude oil prices, although there was some moderation in prices of metals. The annual change in the overall prices of crude oil as well as the non-fuel commodities is shown as below :
( percent change)
2005 2006 2007*
Global Crude Oil Prices 41.3 20.5 6.6
Global Non-fuel Commodity Prices 10.3 28.4 12.2 Source (Text and Table) : World Economic Outlook, IMF * : Estimations
Other than fuel prices, the metal prices eased during the third quarter of 2007, reflecting lower import demand and some improvement in supply. Between June 2007 and September 2007, prices of nickel, zinc and aluminum fell by 29 per cent, 20 per cent and 11 per cent, respectively, reflecting lower Chinese demand. On the other hand, copper prices remained largely range bound, while lead prices increased by 33 per cent over the same period. Regarding the food prices, the prices of wheat, oilseeds and edible oils increased reflecting a shortfall in global production, decline in stocks and rising demand for non-food uses. The prices of edible oil increased by a higher range of 61-67 percent in September alone. Oil prices had hardened by about 15-30 per cent between March- June 2007. Amongst other food items, prices of wheat rose by 46 per cent between June-September 2007 on top of 12 per cent increase during March-June 2007, taking the y-o-y rise in September 2007 to 67 per cent. The global wheat stocks are likely to decline further in 2007-08 to 107.0 million tonnes - their lowest levels since 1981-82. Rice prices also remained firm, reflecting low stocks. The rice stocks are expected to decline by about 8 per cent during 2007-08. The overall food price index compiled by the IMF increased by about 25 per cent in September 2007 (y-o-y) on top of an increase of 8 per cent a year ago. The IMF’s food price index in September 2007 has been the highest since early 1981.
International Commodity Price Movements
Commodities
Uint
Price Changes September 2007 over September 2006
(percent)
Coal $/mt 45.0
Crude Oil (Avg) $/barrel 23.6
Palm Oil $/mt 66.7
Soybean Oil $/mt 61.3
Soybeans $/mt 66.8
Rice $/mt 5.1
Wheat $/mt 66.6
Sugar cent/kg -19.2
Cotton cent/kg 14.3
Aluminum $/mt -3.3
Copper $/mt 0.6
Gold $/troy oz 19.1
Silver cent/troy oz 11.5
Steel Cold-rolled coil/sheet $/mt -7.1
Steel Hot-rolled coil/sheet $/mt -8.3
Tin cent/kg 66.2
Zinc cent/kg -15.3 Source (Text and Table) : World Bank
International sugar prices also increased by about 5 per cent during June-September 2007 in contrast to a decline of 11 per cent witnessed during March-June 2007 as the fall in domestic prices in exporter countries such as Brazil and India was offset by firm prices in importing countries of China and Russia. Prices in September 2007, however, were still 46 per cent lower than the recent peak touched in February 2006. Global sugar production is estimated to increase further by 4.1 million tonnes to 169.6 million tonnes during 2007-08 season, exceeding global consumption by 10.8 million tonnes. Global cotton prices increased by about 11 per cent during June-September 2007, reflecting shortfalls in production. According to the latest assessments, the world
cotton stock is estimated to decline by about 14 per cent to 10.8 million tonnes in 2007-08.
10
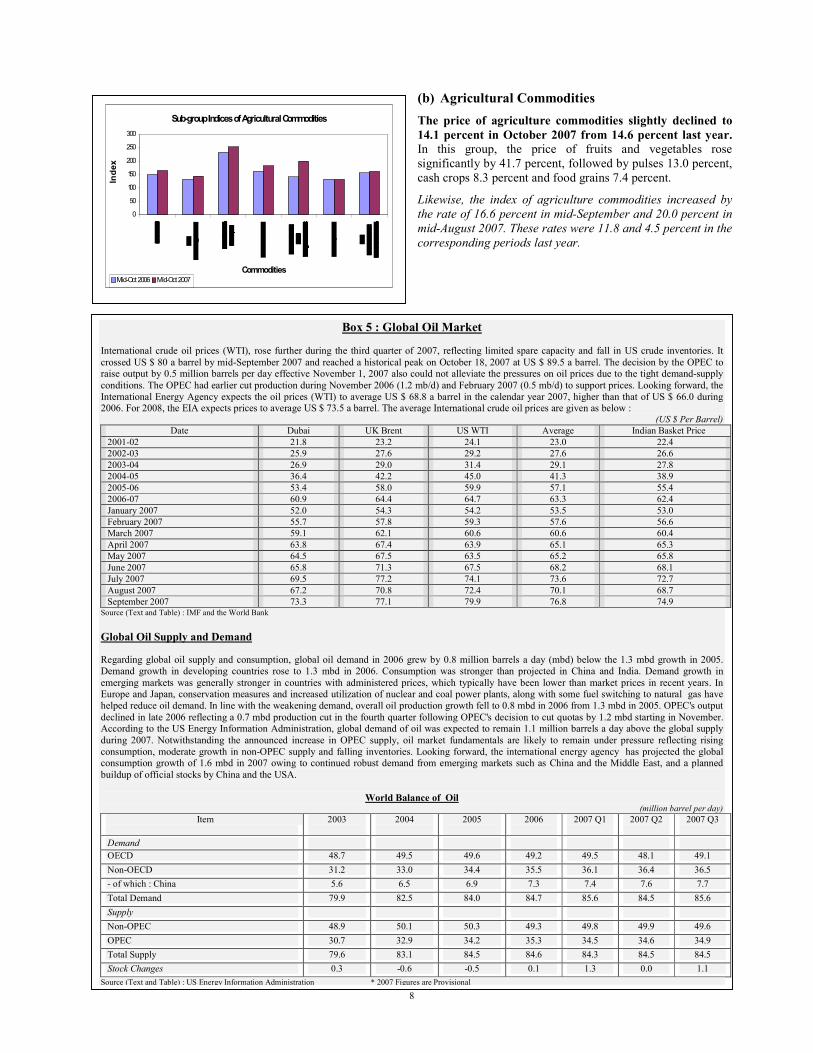
(d) Imported Commodities
The wholesale price index of imported commodities
moderated to 5.1 percent in the review period from 6.1
percent a year ago. This deceleration was on account of the nominal appreciation of Nepalese rupee against the US dollar.
Likewise, the indices of this group increased by 4.5 percent in
mid-September 3.4 percent in mid-August 2007.The
corresponding rates during the previous year were 6.1 and
10.0 percent respectively.
Sub-group Indices of Imported Commodities
0
50
100
150
200
250
300
Overall Petroleum
Products
and Coal
Chemical
Fertilizers
and
Chemical
Goods
Transport
Vehicles
and
Machinery
Goods
Electric
and
Electronic
Goods
Drugs and
Medicine
Textile-
Related
Products
Others
M id-Oct 2006 M id-Oct 2007
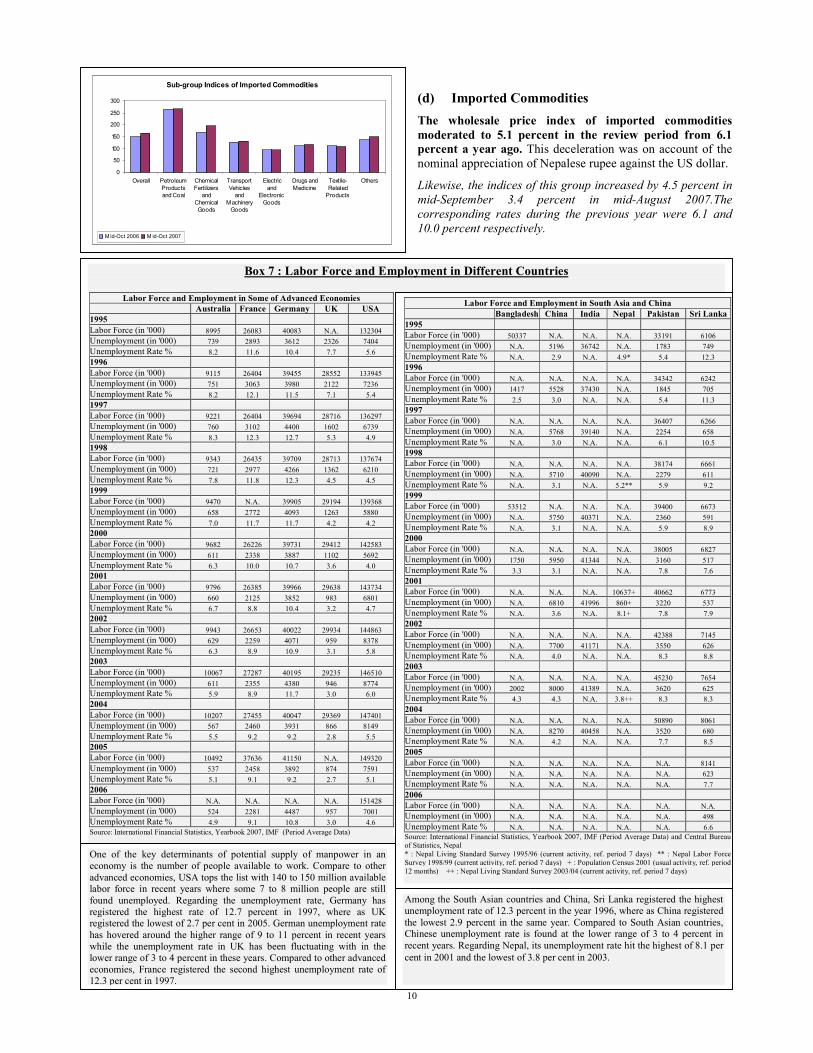
Box 7 : Labor Force and Employment in Different Countries
Labor Force and Employment in Some of Advanced Economies
Australia France Germany UK USA
1995
Labor Force (in '000) 8995 26083 40083 N.A. 132304
Unemployment (in '000) 739 2893 3612 2326 7404
Unemployment Rate % 8.2 11.6 10.4 7.7 5.6
1996
Labor Force (in '000) 9115 26404 39455 28552 133945
Unemployment (in '000) 751 3063 3980 2122 7236
Unemployment Rate % 8.2 12.1 11.5 7.1 5.4
1997
Labor Force (in '000) 9221 26404 39694 28716 136297
Unemployment (in '000) 760 3102 4400 1602 6739
Unemployment Rate % 8.3 12.3 12.7 5.3 4.9
1998
Labor Force (in '000) 9343 26435 39709 28713 137674
Unemployment (in '000) 721 2977 4266 1362 6210
Unemployment Rate % 7.8 11.8 12.3 4.5 4.5
1999
Labor Force (in '000) 9470 N.A. 39905 29194 139368
Unemployment (in '000) 658 2772 4093 1263 5880
Unemployment Rate % 7.0 11.7 11.7 4.2 4.2
2000
Labor Force (in '000) 9682 26226 39731 29412 142583
Unemployment (in '000) 611 2338 3887 1102 5692
Unemployment Rate % 6.3 10.0 10.7 3.6 4.0
2001
Labor Force (in '000) 9796 26385 39966 29638 143734
Unemployment (in '000) 660 2125 3852 983 6801
Unemployment Rate % 6.7 8.8 10.4 3.2 4.7
2002
Labor Force (in '000) 9943 26653 40022 29934 144863
Unemployment (in '000) 629 2259 4071 959 8378
Unemployment Rate % 6.3 8.9 10.9 3.1 5.8
2003
Labor Force (in '000) 10067 27287 40195 29235 146510
Unemployment (in '000) 611 2355 4380 946 8774
Unemployment Rate % 5.9 8.9 11.7 3.0 6.0
2004
Labor Force (in '000) 10207 27455 40047 29369 147401
Unemployment (in '000) 567 2460 3931 866 8149
Unemployment Rate % 5.5 9.2 9.2 2.8 5.5
2005
Labor Force (in '000) 10492 37636 41150 N.A. 149320
Unemployment (in '000) 537 2458 3892 874 7591
Unemployment Rate % 5.1 9.1 9.2 2.7 5.1
2006
Labor Force (in '000) N.A. N.A. N.A. N.A. 151428
Unemployment (in '000) 524 2281 4487 957 7001
Unemployment Rate % 4.9 9.1 10.8 3.0 4.6
Source: International Financial Statistics, Yearbook 2007, IMF (Period Average Data)
Labor Force and Employment in South Asia and China
Bangladesh China India Nepal Pakistan Sri Lanka
1995
Labor Force (in '000) 50337 N.A. N.A. N.A. 33191 6106
Unemployment (in '000) N.A. 5196 36742 N.A. 1783 749
Unemployment Rate % N.A. 2.9 N.A. 4.9* 5.4 12.3
1996
Labor Force (in '000) N.A. N.A. N.A. N.A. 34342 6242
Unemployment (in '000) 1417 5528 37430 N.A. 1845 705
Unemployment Rate % 2.5 3.0 N.A. N.A. 5.4 11.3
1997
Labor Force (in '000) N.A. N.A. N.A. N.A. 36407 6266
Unemployment (in '000) N.A. 5768 39140 N.A. 2254 658
Unemployment Rate % N.A. 3.0 N.A. N.A. 6.1 10.5
1998
Labor Force (in '000) N.A. N.A. N.A. N.A. 38174 6661
Unemployment (in '000) N.A. 5710 40090 N.A. 2279 611
Unemployment Rate % N.A. 3.1 N.A. 5.2** 5.9 9.2
1999
Labor Force (in '000) 53512 N.A. N.A. N.A. 39400 6673
Unemployment (in '000) N.A. 5750 40371 N.A. 2360 591
Unemployment Rate % N.A. 3.1 N.A. N.A. 5.9 8.9
2000
Labor Force (in '000) N.A. N.A. N.A. N.A. 38005 6827
Unemployment (in '000) 1750 5950 41344 N.A. 3160 517
Unemployment Rate % 3.3 3.1 N.A. N.A. 7.8 7.6
2001
Labor Force (in '000) N.A. N.A. N.A. 10637+ 40662 6773
Unemployment (in '000) N.A. 6810 41996 860+ 3220 537
Unemployment Rate % N.A. 3.6 N.A. 8.1+ 7.8 7.9
2002
Labor Force (in '000) N.A. N.A. N.A. N.A. 42388 7145
Unemployment (in '000) N.A. 7700 41171 N.A. 3550 626
Unemployment Rate % N.A. 4.0 N.A. N.A. 8.3 8.8
2003
Labor Force (in '000) N.A. N.A. N.A. N.A. 45230 7654
Unemployment (in '000) 2002 8000 41389 N.A. 3620 625
Unemployment Rate % 4.3 4.3 N.A. 3.8++ 8.3 8.3
2004
Labor Force (in '000) N.A. N.A. N.A. N.A. 50890 8061
Unemployment (in '000) N.A. 8270 40458 N.A. 3520 680
Unemployment Rate % N.A. 4.2 N.A. N.A. 7.7 8.5
2005
Labor Force (in '000) N.A. N.A. N.A. N.A. N.A. 8141
Unemployment (in '000) N.A. N.A. N.A. N.A. N.A. 623
Unemployment Rate % N.A. N.A. N.A. N.A. N.A. 7.7
2006
Labor Force (in '000) N.A. N.A. N.A. N.A. N.A. N.A.
Unemployment (in '000) N.A. N.A. N.A. N.A. N.A. 498
Unemployment Rate % N.A. N.A. N.A. N.A. N.A. 6.6
Source: International Financial Statistics, Yearbook 2007, IMF (Period Average Data) and Central Bureau of Statistics, Nepal * : Nepal Living Standard Survey 1995/96 (current activity, ref. period 7 days) ** : Nepal Labor Force Survey 1998/99 (current activity, ref. period 7 days) + : Population Census 2001 (usual activity, ref. period 12 months) ++ : Nepal Living Standard Survey 2003/04 (current activity, ref. period 7 days)
One of the key determinants of potential supply of manpower in an economy is the number of people available to work. Compare to other advanced economies, USA tops the list with 140 to 150 million available labor force in recent years where some 7 to 8 million people are still found unemployed. Regarding the unemployment rate, Germany has registered the highest rate of 12.7 percent in 1997, where as UK registered the lowest of 2.7 per cent in 2005. German unemployment rate has hovered around the higher range of 9 to 11 percent in recent years while the unemployment rate in UK has been fluctuating with in the lower range of 3 to 4 percent in these years. Compared to other advanced economies, France registered the second highest unemployment rate of 12.3 per cent in 1997.
Among the South Asian countries and China, Sri Lanka registered the highest unemployment rate of 12.3 percent in the year 1996, where as China registered the lowest 2.9 percent in the same year. Compared to South Asian countries, Chinese unemployment rate is found at the lower range of 3 to 4 percent in recent years. Regarding Nepal, its unemployment rate hit the highest of 8.1 per
cent in 2001 and the lowest of 3.8 per cent in 2003.

11
(e) M-O-M WPI Inflation
The overall M-O-M Wholesale Price Index in mid-October
2007 increased by 0.5 percent. It is attributed to the 0.5 percent increase in the indices of agricultural commodities and 0.6 percent rise in imported commodities during the month.
Likewise, the M-O-M Wholesale Price Index increased by 2.2
percent in mid-September and 5.4 percent in Mid-August
2007.
M-O-M WPI Inflation
0.0
0.5
1.0
1.5
2.0
2.5
3.0
3.5
4.0
Overall Agricultural
commodities
Domestic Manufactured
Commodities
Imported Commodities
M id-Sept 2007 M id-Oct 2007
Box 8 : Growth of Employment and Labor Cost in Advanced Economies
Employment Indices (Some Advanced Economies)
USA Canada Australia Japan France Germany Italy UK Year
Index
Annual Change
%
Index
Annual Change
%
Index
Annual Change
%
Index
Annual Change
%
Index
Annual Change
%
Index
Annual Change
%
Index
Annual Change
%
Index
Annual Change
%
1995 89.0 2.7 85.4 1.9 98.8 1.0 111.5 -1.8 100.9 0.1 98.5 -0.1 100.7 -1.7 91.3 1.3
1996 90.8 2.0 87.4 2.3 99.0 0.2 109.0 -2.2 99.7 -1.2 98.3 -0.2 99.6 -1.1 92.6 1.4
1997 93.2 2.6 90.6 3.7 100.5 1.5 107.8 -1.1 98.9 -0.8 97.8 -0.5 98.9 -0.7 94.9 2.5
1998 95.5 2.5 93.6 3.3 97.2 -3.3 105.9 -1.8 99.0 0.1 98.0 0.2 99.8 0.9 96.5 1.7
1999 97.9 2.5 95.5 2.0 95.5 -1.7 102.8 -2.9 98.6 -0.4 99.4 1.4 100.0 0.2 98.2 1.8
2000 100.0 2.1 100.0 4.7 100.0 4.7 100.0 -2.7 100.0 1.4 100.0 0.6 100.0 0.0 100.0 1.8
2001 100.0 0.0 98.1 -1.9 96.7 -3.3 97.1 -2.9 100.9 0.9 100.6 0.6 100.8 0.8 101.2 1.2
2002 98.9 -1.1 96.1 -2.0 97.8 1.1 92.2 -5.0 99.1 -1.8 99.8 -0.8 101.9 1.1 101.6 0.4
2003 98.6 -0.3 95.2 -0.9 95.8 -2.0 89.4 -3.0 96.9 -2.2 98.8 -1.0 103.7 1.8 101.8 0.2
2004 99.7 1.1 93.2 -2.1 96.4 0.6 88.4 -1.1 94.4 -2.6 105.9 7.2 104.5 0.8 102.8 1.0
2005 101.3 1.6 91.4 -1.9 94.8 -1.7 88.5 0.1 92.4 -2.1 105.6 -0.3 105.6 1.1 104.3 1.5
2006 103.3 2.0 90.6 -0.9 93.7 -1.2 89.2 0.8 90.4 -2.2 106.8 1.1 105.3 -0.3 105.2 0.9
Source: International Financial Statistics, Yearbook 2007, IMF As per the employment indices published by the IMF, the yearly growth rate of employment in most of the advanced economies has remained within the range of 1 to 2 percent in recent years. The highest growth rate of employment was observed in Germany with 7.2 percent in 2004. In the last ten years, UK is the only country which has not witnessed any annual negative growth rate of employment. Its growth rate hit the highest 2.5 percent in 1997 while it reached the lowest of 0.2 percent in 2003. Regarding the USA, it registered negative growth rates in two consecutive years in 2002 and 2003. The highest growth rate of employment in the country was 2.7 percent in 1995. Throughout the last decade, the most negative growth rate was observed in Japan which registered continuous negative rates from 1995 to 2004. Its growth rate is still below 1 percent up to 2006. France is another country which has registered second most negative rates after Japan. Regarding other advanced economies, Germany has registered both negative as well as positive growth rates in these years while Canada, Australia, France and Italy are still facing negative growth rates in recent years.
Labor Wage Indices (Some Advanced Economies)
USA Canada Australia Japan France Germany Italy UK Year
Index
Annual Change
%
Index
Annual Change
%
Index
Annual Change
%
Index
Annual Change
%
Index
Annual Change
%
Index
Annual Change
%
Index
Annual Change
%
Index
Annual Change
%
1995 86.2 2.6 90.9 1.3 82.4 5.1 96.5 2.1 87.0 0.8 87.0 4.4 87.2 3.1 80.4 3.2
1996 89.0 3.2 93.6 3.0 85.6 3.9 98.3 1.9 88.5 1.7 91.1 4.7 90.0 3.2 83.2 3.5
1997 91.7 3.0 94.3 0.7 89.1 4.1 99.7 1.4 91.0 2.8 92.7 1.8 93.2 3.6 86.8 4.3
1998 93.9 2.4 96.2 2.0 92.8 4.2 99.5 -0.2 93.6 2.9 94.6 2.0 95.8 2.8 91.3 5.2
1999 96.7 3.0 97.5 1.4 95.3 2.7 99.7 0.2 95.7 2.2 97.2 2.7 98.0 2.3 95.7 4.8
2000 100.0 3.4 100.0 2.6 100.0 4.9 100.0 0.3 100.0 4.5 100.0 2.9 100.0 2.0 100.0 4.5
2001 103.1 3.1 101.9 1.9 104.9 4.9 99.4 -0.6 104.5 4.5 103.3 3.3 101.8 1.8 104.4 4.4
2002 106.8 3.6 104.9 2.9 110.3 5.1 97.7 -1.7 108.4 3.7 106.5 3.1 104.5 2.7 108.2 3.6
2003 109.9 2.9 108.1 3.1 116.5 5.6 97.8 0.1 112.8 4.1 108.0 1.4 107.2 2.6 111.9 3.4
2004 112.7 2.5 111.0 2.7 120.9 3.8 97.7 -0.1 116.1 2.9 110.1 1.9 110.5 3.1 116.8 4.4
2005 115.6 2.6 113.0 1.8 127.6 5.5 98.3 0.6 119.3 2.8 111.4 1.2 113.9 3.1 121.5 4.0
2006 117.4 1.6 113.6 0.5 132.4 3.8 98.9 0.6 122.7 2.8 112.4 0.9 117.5 3.2 126.5 4.1
Source: International Financial Statistics, Yearbook 2007, IMF As indicated by labor wage indices published by the IMF, the yearly growth rate of wages in most of the advanced economies (besides Japan) during the last decade moved around 2 to 5 percent. These economies have not witnessed any negative growth of wages in this period. The highest growth rate of 5.6 percent was seen in Australia in 2003 during the decade. Among the advanced economies, the higher average of 3 to 5 percent was registered by the UK and Australia while Germany registered in between 2 to 4 percent. Regarding others, a moderate growth rate of 2 to 3 percent was observed in the countries like USA, Canada, France and Italy. Although Japan registered a growth rate of 1 to 2 percent before 1997, it witnessed negative growth rates during 1998, 2001, 2002 and 2004. Japan's wage growth rate is still below one percent.

12
Salary and Wage Rate
(a) Overall Index
The y-o-y salary and wage rate index rose by 11.9 percent in mid-
October 2007 compared to a rise of 8.0 percent a year ago. Such an increase in this index was mainly due to net increment in the salaries of civil servants by 17 percent, including security personnel, teachers and employees of public enterprises from mid-July 2007. The rise in the wages of laborers also exerted an upward pressure on this index.
Likewise, the national salary and wage rate index increased by 12.5 percent in mid-September and 12.4 percent in mid-August 2007. The corresponding rates during last year were 7.6 percent and 7.3 percent
respectively.
Salary and Wage Rate Index
(2004/05=100)
95
100
105
110
115
120
125
130
Overall Salary Wage Rate
Mid-Oct 2006 Mid-Oct 2007
Box 9 : A Discussion on World Employment
Globalization and rapidly changing technical progress continues to impact labor markets around the world. Side by side, these challenges along-with the changing economic environment is also bringing greater opportunities for individuals striving to improve their way of life. Strong economic growth in many regions in recent years has led more people in work. Due to this more jobs has been created, especially in South Asia. Nearly 190 million people in the world are found unemployed up to 2007. It was about 15 percent rise since 1997. Out of total unemployed in the world, female constitutes a large chunk of about 57 percent while male holds about 43 percent only. While comparing the recent years' data, the highest world unemployment of 190.8 million was recorded in 2004 and the lowest of 164.8 million in 1997. A commonly used measure of tightness in the labor market is the unemployment rate. The balance between demand and supply in the labor market certainly put inflationary pressures worldwide. The world unemployment rate has been hovering around 6 percent in recent years. Region-wise, the highest unemployment rate of about 8 to 10 percent is observed in East Europe and former USSR states. In East Asia, the unemployment rate continues to remain at low levels within the range of 3 to 4 percent in recent years. Regarding South Asia, it has witnessed a moderated rate of 4 to 5 percent. Meanwhile, the unemployment rate in the EU and other developed economies has remained at a higher side of 6 to 7.5 percent.
Regarding the ratio of employment to the total population in the world, a declining trend has been observed in the past decade. It stood at 61.7 per cent in 2007 comparing to the 62.6 per cent of 1997. The decreasing portion is larger among the youth. Within this group, the ratio was 50.6 per cent in 1997 which has decreased by almost about 3 percentage point to 47.8 percent in 2007. It is due to rising proportion of educated young people. In some regions, the rising trend of young people not willing to enter in the labor market also contributes for the decrease. Looking upon the gender, a continued wide gap between the employment ratio of men and women in the world was observed. Analyzing the 2007 figures, only 49.1 percent of women are employed while the ratio of man is 74.3 percent. The gender gap seen in the labor market is another indication of less participation of woman in economic activities. Regionally, in south Asia, the ratio of employed people is almost 5 percent which is less than the world ratio. Comparing the ratio of employed women in South Asia with the ratio of employed women in the world, it is even wider with the gap of almost 15 percent. The figures of 2007 shows that the ratio of employed women in the world is 49.1 percent comparing to 34.1 percent of south Asian women. Regarding male, the gap is almost 4 percent. Among the young people, almost 5 percent less youth are found employed comparing to that of youth in the world. It shows that only 42.4 percent youth are employed in South Asia as against 47.8 percent employed youth worldwide. Talking about the sector-wise employment in the world, service sector holds the largest share of about 43 percent followed by 35 percent by agro-sector and remaining 22 percent by industrial sector. These ratios were almost 38 percent, 41 percent and 21 percent respectively a decade back. Showing agro-domination, agriculture sector holds the largest share of about 48 percent in South Asia followed by 30 percent in service sector and 22 percent in industrial sector. A decade ago, these ratios were about 59 percent, 25 percent and 15 percent respectively. These figures indicate that the share of agriculture sector in employment generation is declining continuously in the world while that of service sector is increasing year by year. Comparing to other two sectors, the share of industrial sector is increasing but with a slow pace.
World Unemployment (in millions)
1997 2002 2003 2004 2005 2006 2007*
Total 164.8 188.9 185.9 190.8 189.6 187.0 189.9
Male 70.2 79.6 79.2 80.9 81.0 80.2 81.6
Female 94.6 109.3 106.7 109.9 108.6 106.8 108.3
Source: ILO Global Employment Trends, January 2008 * Estimates
World Unemployment Rate (in percent)
1997 2006 2007*
World 6.1 6.0 6.0
South Asia 4.7 5.1 5.1
EU and Developed Economies 7.4 6.3 6.4
Central and South Eastern Europe (Non -EU and CIS) 10.7 8.5 8.5
East Asia 3.7 3.4 3.3
South East Asia and the Pacific 4.0 6.2 6.2
Source: I LO Global Employment Trends, January 2008 * Estimates
Employment - to - Population ratio (in percent)
1997 1998 1999 2000 2001 2002 2003 2004 2005 2006 2007*
World 62.6 62.4 62.3 62.2 62.0 61.7 61.7 61.6 61.7 61.7 61.7
South Asia 58.2 58.3 58.2 57.6 57.4 57.3 57.6 56.8 56.7 56.8 56.7
Male
World 75.7 75.5 75.4 75.2 74.8 74.5 74.4 74.4 74.3 74.4 74.3
South Asia 80.1 80.3 80.4 79.6 79.2 78.8 79.1 78.4 78.3 78.2 78.1
Female
World 49.5 49.3 49.2 49.2 49.1 49.0 49.0 49.0 49.0 49.1 49.1
South Asia 34.7 34.8 34.6 34.2 34.3 34.4 34.8 33.8 33.9 34.0 34.1
Youth
World 50.6 50.0 49.6 49.0 48.3 47.8 47.6 47.7 47.8 47.9 47.8
South Asia 44.5 44.5 44.4 43.3 43.1 43.1 43.5 42.5 42.6 42.6 42.4
Source: I LO Global Employment Trends, January 2008 * : Estimates
Sectoral Shares of Employment (World and South Asia)
(in percent)
1997 2005 2006
2007*
Agriculture
World 41.4 37.1 36.0 34.9
South Asia 59.4 50.9 49.4 48.0
Industry
World 21.1 21.4 21.9 22.4
South Asia 15.3 20.2 21.0 21.7
Services
World 37.5 41.5 42.1 42.7
South Asia 25.2 28.9 29.6 30.3
Source: I LO Global Employment Trends, January 2008 * : Estimates

13
(b) Salary
The index of salary group increased by 10.9 percent in
October 2007 as compared to the rise of 6.6 percent in the
preceding year. The impact of the 17 percent increase in the salaries of civil servants by the government in mid-July 2007 contributed to this rise.
Likewise, the salary index increased by 10.9 percent in mid-
September and 11.5 percent in mid-August 2007. There rates
were 6.6 percent and 6.4 percent in the corresponding periods
last year.
Sub-group Indices of Salary
020406080
100120140160180
Mid-Oct 2006 Mid-Oct 2007
Box 10 : Price Collection Centers and Number of Collected Items in Nepal
NEPAL INDIA
CPI WPI SWRI 1. ARARIA
A. Index Town 1. ILAM Wages 2. MUZZAFARPUR
Ktm Valley Terai Sector 2. BHADRAPUR 1. ILAM 3. GORAKHAPUR
1. KATHMANDU 12. DAMAK 3. BIRATNAGAR 2. BHADRAPUR 4. BAHARAICH
2. LALITPUR 13. BIRATNAGAR 4. DHARAN 3.BIRATNAGAR
3. BHAKTAPUR 14. LAHAN 5. SUNSARI 4. JANAKPUR
4. THIMI 15. JANAKPUR 6. JANAKPUR 5. KATHMANDU
Hills Sector 16. BIRGUNJ 8. RAUTHAT 6. LALITPUR
5. ILAM 17. BHARATPUR 9. BARA 7. BIRGUNJ
6. DHANKUTA 18. BAIRAHAWA 10. HETAUDA 8. POKHARA
7. HETAUDA 19. NEPALGUNJ 11. BIRGUNJ 9. BHAIRAHAWA
8. BANEPA 20. DHANAGADHI 12. NARAYANGADH 10. NEPALGUNJ
9. POKHARA 21. MAHENDRANAGAR 13. KATHMANDU VALLEY 11. DHANGADI
10. SURKHET 14. POKHARA Salaries
11. DIPAYAL 15. BHAIRAHAWA 1. CIVIL SERVICES
B. Non-Index Town 16. BUTWAL 2. PUBLIC ENTERPRISES
1. BHADRAPUR 18. DANG 3. BANK & FIN. INSTITUTIONS
19. NEPALGUNJ 4. ARMY & POLICE
20. DHANAGADHI 5. EDUCATION INSTITUTIONS
6. PRIVATE INSTITUTIONS
LISTS OF PRICE COLLECTION CENTRES
No. of Items and Price Quotations of Some Major Groups
No. of Items Price Quotations
Groups & Sub-Groups of Commodities Ktm Terai Hills Ktm Terai Hills Food & Beverages 102 88 100 408 880 700Cloth, Clothings & Sew. Services 54 52 52 216 520 364Footwear 13 12 14 52 120 98 Housing: House Furnishing & H.H. Goods 26 22 20 104 220 140 Fuel, Light & Water 7 7 7 28 70 49 Cleaning Supplies 9 12 6 36 120 42 House Rent 1 1 1 4 10 7 Transport & Communication 11 8 6 44 80 42 Medical & Personal Care 41 35 41 164 350 287Education, Reading & Recreation 30 22 30 120 220 210Tobacco 7 8 7 28 80 49 All Total 301 267 284 1204 2670 1988i) weekly, monthly, quatarly, half yearly and yearly quotations may vary, due to the nature of different commodities. ii) Only one quoation is presented for each commodity whether the nature
of data is weekly, monthly, quaterly, half yearly or yearly.
Number of Items selected for Price Collection
Sectors
Total
Weekly
Monthly
Quarterly
Half
Yearly
Yearly
Ktm
Valley
301
74
81-91
84-85
36-40
11
Terai
267
59-62
76-83
75-77
32-34
9-10
Hills
284
70-75
73-82
71-79
33-37
10-11
14
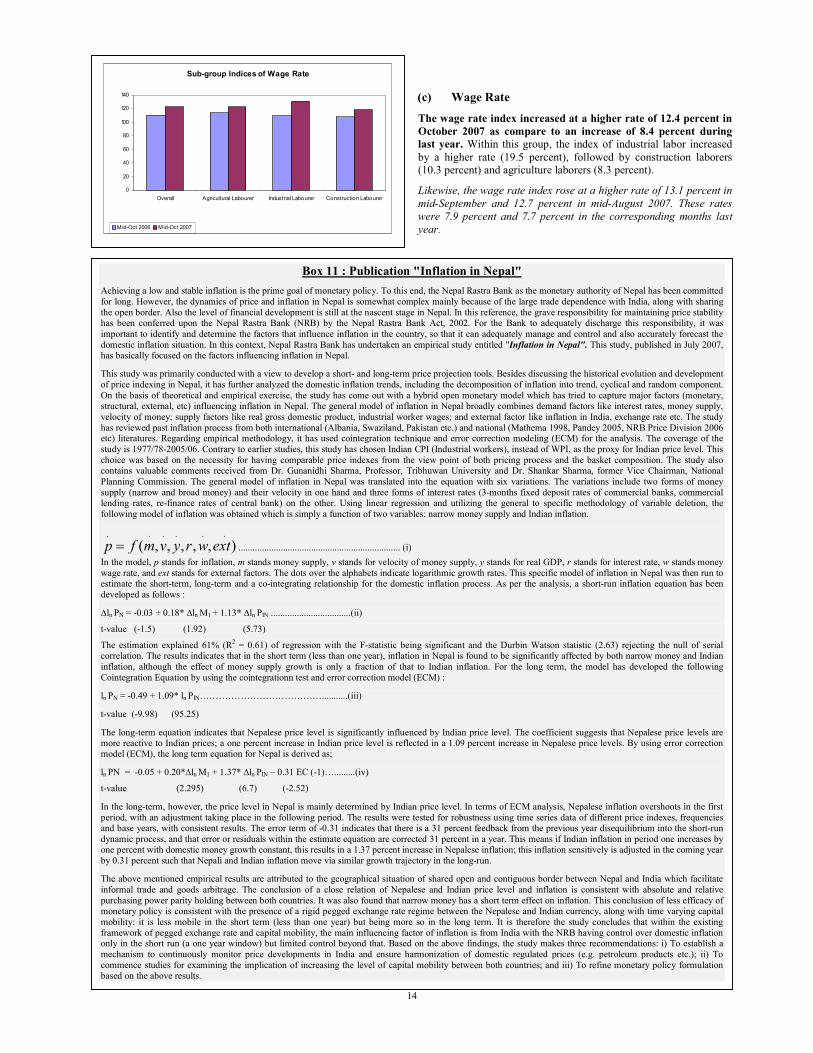
(c) Wage Rate
The wage rate index increased at a higher rate of 12.4 percent in
October 2007 as compare to an increase of 8.4 percent during
last year. Within this group, the index of industrial labor increased by a higher rate (19.5 percent), followed by construction laborers (10.3 percent) and agriculture laborers (8.3 percent).
Likewise, the wage rate index rose at a higher rate of 13.1 percent in
mid-September and 12.7 percent in mid-August 2007. These rates
were 7.9 percent and 7.7 percent in the corresponding months last
year.
Sub-group Indices of Wage Rate
0
20
40
60
80
100
120
140
Overall Agricultural Labourer Industrial Labourer Construction Labourer
M id-Oct 2006 Mid-Oct 2007
Box 11 : Publication "Inflation in Nepal"
Achieving a low and stable inflation is the prime goal of monetary policy. To this end, the Nepal Rastra Bank as the monetary authority of Nepal has been committed for long. However, the dynamics of price and inflation in Nepal is somewhat complex mainly because of the large trade dependence with India, along with sharing the open border. Also the level of financial development is still at the nascent stage in Nepal. In this reference, the grave responsibility for maintaining price stability has been conferred upon the Nepal Rastra Bank (NRB) by the Nepal Rastra Bank Act, 2002. For the Bank to adequately discharge this responsibility, it was important to identify and determine the factors that influence inflation in the country, so that it can adequately manage and control and also accurately forecast the domestic inflation situation. In this context, Nepal Rastra Bank has undertaken an empirical study entitled "Inflation in Nepal". This study, published in July 2007, has basically focused on the factors influencing inflation in Nepal.
This study was primarily conducted with a view to develop a short- and long-term price projection tools. Besides discussing the historical evolution and development of price indexing in Nepal, it has further analyzed the domestic inflation trends, including the decomposition of inflation into trend, cyclical and random component. On the basis of theoretical and empirical exercise, the study has come out with a hybrid open monetary model which has tried to capture major factors (monetary, structural, external, etc) influencing inflation in Nepal. The general model of inflation in Nepal broadly combines demand factors like interest rates, money supply, velocity of money; supply factors like real gross domestic product, industrial worker wages; and external factor like inflation in India, exchange rate etc. The study has reviewed past inflation process from both international (Albania, Swaziland, Pakistan etc.) and national (Mathema 1998, Pandey 2005, NRB Price Division 2006 etc) literatures. Regarding empirical methodology, it has used cointegration technique and error correction modeling (ECM) for the analysis. The coverage of the study is 1977/78-2005/06. Contrary to earlier studies, this study has chosen Indian CPI (Industrial workers), instead of WPI, as the proxy for Indian price level. This choice was based on the necessity for having comparable price indexes from the view point of both pricing process and the basket composition. The study also contains valuable comments received from Dr. Gunanidhi Sharma, Professor, Tribhuwan University and Dr. Shankar Sharma, former Vice Chairman, National Planning Commission. The general model of inflation in Nepal was translated into the equation with six variations. The variations include two forms of money supply (narrow and broad money) and their velocity in one hand and three forms of interest rates (3-months fixed deposit rates of commercial banks, commercial lending rates, re-finance rates of central bank) on the other. Using linear regression and utilizing the general to specific methodology of variable deletion, the following model of inflation was obtained which is simply a function of two variables: narrow money supply and Indian inflation.
......
),,,,,( extwryvmfp = ..................................................................... (i)
In the model, p stands for inflation, m stands money supply, v stands for velocity of money supply, y stands for real GDP, r stands for interest rate, w stands money wage rate, and ext stands for external factors. The dots over the alphabets indicate logarithmic growth rates. This specific model of inflation in Nepal was then run to estimate the short-term, long-term and a co-integrating relationship for the domestic inflation process. As per the analysis, a short-run inflation equation has been developed as follows :
∆ln PN = -0.03 + 0.18* ∆ln M1 + 1.13* ∆ln PIN ..................................(ii)
t-value (-1.5) (1.92) (5.73)
The estimation explained 61% (R2 = 0.61) of regression with the F-statistic being significant and the Durbin Watson statistic (2.63) rejecting the null of serial
correlation. The results indicates that in the short term (less than one year), inflation in Nepal is found to be significantly affected by both narrow money and Indian inflation, although the effect of money supply growth is only a fraction of that to Indian inflation. For the long term, the model has developed the following Cointegration Equation by using the cointegrationn test and error correction model (ECM) :
ln PN = -0.49 + 1.09* ln PIN…………………………………...........(iii)
t-value (-9.98) (95.25)
The long-term equation indicates that Nepalese price level is significantly influenced by Indian price level. The coefficient suggests that Nepalese price levels are more reactive to Indian prices; a one percent increase in Indian price level is reflected in a 1.09 percent increase in Nepalese price levels. By using error correction model (ECM), the long term equation for Nepal is derived as;
ln PN = -0.05 + 0.20*∆ln M1 + 1.37* ∆ln PIN – 0.31 EC (-1)….........(iv)
t-value (2.295) (6.7) (-2.52)
In the long-term, however, the price level in Nepal is mainly determined by Indian price level. In terms of ECM analysis, Nepalese inflation overshoots in the first period, with an adjustment taking place in the following period. The results were tested for robustness using time series data of different price indexes, frequencies and base years, with consistent results. The error term of -0.31 indicates that there is a 31 percent feedback from the previous year disequilibrium into the short-run dynamic process, and that error or residuals within the estimate equation are corrected 31 percent in a year. This means if Indian inflation in period one increases by one percent with domestic money growth constant, this results in a 1.37 percent increase in Nepalese inflation; this inflation sensitively is adjusted in the coming year by 0.31 percent such that Nepali and Indian inflation move via similar growth trajectory in the long-run.
The above mentioned empirical results are attributed to the geographical situation of shared open and contiguous border between Nepal and India which facilitate informal trade and goods arbitrage. The conclusion of a close relation of Nepalese and Indian price level and inflation is consistent with absolute and relative purchasing power parity holding between both countries. It was also found that narrow money has a short term effect on inflation. This conclusion of less efficacy of monetary policy is consistent with the presence of a rigid pegged exchange rate regime between the Nepalese and Indian currency, along with time varying capital mobility: it is less mobile in the short term (less than one year) but being more so in the long term. It is therefore the study concludes that within the existing framework of pegged exchange rate and capital mobility, the main influencing factor of inflation is from India with the NRB having control over domestic inflation only in the short run (a one year window) but limited control beyond that. Based on the above findings, the study makes three recommendations: i) To establish a mechanism to continuously monitor price developments in India and ensure harmonization of domestic regulated prices (e.g. petroleum products etc.); ii) To commence studies for examining the implication of increasing the level of capital mobility between both countries; and iii) To refine monetary policy formulation based on the above results.

15
(d) M-O-M NSWRI
The overall M-O-M National Salary and Wage Rate Index increased by 0.2 percent in mid-October 2007. It is mainly attributed to the 0.2 percent growth in wage rate index during
the month.
Likewise, the M-O-M NSWRI increased marginally by rate of
0.4 percent in mid-September and 2.9 percent in mid-August
2007.
M -O-M change o f NSWRI
0.0
0.1
0.2
0.3
0.4
0.5
0.6
Overall Salary Index Wage Rate Index
Mid-Sept 2007 Mid-Oc t 2007
Box 12 : Household Budget Surveys and Relative Weightages of Different Groups in CPI
NRB is the domestic authority which collects price information and construct CPI index. The CPI index captures the average household's consumption basket. This basket is determined by national level Household Budget Surveys (HBS). The objective of the survey is to make more representative basket in terms of cities, markets, items and weights for different commodities, income and occupation of the people.
NRB has conducted three Household Budget Surveys (HBS) during 1972/73, 1984/85 and 1995/96 respectively; the basic compositions and relative weightage of the different commodities and services for the three completed HBS are provided in the figures below. Likewise, the fourth survey is presently under progress and purposes to address the shortcoming of previous HBS of being urban-focused and hence suggests to include the rural market centers. The comparative statements of the different household budget surveys are provided below:
Comparative Statement of the Household Budget Survey
Subject First HBS Second HBS Third HBS Fourth HBS*
Survey Period 1972/73 1983/84 1995/96 2005/06
Coverage Rural+ Urban Rural + Urban Urban Only Rural + Urban
Number of Market Centers 18 35 (12 Urban, 23 Rural) 21 52 (23 Urban, 29 Rural)
Sample Households 6,625 5,323 2,500 5,095
Population of the country 11,555,983 15,022,839 18,491,097 23,151,423
No. of Households of the country 2,084,062 2,584,948 3,328,721 4,253,220
Source : Inflation in Nepal, Research Department, NRB, 2007 July *Proposed
Presently, NRB constructs a number of price indices using the composition from the third HBS. These are namely: National Urban CPI, CPI for Kathmandu Valley, CPI for Hills, and CPI for Terai. The CPI basket for Kathmandu Valley consists of 301 items, while it includes 284 and 267 items in the Hills and the Terai regions respectively.
Relative Weightage of Different Groups in CPI (As per HBS)
Groups and Sub-groups of Items
1972/73
(HBS I)
1983/84
(HBS II)
1995/96
(HBS III)
All Items 100.00 100.00 100.00
Foods and beverages 66.78 62.63 53.20
Grains and cereals products 33.01 29.43 18.00
Rice and rice products (28.90) (24.13) (14.16)
Wheat and wheat flour (24.13)
Pulses 3.25 3.27 2.73
Vegetables, fruits and nuts 7.60 8.47 7.89
Spices 2.17 2.23 1.85
Meat, fish and eggs 4.58 4.07 5.21
Milk and milk products 3.82 3.76 4.05
Oil and ghee 5.01 3.36 3.07
Sugar and related products 2.08 1.68 1.21
Beverages 1.24 1.48 2.28
Restaurant meals 4.02 4.88 6.91
Other goods and services 33.22 37.37 46.80
Cloths, clothing and sewing services 8.31 10.09 8.92
Cloths (3.71) (4.04) (2.28)
Clothing (4.60) (6.05) (5.75)
Footwear 1.22 1.72 2.20
Housing 11.02 12.66 14.87
Fuel, light and water (4.95) (6.88) (5.92)
Transport and communication 1.73 2.13 4.03
Medical and personal care 4.41 4.59 8.03
Education, reading and recreation 3.87 4.14 7.09
Tobacco and related products 2.66 2.04 1.66
Source : Inflation in Nepal, Research Department, NRB, 2007 July
Based on the results derived from different Household Budget Surveys (HBSs), it is observed that the weight of food item is continuously falling while the share of non-food item is in increasing trend. The weight of food and beverages group was initially 66.78% in 1972-73 which fell to 62.63% in 1983-84 and further to 53.20% in 1995-96. Contrary to that, the weight of non-food items (other goods and services) has substantially increased from 33.22% in 19972-73 to 37.37% in 1983-84 and 46.80% in 1995-96. This indicates that the consumption pattern of general public is shifting towards non-food items from food items. Observing item-wise within the food and beverage group, the largest weight has been held by the sub-group grains and cereal products. The share of this sub-group is also falling continuously from 33.01% in 1972-73 to 29.43% in 1983-84 and further to 18.00% in 1995-96. Talking about the rice, the largest shareholder in this sub-group, its share is also declining from 28.90% to 24.13% and 14.16% respectively. It indicates that the people are expending less of their money for grains and cereal products and more in other food items. Regarding other subheadings of food and beverage group, the weights of restaurant meals, beverages, meat, fish and eggs, milk and milk products are found in increasing trend while that of sugar and related products, oil and ghee, spices and pulses are slightly declining during the different HBSs. Regarding the sub-headings of non-food items, the largest share has been held by housing. Its share has been continuously rising from 11.02% in 1972-73 to 12.66% in 1983-84 and 14.87% in 1995-96. Likewise, the share of education, transport and communication and the medical and personal care are substantially rising during the different HBS. Likewise, the weights of the items like cloths, footwear, fuel, light and water are found in increasing trend while the expenditure towards tobacco and related products is falling in slow pace.

16
Box 13 : Computing Consumer Price Index in Nepal
A) Consumer Price Index
1. Nepal Rastra Bank had started to develop Weighted National Urban Consumer Price Index for the first time in 1972/73. Efforts have been made since then to make CPI more representative by improving and expanding its scope and coverage in terms of items, market places, and the weight. Accordingly, the CPI series were computed with 1983/84 and 1995/96 subsequent as new base years. The current series of Urban Consumer Price Indices is based on 1995/96 base year.
2. In total, 21 urban market centers have been selected to represent the CPI of the country. The selected market centers according to major geographic regions are as follows:
(1) Kathmandu Valley - Kathmandu, Lalitpur, Bhaktapur and Thimi.
(2) Terai - Damak, Biratnagar, Lahan, Janakpur, Birgunj, Bharatpur, Siddharthanagar, Nepalgunj, Mahendranagar and Dhanagadhi.
(3) Hills - Ilam, Dhanakuta, Hetauda, Pokhara, Banepa, Dipayal and Birendranagar.
- The National Urban Consumer Price Index is derived from regional urban consumer price indices by using the population weight of each region. The population weight is based on 1995 population projection made by Central Bureau of Statistics. The total population covered by the index was estimated to be 26,75,149.
3. To develop the weighting factors for urban consumer price index, households were selected from the total sample excluding the ones in the following four categories.
(i) Households falling on the first, second, ninth and tenth income decile.
(ii) One person households and households composed of more than eight persons.
(iii) Households which obtain more than 50 percent of the value of their consumption expenditures from home production or sources other than the market place.
(iv) Households which have less than 50 percent of their income in cash.
Based on the above four criteria, the income range for households in the different urban regions was found as follows:
Kathmandu Valley - Rs. 4,200 - Rs. 13,498 Hills - Rs. 2,851 - Rs. 8,466 Terai - Rs. 2,570 - Rs. 8.570
4. To construct the price indices, the prices of the commodities included in the commodity basket are collected according to the fixed price collection cycle. Prices are collected from about 900 retail stores and outlets by personal visits. In order to compute the indices, those prices are collected from the market centres from where the consumer has paid a certain price to purchase the specified goods and services including VAT and excise duties. House rents are collected once a year through house rent survey, which covers about 1612 households.
5. The periodicity of Price collection are :
(a) Weekly (Four times per month) :- Rice, Pulses, Flour, Cereal Products, Oil and Ghee, Fresh Vegetables and Fruits, Spices, Milk & Milk Products, Sugar & Sweets.
(b) Monthly :- Meat, Fish & Eggs, Beverages, Restaurant Meals, Cloth, Clothing, Fuel, Cleaning Supplies and religious items.
(c) Quarterly :- Private Transport, Hard Drinks, Footwear, Household Goods, Medicine & Personal Care items and Cigarettes.
(d) Half Yearly :- Sewing Charges, Public Transport, Medical & Personal Care and Reading Materials.
(e) Yearly :- Education Fees, Telephone, Water & Electricity Charges and House Rent.
6. The index is computed according to the Laspeyres' formula as a weighted arithmetic average. The formula is expressed in statistical notation as follows:
∑
∑
−−
=oo
iio
PQ
P
PiPQ
Ino 11 )(
∑
××= −
− oo
io
i
i
PQ
PQ
P
P 1
1
Where, Ino = Represents the index number for the period (i) with base period (o) equal to 100
)( 1−io PQ = Represents the index expenditure weights adjusted for price change to the preceding period
( Pi / 1−iP ) = Represents the change in price from the preceding period to the current period
oo PQ = Represents the index expenditure weight
B) Core Inflation Though the concept of core inflation was first initiated in the 1970s, it has been used by many central banks in the world today. Core inflation is
generally computed either from the CPI or WPI. The headline inflation is influenced by both demand and supply side factors. But, core inflation is that inflation which is influenced by demand side factors only. It is also defined as the persistent part of measured inflation, consists of common trend excluding the relative shocks originated from the supply side. While the headline inflation is often volatile, core inflation can be a more accurate measure of underlying inflation, hence useful for price stability. In the economic literature, it has been argued that core inflation would be a good indicator of current and future trend of inflation, a good measure of inflation for empirical work, and the most importantly, a viable target for monetary policy. In fact, core inflation measures assist the monetary authority to separate the noise and the short-run fluctuations in the inflation from its more persistent trend. Nepal Rastra Bank has also produced core inflation figures since mid-November, 2005. As used by many central banks, NRB applies exclusion-based method for calculating core inflation. This method excludes some supply prone items from CPI list such as (a) rice and rice products, (b) vegetables and fruits, (c) fuel, light and water, and (d) transports. However, there are other methods as well, such as trimmed mean method and weighted median. So far, there is no unanimous view on using the particular method, however. A complete isolation of supply side effects on inflation is still not possible. But, core inflation measures can produce a highly persistent part of inflation from the headline inflation. Since monetary policy hardly influences the supply side disturbance in the economy, it would be pertinent to guide and evaluate the monetary policy in terms of core inflation.

17
Box 14 : Computing Wholesale Price Index in Nepal
3. Base Elements of Wholesale Price Index
(a) Base year : - Fiscal year 1999/2000 (2056/57) is taken as the base year.
- Twelve month's average price is taken as the base year's price. (b)Commodity Basket and Market Centers
Group
No. of Commodity
Price Quotation Number
Agricultural Goods 18 133
Domestic Manufactured Goods 31 129
Imported Goods 22 153
Total
71
415
Marketwise Number of Price Quotation
Price Quotation Number
Market Centre
Agricultural Goods
Domestic Manufactured Goods
Imported Goods
Total
12 Narayanghat 12 4 - 16 13 Kathmandu Valley 38 41 105 184 14 Pokhara 6 2 3 11 15 Bhairahawa 11 4 1 16 16 Butwal 8 1 1 10 17 Nawalparasi - 3 - 3 18 Dang 2 1 - 3 19 Nepalganj 5 4 - 9 20 Dhangadhi 4 2 - 6 Total 133 129 153 415
Price Quotation Number
Market Centre
Agricultural Goods
Domestic Manufactured Goods
Imported Goods
Total
1 Ilam 2 1 - 3 2 Bhadrapur 5 5 - 10 3 Birartnagar 13 24 8 45 4 Dharan 3 - - 3 5 Sunsari Area - 13 - 13 6 Janakpur 7 3 - 10 7 Udayapur - 1 - 1 8 Rautahat 1 1 - 2 9 Bara - 6 - 6 10 Hetaudea - 5 - 5 11 Birganj 16 8 35 59
c) Weight : Weights have been divided on the basis of total annual turnover of the selected commodities.
S.
No.
Group and Sub-groups
Weight
Overall Index 100.0000
1.1 Agricultural Commodities 49.5930
1.1.1 Food Grains 16.5857
1.1.2 Cash Crops 6.0860
1.1.3 Pulses 3.7705
1.1.4 Fruits and Vegetables 11.1830
1.1.5 Spices 1.9487
1.1.6 Livestock Production 10.0191
1.2 Domestic Manufactured Commodities 20.3727
1.2.1 Food Related Products 6.1177
1.2.2 Beverages and Tobacco 5.6936
1.2.3 Construction Materials 4.4958
1.2.4 Others 4.0656
1.3 Imported Commodities 30.0343
1.3.1 Petroleum Products and Medicine 8.0230
1.3.2 Chemical Fertilizers and Chemical Goods 2.4560
1.3.3 Machinery and Transport Vehicles 6.4800
1.3.4 Others
13.0753
d) Formula used for computation of WPI
The following Laspeyres' formula is used to construct the index:
∑ (Ii x Wi)
WPI = ---------------
∑ Wi
Pi
∑ ------- x 100
Po
Ii = -------------------- N
Where : WPI = Wholesale
price index Pi = Price in the current period Po = Price in the base year Wi = Weight assigned to item/sub-groups /group N = Total number of observation
1. Introduction
The changes in prices, influence a wide range of economic activities and a constant watch on prices becomes necessary for the operation and regulation of current economic policies as well as for the purpose of planning and policy formulation. The changes in prices over a period of time can be gauged by the statistical device of index number of prices. The price
index can be either at the wholesale level or at the retail level of the marketing channel. This index is important as it helps in understanding the movement of prices relating to bulk transactions. It is designed to measure the directional movement of prices for a set of selected items in the primary and wholesale market. Item covered in the series are those, which could be precisely defined and are offered in lots by producers/wholesalers/importers. Prices used are generally those which conform to the primary sellers realization at ex-factory or at an organized wholesale level.
2. Definition
(a) Agricultural Goods - Selling price of wholesalers and mills
- In the case of Raw Jute and Sugarcane selling price of farmers to the factory or mills. (b) Domestic Manufactured Goods - First commercial transaction in bulk. (c) Imported Goods - First commercial transaction within the country. (d) Government Controlled Goods - Selling price of public enterprises.
e) Sources and Frequency of Data Collection
- Data are collected from primary source on monthly basis. But some essential and important commodities price is collected bi-monthly.
- The wholesale price index is prepared on national level and published on monthly basis.
Commodity-wise Weight (1) Overall Index 100.0000 36. Iron Rod 0.5019
1.1
Agricultural Commodities
49.5930
37.
GI/HB Wires
0.4672
1. Rice 10.9589 38. Corrugated Sheets 1.1644
2. Maize 0.8938 39. Electric Wires 0.1776
3. Wheat 4.7330 40. Animal Feed 0.2090
4. Sugarcane 1.2489 41. Jute Goods 0.6414
5. Oilsead 1.2720 42. Leather (Processed) 0.1276
6. Jute 0.1463 43. Leather Shoes 0.3591
7. Potato 3.4188 44. Paper 0.8911
8. Pulses 3.7705 45. Matches 0.0962
9. Fruits 5.6427 46. Soap 1.2906
10. Vegetables 5.5403 47. Slipper 0.1020
11. Spices (Other Crops) 1.9487 48. Plastic Goods 0.0763
12. Milk 0.9712 49. Dry cell Battery 0.2723
13. Meat (Buffalo) 3.9899 1.3 Imported Goods 30.0343
14. Meat (Goad) 2.5783 50. Petroleum Products 5.2914
15. Meat (Pig) 0.5421 51. Medicine 2.7316
16. Meat (Chicken) 0.5225 52. Chemical Fertilizers 1.3953
17. Eggs 0.7482 53. Chemicals Goods 1.0607
18. Fish 0.6669 54. Others Machinery & Parts 3.8464
1.2
Domestic Manufactured Commodities
20.3727
55.
Transport Vehicle & Parts
2.6336
19. Sugar 1.0886 56. Horlicks & Powder Mills 0.3216
20. Vegetables Ghee 1.5631 57. Raw Wool 0.9219
21. Mustard Oil 0.0710 58. Salt 0.1138
22. Soybean Oil 0.6830 59. Polethene Granules 0.5649
23. Biscuit 0.1855 60. Readymade Garments 0.5502
24. Processed Milk 0.8386 61. Agri. Instru.& Parts 0.3271
25. Wheat Floor 0.2575 62. Cotton Febrics & Textiles 1.0879
26. Noodles 0.6480 63. Electro. Goods & Equip. 1.6000
27. Tea 0.1686 64. Coal 0.1066
28. Beaten Rice 0.6138 65. Radio, T.V. & Parts 0.2660
29. Soft Drinks 0.9239 66. Tire, Tube & Flapes 0.1667
30. Liquor 1.4558 67. Pipe & Pipe Fittings 0.1456
31. Beer 1.0686 68. Thread 0.5401
32. Cigarette 2.2453 69. Glass Sheet & Wares 0.1619
33. Polethene Pipe 0.0993 70. Other Stationary 0.1340
34. Bricks 0.2181 71. Others 6.0670
35. Cement
1.8676

18
Sources and Methods of Salary and Wage Rate Index Computation
Box 15 : Computing Salary and Wage Rate Index in Nepal
1. Introduction : The changes in salaries and wages influence a wide range of economic activities, that is why a continuous watch on salary and wage prices becomes necessary for the
smooth operation and regulation of current economic policies as well as for the purpose of planning and policy formulation. The statistical device called "The Salary and Wage Rate Index (SWRI)" can gauge changes in the salary and wage prices over a period of time. Thus, SWRI is designed to measure the directional movement of salary and wage for a set of selected groups in the primary markets.
2. Definitions : Broadly speaking, salary is something that remunerates. Alternatively, salary is simply a fixed payment at regular intervals for services like clerical and professionals. Following are the major components and their respective definitions, which are taken into consideration while constructing the salary index. a) Civil Services : Salary prices
provided to the civil servants by government as remuneration and allowances. b) Public Corporations : Salary prices provided by public corporations to their employees as remuneration and allowances. c) Bank and Financial
Institutions : Salary prices provided by banks and financial institutions to their employees as remuneration and allowances. d) Army and Police Forces : Salary prices provided by Royal Nepalese Army and Nepalese police and Armed police forces to their respective employees as remuneration and allowances. e) Education : Salary prices in the form of remuneration and allowances, provided by Tribhuvan University, Government schools and the Private Schools to their respective teaching professionals. f) Private Organizations : Salary prices provided by the private business and industrial organizations to their technical and administrative staffs.
3. Wage Rate Index and
Definitions : In broad term, wage is the money or anything,
which is paid as a return to a labourer for work done and usually figured on an hourly or daily or piecework basis. Following are the major components and their respective definitions, which are used to construct the wage index: (a)
Agricultural Labourer : Wage Prices received by the labourer or workers including kind who are involved in the agriculture sector. (b) Industrial Labourer :
Wages and allowances provided by the Industries to their labourer or workers. (c)
Construction Labourer : Wages and allowances provided by the construction agencies to their labourer or workers involved in the construction related works.
4 (a) Base year : Fiscal year 2004/05 is taken as the base year. Twelve month's average salary and wage rate are taken as the base year's salary and wage rate.
4 (b) Number of Salary Quotation :
Price Quotation Number
A g e n c i e s
Officer
Non Officer
Total
1
Civil Service
1
1
2
2
Public Corporations
5
5
10
3
Bank and Financial
Institutions
4
4
8 4
Army and
Police Forces
3
3
6
5
Education
4
4
8
6
Private Organizations
3
3
6
Total 20 20 40
4 (c) Marketwise Number of Wage Rate Quotation:
Price Quotation Number
Market Center
Agricultural
Labourer1
Industrial
Labourer2
Construction
Labourer3
Total
1 Ilam 6 12 18 36
2 Bhadrapur 6 12 18 36 3 Biratnagar 6 12 18 36
4 Janakpur 6 12 18 36 5 Birgunj 6 12 18 36
6 Kathmandu 6 12 18 36 7 Lalitpur 6 12 18 36
8 Pokhara 6 12 18 36 9 Bhairahawa 6 12 18 36
10 Nepalgunj 6 12 18 36 11 Dhangadhi 6 12 18 36
Total 66 132 198 396
1.Each quotation comprises male and female labourer. 2.Each quotation comprises of four classification based on skills of labourer. 3.Construction group have been divided into 3 sub-groups namely Mason, Carpenter and Worker and first two sub-groups (Mason & carpenter) have been further classified as skilled and unskilled labourers whereas, worker sub-group has been divided into male & female sub-group.
4 (d) Weights :
Weights have been divided and assigned on the basis of Population engaged in employment excluding self -employment. Group-wise and sub-Group-wise weights are assigned as follows. Note :
i) As classified data on officers and non-officers are unavailable for public corporations and bank & financial institutions, weights on the same have been assigned based on the average of
five public corporations and four bank's data.
ii ) Due to the unavailability of data on labourer's skills classification in industrial and construction sectors, equal weights have been assigned for the same.
S.No.
Groups and Sub-groups
Number of Employment
Weight
Overall 3454384 100.00
1 Salary 931506 26.97
Officers 338613 9.80
Non Officers 592893 17.17
2 Wage Rate 2522878 73.03
Agricultural Labourer 1364207 39.49
Industrial Labourer 872253 25.25
Construction Labourer 286418 8.29
1 Salary 931506 26.97
1.1 Civil service 97273 2.82
1.1.1 1 Officers 10536 0.31
1.1.2 2 Non Officers 86737 2.51
2.1 Public Corporations 39153 1.14
2.1.1 1 Officers 6494 0.19
2.1.2 2 Non Officers 32659 0.95
1.3 Bank & Financial Institutions 19000 0.55
1.3.1 1 Officers 3478 0.10
1.3.2 2 Non Officers 15522 0.45
1.4 Army & Police Forces 138631 4.01
1.4.1 1 Officers 5919 0.17
1.4.2 2 Non Officers 132712 3.84
1.5 Education 364449 10.55
1.5.1 1 Officers 234861 6.80
1.5.2 2 Non Officers 129588 3.75
1.6 Private Organisations 273000 7.90
1.6.1 1 Officers 77325 2.24
1.6.2 2 Non Officers 195675 5.66
2 Wage Rate Index 2522878 73.03
2.1 Agricultural Labourer 1364207 39.49
2.1.1 Male 708023 20.49
2.1.2 Female 656184 19.00
2.2 Industrial Labourer 872253 25.25
2.2.1 High Skilled 218063 6.31
2.2.2 Skilled 218063 6.31
2.2.3 Semi Skilled 218063 6.31
2.2.4 Unskilled 218064 6.32
S.No.
Groups and Sub-groups
Number of Employment
Weight
2.3 Construction Labourer 286418 8.29
2.3.1 Mason 95472 2.76
2.3.1.1 Skilled 47736 1.38
2.3.1.2 Unskilled 47736 1.38
2.3.2 Carpenter 95472 2.76
2.3.2.1 Skilled 47736 1.38
2.3.2.2 Unskilled 47736 1.38
2.3.3 Worker 95474 2.77
2.3.3.1 Male 47737 1.38
2.3.3.2 Female 47737 1.39
4 (e) Formula used for the computation of SWRI:
The following working Laspeyres' formula is used to construct the index:
SWRn
∑ ------ x 100 x Wi
SWRo SWRI = ----------------------------
∑ Wi Where:
SWRI = Salary and Wage Rate Index SWRn = Salary and Wage Rate of current period Wi = Weight of the Particular Groups/sub-groups SWRo = Salary and Wage Rate of base period
∑Wi = Total Weight
4 (f) Sources and Frequency of Data Collection
i) Data are collected from the primary and secondary sources on monthly basis.
ii) The salary and wage Rate index is constructed on the national level and will be published every month.

19
Box 16 : CPI Matrix of Some Selected Countries
CCoouunnttrryy AAggeennccyy BBaassee yyeeaarr FFoooodd
%%
NNoonn--
FFoooodd
%%
CCoolllleeccttiioonn MMeetthhooddoollooggyy IInnddeexxiinngg MMeetthhoodd SSuubbssttiittuuttiioonn
1. Argentina Instituto Nacional de Estadística y Censos
1988=100 40.1 59.9 Mostly prices are recorded by means of personal contact, the telephone being used only for certain services for which quality does not often change and for which telephone surveys give a good response.
Laspeyres formula as a weighted arithmetic average with fixed base.
For changes in quality or respondents, or substitution of items, when overlapping price quotations are available, it is assumed that the relationship between the prices reflects the relationship between qualities and that linking is thus possible. If there are no overlapping price quotations to compare quality, a
quality adjustment is made in the price of the new variety so that it can be compared with the former.
2. Australia Australian Bureau of Statistics
1981=100 19.0 81.0 Localities and outlets are selected on the basis of information from the population census, retail trade data and the local knowledge of the field collection officers.
Computed quarterly by Laspeyres chain-linked formula with fixed base. Changes in the weighting pattern in approximately every five years.
Products are reviewed approximately every four to five years. When a given quality disappears, it is taken away and, if warranted, a replacement is substituted using the linking procedure. Regarding quality changes, the techniques adopted are: i) direct assessment of the value of the quality change with a corresponding
adjustment to the price of the item concerned; ii) linking in new specifications.
3. Bangladesh Bangladesh Bureau of Statistics
1973/74 =
100
62.74 37.26 Prices are collected by enumerators from markets, selected retail stores and establishments each week, fortnight, month and quarter.
The index is computed according to the Laspeyres formula as a weighted arithmetic average with fixed base, using weights corresponding to the base period.
When an item is no longer available it is substituted by another item with approximately the same quality, and a linking method is used.
4. Canada Statistics Canada
1986=100 18.05 81.95 Collection centers and outlets are judgmental, based on information from various sources, including market intelligence obtained from the Statistics Canada Regional Offices.
Laspeyres formula as a weighted arithmetic average with fixed basket
When a commodity is out of stock in a given outlet, but prices of similar commodities are observable in other outlets within the same urban-centre stratum, the price is imputed from the observed price movement in these other outlets. Otherwise, the last recorded price is retained, unless the last recorded price is a sale price. However, if a non-seasonal commodity is out of stock in a
given outlet for more that two consecutive periods, its price is no longer used, and the commodity is replaced by a similar one in the same outlet, or, if necessary, by the same or a similar commodity in a different outlet.
5. China State Statistical Bureau
1950=100 NA NA Collected 450 items from 140 cities and 400 items from 230 country towns. It is official list prices for state-owned establishments, free market (fair trade) prices, negotiated prices or the purchase prices of surplus farm produce and side-line products. Collected for in the cities and in the country towns.
The index is also published by region and on base preceding year = 100. Other indices are calculated for Overall Residents and for Overall Farmers, also by region.
6. France Institut national de la statistique et des études économiques
(INSEE)
1980=100 22.67 77.33 Agents collects sales prices from 30,000 retail outlets and service establishments in 108 urban centers with more than 2,000 inhabitants. Collected monthly for
most goods, quarterly for clothing and furnishings and twice a month for fresh products. Mail-order sales are not covered.
Laspeyres chain index. Weights are changed at the beginning of each calendar year. Monthly Index is first computed
on base December of the preceding year = 100; the resulting index is then calculated on fixed base.
If the quality of an item changes, either it is replaced by a similar item assuming that there is no price change, or the quality change is measured and isolated from the price change. New items are
introduced only when their sales become important.
7. India Ministry of Labour, Labour Bureau
1982=100 57.0 43.0 Collected by personal visits from state government employees
Laspeyres formula as a weighted arithmetic average with fixed base.
If the prescribed quality is not available, a substitute quality is selected. The old variety is brought back if it reappears. Adjustments are made for price differences due to quality differences of the substitute. When the substitute
chosen differs in quality by as much as 100 per cent, the price quotations for the new product are linked to those for the product replaced.
8. Indonesia Central bureau of Statistics
1988/89 =
100
Collected weekly, monthly and quarterly by central and local statistical agents from selected retail outlets.
Laspeyres formula as a weighted arithmetic average with fixed base.
If there is quality change, the new quality is introduced only when prices are available for both the current and previous periods.

20
Box 16 : CPI Matrix of Some Selected Countries (contd..)
9. Israel
Central Bureau of
Statistics
1987=100 22.93 77.07 Collected by 20 enumerators and transmitted field offices located in
three large cities, and then transferred to the central office.
Laspeyres formula as a weighted arithmetic
average with fixed base.
Large quality changes and substitutions are linked into the index. Small quality
changes are considered as changes in price. Quality adjustments are made only in some special cases, when there are enough characteristics which can be measured.
10. Japan Statistics Bureau
1990=100 31.40 68.60 First the Bureau sends the prices of previous months to Personal Digital Assistants. Then the PDA collect and send data by e-mail.
Laspeyres formula as a weighted arithmetic average with fixed base.
If the product is no longer available, a similar product is substituted. When the old and the new products are identical, the method of direct linking is used. Otherwise, adjustments are made to the
prices to take into account differences in volume or quality.
11. Korea National Statistical Office
1990=100 32.49 67.51 Collected by agents on 5th, 15th and 25th, regardless of any week day, from retail outlets in 32 cities.
Laspeyres formula as a weighted arithmetic average with fixed base.
If quality changes, it may be directly substituted or the splicing method is adopted. If a given quality disappears, it is substituted by a similar item.
12. Malaysia Department of Statistics
1994=100 36.9 63.1 Collected once a month in the first Monday mornings in the week on
which the 15th falls by agents, from about 10,0800 markets in 73 centers.
Laspeyres formula as a weighted arithmetic
average with fixed base.
Quality changes are eliminated by using quantifiable item characteristics. New
products introduced at base year revision. If quality disappears, a close substitute is linked.
13. Myanmar Central Statistical Orgn.
1978=100 64.42 35.58 Collected each day from Yangon city. Prices of controlled commodities obtained once a month and school fees and transport costs are yearly.
Laspeyres formula as a weighted arithmetic average with fixed base.
If a product is no longer available, it is substituted by a similar product and the base year price of the old product is revised.
14. New Zealand Department
of Statistics
1988=100 18.35 81.65 Price surveys are done in 15
centers by full-time field staff, based in the four main urban areas.
Laspeyres formula as a
weighted arithmetic average with fixed base.
If data are missing, the previous period's
price is carried forward. After a predetermined time, if the data are still unavailable, a substitution is made.
15. Pakistan The Federal Bureau of Statistics (FBS)
1990/91 =
100
40.34 59.66 FBS staff located in 35 Field Offices collect price monthly.
Laspeyres formula.
16. Philippines National
Statistics Office
1988=100 58.5 41.5 Through personal interviews.
Unprocessed food items are collected by the Bureau of Agricultural Statistics. But processed food items, beverages and tobacco, and price data for transportation and services and all other non-food items are collected from National Statistics Office.
Laspeyres formula as a
weighted arithmetic average with fixed base.
Market basket is not changed until base
year changes. If item disappears, a substitution is made as: (a) the substitute must be of the same or almost the same quality as the lost item; (b) the substitute must be of the same price range or price level as the lost item.
17. Russia The Department of Price and
Finance Statistics
December of the
previous
year =
100
51.9 48.1 Prices are collected by specially trained price collectors from the 15th to the 25th day of each
month.
Modified (chain) Laspeyers formula
Item is replaced with a same one from another outlet The last observed price is carried forward; this method is used
when prices are unchanged or increase insignificantly, and for no more than two months. Disappearing item is replaced with a similar one in the same outlet. The price is imputed on the basis of the price movement of the other items in the same group.
18. Singapore Department of Statistics
1987/88 =
100
39.77 60.23 Prices of perishable food and prices from provision shops and crockery shops are collected by personal visits. Others obtained
through mailed questionnaires
Laspeyres formula as a weighted arithmetic average with fixed base.
A splicing method is adopted.
19. Sri Lanka Department of Census and Statistics
1995=100 61.9 38.1 Collected weekly by investigators of Department of Census and Statistics. Weighted average is calculated, with weights assigned in proportion to the estimated quantities sold in the two groups of stores
Laspeyres formula as a weighted arithmetic average with fixed base, data for 1949-50, revalued at 1959 prices.
If a product is not available, a similar product to the original is substituted and a method of linking is used in the calculation.
20. Thailand Commerce Ministry, Dept. of Business Economics
1986=100 40.38 59.62 Collected by Department staffs Laspeyres formula as a weighted arithmetic average with fixed base.
If the characteristics of a product are altered, a method of linking is used. If an item disappears, it is replaced by a similar item.
21. UK Central Statistical Office
1987=100 15.2 84.8 Collected from 180 localities by Central Statistical Office staffs.
Laspeyres' chain index with linking in January each year.
Collectors notify changes in quality which are reviewed each year to reflect changes in consumer taste and behavior.
22. USA US Department of Labor, Bureau of Labor Statistics
1982-84 =
100
17.63 82.37 Consumers are interviewed. Mail questionnaires are used to obtain public utility rates, some fuel prices and prices for certain other items. A probability sample is selected from these outlets, using the expenditure at each outlet as a measure of size.
Laspeyres formula as a weighted arithmetic average with fixed base.
Quality adjustments are made by the commodity specialist when substitution occurs. If quality adjustment is not possible, a linking method is used.
Source : International Labor Organization

i
Table - 1
National Urban Consumer Price Index (1995/96 = 100)
MID-OCTOBER 2007 (ASWIN 2064)
Weight 2005/06 2006/07 2007/08P Percentage Change
Groups & sub-groups % Sep/Oct Aug/Sep Jun/Jul Jul/Aug Aug/Sep Sep/Oct
Col 5
Col 5
Col 8
Col 8
1 2 3 4 5 6 7 8 Over
3
Over
4
Over
5
Over
7
1. OVERALL INDEX 100.00 173.8 184.8 186.9 194.7 197.8 198.7 7.5 1.1 6.3 0.5
1.1. FOOD & BEVERAGES 53.20 168.8 178.0 181.9 191.9 197.4 199.2 7.8 2.2 9.5 0.9
Grains and Cereal Products 18.00 165.4 172.0 173.4 184.1 188.9 192.8 4.8 0.8 11.2 2.1
Rice and Rice Products (14.16) 166.9 167.7 168.1 178.8 184.1 188.8 0.7 0.2 12.3 2.6
Pulses 2.73 139.5 169.7 173.2 197.0 199.9 198.5 24.2 2.1 14.6 -0.7
Vegetables and Fruits 7.89 175.6 187.6 204.2 214.1 236.4 240.4 16.3 8.8 17.7 1.7
Spices 1.85 144.5 167.8 176.9 191.3 189.9 189.9 22.4 5.4 7.3 0.0
Meat, Fish and Eggs 5.21 171.9 179.8 183.3 190.2 193.8 193.1 6.6 1.9 5.3 -0.4
Milk and Milk Products 4.05 156.5 168.4 169.8 181.3 182.0 179.8 8.5 0.8 5.9 -1.2
Oil and Ghee 3.07 146.8 149.7 149.8 166.2 167.5 169.0 2.0 0.1 12.8 0.9
Sugar and Related Products 1.21 163.6 164.3 163.0 135.1 133.9 133.0 -0.4 -0.8 -18.4
-0.7
Beverages 2.28 177.4 186.1 186.1 189.7 190.2 190.5 4.9 0.0 2.4 0.2
Restaurant Meals 6.91 202.4 208.4 208.5 217.0 217.1 217.3 3.0 0.0 4.2 0.1
1.2. NON-FOOD & SERVICES 46.80 179.7 192.7 192.7 197.9 198.1 198.2 7.2 0.0 2.9 0.1
Cloth, Clothing & Sewing Services 8.92 144.5 147.2 147.5 150.3 150.5 150.9 2.1 0.2 2.3 0.3
Cloths (2.28) 133.3 135.4 136.0 135.2 135.1 135.3 2.0 0.4 -0.5 0.1
Clothing (5.75) 143.4 146.1 146.3 149.3 149.6 150.4 2.0 0.1 2.8 0.5
Footwear 2.20 136.2 140.0 140.0 149.5 149.5 149.5 2.8 0.0 6.8 0.0
Housing Goods and Services 14.87 193.9 213.5 213.6 218.7 218.9 218.9 10.2 0.0 2.5 0.0
Fuel, Light and Water (5.92) 263.8 300.9 301.0 304.3 304.5 304.5 14.1 0.0 1.2 0.0
Transport and Communication 4.03 216.9 254.6 254.6 253.3 253.3 253.3 17.4 0.0 -0.5 0.0
Medical and Personal Care 8.03 175.0 179.4 179.4 186.5 186.5 186.5 2.5 0.0 4.0 0.0
Education, Reading and Recreation 7.09 199.9 211.1 211.1 219.4 219.8 219.7 5.6 0.0 4.1 0.0
Tobacco and Related Products 1.66 162.1 172.7 172.7 178.2 178.2 178.2 6.5 0.0 3.2 0.0
PETROLEUM PRODUCT 2.71 378.2 449.0 449.0 449.1 449.1 449.1 18.7 0.0 0.0 0.0
NON-PETROLEUM PRODUCT 97.29 168.3 177.7 179.8 187.8 190.9 192.0 6.8 1.2 6.8 0.6
P = Provisional.

ii
Table - 1
National Urban Consumer Price Index (1995/96 = 100)
MID-SEPTEMBER 2007 (BHADRA 2064)
Weight 2004/05 2005/06 2006/07P Percentage Change
Groups & sub-groups % Aug/Sep Jul/Aug Jun/Jul Jun/Jul Jul/Aug Aug/Sep Col 5 Col 5 Col 8 Col 8
1 2 3 4 5 6 7 8 Over 3
Over 4
Over 5
Over 7
1. OVERALL INDEX 100.00 173.3 183.1 184.8 189.8 194.7 197.8 6.6 0.9 7.0 1.6
1.1. FOOD & BEVERAGES 53.20 168.0 175.0 178.0 184.8 191.9 197.4 6.0 1.7 10.9 2.9
Grains and Cereal Products 18.00 163.3 170.5 172.0 180.8 184.1 188.9 5.3 0.9 9.8 2.6
Rice and Rice Products (14.16) 164.3 167.1 167.7 175.1 178.8 184.1 2.1 0.4 9.8 3.0
Pulses 2.73 139.1 169.5 169.7 189.2 197.0 199.9 22.0 0.1 17.8 1.5
Vegetables and Fruits 7.89 175.7 173.8 187.6 182.4 214.1 236.4 6.8 7.9 26.0 10.4
Spices 1.85 146.1 161.2 167.8 187.8 191.3 189.9 14.9 4.1 13.2 -0.7
Meat, Fish and Eggs 5.21 172.1 182.0 179.8 190.1 190.2 193.8 4.5 -1.2 7.8 1.9
Milk and Milk Products 4.05 156.4 165.9 168.4 177.9 181.3 182.0 7.7 1.5 8.1 0.4
Oil and Ghee 3.07 146.7 149.2 149.7 163.4 166.2 167.5 2.0 0.3 11.9 0.8
Sugar and Related Products 1.21 161.0 164.4 164.3 134.9 135.1 133.9 2.0 -0.1 -18.5
-0.9
Beverages 2.28 177.4 186.0 186.1 188.0 189.7 190.2 4.9 0.1 2.2 0.3
Restaurant Meals 6.91 202.2 206.4 208.4 215.0 217.0 217.1 3.1 1.0 4.2 0.0
1.2. NON-FOOD & SERVICES 46.80 179.5 192.5 192.7 195.4 197.9 198.1 7.4 0.1 2.8 0.1
Cloth, Clothing & Sewing Services 8.92 144.3 146.6 147.2 149.3 150.3 150.5 2.0 0.4 2.2 0.1
Cloths (2.28) 133.2 134.6 135.4 134.6 135.2 135.1 1.7 0.6 -0.2 -0.1
Clothing (5.75) 143.2 145.4 146.1 149.0 149.3 149.6 2.0 0.5 2.4 0.2
Footwear 2.20 136.2 140.0 140.0 146.7 149.5 149.5 2.8 0.0 6.8 0.0
Housing Goods and Services 14.87 193.2 213.4 213.5 217.2 218.7 218.9 10.5 0.0 2.5 0.1
Fuel, Light and Water (5.92) 262.5 300.8 300.9 301.9 304.3 304.5 14.6 0.0 1.2 0.1
Transport and Communication 4.03 216.9 254.6 254.6 255.1 253.3 253.3 17.4 0.0 -0.5 0.0
Medical and Personal Care 8.03 175.0 179.4 179.4 183.2 186.5 186.5 2.5 0.0 4.0 0.0
Education, Reading and Recreation
7.09 199.9 211.0 211.1 212.0 219.4 219.8 5.6 0.0 4.1 0.2
Tobacco and Related Products 1.66 162.1 172.7 172.7 173.2 178.2 178.2 6.5 0.0 3.2 0.0
PETROLEUM PRODUCT 2.71 378.2 448.6 449.0 449.1 449.1 449.1 18.7 0.1 0.0 0.0
NON-PETROLEUM PRODUCT 97.29 167.8 175.9 177.7 182.7 187.8 190.9 5.9 1.0 7.4 1.7
P = Provisional.

iii
Table - 1
National Urban Consumer Price Index (1995/96 = 100)
MID-AUGUST 2007 (SRAWAN 2064)
Weight 2005/06 2006/07 2007/08P Percentage Change
Groups & sub-groups % Jul/Aug Jun/Jul Jun/Jul May/Jun Jun/Jul Jul/Aug Col 5 Col 5 Col 8 Col 8
1 2 3 4 5 6 7 8 Over 3 Over 4 Over 5 Over 7
1. OVERALL INDEX 100.00 170.7 180.6 183.1 187.6 189.8 194.7 7.3 1.4 6.3 2.6
1.1. FOOD & BEVERAGES 53.20 165.0 172.9 175.0 180.8 184.8 191.9 6.1 1.2 9.7 3.8
Grains and Cereal Products 18.00 158.8 170.1 170.5 178.5 180.8 184.1 7.4 0.2 8.0 1.8
Rice and Rice Products (14.16) 158.9 166.7 167.1 172.0 175.1 178.8 5.2 0.2 7.0 2.1
Pulses 2.73 137.1 171.2 169.5 185.8 189.2 197.0 23.6 -1.0 16.2 4.1
Vegetables and Fruits 7.89 166.7 160.9 173.8 164.0 182.4 214.1 4.3 8.0 23.2 17.4
Spices 1.85 145.9 159.9 161.2 190.4 187.8 191.3 10.5 0.8 18.7 1.9
Meat, Fish and Eggs 5.21 173.0 183.9 182.0 190.8 190.1 190.2 5.2 -1.0 4.5 0.1
Milk and Milk Products 4.05 156.2 163.7 165.9 169.9 177.9 181.3 6.2 1.3 9.3 1.9
Oil and Ghee 3.07 147.7 148.4 149.2 163.2 163.4 166.2 1.0 0.5 11.4 1.7
Sugar and Related Products 1.21 158.9 164.7 164.4 137.2 134.9 135.1 3.5 -0.2 -17.8 0.1
Beverages 2.28 177.4 183.8 186.0 188.0 188.0 189.7 4.8 1.2 2.0 0.9
Restaurant Meals 6.91 201.5 206.6 206.4 214.9 215.0 217.0 2.4 -0.1 5.1 0.9
1.2. NON-FOOD & SERVICES 46.80 177.2 189.6 192.5 195.4 195.4 197.9 8.6 1.5 2.8 1.3
Cloth, Clothing & Sewing Services 8.92 144.1 145.9 146.6 149.3 149.3 150.3 1.7 0.5 2.5 0.7
Cloths (2.28) 133.2 134.2 134.6 134.5 134.6 135.2 1.1 0.3 0.4 0.4
Clothing (5.75) 142.8 145.0 145.4 148.9 149.0 149.3 1.8 0.3 2.7 0.2
Footwear 2.20 136.2 139.5 140.0 146.7 146.7 149.5 2.8 0.4 6.8 1.9
Housing Goods and Services 14.87 186.6 211.7 213.4 217.1 217.2 218.7 14.4 0.8 2.5 0.7
Fuel, Light and Water (5.92) 246.1 300.8 300.8 301.9 301.9 304.3 22.2 0.0 1.2 0.8
Transport and Communication 4.03 215.9 253.6 254.6 255.1 255.1 253.3 17.9 0.4 -0.5 -0.7
Medical and Personal Care 8.03 175.0 177.7 179.4 183.2 183.2 186.5 2.5 1.0 4.0 1.8
Education, Reading and Recreation
7.09 199.8 200.3 211.0 212.0 212.0 219.4 5.6 5.3 4.0 3.5
Tobacco and Related Products 1.66 162.1 164.6 172.7 173.2 173.2 178.2 6.5 4.9 3.2 2.9
PETROLEUM PRODUCT 2.71 339.6 448.7 448.6 449.1 449.1 449.1 32.1 0.0 0.1 0.0
NON-PETROLEUM PRODUCT 97.29 166.1 173.4 175.9 180.5 182.7 187.8 5.9 1.4 6.8 2.8
P = Provisional.
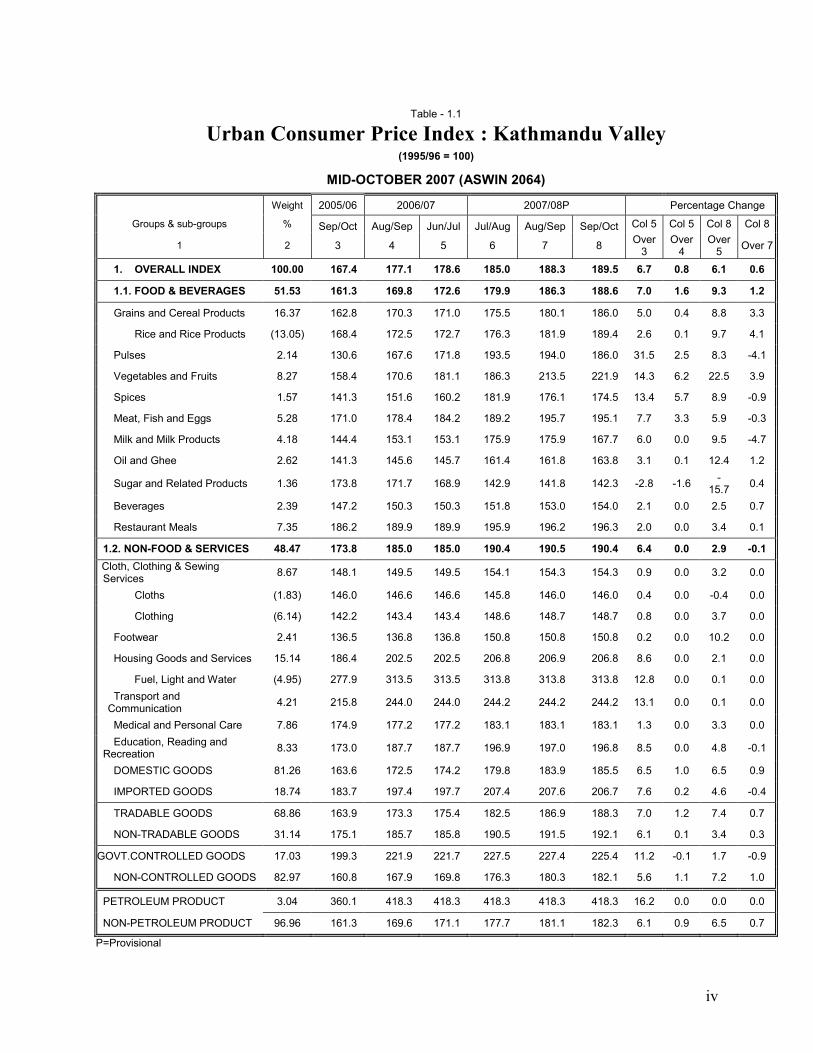
iv
Table - 1.1
Urban Consumer Price Index : Kathmandu Valley (1995/96 = 100)
MID-OCTOBER 2007 (ASWIN 2064)
Weight 2005/06 2006/07 2007/08P Percentage Change
Groups & sub-groups % Sep/Oct Aug/Sep Jun/Jul Jul/Aug Aug/Sep Sep/Oct Col 5 Col 5 Col 8 Col 8
1 2 3 4 5 6 7 8 Over 3
Over 4
Over 5
Over 7
1. OVERALL INDEX 100.00 167.4 177.1 178.6 185.0 188.3 189.5 6.7 0.8 6.1 0.6
1.1. FOOD & BEVERAGES 51.53 161.3 169.8 172.6 179.9 186.3 188.6 7.0 1.6 9.3 1.2
Grains and Cereal Products 16.37 162.8 170.3 171.0 175.5 180.1 186.0 5.0 0.4 8.8 3.3
Rice and Rice Products (13.05) 168.4 172.5 172.7 176.3 181.9 189.4 2.6 0.1 9.7 4.1
Pulses 2.14 130.6 167.6 171.8 193.5 194.0 186.0 31.5 2.5 8.3 -4.1
Vegetables and Fruits 8.27 158.4 170.6 181.1 186.3 213.5 221.9 14.3 6.2 22.5 3.9
Spices 1.57 141.3 151.6 160.2 181.9 176.1 174.5 13.4 5.7 8.9 -0.9
Meat, Fish and Eggs 5.28 171.0 178.4 184.2 189.2 195.7 195.1 7.7 3.3 5.9 -0.3
Milk and Milk Products 4.18 144.4 153.1 153.1 175.9 175.9 167.7 6.0 0.0 9.5 -4.7
Oil and Ghee 2.62 141.3 145.6 145.7 161.4 161.8 163.8 3.1 0.1 12.4 1.2
Sugar and Related Products 1.36 173.8 171.7 168.9 142.9 141.8 142.3 -2.8 -1.6 -15.7
0.4
Beverages 2.39 147.2 150.3 150.3 151.8 153.0 154.0 2.1 0.0 2.5 0.7
Restaurant Meals 7.35 186.2 189.9 189.9 195.9 196.2 196.3 2.0 0.0 3.4 0.1
1.2. NON-FOOD & SERVICES 48.47 173.8 185.0 185.0 190.4 190.5 190.4 6.4 0.0 2.9 -0.1
Cloth, Clothing & Sewing Services
8.67 148.1 149.5 149.5 154.1 154.3 154.3 0.9 0.0 3.2 0.0
Cloths (1.83) 146.0 146.6 146.6 145.8 146.0 146.0 0.4 0.0 -0.4 0.0
Clothing (6.14) 142.2 143.4 143.4 148.6 148.7 148.7 0.8 0.0 3.7 0.0
Footwear 2.41 136.5 136.8 136.8 150.8 150.8 150.8 0.2 0.0 10.2 0.0
Housing Goods and Services 15.14 186.4 202.5 202.5 206.8 206.9 206.8 8.6 0.0 2.1 0.0
Fuel, Light and Water (4.95) 277.9 313.5 313.5 313.8 313.8 313.8 12.8 0.0 0.1 0.0
Transport and Communication
4.21 215.8 244.0 244.0 244.2 244.2 244.2 13.1 0.0 0.1 0.0
Medical and Personal Care 7.86 174.9 177.2 177.2 183.1 183.1 183.1 1.3 0.0 3.3 0.0
Education, Reading and Recreation
8.33 173.0 187.7 187.7 196.9 197.0 196.8 8.5 0.0 4.8 -0.1
DOMESTIC GOODS 81.26 163.6 172.5 174.2 179.8 183.9 185.5 6.5 1.0 6.5 0.9
IMPORTED GOODS 18.74 183.7 197.4 197.7 207.4 207.6 206.7 7.6 0.2 4.6 -0.4
TRADABLE GOODS 68.86 163.9 173.3 175.4 182.5 186.9 188.3 7.0 1.2 7.4 0.7
NON-TRADABLE GOODS 31.14 175.1 185.7 185.8 190.5 191.5 192.1 6.1 0.1 3.4 0.3
GOVT.CONTROLLED GOODS 17.03 199.3 221.9 221.7 227.5 227.4 225.4 11.2 -0.1 1.7 -0.9
NON-CONTROLLED GOODS 82.97 160.8 167.9 169.8 176.3 180.3 182.1 5.6 1.1 7.2 1.0
PETROLEUM PRODUCT 3.04 360.1 418.3 418.3 418.3 418.3 418.3 16.2 0.0 0.0 0.0
NON-PETROLEUM PRODUCT 96.96 161.3 169.6 171.1 177.7 181.1 182.3 6.1 0.9 6.5 0.7
P=Provisional

v
Table - 1.1
Urban Consumer Price Index : Kathmandu Valley (1995/96 = 100)
MID-SEPTEMBER 2007 (BHADRA 2064)
Weight 2004/05 2005/06 2006/07P Percentage Change
Groups & sub-groups % Aug/Sep Jul/Aug Jun/Jul Jun/Jul Jul/Aug Aug/Sep Col 5 Col 5 Col 8 Col 8
1 2 3 4 5 6 7 8 Over 3 Over 4
Over 5
Over 7
1. OVERALL INDEX 100.00 167.1 174.9 177.1 181.0 185.0 188.3 6.0 1.3 6.3 1.8
1.1. FOOD & BEVERAGES 51.53 160.7 165.7 169.8 173.8 179.9 186.3 5.7 2.5 9.7 3.6
Grains and Cereal Products 16.37 161.1 169.1 170.3 173.9 175.5 180.1 5.7 0.7 5.8 2.6
Rice and Rice Products (13.05) 166.2 172.3 172.5 174.3 176.3 181.9 3.8 0.1 5.4 3.2
Pulses 2.14 130.2 166.9 167.6 186.1 193.5 194.0 28.7 0.4 15.8 0.3
Vegetables and Fruits 8.27 158.4 145.2 170.6 158.1 186.3 213.5 7.7 17.5 25.1 14.6
Spices 1.57 142.1 144.3 151.6 173.5 181.9 176.1 6.7 5.1 16.2 -3.2
Meat, Fish and Eggs 5.28 171.7 185.5 178.4 189.0 189.2 195.7 3.9 -3.8 9.7 3.4
Milk and Milk Products 4.18 144.4 153.1 153.1 171.6 175.9 175.9 6.0 0.0 14.9 0.0
Oil and Ghee 2.62 141.7 144.9 145.6 160.1 161.4 161.8 2.8 0.5 11.1 0.2
Sugar and Related Products 1.36 170.5 170.0 171.7 143.9 142.9 141.8 0.7 1.0 -17.4
-0.8
Beverages 2.39 147.2 150.3 150.3 150.1 151.8 153.0 2.1 0.0 1.8 0.8
Restaurant Meals 7.35 186.1 189.7 189.9 195.9 195.9 196.2 2.0 0.1 3.3 0.2
1.2. NON-FOOD & SERVICES 48.47 173.8 184.8 185.0 188.8 190.4 190.5 6.4 0.1 3.0 0.1
Cloth, Clothing & Sewing Services
8.67 148.1 149.1 149.5 153.9 154.1 154.3 0.9 0.3 3.2 0.1
Cloths (1.83) 146.1 146.6 146.6 145.7 145.8 146.0 0.3 0.0 -0.4 0.1
Clothing (6.14) 142.2 142.8 143.4 148.6 148.6 148.7 0.8 0.4 3.7 0.1
Footwear 2.41 136.5 136.8 136.8 150.8 150.8 150.8 0.2 0.0 10.2 0.0
Housing Goods and Services 15.14 186.3 202.2 202.5 206.2 206.8 206.9 8.7 0.1 2.2 0.0
Fuel, Light and Water (4.95) 277.9 313.5 313.5 313.8 313.8 313.8 12.8 0.0 0.1 0.0
Transport and Communication
4.21 215.8 244.0 244.0 244.2 244.2 244.2 13.1 0.0 0.1 0.0
Medical and Personal Care 7.86 174.9 177.2 177.2 181.4 183.1 183.1 1.3 0.0 3.3 0.0
Education, Reading and Recreation
8.33 173.1 187.7 187.7 190.4 196.9 197.0 8.4 0.0 5.0 0.1
Tobacco and Related Products
1.85 144.0 157.0 157.0 157.1 157.8 157.8 9.0 0.0 0.5 0.0
DOMESTIC GOODS 81.26 163.2 170.0 172.5 175.3 179.8 183.9 5.7 1.5 6.6 2.3
IMPORTED GOODS 18.74 184.0 196.5 197.4 205.7 207.4 207.6 7.3 0.5 5.2 0.1
TRADABLE GOODS 68.86 163.4 170.3 173.3 177.7 182.5 186.9 6.1 1.8 7.8 2.4
NON-TRADABLE GOODS 31.14 175.3 185.3 185.7 188.4 190.5 191.5 5.9 0.2 3.1 0.5
GOVT.CONTROLLED GOODS
17.03 199.1 221.7 221.9 224.4 227.5 227.4 11.5 0.1 2.5 0.0
NON-CONTROLLED GOODS 82.97 160.5 165.3 167.9 172.1 176.3 180.3 4.6 1.6 7.4 2.3
PETROLEUM PRODUCT 3.04 360.1 418.3 418.3 418.3 418.3 418.3 16.2 0.0 0.0 0.0
NON-PETROLEUM PRODUCT 96.96 161.0 167.3 169.6 173.6 177.7 181.1 5.3 1.4 6.8 1.9
P=Provisional

vi
Table - 1.1
Urban Consumer Price Index : Kathmandu Valley (1995/96 = 100)
MID-AUGUST 2007 (SRAWAN 2064)
Weight 2004/05 2005/06 2006/07P Percentage Change
Groups & sub-groups % Jul/Aug June/July Jun/Jul May/June June/July Jul/Aug Col 5 Col 5 Col 8 Col 8
1 2 3 4 5 6 7 8 Over 3
Over 4 Over 5 Over 7
1. OVERALL INDEX 100.00 164.0 172.2 174.9 179.6 181.0 185.0 6.6 1.6 5.8 2.2
1.1. FOOD & BEVERAGES 51.53 156.9 163.8 165.7 171.1 173.8 179.9 5.6 1.2 8.6 3.5
Grains and Cereal Products 16.37 155.7 167.8 169.1 173.9 173.9 175.5 8.6 0.8 3.8 0.9
Rice and Rice Products (13.05) 159.5 170.8 172.3 174.3 174.3 176.3 8.0 0.9 2.3 1.1
Pulses 2.14 127.9 170.5 166.9 179.9 186.1 193.5 30.5 -2.1 15.9 4.0
Vegetables and Fruits 8.27 146.9 134.5 145.2 147.3 158.1 186.3 -1.2 8.0 28.3 17.8
Spices 1.57 139.0 144.0 144.3 182.0 173.5 181.9 3.8 0.2 26.1 4.8
Meat, Fish and Eggs 5.28 171.9 188.9 185.5 192.8 189.0 189.2 7.9 -1.8 2.0 0.1
Milk and Milk Products 4.18 144.5 153.0 153.1 154.6 171.6 175.9 6.0 0.1 14.9 2.5
Oil and Ghee 2.62 142.5 144.3 144.9 160.8 160.1 161.4 1.7 0.4 11.4 0.8
Sugar and Related Products 1.36 165.6 168.3 170.0 149.0 143.9 142.9 2.7 1.0 -15.9 -0.7
Beverages 2.39 147.2 147.7 150.3 150.1 150.1 151.8 2.1 1.8 1.0 1.1
Restaurant Meals 7.35 186.0 189.7 189.7 195.2 195.9 195.9 2.0 0.0 3.3 0.0
1.2. NON-FOOD & SERVICES 48.47 171.6 181.1 184.8 188.7 188.8 190.4 7.7 2.0 3.0 0.8
Cloth, Clothing & Sewing Services
8.67 148.1 148.8 149.1 153.5 153.9 154.1 0.7 0.2 3.4 0.1
Cloths (1.83) 146.0 146.6 146.6 144.6 145.7 145.8 0.4 0.0 -0.5 0.1
Clothing (6.14) 142.2 142.8 142.8 148.4 148.6 148.6 0.4 0.0 4.1 0.0
Footwear 2.41 136.5 136.8 136.8 150.8 150.8 150.8 0.2 0.0 10.2 0.0
Housing Goods and Services 15.14 179.9 200.9 202.2 206.2 206.2 206.8 12.4 0.6 2.3 0.3
Fuel, Light and Water (4.95) 258.1 313.5 313.5 313.8 313.8 313.8 21.5 0.0 0.1 0.0
Transport and Communication
4.21 213.6 244.6 244.0 244.2 244.2 244.2 14.2 -0.2 0.1 0.0
Medical and Personal Care 7.86 174.9 175.6 177.2 181.4 181.4 183.1 1.3 0.9 3.3 0.9
Education, Reading and Recreation
8.33 173.0 172.7 187.7 190.4 190.4 196.9 8.5 8.7 4.9 3.4
Tobacco and Related Products
1.85 144.0 144.8 157.0 157.1 157.1 157.8 9.0 8.4 0.5 0.4
DOMESTIC GOODS 81.26 160.7 167.0 170.0 173.7 175.3 179.8 5.8 1.8 5.8 2.6
IMPORTED GOODS 18.74 178.3 194.7 196.5 205.3 205.7 207.4 10.2 0.9 5.5 0.8
TRADABLE GOODS 68.86 159.3 168.4 170.3 175.8 177.7 182.5 6.9 1.1 7.2 2.7
NON-TRADABLE GOODS 31.14 174.4 180.6 185.3 188.2 188.4 190.5 6.3 2.6 2.8 1.1
GOVT.CONTROLLED GOODS
17.03 192.4 216.4 221.7 221.6 224.4 227.5 15.2 2.4 2.6 1.4
NON-CONTROLLED GOODS 82.97 158.2 163.1 165.3 171.0 172.1 176.3 4.5 1.3 6.7 2.4
PETROLEUM PRODUCT 3.04 324.9 418.3 418.3 418.3 418.3 418.3 28.7 0.0 0.0 0.0
NON-PETROLEUM PRODUCT 96.96 159.0 164.5 167.3 172.2 173.6 177.7 5.2 1.7 6.2 2.4
P=Provisional

vii
Table - 1.2
Urban Consumer Price Index : Terai (1995/96 = 100)
MID-OCTOBER 2007 (ASWIN 2064)
Weight 2005/06 2006/07 2007/08P Percentage Change
Groups & sub-groups % Sep/Oct Aug/Sep Jun/Jul Jul/Aug Aug/Sep Sep/Oct Col 5 Col 5 Col 8 Col 8
1 2 3 4 5 6 7 8 Over 3 Over 4 Over 5 Over 7
1. OVERALL INDEX 100.00 177.4 188.6 191.3 199.8 202.7 203.8 7.8 1.4 6.5 0.5
1.1. FOOD & BEVERAGES 54.98 172.5 181.6 186.3 197.6 202.7 204.6 8.0 2.6 9.8 0.9
Grains and Cereal Products 19.76 170.3 174.7 176.8 191.4 196.5 199.7 3.8 1.2 13.0 1.6
Rice and Rice Products (15.42) 170.8 166.4 167.3 182.4 187.4 191.2 -2.0 0.5 14.3 2.0
Wheat and Wheat Flour (3.30) 175.7 215.8 223.7 236.7 243.2 244.7 27.3 3.7 9.4 0.6
Pulses 3.35 143.1 165.6 169.2 193.1 197.5 200.5 18.2 2.2 18.5 1.5
Vegetables and Fruits 7.63 187.5 198.9 220.5 231.5 251.0 253.7 17.6 10.9 15.1 1.1
Spices 2.06 141.9 175.4 186.8 194.6 195.4 196.9 31.6 6.5 5.4 0.8
Meat, Fish and Eggs 5.02 171.2 180.3 182.8 190.5 192.3 191.4 6.8 1.4 4.7 -0.5
Milk and Milk Products 3.98 158.9 170.9 172.4 177.3 178.5 179.1 8.5 0.9 3.9 0.3
Oil and Ghee 3.23 148.3 152.4 152.5 169.9 171.3 172.2 2.8 0.1 12.9 0.5
Sugar and Related Products 1.09 155.2 159.1 158.5 129.3 127.8 126.8 2.1 -0.4 -20.0 -0.8
Beverages 2.00 183.3 196.7 196.7 202.1 202.3 202.1 7.3 0.0 2.7 -0.1
Restaurant Meals 6.86 205.2 211.8 212.0 220.7 220.5 220.9 3.3 0.1 4.2 0.2
1.2. NON-FOOD & SERVICES 45.02 183.3 197.3 197.4 202.5 202.7 202.9 7.7 0.1 2.8 0.1
Cloth, Clothing & Sewing Services
9.16 146.0 148.5 149.1 151.3 151.4 152.3 2.1 0.4 2.1 0.6
Cloths (2.63) 134.0 137.2 138.5 138.4 138.0 138.1 3.4 0.9 -0.3 0.1
Clothing (5.45) 146.5 148.1 148.4 150.9 151.3 152.7 1.3 0.2 2.9 0.9
Footwear 1.78 135.1 139.8 139.8 149.4 149.4 149.4 3.5 0.0 6.9 0.0
Housing Goods and Services 14.80 199.1 220.9 220.9 226.5 226.8 226.8 10.9 0.0 2.7 0.0
Fuel, Light and Water (6.91) 258.5 297.2 297.2 303.1 303.4 303.4 15.0 0.0 2.1 0.0
Transport and Communication
4.16 207.2 244.8 244.8 245.0 245.0 245.0 18.1 0.0 0.1 0.0
Medical and Personal Care 8.04 175.8 180.4 180.4 188.3 188.3 188.3 2.6 0.0 4.4 0.0
Education, Reading and Recreation
5.54 215.1 227.3 227.4 233.9 234.5 234.5 5.7 0.0 3.1 0.0
Tobacco and Related Products
1.54 170.2 178.9 178.9 185.7 185.7 185.7 5.1 0.0 3.8 0.0
PETROLEUM PRODUCT 2.54 380.6 451.6 451.6 451.7 451.7 451.7 18.7 0.0 0.0 0.0
NON-PETROLEUM PRODUCT 97.46 172.0 181.8 184.5 193.3 196.2 197.4 7.3 1.5 7.0 0.6
P = Provisional.
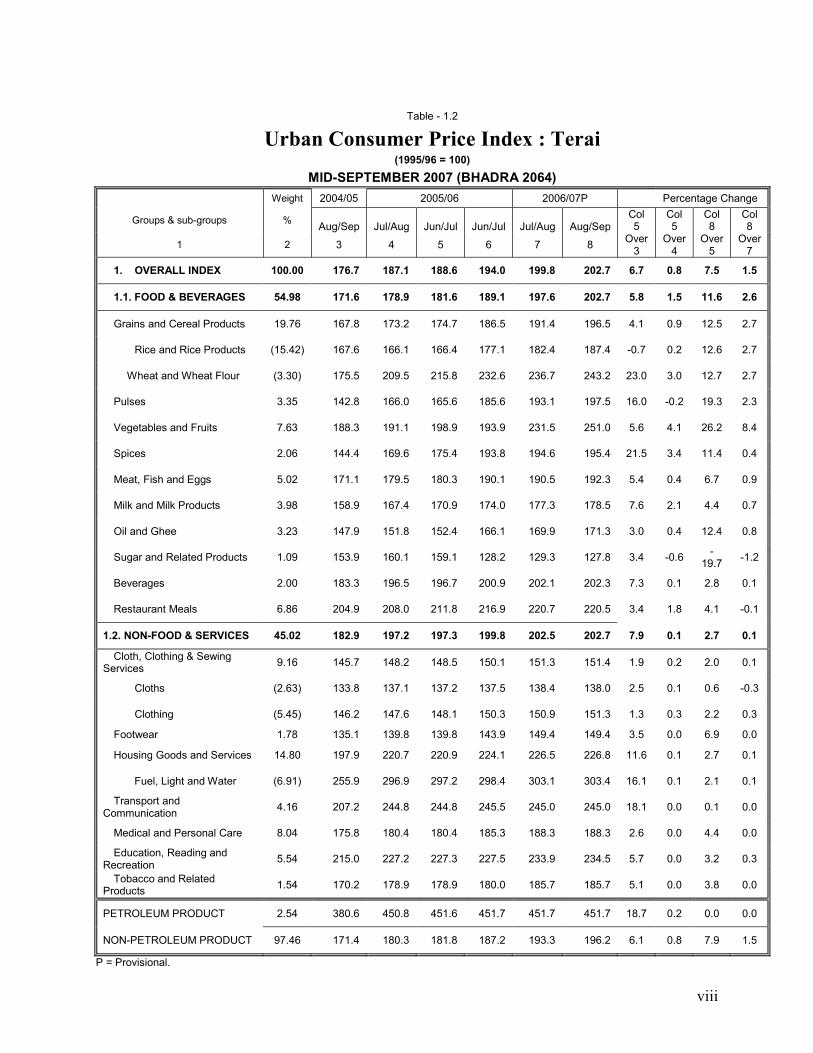
viii
Table - 1.2
Urban Consumer Price Index : Terai (1995/96 = 100)
MID-SEPTEMBER 2007 (BHADRA 2064)
Weight 2004/05 2005/06 2006/07P Percentage Change
Groups & sub-groups % Aug/Sep Jul/Aug Jun/Jul Jun/Jul Jul/Aug Aug/Sep
Col 5
Col 5
Col 8
Col 8
1 2 3 4 5 6 7 8 Over 3
Over 4
Over 5
Over 7
1. OVERALL INDEX 100.00 176.7 187.1 188.6 194.0 199.8 202.7 6.7 0.8 7.5 1.5
1.1. FOOD & BEVERAGES 54.98 171.6 178.9 181.6 189.1 197.6 202.7 5.8 1.5 11.6 2.6
Grains and Cereal Products 19.76 167.8 173.2 174.7 186.5 191.4 196.5 4.1 0.9 12.5 2.7
Rice and Rice Products (15.42) 167.6 166.1 166.4 177.1 182.4 187.4 -0.7 0.2 12.6 2.7
Wheat and Wheat Flour (3.30) 175.5 209.5 215.8 232.6 236.7 243.2 23.0 3.0 12.7 2.7
Pulses 3.35 142.8 166.0 165.6 185.6 193.1 197.5 16.0 -0.2 19.3 2.3
Vegetables and Fruits 7.63 188.3 191.1 198.9 193.9 231.5 251.0 5.6 4.1 26.2 8.4
Spices 2.06 144.4 169.6 175.4 193.8 194.6 195.4 21.5 3.4 11.4 0.4
Meat, Fish and Eggs 5.02 171.1 179.5 180.3 190.1 190.5 192.3 5.4 0.4 6.7 0.9
Milk and Milk Products 3.98 158.9 167.4 170.9 174.0 177.3 178.5 7.6 2.1 4.4 0.7
Oil and Ghee 3.23 147.9 151.8 152.4 166.1 169.9 171.3 3.0 0.4 12.4 0.8
Sugar and Related Products 1.09 153.9 160.1 159.1 128.2 129.3 127.8 3.4 -0.6 -19.7
-1.2
Beverages 2.00 183.3 196.5 196.7 200.9 202.1 202.3 7.3 0.1 2.8 0.1
Restaurant Meals 6.86 204.9 208.0 211.8 216.9 220.7 220.5 3.4 1.8 4.1 -0.1
1.2. NON-FOOD & SERVICES 45.02 182.9 197.2 197.3 199.8 202.5 202.7 7.9 0.1 2.7 0.1
Cloth, Clothing & Sewing Services
9.16 145.7 148.2 148.5 150.1 151.3 151.4 1.9 0.2 2.0 0.1
Cloths (2.63) 133.8 137.1 137.2 137.5 138.4 138.0 2.5 0.1 0.6 -0.3
Clothing (5.45) 146.2 147.6 148.1 150.3 150.9 151.3 1.3 0.3 2.2 0.3
Footwear 1.78 135.1 139.8 139.8 143.9 149.4 149.4 3.5 0.0 6.9 0.0
Housing Goods and Services 14.80 197.9 220.7 220.9 224.1 226.5 226.8 11.6 0.1 2.7 0.1
Fuel, Light and Water (6.91) 255.9 296.9 297.2 298.4 303.1 303.4 16.1 0.1 2.1 0.1
Transport and Communication
4.16 207.2 244.8 244.8 245.5 245.0 245.0 18.1 0.0 0.1 0.0
Medical and Personal Care 8.04 175.8 180.4 180.4 185.3 188.3 188.3 2.6 0.0 4.4 0.0
Education, Reading and Recreation
5.54 215.0 227.2 227.3 227.5 233.9 234.5 5.7 0.0 3.2 0.3
Tobacco and Related Products
1.54 170.2 178.9 178.9 180.0 185.7 185.7 5.1 0.0 3.8 0.0
PETROLEUM PRODUCT 2.54 380.6 450.8 451.6 451.7 451.7 451.7 18.7 0.2 0.0 0.0
NON-PETROLEUM PRODUCT 97.46 171.4 180.3 181.8 187.2 193.3 196.2 6.1 0.8 7.9 1.5
P = Provisional.

ix
Table - 1.2
Urban Consumer Price Index : Terai (1995/96 = 100)
MID-AUGUST 2007 (SRAWAN 2064)
Weight 2004/05 2005/06 2006/07P Percentage Change
Groups & sub-groups % Jul/Aug June/July Jun/Jul May/June June/July Jul/Aug Col 5 Col 5 Col 8 Col 8
1 2 3 4 5 6 7 8 Over 3 Over 4 Over 5 Over 7
1. OVERALL INDEX 100.00 173.6 184.7 187.1 191.3 194.0 199.8 7.8 1.3 6.8 3.0
1.1. FOOD & BEVERAGES 54.98 168.0 176.7 178.9 184.3 189.1 197.6 6.5 1.2 10.5 4.5
Grains and Cereal Products 19.76 162.8 173.4 173.2 183.0 186.5 191.4 6.4 -0.1 10.5 2.6
Rice and Rice Products (15.42) 161.9 166.6 166.1 172.5 177.1 182.4 2.6 -0.3 9.8 3.0
Wheat and Wheat Flour (3.30) 172.5 209.9 209.5 233.9 232.6 236.7 21.4 -0.2 13.0 1.8
Pulses 3.35 141.0 167.1 166.0 183.9 185.6 193.0 17.7 -0.7 16.3 4.0
Vegetables and Fruits 7.63 176.0 175.1 191.1 170.9 193.9 231.5 8.6 9.1 21.1 19.4
Spices 2.06 145.1 168.2 169.6 193.1 193.8 194.6 16.9 0.8 14.7 0.4
Meat, Fish and Eggs 5.02 172.5 180.7 179.5 189.2 190.1 190.5 4.1 -0.7 6.1 0.2
Milk and Milk Products 3.98 158.4 164.2 167.4 171.6 174.0 177.3 5.7 1.9 5.9 1.9
Oil and Ghee 3.23 149.2 150.3 151.8 165.3 166.1 169.9 1.7 1.0 11.9 2.3
Sugar and Related Products 1.09 153.2 161.9 160.1 129.2 128.2 129.3 4.5 -1.1 -19.2 0.9
Beverages 2.00 183.3 194.6 196.5 200.8 200.9 202.1 7.2 1.0 2.8 0.6
Restaurant Meals 6.86 203.5 208.9 208.0 217.0 216.9 220.7 2.2 -0.4 6.1 1.8
1.2. NON-FOOD & SERVICES
45.02 180.5 194.6 197.2 199.8 199.8 202.5 9.3 1.3 2.7 1.4
Cloth, Clothing & Sewing Services
9.16 145.2 147.3 148.2 150.2 150.1 151.3 2.1 0.6 2.1 0.8
Cloths (2.63) 133.8 136.3 137.1 138.0 137.5 138.4 2.5 0.6 0.9 0.7
Clothing (5.45) 145.4 147.1 147.6 150.2 150.3 150.9 1.5 0.3 2.2 0.4
Footwear 1.78 135.1 139.2 139.8 143.9 143.9 149.4 3.5 0.4 6.9 3.8
Housing Goods and Services
14.80 191.2 219.2 220.7 223.9 224.1 226.5 15.4 0.7 2.6 1.1
Fuel, Light and Water (6.91) 241.5 297.0 296.9 298.4 298.4 303.1 22.9 0.0 2.1 1.6
Transport and Communication
4.16 206.7 243.7 244.8 245.5 245.5 245.0 18.4 0.5 0.1 -0.2
Medical and Personal Care 8.04 175.8 179.0 180.4 185.3 185.3 188.3 2.6 0.8 4.4 1.6
Education, Reading and Recreation
5.54 214.9 216.2 227.2 227.5 227.5 233.9 5.7 5.1 2.9 2.8
Tobacco and Related Products
1.54 170.2 173.9 178.9 180.0 180.0 185.7 5.1 2.9 3.8 3.2
PETROLEUM PRODUCT 2.54 341.2 451.1 450.8 451.7 451.7 451.7 32.1 -0.1 0.2 0.0
NON-PETROLEUM PRODUCT
97.46 169.3 177.8 180.3 184.5 187.2 193.3 6.5 1.4 7.2 3.3
P = Provisional.

x
Table - 1.3
Urban Consumer Price Index : Hills (1995/96 = 100)
MID-OCTOBER 2007 (ASWIN 2064)
Weight 2005/06 2006/07 2007/08P Percentage Change
Groups & sub-groups % Sep/Oct Aug/Sep Jun/Jul Jul/Aug Aug/Sep Sep/Oct Col 5 Col 5 Col 8 Col 8
1 2 3 4 5 6 7 8 Over 3
Over 4
Over 5
Over 7
1. OVERALL INDEX 100.00 175.1 187.2 188.7 197.0 199.9 200.3 7.8 0.8 6.1 0.2
1.1. FOOD & BEVERAGES
53.04 171.1 182.2 185.0 196.2 201.6 202.2 8.1 1.5 9.3 0.3
Grains and Cereal Products
17.76 156.5 167.7 168.2 178.6 183.0 185.2 7.5 0.3 10.1 1.2
Rice and Rice Products
(13.86) 154.0 163.0 162.9 173.2 178.6 181.3 5.8 -0.1 11.3 1.5
Wheat and Wheat Flour (1.06) 172.4 212.0 220.2 223.8 226.8 226.9 27.7 3.9 3.0 0.0
Pulses 2.66 144.2 184.4 186.1 213.3 216.1 213.4 29.1 0.9 14.7 -1.2
Vegetables and Fruits 7.61 171.7 185.0 198.5 212.8 234.6 235.1 15.6 7.3 18.4 0.2
Spices 2.01 156.9 174.2 177.7 198.1 198.0 196.3 13.3 2.0 10.5 -0.9
Meat, Fish and Eggs 5.48 175.5 180.9 183.5 191.2 194.7 194.6 4.6 1.4 6.0 -0.1
Milk and Milk Products 3.94 169.6 187.1 190.2 200.7 201.5 201.3 12.1 1.7 5.8 -0.1
Oil and Ghee 3.77 151.7 149.3 149.1 163.8 166.6 168.8 -1.7 -0.1 13.2 1.3
Sugar and Related Products
1.15 169.8 166.1 165.7 137.9 137.3 134.1 -2.4 -0.2 -19.1
-2.3
Beverages 2.65 211.0 216.4 216.4 218.8 218.9 219.1 2.6 0.0 1.2 0.1
Restaurant Meals 6.01 221.6 229.8 229.8 242.1 242.1 242.1 3.7 0.0 5.4 0.0
1.2. NON-FOOD & SERVICES
46.96 179.6 192.9 193.0 197.9 198.0 198.0 7.5 0.1 2.6 0.0
Cloth, Clothing & Sewing Services
8.94 134.4 139.9 139.9 141.3 141.7 142.0 4.1 0.0 1.5 0.2
Cloths (2.54) 110.2 111.9 111.9 109.0 109.8 110.3 1.5 0.0 -1.4 0.5
Clothing (5.51) 137.2 145.1 145.2 146.3 146.6 146.8 5.8 0.1 1.1 0.1
Footwear 2.63 138.7 145.8 145.8 147.8 147.8 147.8 5.1 0.0 1.4 0.0
Housing Goods and Services
14.40 192.1 211.8 212.1 217.3 217.4 217.4 10.4 0.1 2.5 0.0
Fuel, Light and Water (5.92) 255.0 290.2 290.8 292.0 292.0 292.0 14.0 0.2 0.4 0.0
Transport and Communication
3.31 244.7 298.1 298.1 290.6 290.6 290.6 21.8 0.0 -2.5 0.0
Medical and Personal Care 8.39 173.1 180.0 180.0 187.0 187.0 187.0 4.0 0.0 3.9 0.0
Education, Reading and Recreation
7.78 203.4 205.9 205.9 217.5 217.5 217.5 1.2 0.0 5.6 0.0
Tobacco and Related Products
1.51 170.2 181.8 181.8 191.4 191.4 191.4 6.8 0.0 5.3 0.0
PETROLEUM PRODUCT 2.33 401.3 492.7 492.7 492.6 492.6 492.6 22.8 0.0 0.0 0.0
NON-PETROLEUM PRODUCT
97.67 169.7 179.9 181.5 189.9 192.9 193.3 7.0 0.9 6.5 0.2
P = Provisional.

xi
Table - 1.3
Urban Consumer Price Index : Hills (1995/96 = 100)
MID-SEPTEMBER 2007 (BHADRA 2064)
Weight 2004/05 2005/06 2006/07P Percentage Change
Groups & sub-groups % Aug/Sep Jul/Aug Jun/Jul Jun/Jul Jul/Aug Aug/Sep Col 5 Col 5 Col 8 Col 8
1 2 3 4 5 6 7 8 Over 3
Over 4
Over 5
Over 7
1. OVERALL INDEX 100.00 174.7 185.6 187.2 192.9 197.0 199.9 7.2 0.9 6.8 1.5
1.1. FOOD & BEVERAGES
53.04 170.4 179.5 182.2 191.4 196.2 201.6 6.9 1.5 10.6 2.8
Grains and Cereal Products
17.76 155.3 165.6 167.7 176.6 178.6 183.0 8.0 1.3 9.1 2.5
Rice and Rice Products
(13.86) 152.4 160.8 163.0 170.9 173.2 178.6 7.0 1.4 9.6 3.1
Wheat and Wheat Flour (1.06) 171.9 210.1 212.0 222.0 223.8 226.8 23.3 0.9 7.0 1.3
Pulses 2.66 143.8 183.2 184.4 204.2 213.3 216.1 28.2 0.7 17.2 1.3
Vegetables and Fruits 7.61 170.5 174.1 185.0 191.2 212.8 234.6 8.5 6.3 26.8 10.2
Spices 2.01 157.5 166.8 174.2 195.4 198.1 198.0 10.6 4.4 13.7 -0.1
Meat, Fish and Eggs 5.48 175.7 182.8 180.9 191.7 191.2 194.7 3.0 -1.0 7.6 1.8
Milk and Milk Products 3.94 169.5 182.9 187.1 199.0 200.7 201.5 10.4 2.3 7.7 0.4
Oil and Ghee 3.77 151.6 149.4 149.3 161.5 163.8 166.6 -1.5 -0.1 11.6 1.7
Sugar and Related Products
1.15 164.7 166.6 166.1 138.3 137.9 137.3 0.9 -0.3 -17.3
-0.4
Beverages 2.65 211.0 216.4 216.4 215.9 218.8 218.9 2.6 0.0 1.2 0.0
Restaurant Meals 6.01 221.6 229.8 229.8 241.5 242.1 242.1 3.7 0.0 5.4 0.0
1.2. NON-FOOD & SERVICES
46.96 179.6 192.5 192.9 194.6 197.9 198.0 7.4 0.2 2.6 0.1
Cloth, Clothing & Sewing Services
8.94 134.3 137.9 139.9 139.7 141.3 141.7 4.2 1.5 1.3 0.3
Cloths (2.54) 110.2 108.2 111.9 108.6 109.0 109.8 1.5 3.4 -1.9 0.7
Clothing (5.51) 137.0 143.8 145.1 146.1 146.3 146.6 5.9 0.9 1.0 0.2
Footwear 2.63 138.7 145.8 145.8 147.4 147.8 147.8 5.1 0.0 1.4 0.0
Housing Goods and Services
14.40 192.1 211.8 211.8 216.9 217.3 217.4 10.3 0.0 2.6 0.0
Fuel, Light and Water (5.92) 255.0 290.2 290.2 291.8 292.0 292.0 13.8 0.0 0.6 0.0
Transport and Communication
3.31 244.7 298.1 298.1 298.7 290.6 290.6 21.8 0.0 -2.5 0.0
Medical and Personal Care 8.39 173.1 180.0 180.0 180.4 187.0 187.0 4.0 0.0 3.9 0.0
Education, Reading and Recreation
7.78 203.4 205.9 205.9 205.9 217.5 217.5 1.2 0.0 5.6 0.0
Tobacco and Related Products
1.51 170.2 181.8 181.8 181.3 191.4 191.4 6.8 0.0 5.3 0.0
PETROLEUM PRODUCT 2.33 401.3 492.7 492.7 492.6 492.6 492.6 22.8 0.0 0.0 0.0
NON-PETROLEUM PRODUCT
97.67 169.3 178.3 179.9 185.7 189.9 192.9 6.3 0.9 7.2 1.6
P = Provisional.

xii
Table - 1.3
Urban Consumer Price Index : Hills (1995/96 = 100)
MID-AUGUST 2007 (SRAWAN 2064)
Weight 2004/05 2005/06 2006/07P Percentage Change
Groups & sub-groups % Jul/Aug Jun/Jul Jun/Jul May/Jun Jun/Jul Jul/Aug Col 5 Col 5 Col 8 Col 8
1 2 3 4 5 6 7 8 Over 3
Over 4
Over 5
Over 7
1. OVERALL INDEX 100.00 173.6 183.5 185.6 190.6 192.9 197.0 6.9 1.1 6.1 2.1
1.1. FOOD & BEVERAGES
53.04 170.2 177.6 179.5 187.2 191.4 196.2 5.5 1.1 9.3 2.5
Grains and Cereal Products
17.76 153.3 164.7 165.6 174.0 176.6 178.6 8.0 0.5 7.9 1.1
Rice and Rice Products
(13.86) 149.9 160.2 160.8 167.3 170.9 173.2 7.3 0.4 7.7 1.3
Wheat and Wheat Flour (1.06) 170.5 212.9 210.1 226.3 222.0 223.8 23.2 -1.3 6.5 0.8
Pulses 2.66 141.7 183.2 183.2 200.8 204.2 213.3 29.3 0.0 16.4 4.5
Vegetables and Fruits 7.61 174.4 166.0 174.1 172.8 191.2 212.8 -0.2 4.9 22.2 11.3
Spices 2.01 159.0 163.7 166.8 196.9 195.4 198.1 4.9 1.9 18.8 1.4
Meat, Fish and Eggs 5.48 175.8 184.4 182.8 192.0 191.7 191.2 4.0 -0.9 4.6 -0.3
Milk and Milk Products 3.94 169.2 180.1 182.9 190.4 199.0 200.7 8.1 1.6 9.7 0.9
Oil and Ghee 3.77 152.0 149.8 149.4 161.2 161.5 163.8 -1.7 -0.3 9.6 1.4
Sugar and Related Products
1.15 162.9 166.6 166.6 139.0 138.3 137.9 2.3 0.0 -17.2
-0.3
Beverages 2.65 211.0 214.2 216.4 215.7 215.9 218.8 2.6 1.0 1.1 1.3
Restaurant Meals 6.01 221.5 228.4 229.8 241.4 241.5 242.1 3.7 0.6 5.4 0.2
1.2. NON-FOOD & SERVICES
46.96 177.5 190.1 192.5 194.5 194.6 197.9 8.5 1.3 2.8 1.7
Cloth, Clothing & Sewing Services
8.94 134.5 137.3 137.9 139.8 139.7 141.3 2.5 0.4 2.5 1.1
Cloths (2.54) 110.8 108.0 108.2 108.5 108.6 109.0 -2.3 0.2 0.7 0.4
Clothing (5.51) 137.0 142.9 143.8 146.2 146.1 146.3 5.0 0.6 1.7 0.1
Footwear 2.63 138.7 144.9 145.8 147.4 147.4 147.8 5.1 0.6 1.4 0.3
Housing Goods and Services
14.40 185.4 209.2 211.8 216.6 216.9 217.3 14.2 1.2 2.6 0.2
Fuel, Light and Water (5.92) 238.5 290.1 290.2 291.8 291.8 292.0 21.7 0.0 0.6 0.1
Transport and Communication
3.31 244.4 295.1 298.1 298.7 298.7 290.6 22.0 1.0 -2.5 -2.7
Medical and Personal Care 8.39 173.1 177.5 180.0 180.4 180.4 187.0 4.0 1.4 3.9 3.7
Education, Reading and Recreation
7.78 203.4 203.0 205.9 205.9 205.9 217.5 1.2 1.4 5.6 5.6
Tobacco and Related Products
1.51 170.2 172.3 181.8 181.3 181.3 191.4 6.8 5.5 5.3 5.6
PETROLEUM PRODUCT 2.33 359.7 492.4 492.7 492.6 492.6 492.6 37.0 0.1 0.0 0.0
NON-PETROLEUM PRODUCT
97.67 169.2 176.1 178.3 183.4 185.7 189.9 5.4 1.2 6.5 2.3
P = Provisional.

xiii
Table-1a
Core CPI Inflation** (1995/96 = 100)
MID-OCTOBER 2007 (ASWIN 2064)
Weight Revised 2005/06 2006/07 2007/08P Change % Group & sub-groups
% Sep/Oct Sep/Oct Sep/Oct 2005/06 2006/07P
OVERALL (Adjusted) 100.00 100.00 165.1 175.3 183.6 6.2 4.7
FOOD AND BEVERAGES (Adjusted) 53.20 45.53 168.3 183.1 193.6 8.8 5.7
Grains and Cereal Products
Rice and Rice Products 14.16 0.00 166.9 168.1 188.8 0.7 12.3
Wheat and Wheat Flour 1.79 2.62 177.3 224.4 237.7 26.6 5.9
Other Grains and Cereal Products 2.05 3.00 144.7 164.5 176.8 13.7 7.5
Pulses 2.73 3.99 139.5 173.2 198.5 24.2 14.6
Vegetables and Fruits 7.89 0.00 175.6 204.2 240.4 16.3 17.7
Spices 1.85 2.70 144.5 176.9 189.9 22.4 7.3
Meat, Fish and Eggs 5.21 7.61 171.9 183.3 193.1 6.6 5.3
Milk and Milk Products 4.05 5.92 156.5 169.8 179.8 8.5 5.9
Oil and Ghee 3.07 4.49 146.8 149.8 169.0 2.0 12.8
Sugar and Related Products 1.21 1.77 163.6 163.0 133.0 -0.4 -18.4
Beverages 2.28 3.33 177.4 186.1 190.5 4.9 2.4
Restaurant Meals 6.91 10.10 202.4 208.5 217.3 3.0 4.2
NON-FOOD AND SERVICES (Adjusted) 46.80 54.47 162.4 168.7 175.1 3.9 3.8
Cloth, Clothing & Sewing Services 8.92 13.04 144.5 147.5 150.9 2.1 2.3
Footwear 2.20 3.22 136.2 140.0 149.5 2.8 6.8
Housing goods and Services
House Furnishing and Household Goods
3.50 5.12 139.7 144.6 152.7 3.5 5.6
House Rent 4.19 6.12 154.9 161.8 168.5 4.5 4.1
Cleaning Supplies 1.26 1.84 143.9 160.3 164.1 11.4 2.4
Fuel, Light and Water 5.92 0.00 263.8 301.0 304.5 14.1 1.2
Transport 3.61 0.00 227.5 269.5 268.0 18.5 -0.6
Communication 0.42 0.61 126.6 126.6 126.6 0.0 0.0
Medical and Personal Care 8.03 11.74 175.0 179.4 186.5 2.5 4.0
Education, Reading and Recreation 7.09 10.36 199.9 211.1 219.7 5.6 4.1
Tobacco and Related Products 1.66 2.43 162.1 172.7 178.2 6.5 3.2
P: Provisional **Based on the exclusion principle by excluding rice and rice products, vegetables and fruits, fuel, light and water and transports. Total weight excluded 31.58 Total weight included 68.42

xiv
Table-1a
Core CPI Inflation** (1995/96 = 100)
MID-SEPTEMBER 2007 (BHADRA 2064)
Weight Revised 2005/06 2006/07 2007/08P Change % Group & sub-groups
% Aug/Sep Aug/Sep Aug/Sep 2005/06 2006/07P
OVERALL (Adjusted) 100.00 100.00 165.0 174.2 183.6 5.6 5.4
FOOD AND BEVERAGES (Adjusted) 53.20 45.53 168.2 180.9 193.9 7.6 7.2
Grains and Cereal Products
Rice and Rice Products 14.16 0.00 164.3 167.7 184.1 2.1 9.8
Wheat and Wheat Flour 1.79 2.62 176.7 216.9 237.0 22.8 9.3
Other Grains and Cereal Products 2.05 3.00 144.4 162.1 176.2 12.3 8.7
Pulses 2.73 3.99 139.1 169.7 199.9 22.0 17.8
Vegetables and Fruits 7.89 0.00 175.7 187.6 236.4 6.8 26.0
Spices 1.85 2.70 146.1 167.8 189.9 14.9 13.2
Meat, Fish and Eggs 5.21 7.61 172.1 179.8 193.8 4.5 7.8
Milk and Milk Products 4.05 5.92 156.4 168.4 182.0 7.7 8.1
Oil and Ghee 3.07 4.49 146.7 149.7 167.5 2.0 11.9
Sugar and Related Products 1.21 1.77 161.0 164.3 133.9 2.0 -18.5
Beverages 2.28 3.33 177.4 186.1 190.2 4.9 2.2
Restaurant Meals 6.91 10.10 202.2 208.4 217.1 3.1 4.2
NON-FOOD AND SERVICES (Adjusted) 46.80 54.47 162.4 168.6 175.1 3.9 3.8
Cloth, Clothing & Sewing Services 8.92 13.04 144.3 147.2 150.5 2.0 2.2
Footwear 2.20 3.22 136.2 140.0 149.5 2.8 6.8
Housing goods and Services
House Furnishing and Household Goods 3.50 5.12 139.7 144.6 152.7 3.5 5.6
House Rent 4.19 6.12 154.9 161.8 168.5 4.5 4.1
Cleaning Supplies 1.26 1.84 143.9 160.3 164.0 11.4 2.3
Fuel, Light and Water 5.92 0.00 262.5 300.9 304.5 14.6 1.2
Transport 3.61 0.00 227.5 269.5 268.0 18.5 -0.6
Communication 0.42 0.61 126.6 126.6 126.6 0.0 0.0
Medical and Personal Care 8.03 11.74 175.0 179.4 186.5 2.5 4.0
Education, Reading and Recreation 7.09 10.36 199.9 211.1 219.8 5.6 4.1
Tobacco and Related Products 1.66 2.43 162.1 172.7 178.2 6.5 3.2
P: Provisional **Based on the exclusion principle by excluding rice and rice products, vegetables and fruits, fuel, light and water and transports. Total weight excluded 31.58 Total weight included 68.42

xv
Table-1a
Core CPI Inflation** (1995/96 = 100)
MID-AUGUST 2007 (SRAWAN 2064)
Weight Revised 2005/06 2006/07 2007/08P Change % Group & sub-groups % Jul/Aug Jul/Aug Jul/Aug 2005/06 2006/07P
OVERALL (Adjusted) 100.00 100.00 164.8 173.5 182.9 5.2 5.5
FOOD AND BEVERAGES (Adjusted) 53.20 45.53 167.9 179.5 192.6 7.0 7.3
Grains and Cereal Products
Rice and Rice Products 14.16 0.00 158.9 167.1 178.8 5.2 7.0
Wheat and Wheat Flour 1.79 2.62 174.8 212.4 232.8 21.5 9.6
Other Grains and Cereal Products 2.05 3.00 144.3 158.2 175.5 9.6 10.9
Pulses 2.73 3.99 137.1 169.5 197.0 23.6 16.2
Vegetables and Fruits 7.89 0.00 166.7 173.8 214.1 4.3 23.2
Spices 1.85 2.70 145.9 161.2 191.3 10.5 18.7
Meat, Fish and Eggs 5.21 7.61 173.0 182.0 190.2 5.2 4.5
Milk and Milk Products 4.05 5.92 156.2 165.9 181.3 6.2 9.3
Oil and Ghee 3.07 4.49 147.7 149.2 166.2 1.0 11.4
Sugar and Related Products 1.21 1.77 158.9 164.4 135.1 3.5 -17.8
Beverages 2.28 3.33 177.4 186.0 189.7 4.8 2.0
Restaurant Meals 6.91 10.10 201.5 206.4 217.0 2.4 5.1
NON-FOOD AND SERVICES (Adjusted) 46.80 54.47 162.3 168.4 174.9 3.8 3.8
Cloth, Clothing & Sewing Services 8.92 13.04 144.1 146.6 150.3 1.7 2.5
Footwear 2.20 3.22 136.2 140.0 149.5 2.8 6.8
Housing goods and Services
House Furnishing and Household Goods 3.50 5.12 139.7 144.6 152.7 3.5 5.6
House Rent 4.19 6.12 154.9 161.8 168.5 4.5 4.1
Cleaning Supplies 1.26 1.84 143.8 158.9 162.6 10.5 2.3
Fuel, Light and Water 5.92 0.00 246.1 300.8 304.3 22.2 1.2
Transport 3.61 0.00 226.4 269.5 268.0 19.0 -0.6
Communication 0.42 0.61 126.6 126.6 126.6 0.0 0.0
Medical and Personal Care 8.03 11.74 175.0 179.4 186.5 2.5 4.0
Education, Reading and Recreation 7.09 10.36 199.8 211.0 219.4 5.6 4.0
Tobacco and Related Products 1.66 2.43 162.1 172.7 178.2 6.5 3.2
P: Provisional **Based on the exclusion principle by excluding rice and rice products, vegetables and fruits, fuel, light and water and transports. Total weight excluded 31.58 Total weight included 68.42

xvi
Table - 1b
National Urban Consumer Price Index (1995/96 = 100)
YEARLY INDEX
FOOD & BEVERAGES NON-FOOD & SERVICES OVERALL INDEX
YEARS Index % Change Index % Change Index % Change
1972/73 (2029/30) 10.9 - 11.7 - 11.2 -
1973/74 (2030/31) 13.3 22.0 12.9 10.3 13.3 18.8
1974/75 (2031/32) 15.4 15.8 15.3 18.6 15.5 16.5
1975/76 (2032/33) 14.8 -3.9 16.4 7.2 15.4 -0.6
1976/77 (2033/34) 14.8 0.0 17.6 7.3 15.8 2.6
1977/78 (2034/35) 17.1 15.5 18.3 4.0 17.6 11.4
1978/79 (2035/36) 17.3 1.2 19.7 7.7 18.2 3.4
1979/80 (2036/37) 19.2 11.0 21.2 7.6 19.9 9.3
1980/81 (2037/38) 21.8 13.5 24.1 13.7 22.6 13.6
1981/82 (2038/39) 24.2 11.0 26.3 9.1 25.0 10.6
1982/83 (2039/40) 28.1 16.1 29.1 10.6 28.5 14.0
1983/84 (2040/41) 29.6 5.3 31.6 8.6 30.3 6.3
1984/85 (2041/42) 29.9 1.0 34.7 9.8 31.5 4.0
1985/86 (2042/43) 35.5 18.7 38.4 10.7 36.5 15.9
1986/87 (2043/44) 40.9 15.2 42.1 9.6 41.4 13.4
1987/88 (2044/45) 45.8 12.0 45.9 9.0 45.9 10.9
1988/89 (2045/46) 48.5 5.9 51.8 12.9 49.7 8.3
1989/90 (2046/47) 53.8 10.9 55.9 7.9 54.5 9.7
1990/91 (2047/48) 59.2 10.0 61.1 9.3 59.8 9.7
1991/92 (2048/49) 73.7 24.5 70.2 14.9 72.4 21.1
1992/93 (2049/50) 78.4 6.4 79.7 13.5 78.8 8.8
1993/94 (2050/51) 85.5 9.1 86.8 8.9 85.9 9.0
1994/95 (2051/52) 91.8 7.4 93.7 7.9 92.5 7.7
1995/96 (2052/53) 100.0 8.9 100.0 6.7 100.0 8.1
1996/97 (2053/54) 108.2 8.2 108.0 8.0 108.1 8.1
1997/98 (2054/55) 116.6 7.8 117.8 9.1 117.1 8.3
1998/99 (2055/56) 135.5 16.2 124.6 5.8 130.4 11.4
1999/00 (2056/57) 136.1 0.4 133.4 7.1 134.9 3.5
2000/01 (2057/58) 133.0 -2.3 144.2 8.1 138.1 2.4
2001/02 (2058/59) 137.9 3.7 147.2 2.1 142.1 2.9
2002/03 (2059/60) 144.0 4.4 154.6 5.0 148.9 4.8
2003/04 (2060/61) 148.8 3.3 161.8 4.7 154.8 4.0
2004/05 (2061/62) 154.7 4.0 170.1 5.1 161.8 4.5
2005/06 (2062/63) 166.8 7.8 183.9 8.1 174.7 8.0
2006/07 (2063/64) 178.8 7.2 194.1 5.5 185.9 6.4

xvii
Table-1b.1
NATIONAL URBAN CONSUMER PRICE INDEX (1995/96 = 100)
YEARLY INDEX
Terai Kathmandu Hill National Years
Index % Change Index % Change Index % Change Index % Change
1972/73(2029/30) 11.9 - 10.1 - 12.3 - 11.2 -
1973/74(2030/31) 14.5 21.8 11.6 14.9 14.1 14.6 13.3 18.8
1974/75(2031/32) 17.0 17.2 13.5 16.4 16.1 14.2 15.5 16.5
1975/76(2032/33) 16.0 -5.9 14.2 5.2 16.6 3.1 15.4 -0.6
1976/77(2033/34) 16.7 4.4 14.3 0.7 17.2 3.6 15.8 2.6
1977/78(2034/35) 18.6 11.4 15.7 9.8 19.0 10.5 17.6 11.4
1978/79(2035/36) 19.3 3.8 16.3 3.8 19.7 3.7 18.2 3.4
1979/80(2036/37) 20.8 7.8 18.2 11.7 21.6 9.6 19.9 9.3
1980/81(2037/38) 23.5 13.0 20.9 14.8 24.4 13.0 22.6 13.6
1981/82(2038/39) 26.1 11.1 23.1 10.5 26.9 10.2 25.0 10.6
1982/83(2039/40) 30.0 14.9 26.0 12.6 30.9 14.9 28.5 14.0
1983/84(2040/41) 31.9 6.3 27.4 5.4 32.9 6.5 30.3 6.3
1984/85(2041/42) 32.9 3.1 28.4 3.6 35.9 9.1 31.5 4.0
1985/86(2042/43) 38.1 15.8 33.3 17.3 40.1 11.7 36.5 15.9
1986/87(2043/44) 42.8 12.3 37.9 13.8 45.6 13.7 41.4 13.4
1987/88(2044/45) 48.1 12.4 41.5 9.5 51.0 11.8 45.9 10.9
1988/89(2045/46) 51.7 7.5 45.0 8.4 56.3 10.4 49.7 8.3
1989/90(2046/47) 55.9 8.1 52.1 15.8 56.5 0.4 54.5 9.7
1990/91(2047/48) 61.3 9.7 57.3 10.0 61.9 9.6 59.8 9.7
1991/92(2048/49) 74.5 21.5 69.2 20.8 74.2 19.9 72.4 21.1
1992/93(2049/50) 80.9 8.6 77.5 12.0 79.6 7.3 78.8 8.8
1993/94(2050/51) 85.1 5.2 87.4 12.8 84.7 6.4 85.9 9.0
1994/95(2051/52) 91.3 7.3 94.4 8.0 91.3 7.8 92.5 7.7
1995/96(2052/53) 100.0 9.5 100.0 5.9 100.0 9.5 100.0 8.1
1996/97(2053/54) 108.2 8.2 107.7 7.7 108.6 8.6 108.1 8.1
1997/98(2054/55) 117.9 9.0 115.7 7.4 117.3 8.0 117.1 8.3
1998/99(2055/56) 133.6 13.3 125.1 8.1 130.8 11.5 130.4 11.4
1999/00(2056/57) 137.7 3.1 129.7 3.7 135.6 3.7 134.9 3.5
2000/01(2057/58) 139.2 1.1 133.8 3.2 142.6 5.2 138.1 2.4
2001/02(2058/59) 144.0 3.4 136.5 2.0 146.2 2.5 142.1 2.9
2002/03(2059/60) 152.2 5.7 141.7 3.8 151.8 3.8 148.9 4.8
2003/04(2060/61) 156.9 3.1 150.1 5.9 156.6 3.2 154.8 4.0
2004/05(2061/62) 163.8 4.4 157.6 5.0 163.5 4.4 161.8 4.5
2005/06(2062/63) 177.9 8.6 167.8 6.5 177.5 8.6 174.7 8.0
2006/07(2063/64) 189.9 6.7 178.0 6.1 188.2 6.0 185.9 6.4

xviii
Table 1b.2a :National Urban Consumer Price Index BASE YEAR = 1995/96
Fiscal Year/ Overall Food & Non-Food & Fiscal Year/ Overall Food & Non-Food & Fiscal Year/ Overall Food & Non-Food &
Quarter/Month Index Beverages Services Quarter/Month Index Beverages Services Quarter/Month Index Beverages Services
1972/73 (2029/30) 11.2 10.9 11.7 - - - - - - - -
1973/74 (2030/31) 13.3 13.3 12.9 1978/79 (2035/36) 18.2 17.3 19.7 1983/84 (2040/41) 30.3 29.6 31.6
I Qtr 12.5 12.4 12.7 I Qtr 18.3 17.6 19.5 I Qtr 30.9 30.6 31.5
Jul/Aug 12.3 12.1 12.7 Jul/Aug 18.3 17.7 19.6 Jul/Aug 30.8 30.4 31.6
Aug/Sep 12.6 12.4 12.6 Aug/Sep 18.3 17.7 19.5 Aug/Sep 30.9 30.6 31.5
Sep/Oct 12.6 12.5 12.7 Sep/Oct 18.3 17.6 19.6 Sep/Oct 30.9 30.7 31.5
II Qtr 13.0 13.0 12.8 II Qtr 18.2 17.3 19.6 II Qtr 30.4 29.6 31.6
Oct/Nov 12.9 12.8 12.8 Oct/Nov 18.4 17.7 19.6 Oct/Nov 30.7 30.2 31.4
Nov/Dec 13.0 12.9 12.8 Nov/Dec 18.2 17.4 19.6 Nov/Dec 30.4 29.6 31.6
Dec/Jan 13.2 13.2 12.8 Dec/Jan 17.9 16.9 19.7 Dec/Jan 30.2 29.1 31.8
III Qtr 13.7 13.8 12.9 III Qtr 18.1 17.0 19.8 III Qtr 30.1 29.1 31.6
Jan/Feb 13.4 13.6 12.7 Jan/Feb 18.0 17.0 19.7 Jan/Feb 30.3 29.5 31.3
Feb/Mar 13.7 13.8 13.0 Feb/Mar 18.1 17.0 19.9 Feb/Mar 30.0 28.9 31.6
Mar/Apr 13.9 14.2 13.0 Mar/Apr 18.1 17.1 19.9 Mar/Apr 29.9 29.0 31.7
IV Qtr 13.9 14.2 13.1 IV Qtr 18.2 17.3 19.9 IV Qtr 29.8 28.8 31.6
Apr/May 13.9 14.1 13.1 Apr/May 18.1 17.1 20.0 Apr/May 29.8 28.8 31.6
May/Jun 14.0 14.3 13.1 May/Jun 18.3 17.4 19.9 May/Jun 29.6 28.7 31.4
Jun/Jul 13.9 14.1 13.1 Jun/Jul 18.2 17.4 19.8 Jun/Jul 29.9 29.0 31.8
1974/75 (2031/32) 15.5 15.4 15.3 1979/80 (2036/37) 19.9 19.2 21.2 1984/85 (2041/42) 31.5 29.9 34.7
I Qtr 15.5 15.5 15.2 I Qtr 19.1 18.2 20.9 I Qtr 31.3 30.0 34.0
Jul/Aug 15.2 15.1 15.2 Jul/Aug 19.1 18.1 21.0 Jul/Aug 31.2 29.9 34.0
Aug/Sep 15.5 15.6 15.2 Aug/Sep 19.1 18.2 20.9 Aug/Sep 31.3 30.1 33.9
Sep/Oct 15.7 15.8 15.3 Sep/Oct 19.1 18.2 21.0 Sep/Oct 31.3 30.0 34.0
II Qtr 15.5 15.3 15.3 II Qtr 19.5 18.7 21.0 II Qtr 31.2 29.3 34.8
Oct/Nov 15.5 15.5 15.2 Oct/Nov 19.1 18.1 20.9 Oct/Nov 31.3 29.7 34.3
Nov/Dec 15.5 15.4 15.3 Nov/Dec 19.5 18.6 21.0 Nov/Dec 31.3 29.4 34.9
Dec/Jan 15.4 15.1 15.4 Dec/Jan 20.0 19.3 21.1 Dec/Jan 31.0 28.8 35.2
III Qtr 15.5 15.3 15.4 III Qtr 20.3 19.6 21.4 III Qtr 31.5 29.6 35.0
Jan/Feb 15.5 15.4 15.3 Jan/Feb 20.1 19.4 21.2 Jan/Feb 31.4 29.5 34.7
Feb/Mar 15.4 15.2 15.5 Feb/Mar 20.3 19.5 21.5 Feb/Mar 31.3 29.2 35.1
Mar/Apr 15.5 15.4 15.4 Mar/Apr 20.5 19.9 21.5 Mar/Apr 31.8 30.0 35.2
IV Qtr 15.5 15.5 15.3 IV Qtr 20.9 20.5 21.6 IV Qtr 32.2 30.8 35.0
Apr/May 15.5 15.5 15.4 Apr/May 20.8 20.2 21.6 Apr/May 32.2 30.6 35.3
May/Jun 15.7 15.8 15.3 May/Jun 21.0 20.7 21.5 May/Jun 32.5 31.3 35.0
Jun/Jul 15.4 15.4 15.3 Jun/Jul 20.8 20.5 21.5 Jun/Jul 32.0 30.6 34.9
1975/76 (2032/33) 15.4 14.8 16.4 1980/81 (2037/38) 22.6 21.8 24.1 1985/86 (2042/43) 36.5 35.5 38.4
I Qtr 16.0 15.8 16.4 I Qtr 22.3 21.5 23.7 I Qtr 34.3 32.8 37.4
Jul/Aug 15.9 15.6 16.5 Jul/Aug 22.0 21.1 23.8 Jul/Aug 33.9 32.1 37.4
Aug/Sep 16.1 15.9 16.4 Aug/Sep 22.4 21.7 23.8 Aug/Sep 34.3 33.0 37.3
Sep/Oct 16.0 15.8 16.4 Sep/Oct 22.4 21.8 23.6 Sep/Oct 34.6 33.4 37.4
II Qtr 15.6 15.1 16.5 II Qtr 22.3 21.4 23.9 II Qtr 35.6 34.3 37.8
Oct/Nov 15.8 15.5 16.4 Oct/Nov 22.2 21.4 23.7 Oct/Nov 34.8 33.5 37.3
Nov/Dec 15.7 15.2 16.5 Nov/Dec 22.4 21.5 24.0 Nov/Dec 35.6 34.4 37.6
Dec/Jan 15.4 14.6 16.6 Dec/Jan 22.3 21.2 24.1 Dec/Jan 36.4 35.0 38.4
III Qtr 15.0 14.2 16.3 III Qtr 22.9 22.0 24.2 III Qtr 37.5 36.5 39.2
Jan/Feb 15.1 14.4 16.2 Jan/Feb 22.7 21.9 23.8 Jan/Feb 37.2 36.1 38.8
Feb/Mar 15.1 14.3 16.4 Feb/Mar 22.9 21.9 24.4 Feb/Mar 37.4 36.2 39.4
Mar/Apr 14.9 14.1 16.4 Mar/Apr 23.0 22.2 24.4 Mar/Apr 38.0 37.3 39.4
IV Qtr 14.9 14.1 16.4 IV Qtr 23.0 22.3 24.4 IV Qtr 38.8 38.4 39.3
Apr/May 15.0 14.1 16.5 Apr/May 23.0 22.1 24.5 Apr/May 38.5 37.7 39.6
May/Jun 15.0 14.2 16.4 May/Jun 23.0 22.4 24.3 May/Jun 39.0 38.8 39.3
Jun/Jul 14.7 13.9 16.4 Jun/Jul 23.1 22.5 24.3 Jun/Jul 38.9 38.8 39.1
1976/77 (2033/34) 15.8 14.8 17.6 1981/82 (2038/39) 25.0 24.2 26.3 1986/87 (2043/44) 41.4 40.9 42.1
I Qtr 15.5 14.3 17.8 I Qtr 24.6 23.9 26.1 I Qtr 41.2 40.8 42.1
Jul/Aug 15.4 14.3 17.9 Jul/Aug 24.4 23.5 26.2 Jul/Aug 40.9 40.2 42.3
Aug/Sep 15.5 14.5 17.8 Aug/Sep 24.7 24.1 26.0 Aug/Sep 41.4 41.1 42.0
Sep/Oct 15.4 14.3 17.8 Sep/Oct 24.7 24.1 26.1 Sep/Oct 41.5 41.1 42.1
II Qtr 15.3 14.1 17.7 II Qtr 24.7 23.8 26.4 II Qtr 40.7 39.7 42.2
Oct/Nov 15.3 14.1 17.7 Oct/Nov 24.7 23.8 26.2 Oct/Nov 40.8 40.0 42.1
Nov/Dec 15.3 14.1 17.7 Nov/Dec 24.8 23.9 26.4 Nov/Dec 40.5 39.5 42.2
Dec/Jan 15.4 14.1 17.7 Dec/Jan 24.8 23.6 26.5 Dec/Jan 40.9 39.7 42.3
III Qtr 16.0 15.2 17.5 III Qtr 24.9 24.1 26.4 III Qtr 41.3 40.7 42.0
Jan/Feb 15.6 14.6 17.3 Jan/Feb 24.8 24.0 26.2 Jan/Feb 41.3 40.7 41.7
Feb/Mar 16.0 15.1 17.5 Feb/Mar 24.9 23.9 26.5 Feb/Mar 41.3 40.5 42.3
Mar/Apr 16.4 15.8 17.5 Mar/Apr 25.1 24.4 26.4 Mar/Apr 41.5 40.9 42.2
IV Qtr 16.4 15.8 17.4 IV Qtr 25.6 25.1 26.4 IV Qtr 42.3 42.3 42.0
Apr/May 16.4 15.7 17.5 Apr/May 25.2 24.4 26.5 Apr/May 41.8 41.4 42.2
May/Jun 16.5 15.9 17.4 May/Jun 25.8 25.5 26.3 May/Jun 42.6 42.9 41.9
Jun/Jul 16.3 15.8 17.3 Jun/Jul 25.7 25.4 26.4 Jun/Jul 42.4 42.7 41.9
1977/78 (2034/35) 17.6 17.1 18.3 1982/83 (2039/40) 28.5 28.1 29.1 1987/88 (2044/45) 45.9 45.8 45.9
I Qtr 17.4 16.9 18.4 I Qtr 28.2 27.8 29.0 I Qtr 46.1 46.4 45.4
Jul/Aug 17.1 16.5 18.4 Jul/Aug 27.4 26.6 29.1 Jul/Aug 45.2 45.0 45.5
Aug/Sep 17.5 17.0 18.5 Aug/Sep 28.5 28.4 28.9 Aug/Sep 46.8 47.5 45.3
Sep/Oct 17.6 17.1 18.5 Sep/Oct 28.6 28.3 28.9 Sep/Oct 46.3 46.6 45.4
II Qtr 17.6 17.0 18.4 II Qtr 27.8 27.0 29.1 II Qtr 45.4 45.0 45.8
Oct/Nov 17.5 17.0 18.4 Oct/Nov 28.0 27.4 28.9 Oct/Nov 45.7 46.0 45.5
Nov/Dec 17.6 17.1 18.4 Nov/Dec 27.8 26.9 29.1 Nov/Dec 45.3 44.8 45.7
Dec/Jan 17.6 17.0 18.4 Dec/Jan 27.8 26.8 29.2 Dec/Jan 45.2 44.3 46.1
III Qtr 17.6 17.1 18.2 III Qtr 28.5 28.1 29.0 III Qtr 45.9 45.5 45.9
Jan/Feb 17.6 17.2 18.1 Jan/Feb 28.3 27.6 28.8 Jan/Feb 45.6 45.3 45.4
Feb/Mar 17.6 17.1 18.3 Feb/Mar 28.4 28.1 29.1 Feb/Mar 45.8 45.2 46.2
Mar/Apr 17.6 17.2 18.2 Mar/Apr 28.8 28.5 29.2 Mar/Apr 46.3 45.9 46.2
IV Qtr 17.6 17.2 18.4 IV Qtr 29.5 29.5 29.4 IV Qtr 46.5 46.4 46.4
Apr/May 17.7 17.2 18.4 Apr/May 29.4 29.2 29.5 Apr/May 46.6 46.4 46.6
May/Jun 17.7 17.2 18.4 May/Jun 29.7 29.7 29.3 May/Jun 46.6 46.6 46.4
Jun/Jul 17.6 17.2 18.3 Jun/Jul 29.4 29.5 29.3 Jun/Jul 46.2 46.2 46.3

xix
National Urban Consumer Price Index (contd..) BASE YEAR = 1995/96
Fiscal Year/ Overall Food and Non-Food and Fiscal Year/ Overall Food and Non-Food and Fiscal Year/ Overall Food and Non-Food and
Quarter/Month Index Beverages Services Quarter/Month Index Beverages Services Quarter/Month Index Beverages Services
1988/89 (2045/46) 49.7 48.5 51.8 1993/94 (2050/51) 85.9 85.5 86.8 1998/99 (2055/56) 130.4 135.5 124.6
I Qtr 48.9 48.1 50.6 Jun/Jul 86.5 87.4 85.2 I Qtr 130.1 136.0 123.2
Jul/Aug 48.2 47.3 50.2 Jul/Aug 85.3 85.7 85.1 Jul/Aug 128.5 133.3 123.0
Aug/Sep 49.1 48.7 50.0 Aug/Sep 87.1 88.5 85.1 Aug/Sep 129.8 135.5 123.1
Sep/Oct 49.4 48.5 51.5 Sep/Oct 87.0 88.1 85.4 Sep/Oct 132.0 139.2 123.5
II Qtr 49.4 48.0 51.9 II Qtr 84.3 83.4 85.6 II Qtr 130.8 136.8 124.0
Oct/Nov 49.4 48.4 51.3 Oct/Nov 84.8 84.5 85.6 Oct/Nov 133.9 142.6 123.8
Nov/Dec 49.5 48.2 51.9 Nov/Dec 84.0 83.1 85.3 Nov/Dec 130.8 136.7 124.0
Dec/Jan 49.2 47.3 52.3 Dec/Jan 84.2 82.7 86.0 Dec/Jan 127.8 131.0 124.2
III Qtr 49.6 48.0 52.2 III Qtr 85.0 83.3 87.7 III Qtr 128.2 130.7 125.3
Jan/Feb 49.3 47.8 51.7 Jan/Feb 83.6 81.8 86.4 Jan/Feb 126.9 128.7 124.8
Feb/Mar 49.4 47.5 52.6 Feb/Mar 85.0 82.8 88.5 Feb/Mar 128.4 131.0 125.4
Mar/Apr 50.0 48.7 52.2 Mar/Apr 86.3 85.3 88.3 Mar/Apr 129.3 132.4 125.7
IV Qtr 50.8 50.0 52.5 IV Qtr 87.8 88.0 88.4 IV Qtr 132.6 138.4 125.9
Apr/May 50.5 49.4 52.6 Apr/May 87.8 87.5 88.7 Apr/May 131.2 136.0 125.7
May/Jun 51.0 50.2 52.5 May/Jun 87.7 87.9 88.1 May/Jun 132.3 138.1 125.7
Jun/Jul 51.0 50.3 52.3 Jun/Jul 88.0 88.5 88.3 Jun/Jul 134.2 141.2 126.2
1989/90 (2046/47) 54.5 53.8 55.9 1994/95 (2051/52) 92.5 91.8 93.7 1999/00 (2056/57) 134.9 136.1 133.4
I Qtr 53.9 54.1 53.6 I Qtr 92.0 92.0 92.2 I Qtr 137.0 143.8 129.0
Jul/Aug 53.3 53.5 53.1 Jul/Aug 90.8 90.2 92.1 Jul/Aug 136.2 142.6 128.7
Aug/Sep 53.7 54.0 53.5 Aug/Sep 92.2 92.4 92.0 Aug/Sep 137.1 144.1 129.0
Sep/Oct 54.5 54.9 54.1 Sep/Oct 93.0 93.5 92.4 Sep/Oct 137.6 144.8 129.3
II Qtr 54.2 53.0 56.1 II Qtr 91.7 90.5 93.3 II Qtr 135.2 136.8 133.4
Oct/Nov 54.6 54.2 55.6 Oct/Nov 92.4 92.1 93.0 Oct/Nov 137.5 142.1 132.2
Nov/Dec 54.1 52.8 56.2 Nov/Dec 91.6 90.5 93.3 Nov/Dec 135.0 136.1 133.7
Dec/Jan 53.9 52.1 56.6 Dec/Jan 91.1 89.1 93.7 Dec/Jan 133.2 132.2 134.3
III Qtr 54.3 52.8 56.9 III Qtr 91.8 89.9 94.6 III Qtr 133.1 131.1 135.4
Jan/Feb 53.6 52.0 56.2 Jan/Feb 91.2 89.4 93.8 Jan/Feb 132.7 130.3 135.4
Feb/Mar 54.1 52.3 57.2 Feb/Mar 91.4 88.9 95.1 Feb/Mar 133.0 131.0 135.3
Mar/Apr 55.0 53.9 57.1 Mar/Apr 92.7 91.6 94.9 Mar/Apr 133.7 132.1 135.6
IV Qtr 55.6 55.1 57.2 IV Qtr 94.5 94.7 94.9 IV Qtr 134.1 132.6 135.9
Apr/May 55.9 55.2 57.5 Apr/May 93.6 92.8 95.2 Apr/May 133.7 131.8 135.9
May/Jun 55.5 54.9 57.1 May/Jun 94.2 94.4 94.6 May/Jun 133.5 131.5 135.9
Jun/Jul 55.5 55.0 57.1 Jun/Jul 95.6 96.8 94.8 Jun/Jul 135.0 134.4 135.8
1990/91 (2047/48) 59.8 59.2 61.1 1995/96 (2052/53) 100.0 100.0 100.0 2000/01 (2057/58) 138.1 133.0 144.2
I Qtr 57.9 57.4 59.3 I Qtr 98.9 99.2 98.6 I Qtr 139.2 137.3 141.5
Jul/Aug 57.4 56.6 59.0 Jul/Aug 98.9 99.2 98.5 Jul/Aug 137.5 136.0 139.3
Aug/Sep 57.9 57.7 58.7 Aug/Sep 98.7 98.9 98.5 Aug/Sep 138.5 137.8 139.4
Sep/Oct 58.4 57.8 60.1 Sep/Oct 99.1 99.4 98.7 Sep/Oct 141.6 138.2 145.7
II Qtr 58.3 56.9 60.7 II Qtr 98.2 97.1 99.4 II Qtr 139.1 133.6 145.6
Oct/Nov 58.4 57.4 60.6 Oct/Nov 98.8 98.6 99.0 Oct/Nov 141.3 136.8 146.6
Nov/Dec 58.1 56.8 60.5 Nov/Dec 97.9 96.8 99.2 Nov/Dec 139.3 134.4 145.0
Dec/Jan 58.3 56.6 61.0 Dec/Jan 97.8 96.0 99.9 Dec/Jan 136.7 129.5 145.3
III Qtr 60.5 59.8 61.4 III Qtr 99.8 99.2 100.5 III Qtr 135.6 127.9 144.6
Jan/Feb 60.1 59.3 60.8 Jan/Feb 99.0 97.9 100.2 Jan/Feb 135.1 127.0 144.6
Feb/Mar 60.3 59.3 61.9 Feb/Mar 99.4 98.5 100.4 Feb/Mar 134.9 126.6 144.6
Mar/Apr 61.1 60.8 61.5 Mar/Apr 101.1 101.3 100.8 Mar/Apr 136.8 130.1 144.6
IV Qtr 62.6 62.8 62.8 IV Qtr 103.1 104.4 101.6 IV Qtr 138.6 133.2 145.0
Apr/May 61.7 61.3 62.6 Apr/May 102.1 102.8 101.2 Apr/May 137.7 131.6 144.8
May/Jun 62.3 62.6 62.3 May/Jun 102.9 104.1 101.6 May/Jun 138.6 133.2 145.0
Jun/Jul 63.9 64.5 63.4 Jun/Jul 104.4 106.4 102.0 Jun/Jul 139.6 134.9 145.2
1991/92 (2048/49) 72.4 73.7 70.2 1996/97 (2053/54) 108.1 108.2 108.0 2001/02 (2058/59) 142.1 137.9 147.2
I Qtr 69.8 71.4 66.9 I Qtr 108.4 110.7 105.7 I Qtr 143.2 141.4 145.4
Jul/Aug 67.5 68.0 66.6 Jul/Aug 107.7 109.8 105.2 Jul/Aug 141.5 138.3 145.3
Aug/Sep 70.3 72.1 67.0 Aug/Sep 108.4 110.6 105.7 Aug/Sep 143.7 142.5 145.3
Sep/Oct 71.6 74.2 67.1 Sep/Oct 109.2 111.6 106.3 Sep/Oct 144.4 143.5 145.6
II Qtr 71.1 71.8 69.2 II Qtr 107.9 108.6 107.0 II Qtr 142.9 139.5 146.9
Oct/Nov 70.7 72.2 67.8 Oct/Nov 109.1 111.4 106.5 Oct/Nov 144.8 143.2 146.8
Nov/Dec 70.7 71.1 69.6 Nov/Dec 107.8 108.5 106.9 Nov/Dec 143.1 139.9 146.9
Dec/Jan 71.9 72.2 70.4 Dec/Jan 106.7 105.8 107.7 Dec/Jan 140.7 135.5 147.0
III Qtr 72.9 73.4 71.7 III Qtr 107.1 105.4 109.1 III Qtr 139.6 132.5 148.0
Jan/Feb 72.5 73.1 70.7 Jan/Feb 106.8 104.9 109.0 Jan/Feb 139.4 132.3 147.8
Feb/Mar 72.5 72.4 72.2 Feb/Mar 106.9 105.1 109.1 Feb/Mar 139.4 131.9 148.1
Mar/Apr 73.8 74.6 72.2 Mar/Apr 107.6 106.3 109.2 Mar/Apr 140.1 133.2 148.1
IV Qtr 75.9 77.9 72.9 IV Qtr 109.0 108.0 110.2 IV Qtr 142.8 138.0 148.6
Apr/May 75.5 77.2 72.9 Apr/May 108.2 107.0 109.6 Apr/May 141.2 135.0 148.5
May/Jun 76.0 78.2 72.6 May/Jun 108.9 107.7 110.3 May/Jun 142.8 137.9 148.5
Jun/Jul 76.2 78.3 73.3 Jun/Jul 109.9 109.4 110.6 Jun/Jul 144.5 141.0 148.7
1992/93 (2049/50) 78.8 78.4 79.7 1997/98 (2054/55) 117.1 116.6 117.8 2002/03 (2059/60) 148.9 144.0 154.6
I Qtr 79.5 80.8 77.3 I Qtr 115.7 115.4 116.1 I Qtr 148.2 145.7 151.2
Jul/Aug 79.0 80.0 77.1 Jul/Aug 115.1 114.5 115.9 Jul/Aug 147.5 144.5 151.1
Aug/Sep 79.9 81.4 77.2 Aug/Sep 115.0 114.2 116.0 Aug/Sep 148.4 146.1 151.2
Sep/Oct 79.7 81.0 77.5 Sep/Oct 116.9 117.4 116.5 Sep/Oct 148.7 146.6 151.2
II Qtr 77.4 76.5 78.4 II Qtr 115.2 113.4 117.2 II Qtr 146.8 142.1 152.3
Oct/Nov 78.2 78.4 77.9 Oct/Nov 115.8 114.9 116.9 Oct/Nov 148.0 144.8 151.8
Nov/Dec 77.0 76.2 78.2 Nov/Dec 114.4 112.0 117.1 Nov/Dec 147.0 142.3 152.4
Dec/Jan 76.8 75.0 79.1 Dec/Jan 115.3 113.4 117.5 Dec/Jan 145.3 139.1 152.6
III Qtr 78.3 76.6 81.0 III Qtr 116.6 115.4 118.2 III Qtr 148.0 141.3 155.8
Jan/Feb 77.3 75.7 79.3 Jan/Feb 116.2 114.8 117.8 Jan/Feb 145.8 139.2 153.4
Feb/Mar 78.4 76.2 81.8 Feb/Mar 116.4 115.0 118.2 Feb/Mar 146.7 140.9 153.5
Mar/Apr 79.3 77.9 81.9 Mar/Apr 117.3 116.4 118.5 Mar/Apr 151.5 143.7 160.5
IV Qtr 80.2 79.6 81.9 IV Qtr 120.9 122.1 119.5 IV Qtr 152.5 147.0 159.0
Apr/May 79.9 78.8 82.1 Apr/May 118.9 118.6 119.2 Apr/May 152.1 146.2 158.9
May/Jun 80.0 79.5 81.5 May/Jun 120.8 121.8 119.6 May/Jun 152.2 146.4 159.1
Jun/Jul 80.7 80.5 82.1 Jun/Jul 123.1 126.0 119.8 Jun/Jul 153.3 148.4 158.9

xx
National Urban Consumer Price Index (contd…)
BASE YEAR = 1995/96
Fiscal Year/ Overall Food & Non-Food & Fiscal Year/ Overall Food & Non-Food & Fiscal Year/ Overall Food & Non-Food &
Quarter/Month Index Beverages Services Quarter/Month Index Beverages Services Quarter/Month Index Beverages Services
2003/04
(2060/61) 154.8 148.8 161.8
2005/06
(2062/63) 174.7 166.8 183.9
2007/08
(2064/65)
I Qtr 156.2 152.0 161.0 Jun/Jul 172.6 167.3 178.8 I Qtr 197.1 196.2 198.1
Jul/Aug 155.4 150.6 160.9 Jul/Aug 170.7 165.0 177.2 Jul/Aug 194.7 191.9 197.9
Aug/Sep 156.1 151.8 161.1 Aug/Sep 173.3 168.0 179.5 Aug/Sep 197.8 197.4 198.1
Sep/Oct 157.1 153.7 161.1 Sep/Oct 173.8 168.8 179.7 Sep/Oct 198.7 199.2 198.2
II Qtr 154.4 148.4 161.5 II Qtr 172.7 166.0 180.6
Oct/Nov 156.6 152.5 161.3 Oct/Nov 174.5 169.3 180.5
Nov/Dec 154.2 147.9 161.5 Nov/Dec 173.0 166.6 180.5
Dec/Jan 152.5 144.8 161.6 Dec/Jan 170.6 162.0 180.7
III Qtr 153.3 145.7 162.2 III Qtr 173.7 162.6 186.6
Jan/Feb 152.7 144.7 162.1 Jan/Feb 170.8 161.3 181.8
Feb/Mar 153.1 145.3 162.2 Feb/Mar 174.3 161.7 188.9
Mar/Apr 154.1 147.2 162.3 Mar/Apr 176.0 164.9 189.0
IV Qtr 155.2 149.0 162.5 IV Qtr 179.7 171.2 189.6
Apr/May 154.1 147.1 162.4 Apr/May 179.0 169.8 189.7
May/Jun 155.0 148.7 162.5 May/Jun 179.6 170.9 189.5
Jun/Jul 156.4 151.2 162.5 Jun/Jul 180.6 172.9 189.6
2004/05
(2061/62) 161.8 154.7 170.1
2006/07
(2063/64) 185.9 178.8 194.1
I Qtr 160.2 156.2 164.8 I Qtr 184.9 178.3 192.6
Jul/Aug 159.1 154.8 164.1 Jul/Aug 183.1 175.0 192.5
Aug/Sep 160.2 156.8 164.2 Aug/Sep 184.8 178.0 192.7
Sep/Oct 161.2 157.0 166.0 Sep/Oct 186.9 181.9 192.7
II Qtr 159.8 152.7 168.1 II Qtr 185.4 178.3 193.5
Oct/Nov 160.8 155.9 166.7 Oct/Nov 186.9 181.2 193.4
Nov/Dec 159.0 152.4 166.7 Nov/Dec 185.6 178.7 193.6
Dec/Jan 159.5 149.7 170.8 Dec/Jan 183.6 175.0 193.6
III Qtr 162.1 152.4 173.6 III Qtr 185.2 176.6 195.0
Jan/Feb 161.4 150.6 174.1 Jan/Feb 184.5 175.5 195.0
Feb/Mar 161.9 152.2 173.2 Feb/Mar 185.1 176.5 195.0
Mar/Apr 163.1 154.3 173.4 Mar/Apr 185.9 177.9 195.0
IV Qtr 165.1 157.5 174.0 IV Qtr 188.2 181.9 195.4
Apr/May 164.0 155.7 173.8 Apr/May 187.3 180.2 195.4
May/Jun 164.6 156.6 173.9 May/Jun 187.6 180.8 195.4
Jun/Jul 166.8 160.3 174.4 Jun/Jul 189.8 184.8 195.4

xxi
Table - 1b.3
URBAN CONSUMER PRICE INDEX : KATHMANDU VALLEY (1995/96 = 100)
YEARLY INDEX
Food and Beverage Non-Food and Services Overall Index Years
Index % Change Index % Change Index % Change
1972/73 (2029/30) 9.5 - 11.1 - 10.1 -
1973/74 (2030/31) 11.1 16.8 12.1 9.0 11.6 14.9
1974/75 (2031/32) 12.9 16.2 14.6 20.7 13.5 16.4
1975/76 (2032/33) 13.4 3.9 15.8 8.2 14.2 5.2
1976/77 (2033/34) 12.9 -3.7 16.6 5.1 14.3 0.7
1977/78 (2034/35) 14.8 14.7 17.3 4.2 15.7 9.8
1978/79 (2035/36) 15.1 2.0 18.1 4.6 16.3 3.8
1979/80 (2036/37) 17.3 14.6 19.1 5.5 18.2 11.7
1980/81 (2037/38) 19.9 15.0 22.6 18.3 20.9 14.8
1981/82 (2038/39) 22.0 10.6 25.0 10.6 23.1 10.5
1982/83 (2039/40) 25.2 14.5 27.1 8.4 26.0 12.6
1983/84 (2040/41) 26.4 4.8 28.9 6.6 27.4 5.4
1984/85 (2041/42) 26.6 0.8 31.5 9.0 28.4 3.6
1985/86 (2042/43) 32.0 20.3 35.2 11.7 33.3 17.3
1986/87 (2043/44) 37.3 16.6 38.9 10.5 37.9 13.8
1987/88 (2044/45) 41.2 10.5 41.8 7.5 41.5 9.5
1988/89 (2045/46) 44.0 6.8 46.6 11.5 45.0 8.4
1989/90 (2046/47) 52.6 19.5 51.2 9.9 52.1 15.8
1990/91 (2047/48) 57.8 9.9 56.4 10.2 57.3 10.0
1991/92 (2048/49) 70.8 22.5 66.7 18.3 69.2 20.8
1992/93 (2049/50) 77.6 9.6 77.3 15.9 77.5 12.0
1993/94 (2050/51) 88.3 13.8 86.0 11.3 87.4 12.8
1994/95 (2051/52) 94.2 6.7 94.7 10.1 94.4 8.0
1995/96 (2052/53) 100.0 6.2 100.0 5.6 100.0 5.9
1996/97 (2053/54) 107.1 7.1 108.4 8.4 107.7 7.7
1997/98 (2054/55) 115.2 7.6 116.1 7.1 115.7 7.4
1998/99 (2055/56) 128.7 11.7 121.3 4.5 125.1 8.1
1999/00 (2056/57) 130.9 1.7 128.4 5.9 129.7 3.7
2000/01(2057/58) 130.5 -0.3 137.2 6.9 133.8 3.2
2001/02 (2058/59) 133.8 2.5 139.4 1.6 136.5 2.0
2002/03 (2059/60) 137.5 2.8 146.3 4.9 141.7 3.8
2003/04 (2060/61) 145.6 5.9 155.0 6.0 150.1 5.9
2004/05 (2061/62) 151.8 4.3 163.8 5.7 157.6 5.0
2005/06 (2062/63) 159.5 5.1 176.7 7.9 167.8 6.5
2006/07 (2063/64) 169.4 6.2 187.2 5.9 178.0 6.1

xxii
Table - 1b.4
URBAN CONSUMER PRICE INDEX : TERAI (1995/96 = 100)
YEARLY INDEX
Food and Beverage Non-Food and Services Overall Index Years
Index % Change Index % Change Index % Change
1972/73 (2029/30) 11.8 - 12.1 - 11.9 -
1973/74 (2030/31) 15.1 28.0 13.2 9.1 14.5 21.8
1974/75 (2031/32) 17.5 15.9 15.8 19.7 17.0 17.2
1975/76 (2032/33) 15.7 -10.3 16.7 5.7 16.0 -5.9
1976/77 (2033/34) 16.1 2.5 18.1 8.4 16.7 4.4
1977/78 (2034/35) 18.4 14.3 18.7 3.3 18.6 11.4
1978/79 (2035/36) 18.7 1.6 20.4 9.1 19.3 3.8
1979/80 (2036/37) 20.4 9.1 21.7 6.4 20.8 7.8
1980/81 (2037/38) 23.0 12.7 24.5 12.9 23.5 13.0
1981/82 (2038/39) 25.7 11.7 26.7 9.0 26.1 11.1
1982/83 (2039/40) 29.9 16.3 30.0 12.4 30.0 14.9
1983/84 (2040/41) 31.5 5.4 32.7 9.0 31.9 6.3
1984/85 (2041/42) 31.6 0.3 35.8 9.5 32.9 3.1
1985/86 (2042/43) 37.4 18.4 39.4 10.1 38.1 15.8
1986/87 (2043/44) 42.7 14.2 42.8 8.6 42.8 12.3
1987/88 (2044/45) 48.2 12.9 47.3 10.5 48.1 12.4
1988/89 (2045/46) 50.5 4.8 54.0 14.2 51.7 7.5
1989/90 (2046/47) 54.5 7.9 58.6 8.5 55.9 8.1
1990/91 (2047/48) 60.3 10.6 63.3 8.0 61.3 9.7
1991/92 (2048/49) 76.1 26.2 71.4 12.8 74.5 21.5
1992/93 (2049/50) 82.9 8.9 80.5 12.7 80.9 8.6
1993/94 (2050/51) 84.2 1.6 86.7 7.7 85.1 5.2
1994/95 (2051/52) 90.5 7.5 92.9 7.2 91.3 7.3
1995/96 (2052/53) 100.0 10.5 100.0 7.6 100.0 9.5
1996/97 (2053/54) 108.3 8.3 108.0 8.0 108.2 8.2
1997/98 (2054/55) 116.8 7.8 119.3 10.5 117.9 9.0
1998/99 (2055/56) 138.7 18.8 127.3 6.7 133.6 13.3
1999/00 (2056/57) 138.1 -0.4 137.1 7.7 137.7 3.1
2000/01(2057/58) 132.0 -4.4 147.9 7.9 139.2 1.1
2001/02 (2058/59) 138.0 4.5 151.5 2.4 144.0 3.4
2002/03 (2059/60) 146.4 6.1 159.3 5.1 152.2 5.7
2003/04 (2060/61) 149.2 1.9 166.4 4.5 156.9 3.1
2004/05 (2061/62) 155.0 3.9 174.5 4.9 163.8 4.4
2005/06 (2062/63) 169.5 9.4 188.1 7.8 177.9 8.6
2006/07 (2063/64) 182.8 7.8 198.6 5.6 189.9 6.7

xxiii
Table - 1b.5
URBAN CONSUMER PRICE INDEX : HILLS (1995/96 = 100)
YEARLY INDEX
Food and Beverage Non-Food and Services Overall Index Years
Index % Change Index % Change Index % Change
1972/73 (2029/30) 12.1 - 12.7 - 12.3 -
1973/74 (2030/31) 14.1 16.5 13.9 9.4 14.1 14.6
1974/75 (2031/32) 16.1 14.2 15.9 14.4 16.1 14.2
1975/76 (2032/33) 16.0 -0.6 17.6 10.7 16.6 3.1
1976/77 (2033/34) 16.4 2.5 18.8 6.8 17.2 3.6
1977/78 (2034/35) 18.5 12.8 20.1 6.9 19.0 10.5
1978/79 (2035/36) 18.8 1.6 21.5 7.0 19.7 3.7
1979/80 (2036/37) 20.8 10.6 23.1 7.4 21.6 9.6
1980/81 (2037/38) 23.4 12.5 26.3 13.9 24.4 13.0
1981/82 (2038/39) 25.9 10.7 28.8 9.5 26.9 10.2
1982/83 (2039/40) 30.5 17.8 31.1 8.0 30.9 14.9
1983/84 (2040/41) 31.8 4.3 34.9 12.2 32.9 6.5
1984/85 (2041/42) 33.8 6.3 40.4 15.8 35.9 9.1
1985/86 (2042/43) 38.2 13.0 44.1 9.2 40.1 11.7
1986/87 (2043/44) 44.4 16.2 47.8 8.4 45.6 13.7
1987/88 (2044/45) 50.4 13.5 51.5 7.7 51.0 11.8
1988/89 (2045/46) 54.8 8.7 58.8 14.2 56.3 10.4
1989/90 (2046/47) 54.8 0.0 59.6 1.4 56.5 0.4
1990/91 (2047/48) 59.6 8.8 66.5 11.6 61.9 9.6
1991/92 (2048/49) 73.2 22.8 76.1 14.4 74.2 19.9
1992/93 (2049/50) 77.5 5.9 83.8 10.1 79.6 7.3
1993/94 (2050/51) 82.4 6.3 89.1 6.3 84.7 6.4
1994/95 (2051/52) 89.7 8.9 94.4 5.9 91.3 7.8
1995/96 (2052/53) 100.0 11.5 100.0 5.9 100.0 9.5
1996/97 (2053/54) 109.6 9.6 107.4 7.4 108.6 8.6
1997/98 (2054/55) 118.3 7.9 116.1 8.1 117.3 8.0
1998/99 (2055/56) 137.8 16.5 122.9 5.9 130.8 11.5
1999/00 (2056/57) 139.0 0.9 131.8 7.2 135.6 3.7
2000/01(2057/58) 139.8 0.6 145.7 10.5 142.6 5.2
2001/02 (2058/59) 144.1 3.1 148.6 2.0 146.2 2.5
2002/03 (2059/60) 148.5 3.1 155.5 4.6 151.8 3.8
2003/04 (2060/61) 153.0 3.0 160.8 3.4 156.6 3.2
2004/05 (2061/62) 158.8 3.8 168.8 5.0 163.5 4.4
2005/06 (2062/63) 171.5 8.0 184.2 9.1 177.5 8.6
2006/07 (2063/64) 183.4 6.9 193.7 5.2 188.2 6.0

xxiv
Table 1c
National Urban Consumer Price Index
Regional Group Indices & Inflation Series
Year
National
National Change %
Kathmandu Valley
Kathmandu Valley
Change %
Terai
Terai Change %
Hills
Hills Change %
Overall
Food
Non
Food
Overall
Food
Non
Food
Overall
Food
Non
Food
Overall
Food
Non
Food
Overall
Food
Non
Food
Overall
Food
Non
Food
Overall
Food
Non
Food
Overall
Food
Non
Food
2053/54 (1996/97)
108.1
108.2
108.0
8.1
8.2
8
107.7
107.1
108.4
7.7
7.1
8.4
108.2
108.3
108.0
8.2
8.3
8
108.6
109.6
107.4
8.6
9.6
7.4
Jul/Aug
107.7
109.8
105.2
7.9
9.3
6.3
107.4
108.8
106.0
6.8
6.7
7.1
107.6
109.9
104.8
8.0
9.9
5.8
108.2
111.0
105.2
9.4
11.9
6.8
Aug/Sep
108.4
110.6
105.7
8.6
10.2
6.7
108.5
110.0
107.0
8.3
8.6
8.0
108.4
111.1
105.1
8.5
10.7
5.8
108.0
110.4
105.3
9.4
11.6
6.9
Sep/Oct
109.2
111.6
106.3
9.0
10.5
90.1
109.4
110.8
108.0
8.9
9.2
8.8
109.2
112.2
105.6
8.8
10.8
6.3
108.7
111.3
105.7
9.7
12.0
7.1
Oct/Nov
109.1
111.4
106.5
9.0
10.5
7.3
109.2
111.0
107.3
9.3
10.7
7.9
109.4
112.1
106.2
8.5
10.0
6.8
108.3
110.2
106.2
9.6
11.8
7.3
Nov/Dec
107.8
108.5
106.9
9.1
10.4
7.5
107.7
108.0
107.5
9.1
10.3
8.1
107.6
108.5
106.5
8.5
9.5
7.1
108.2
109.5
106.8
10.5
13.1
7.7
Dec/Jan
106.7
105.8
107.7
9.7
10.8
8.4
106.2
104.4
108.1
8.8
8.9
8.8
106.7
105.9
107.8
10.1
11.5
8.7
107.5
107.7
107.2
9.9
12.2
7.3
Jan/Feb
106.8
104.9
109.0
9.3
9.3
9.3
106.4
103.6
109.4
8.8
7.9
9.8
106.5
104.4
109.1
9.6
9.7
9.5
108.2
108.3
108.1
9.3
10.6
7.9
Feb/M
ar
106.9
105.1
109.1
8.6
8.2
9.2
106.4
103.9
109.0
8.1
7.0
9.3
107.2
105.4
109.4
9.4
9.1
9.6
107.3
106.4
108.2
7.9
8.0
7.8
Mar/Apr
107.6
106.3
109.2
7.6
6.8
8.5
106.8
104.6
109.0
7.1
5.5
8.6
108.0
106.6
109.6
8.3
7.7
8.9
108.3
108.2
108.3
7.1
6.8
7.4
Apr/May
108.2
107.0
109.6
6.8
5.4
8.4
107.4
105.6
109.3
6.4
4.9
8.1
108.3
106.8
110.2
6.9
5.1
9.0
109.3
110.0
108.6
7.1
7.0
7.3
May/Jun
108.9
107.7
110.3
6.1
4.0
8.7
108.1
106.3
110.0
5.9
3.2
8.6
109.1
107.6
110.9
6.1
3.7
9.2
109.8
110.2
109.3
6.7
5.9
7.6
Jun/Jul
109.9
109.4
110.6
5.7
3.4
8.5
109.5
108.6
110.3
5.6
3.3
7.9
109.8
108.7
111.1
5.6
2.5
9.4
111.0
112.4
109.4
6.3
5.6
7.3
2054/55 (1997/98)
117.1
116.6
117.8
8.3
7.8
9.1
115.7
115.2
116.1
7.4
7.6
7.1
117.9
116.8
119.3
9.0
7.8
10.5
117.3
118.3
116.1
8.0
7.9
8.1
Jul/Aug
115.1
114.5
115.9
6.9
4.3
10.2
113.7
113.1
114.3
5.9
4.0
7.8
116.1
115.0
117.5
7.9
4.6
12.1
114.8
115.4
114.3
6.1
4.0
8.7
Aug/Sep
115.0
114.2
116.0
6.1
3.3
9.7
113.6
112.7
114.5
4.7
2.5
7.0
116.0
114.9
117.4
7.0
3.4
11.7
114.8
115.1
114.6
6.3
4.3
8.8
Sep/Oct
116.9
117.4
116.5
7.1
5.2
9.6
116.8
118.4
115.0
6.8
6.9
6.5
117.5
117.2
117.9
7.6
4.5
11.6
115.7
116.2
115.1
6.4
4.4
8.9
Oct/Nov
115.8
114.9
116.9
6.1
3.1
9.8
114.6
113.6
115.5
4.9
2.3
7.6
116.8
115.7
118.2
6.8
3.2
11.3
115.0
114.6
115.6
6.2
4.0
8.9
Nov/Dec
114.4
112.0
117.1
6.1
3.2
9.5
113.6
111.6
115.8
5.5
3.3
7.7
114.9
111.9
118.5
6.8
3.1
11.3
114.3
113.1
115.7
5.6
3.3
8.3
Dec/Jan
115.3
113.4
117.5
8.1
7.2
9.1
113.5
111.0
116.2
6.9
6.3
7.5
116.0
113.7
118.8
8.7
7.4
10.2
116.2
116.5
116.0
8.1
8.2
8.2
Jan/Feb
116.2
114.8
117.8
8.8
9.4
8.1
115.1
113.5
116.9
8.2
9.6
6.9
116.6
114.6
119.0
9.5
9.8
9.1
116.8
117.3
116.2
7.9
8.3
7.5
Feb/M
ar
116.4
115.0
118.2
8.9
9.4
8.3
115.2
113.7
116.9
8.3
9.4
7.2
117.0
114.9
119.6
9.1
9.0
9.3
117.0
117.4
116.6
9.0
10.3
7.8
Mar/Apr
117.3
116.4
118.5
9.0
9.5
8.5
116.5
116.1
117.0
9.1
11.0
7.3
117.6
115.6
120.1
8.9
8.4
9.6
118.0
119.0
116.8
9.0
10.0
7.8
Apr/May
118.9
118.6
119.2
9.9
10.8
8.8
116.7
116.4
117.2
8.7
10.2
7.2
120.0
119.0
121.2
10.8
11.4
10.0
119.5
121.4
117.3
9.3
10.4
8.0
May/Jun
120.8
121.8
119.6
10.9
13.1
8.4
118.5
119.7
117.2
9.6
12.6
6.5
121.9
122.0
121.8
11.7
13.4
9.8
121.4
124.8
117.5
10.6
13.2
7.5
Jun/Jul
123.1
126.0
119.8
12.0
15.2
8.3
120.2
122.9
117.3
9.8
13.2
6.3
124.6
126.8
122.0
13.5
16.7
9.8
123.7
128.8
117.8
11.4
14.6
7.7
2055/56 (1998/99)
130.4
135.5
124.6 11.4 16.2
5.8
125.1
128.7
121.3
8.1
11.7
4.5
133.6
138.7
127.3 13.3 18.8
6.7
130.8
137.8
122.9 11.5 16.5
5.9
Jul/Aug
128.5
133.3
123.0
11.6
16.4
6.1
124.8
129.1
120.2
9.8
14.1
5.2
130.8
135.3
125.4
12.7
17.7
6.7
128.4
134.6
121.3
11.8
16.6
6.1
Aug/Sep
129.8
135.5
123.1
12.9
18.7
6.1
125.5
130.4
120.3
10.5
15.7
5.1
132.4
138.1
125.5
14.1
20.2
6.9
129.7
137.0
121.4
13.0
19.0
5.9
Sep/Oct
132.0
139.2
123.5
12.9
18.6
6.0
126.6
132.1
120.8
8.4
11.6
5.0
135.4
143.2
125.9
15.2
22.2
6.8
131.5
140.2
121.6
13.7
20.7
5.6
Oct/Nov
133.9
142.6
123.8
15.6
24.1
5.9
127.5
133.6
121.0
11.3
17.6
4.8
138.0
147.9
126.0
18.2
27.8
6.6
133.4
143.3
122.2
16.0
25.0
5.7
Nov/Dec
130.8
136.7
124.0
14.3
22.1
5.9
125.6
129.7
121.1
10.6
16.2
4.6
134.5
141.2
126.3
17.1
26.2
6.6
129.6
135.9
122.5
13.4
20.2
5.9
Dec/Jan
127.8
131.0
124.2
10.8
15.5
5.7
123.7
125.9
121.3
9.0
13.4
4.4
130.1
133.0
126.5
12.2
17.0
6.5
128.6
133.8
122.7
10.7
14.8
5.8
Jan/Feb
126.9
128.7
124.8
9.2
12.1
5.9
122.6
123.3
121.9
6.5
8.6
4.3
129.5
131.6
127.0
11.1
14.8
6.7
127.0
129.9
123.8
8.7
10.7
6.5
Feb/M
ar
128.4
131.0
125.4
10.3
13.9
6.1
122.8
124.3
121.2
6.6
9.3
3.7
131.5
133.9
128.5
12.4
16.5
7.4
129.4
134.1
124.0
10.6
14.2
6.3
Mar/Apr
129.3
132.4
125.7
10.2
13.7
6.1
123.8
125.6
121.9
6.3
8.2
4.2
132.2
135.1
128.6
12.4
16.9
7.1
130.5
136.2
124.0
10.6
14.5
6.2
Apr/May
131.2
136.0
125.7
10.3
14.7
5.5
125.2
128.3
121.9
7.3
10.2
4.0
134.3
139.0
128.7
11.9
16.8
6.2
132.8
140.5
124.0
11.1
15.7
5.7
May/Jun
132.3
138.1
125.7
9.5
13.4
5.1
126.1
129.9
122.0
6.4
8.5
4.1
135.7
141.1
129.0
11.3
15.7
5.9
133.7
143.2
123.0
10.1
14.7
4.7
Jun/Jul
134.2
141.2
126.2
9.0
12.1
5.3
127.0
131.7
122.0
5.7
7.2
4.0
138.3
145.5
129.6
11.0
14.7
6.2
135.2
145.2
123.8
9.3
12.7
5.1
2056/57 (1999/2000) 134.9
136.1
133.4
3.5
0.4
7.1
129.7
130.9
128.4
3.7
1.7
5.9
137.7
138.1
137.1
3.1
-0.4
7.7
135.6
139.0
131.8
3.7
0.9
7.2
Jul/Aug
136.2
142.6
128.7
6.0
7.0
4.6
129.7
134.7
124.4
3.9
4.3
3.5
139.3
145.7
131.6
6.5
7.7
4.9
138.3
147.2
128.2
7.7
9.4
5.7
Aug/Sep
137.1
144.1
129.0
5.6
6.3
4.8
130.7
136.5
124.6
4.1
4.7
3.6
140.4
147.4
131.9
6.0
6.7
5.1
138.5
147.6
128.2
6.8
7.7
5.6
Sep/Oct
137.6
144.8
129.3
4.2
4.0
4.7
132.1
138.9
124.9
4.3
5.1
3.4
140.8
147.8
132.3
4.0
3.2
5.1
137.9
146.3
128.4
4.9
4.4
5.6
Oct/Nov
137.5
142.1
132.2
2.7
-0.4
6.8
132.5
137.4
127.3
3.9
2.8
5.2
140.7
144.7
135.8
2.0
-2.2
7.8
137.2
142.8
130.9
2.8
-0.3
7.1
Nov/Dec
135.0
136.1
133.7
3.2
-0.4
7.8
129.5
130.2
128.7
3.1
0.4
6.3
138.0
138.5
137.4
2.6
-1.9
8.8
135.8
139.4
131.9
4.8
2.6
7.7
Dec/Jan
133.2
132.2
134.3
4.2
0.9
8.1
127.9
126.8
129.1
3.4
0.7
6.4
135.6
133.5
138.1
4.2
0.4
9.2
135.3
137.8
132.5
5.2
3.0
8.0
Jan/Feb
132.7
130.3
135.4
4.6
1.2
8.5
127.9
125.7
130.1
4.3
1.9
6.7
135.3
131.8
139.5
4.5
0.2
9.8
133.5
133.9
133.1
5.1
3.1
7.5
Feb/M
ar
133.0
131.0
135.3
3.6
0.0
7.9
128.8
127.5
130.3
4.9
2.6
7.5
135.6
132.6
139.2
3.1
-1.0
8.3
132.8
132.6
133.1
2.6
-1.1
7.3
Mar/Apr
133.7
132.1
135.6
3.4
-0.2
7.9
128.8
127.5
130.2
4.0
1.5
6.8
136.7
134.4
139.6
3.4
-0.5
8.6
133.4
133.3
133.6
2.2
-2.1
7.7
Apr/May
133.7
131.8
135.9
1.9
-3.1
8.1
129.5
128.5
130.5
3.4
0.2
7.1
136.2
133.0
140.0
1.4
-4.3
8.8
133.8
133.9
133.7
0.8
-4.7
7.8
May/Jun
133.5
131.5
135.9
0.9
-4.8
8.1
128.9
127.4
130.5
2.2
-1.9
7.0
135.9
132.5
140.0
0.1
-6.1
8.5
134.7
135.5
133.8
0.7
-5.4
8.8
Jun/Jul
135.0
134.4
135.8
0.6
-4.8
7.6
130.2
130.0
130.5
2.5
-1.3
7.0
137.6
135.7
139.9
-0.5
-6.7
7.9
136.1
138.1
133.7
0.7
-4.9
8.0

xxv
Year
National
National Change %
Kathmandu Valley
Kathmandu Valley Change
%
Terai
Terai Change %
Hills
Hills Change %
Overall
Food
Non
Food
Overall
Food
Non
Food
Overall
Food
Non
Food
Overall
Food
Non
Food
Overall
Food
Non
Food
Overall
Food
Non
Food
Overall
Food
Non
Food
Overall
Food
Non
Food
2057/58 (2000/01)
138.1
133.0
144.2
2.4
-2.3
8.1
133.8
130.5
137.2
3.2
-0.3
6.9
139.2
132.0
147.9
1.1
-4.4
7.9
142.6
139.8
145.7
5.2
0.6
10.5
Jul/Aug
137.5
136.0
139.3
Jun/Jul
-4.6
8.2
132.4
132.2
132.7
2.1
-1.9
6.7
139.7
136.8
143.2
0.3
-6.1
8.8
139.9
140.1
139.7
1.2
-4.8
9.0
Aug/Sep
138.5
137.8
139.4
1.0
-4.4
8.1
133.8
134.8
132.6
2.4
-1.2
6.4
140.2
137.5
143.4
-0.1
-6.7
8.7
141.7
143.1
140.0
2.3
-3.0
9.2
Sep/Oct
141.6
138.2
145.7
2.9
-4.6
12.7
136.6
134.8
138.6
3.4
-3.0
11.0
143.3
138.0
149.7
1.8
-6.6
13.2
145.3
144.2
146.5
5.4
-1.4
14.1
Oct/Nov
141.3
136.8
146.6
2.8
-3.7
10.9
137.4
135.2
139.7
3.7
-1.6
9.7
142.3
135.7
150.2
1.1
-6.2
10.6
145.2
142.4
148.3
5.8
-0.3
13.3
Nov/Dec
139.3
134.4
145.0
3.2
-1.2
8.5
135.9
133.9
138.0
4.9
2.8
7.2
140.0
132.9
148.6
1.4
-4.0
8.2
142.9
139.4
146.9
5.2
0.0
11.4
Dec/Jan
136.7
129.5
145.3
2.6
-2.0
8.2
134.2
130.6
138.1
4.9
3.0
7.0
136.6
126.2
149.2
0.7
-5.5
8.0
141.4
136.5
146.9
4.5
-0.9
10.9
Jan/Feb
135.1
127.0
144.6
1.8
-2.5
6.8
132.1
126.7
137.9
3.3
0.8
6.0
134.8
123.9
148.1
-0.4
-6.0
6.2
140.8
135.7
146.6
5.5
1.3
10.1
Feb/M
ar
134.9
126.6
144.6
1.4
-3.4
6.9
130.7
124.0
137.7
1.5
-2.7
5.7
135.4
125.0
148.1
-0.1
-5.7
6.4
140.6
135.3
146.7
5.9
2.0
10.2
Mar/Apr
136.8
130.1
144.6
2.3
-1.5
6.6
131.6
125.8
137.7
2.2
-1.3
5.8
138.1
129.9
148.1
1.0
-3.3
6.1
142.0
137.8
146.7
6.4
3.4
9.8
Apr/May
137.7
131.6
144.8
3.0
-0.2
6.5
132.9
128.1
137.9
2.6
-0.3
5.7
138.5
130.5
148.3
1.7
-1.9
5.9
143.2
140.2
146.7
7.0
4.7
9.7
May/Jun
138.6
133.2
145.0
3.8
1.3
6.7
133.6
129.4
137.9
3.6
1.6
5.7
139.9
132.7
148.7
2.9
0.2
6.2
143.6
140.8
146.8
6.6
3.9
9.7
Jun/Jul
139.6
134.9
145.2
3.4
0.4
6.9
134.3
130.7
138.1
3.1
0.5
5.8
141.2
135.0
148.8
2.6
-0.5
6.4
144.2
141.6
147.0
6.0
2.5
9.9
2058/59 (2001/02)
142.1
137.9
147.2
2.9
3.7
2.1
136.5
133.8
139
2.0
2.5
1.6
144.0
138.0
151.5
3.4
4.5
2.4
146.2
144.1
148.6
2.5
3.1
2.0
Jul/Aug
141.5
138.3
145.3
2.9
1.7
4.3
135.4
134.4
136.4
2.3
1.7
2.8
143.3
137.9
149.9
2.6
0.8
4.7
146.4
145.5
147.5
4.6
3.9
5.6
Aug/Sep
143.7
142.5
145.3
3.8
3.4
4.2
137.9
139.3
136.4
3.1
3.3
2.9
145.7
142.2
150.0
3.9
3.4
4.6
148.0
148.5
147.5
4.4
3.8
5.4
Sep/Oct
144.4
143.5
145.6
2.0
3.8
-0.1
139.2
141.5
136.6
1.9
5.0
-1.4
146.1
142.7
150.3
2.0
3.4
0.4
148.4
148.9
147.7
2.1
3.3
0.8
Oct/Nov
144.8
143.2
146.8
2.5
4.7
0.1
138.6
138.2
139.0
0.9
2.2
-0.5
147.4
144.4
151.0
3.6
6.4
0.5
148.2
148.1
148.2
2.1
4.0
-0.1
Nov/Dec
143.1
139.9
146.9
2.7
4.1
1.3
137.2
135.4
139.0
1.0
1.1
0.7
145.4
140.6
151.2
3.9
5.8
1.7
146.6
145.1
148.3
2.6
4.1
1.0
Dec/Jan
140.7
135.5
147.0
2.9
4.6
1.2
136.4
133.9
139.0
1.6
2.5
0.7
142.0
134.4
151.4
4.0
6.5
1.5
144.4
141.0
148.2
2.1
3.3
0.9
Jan/Feb
139.4
132.3
147.8
3.2
4.2
2.2
134.6
128.7
140.8
1.9
1.6
2.1
140.9
132.1
151.7
4.5
6.6
2.4
143.4
138.5
148.8
1.8
2.1
1.5
Feb/M
ar
139.4
131.9
148.1
3.3
4.2
2.4
134.0
127.3
141.1
2.5
2.7
2.5
141.2
132.4
151.9
4.3
5.9
2.6
143.3
138.3
149.0
1.9
2.2
1.6
Mar/Apr
140.1
133.2
148.1
2.4
2.4
2.4
134.2
127.8
141.1
2.0
1.6
2.5
142.0
133.8
152.0
2.8
3.0
2.6
144.5
140.6
149.0
1.8
2.0
1.6
Apr/May
141.2
135.0
148.5
2.5
2.6
2.6
135.8
130.8
141.2
2.2
2.1
2.4
142.8
134.8
152.7
3.1
3.3
3.0
145.7
142.3
149.5
1.7
1.5
1.9
May/Jun
142.8
137.9
148.5
3.0
3.5
2.4
136.8
132.7
141.2
2.4
2.6
2.4
144.8
138.3
152.7
3.5
4.2
2.7
147.2
145.2
149.5
2.5
3.1
1.8
Jun/Jul
144.5
141.0
148.7
3.5
4.5
2.4
138.3
135.6
141.3
3.0
3.7
2.3
146.9
142.0
152.9
4.0
5.2
2.8
148.3
147.1
149.6
2.8
3.9
1.8
2059/60 (2002/03)
148.9
144.0
154.6
4.8
4.4
5.0
141.7
137.5
146.3
3.8
2.8
4.9
152.2
146.4
159.3
5.7
6.1
5.1
151.8
148.5
155.5
3.8
3.1
4.6
Jul/Aug
147.5
144.5
151.1
4.2
4.5
4.0
141.5
139.8
143.2
4.5
4.0
5.0
150.0
145.5
155.6
4.7
5.5
3.8
150.6
149.4
152.0
2.9
2.7
3.1
Aug/Sep
148.4
146.1
151.2
3.3
2.5
4.1
142.0
140.8
143.3
3.0
1.1
5.1
151.3
147.8
155.7
3.8
3.9
3.8
151.1
150.3
152.0
2.1
1.2
3.1
Sep/Oct
148.7
146.6
151.2
3.0
2.2
3.8
141.9
140.7
143.3
1.9
-0.6
4.9
152.0
149.0
155.7
4.0
4.4
3.6
151.0
149.9
152.2
1.8
0.7
3.0
Oct/Nov
148.0
144.8
151.8
2.2
1.1
3.4
140.9
138.3
143.6
1.7
0.1
3.3
151.7
147.6
156.6
2.9
2.2
3.7
150.0
147.6
152.6
1.2
-0.3
3.0
Nov/Dec
147.0
142.3
152.4
2.7
1.7
3.7
140.0
135.9
144.3
2.0
0.4
3.8
150.3
144.8
157.1
3.4
3.0
3.9
149.3
146.1
153.0
1.8
0.7
3.2
Dec/Jan
145.3
139.1
152.6
3.3
2.7
3.8
138.4
132.9
144.3
1.5
-0.7
3.8
148.4
141.1
157.4
4.5
5.0
4.0
148.4
144.2
153.2
2.8
2.3
3.4
Jan/Feb
145.8
139.2
153.4
4.6
5.2
3.8
138.9
132.9
145.3
3.2
3.3
3.2
148.8
141.2
158.1
5.6
6.9
4.2
149.0
144.3
154.3
3.9
4.2
3.7
Feb/M
ar
146.7
140.9
153.5
5.2
6.8
3.6
139.1
133.2
145.4
3.8
4.6
3.0
150.3
143.9
158.1
6.4
8.7
4.1
149.7
145.7
154.2
4.5
5.4
3.5
Mar/Apr
151.5
143.7
160.5
8.1
7.9
8.4
143.0
134.8
151.7
6.6
5.5
7.5
155.5
147.3
165.5
9.5
10.1
8.9
154.7
148.6
161.7
7.1
5.7
8.5
Apr/May
152.1
146.2
158.9
7.7
8.3
7.0
144.5
139.2
150.2
6.4
6.4
6.4
155.3
148.4
163.8
8.8
10.1
7.3
155.8
151.8
160.2
6.9
6.7
7.2
May/Jun
152.2
146.4
159.1
6.6
6.2
90.1
145.0
140.0
150.2
6.0
5.5
6.4
155.4
148.3
164.0
7.3
7.2
7.4
155.7
151.7
160.3
5.8
4.5
7.2
Jun/Jul
153.3
148.4
158.9
6.1
5.2
6.9
145.5
141.2
150.2
5.2
4.1
6.3
156.9
151.3
163.7
6.8
6.5
7.1
156.3
152.7
160.3
5.4
3.8
7.2
2060/61 (2003/04)
154.8
148.8
161.8
4.0
3.3
4.7
150.1
145.6
155.0
5.9
5.9
6.0
156.9
149.2
166.4
3.1
1.9
4.5
156.6
153.0
160.8
3.2
3.0
3.4
Jul/Aug
155.4
150.6
160.9
5.4
4.2
6.5
148.7
144.0
153.6
5.1
3.0
7.3
158.7
153.1
165.5
5.8
5.2
6.4
157.6
154.9
160.6
4.6
3.7
5.7
Aug/Sep
156.1
151.8
161.1
5.2
3.9
6.5
149.9
146.2
153.8
5.6
3.8
7.3
159.1
153.7
165.6
5.2
4.0
6.4
158.2
156.0
160.7
4.7
3.8
5.7
Sep/Oct
157.1
153.7
161.1
5.6
4.8
6.5
151.9
150.1
153.8
7.0
6.7
7.3
159.7
155.0
165.6
5.1
4.0
6.4
158.3
156.0
160.8
4.8
4.1
5.7
Oct/Nov
156.6
152.5
161.3
5.8
5.3
6.3
151.3
148.6
154.2
7.4
7.4
7.4
159.3
154.0
165.9
5.0
4.3
5.9
157.7
155.1
160.8
5.1
5.1
5.4
Nov/Dec
154.2
147.9
161.5
4.9
3.9
6.0
149.0
143.8
154.4
6.4
5.8
7.0
156.6
148.9
166.1
4.2
2.8
5.7
156.1
151.9
160.9
4.6
4.0
5.2
Dec/Jan
152.5
144.8
161.6
5.0
4.1
5.9
147.9
141.7
154.6
6.9
6.6
7.1
154.5
144.9
166.1
4.1
2.7
5.5
155.0
149.7
160.9
4.4
3.8
5.0
Jan/Feb
152.7
144.7
162.1
4.7
4.0
5.7
148.4
141.7
155.5
6.8
6.6
7.0
154.6
144.7
166.7
3.9
2.5
5.4
154.7
149.4
160.5
3.8
3.5
4.0
Feb/M
ar
153.1
145.3
162.2
4.4
3.1
5.7
148.9
142.5
155.7
7.0
7.0
7.1
155.1
145.5
166.8
3.2
1.1
5.5
154.8
149.7
160.6
3.4
2.7
4.2
Mar/Apr
154.1
147.2
162.3
1.7
2.4
1.1
150.6
145.7
155.8
5.3
8.1
2.7
155.6
146.4
166.9
0.1
-0.6
0.8
155.9
151.6
160.8
0.8
2.0
-0.6
Apr/May
154.1
147.1
162.4
1.3
0.6
2.2
150.8
146.1
155.9
4.4
5.0
3.8
155.3
145.7
167.0
0.0
-1.8
2.0
156.3
152.4
160.8
0.3
0.4
0.4
May/Jun
155.0
148.7
162.5
1.8
1.6
2.1
151.9
148.0
156.1
4.8
5.7
3.9
156.2
147.4
167.0
0.5
-0.6
1.8
157.0
153.7
160.8
0.8
1.3
0.3
Jun/Jul
156.4
151.2
162.5
2.0
1.9
2.3
152.2
148.5
156.1
4.6
5.2
3.9
158.4
151.4
167.0
1.0
0.1
2.0
157.9
155.4
160.8
1.0
1.8
0.3
2061/62 (2004/05)
161.8
154.7
170.1
4.5
4.0
5.1
157.6
151.8
163.8
5.0
4.3
5.7
163.8
155.0
174.5
4.4
3.9
4.9
163.5
158.8
168.8
4.4
3.8
5.0
Jul/Aug
159.1
154.8
164.1
2.4
2.8
2.0
154.6
150.9
158.6
4.0
4.8
3.3
161.6
156.2
168.2
1.8
2.0
1.6
159.7
157.5
162.1
1.3
1.7
0.9
Aug/Sep
160.2
156.8
164.2
2.6
3.3
1.9
156.5
154.2
158.9
4.4
5.5
3.3
162.4
157.7
168.1
2.1
2.6
1.5
160.2
158.5
162.1
1.3
1.6
0.9
Sep/Oct
161.2
157.0
166.0
2.6
2.1
3.0
157.3
154.2
160.6
3.6
2.7
4.4
163.4
157.9
170.1
2.3
1.9
2.7
161.4
159.2
164.0
2.0
2.1
2.0
Oct/Nov
160.8
155.9
166.7
2.7
2.2
3.3
157.3
154.1
160.8
4.0
3.7
4.3
162.9
156.3
170.9
2.3
1.5
3.0
161.0
157.5
165.0
2.1
1.5
2.6
Nov/Dec
159.0
152.4
166.7
3.1
3.0
3.2
155.8
151.1
160.8
4.6
5.1
4.1
160.7
152.3
170.9
2.6
2.3
2.9
159.7
155.0
165.0
2.3
2.0
2.5
Dec/Jan
159.5
149.7
170.8
4.6
3.4
5.7
155.8
147.4
164.9
5.3
4.0
6.7
161.2
149.8
175.3
4.3
3.4
5.5
160.6
153.4
168.7
3.6
2.5
4.8
Jan/Feb
161.4
150.6
174.1
5.7
4.1
7.4
158.3
149.7
167.4
6.7
5.6
7.7
162.5
149.2
178.6
5.1
3.1
7.1
163.7
155.5
172.9
5.8
4.1
7.7
Feb/M
ar
161.9
152.2
173.2
5.7
4.7
6.8
158.0
150.2
166.4
6.1
5.4
6.9
163.1
151.1
177.8
5.2
3.8
6.6
165.0
158.6
172.3
6.6
5.9
7.3
Mar/Apr
163.1
154.3
173.4
5.8
4.8
6.8
158.9
151.8
166.5
5.5
4.2
6.9
164.5
153.6
177.9
5.7
4.9
6.6
166.1
160.3
172.7
6.5
5.7
7.4
Apr/May
164.0
155.7
173.8
6.4
5.8
7.0
159.2
152.1
166.6
5.6
4.1
6.9
165.9
155.5
178.5
6.8
6.7
6.9
167.1
161.8
173.1
6.9
6.2
7.6
May/Jun
164.6
156.6
173.9
6.2
5.3
7.0
158.7
151.3
166.6
4.5
2.2
6.7
167.1
157.7
178.5
7.0
7.0
6.9
167.6
162.6
173.3
6.8
5.8
7.8
Jun/Jul
166.8
160.3
174.4
6.6
6.0
7.3
160.5
154.2
167.2
5.5
3.8
7.1
169.7
162.1
179.0
7.1
7.1
7.2
169.7
165.9
174.1
7.5
6.8
8.3

xxvi
Table 1c (Contd……….)
National
National Change %
Kathmandu Valley
Kathmandu Valley
Change %
Terai
Terai Change %
Hills
Hills Change %
Year
Overall
Food
Non
Food
Overall
Food
Non
Food
Overall
Food
Non
Food
Overall
Food
Non
Food
Overall
Food
Non
Food
Overall
Food
Non
Food
Overall
Food
Non
Food
Overall
Food
Non
Food
2062/63 (2005/06)
174.7
166.8
184
8.0
7.8
8.1
167.8
159.5
176.7
6.5
5.1
7.9
177.9
169.5
188.1
8.6
9.4
7.8
177.5
171.5
184.2
8.6
8.0
9.1
Jul/Aug
170.7
165.0
177.2
Jun/Jul
6.6
8.0
164.0
156.9
171.6
6.1
4.0
8.2
173.6
168.0
180.5
7.4
7.6
7.3
173.6
170.2
177.5
8.7
8.1
9.5
Aug/Sep
173.3
168.0
179.5
8.2
7.1
9.3
167.1
160.7
173.8
6.8
4.2
9.4
176.7
171.6
182.9
8.8
8.8
8.8
174.7
170.4
179.6
9.1
7.5
10.8
Sep/Oct
173.8
168.8
179.7
7.8
7.5
8.3
167.4
161.3
173.8
6.4
4.6
8.2
177.4
172.5
183.3
8.6
9.2
7.8
175.1
171.1
179.6
8.5
7.5
9.5
Oct/Nov
174.5
169.3
180.5
8.5
8.6
8.3
167.4
161.3
173.8
6.4
4.7
8.1
177.4
172.5
183.3
8.6
9.2
7.8
175.1
171.1
179.6
8.5
7.5
9.5
Nov/Dec
173.0
166.6
180.5
8.8
9.3
8.3
166.6
159.8
173.9
6.9
5.8
8.1
173.0
166.6
180.5
7.7
9.4
5.6
174.8
169.2
181.1
9.5
9.2
9.8
Dec/Jan
170.6
162.0
180.7
7.0
8.2
5.8
165.5
157.7
173.8
6.2
7.0
5.4
172.7
162.9
184.7
7.1
8.7
5.4
173.4
166.6
181.0
8.0
8.6
7.3
Jan/Feb
170.8
161.3
181.8
5.8
7.1
4.4
165.0
155.9
174.7
4.2
4.1
4.4
173.1
162.6
186.0
6.5
9.0
4.1
174.0
166.8
182.1
6.3
7.3
5.3
Feb/M
ar
174.3
161.7
188.9
7.7
6.2
9.1
166.7
153.5
180.8
5.5
2.2
8.7
177.7
164.7
193.6
9.0
9.0
8.9
177.5
167.0
189.2
7.6
5.3
9.8
Mar/Apr
176.0
164.9
189.0
7.9
6.9
9.0
168.7
157.4
180.8
6.2
3.7
8.6
178.6
166.1
193.8
8.6
8.1
8.9
181.2
174.0
189.2
9.1
8.5
9.6
Apr/May
179.0
169.8
189.7
9.1
9.1
9.1
171.9
163.4
181.0
8.0
7.4
8.6
181.7
171.0
194.7
9.5
10.0
9.1
183.3
177.2
190.2
9.7
9.5
9.9
May/Jun
179.6
170.9
189.5
9.1
9.1
9.0
171.2
161.9
181.0
7.9
7.0
8.6
183.6
174.6
194.5
9.9
10.7
9.0
182.7
176.1
190.1
9.0
8.3
9.7
Jun/Jul
180.6
172.9
189.6
8.3
7.9
8.7
172.2
163.8
181.1
7.3
6.2
8.3
184.7
176.7
194.6
8.8
9.0
8.7
183.5
177.6
190.1
8.1
7.1
9.2
2063/64 (2006/07)
185.9
178.8
194
6.4
7.2
5.5
178.0
169.4
187.2
6.1
6.2
5.9
189.9
182.8
198.6
6.7
7.8
5.6
188.2
183.4
193.7
6.0
6.9
5.2
Jul/Aug
183.1
175.0
192.5
7.3
6.1
8.6
174.9
165.7
184.8
6.6
5.6
7.7
187.1
178.9
197.2
7.8
6.5
9.3
185.6
179.5
192.5
6.9
5.5
8.5
Aug/Sep
184.8
178.0
192.7
6.6
6.0
7.4
177.1
169.8
185.0
6.0
5.7
6.4
188.6
181.6
197.3
6.7
5.8
7.9
187.2
182.2
192.9
7.2
6.9
7.4
Sep/Oct
186.9
181.9
192.7
7.5
7.8
7.2
178.6
172.6
185.0
6.7
7.0
6.4
191.3
186.3
197.4
7.8
8.0
7.7
188.7
185.0
193.0
7.8
8.1
7.5
Oct/Nov
186.9
181.2
193.4
7.1
7.0
7.1
178.5
171.3
186.2
6.6
6.2
7.1
191.4
186.1
197.8
7.9
7.9
7.9
188.6
184.2
193.5
7.7
7.7
7.7
Nov/Dec
185.6
178.7
193.6
7.3
7.3
7.3
178.0
170.1
186.3
6.8
6.4
7.1
189.4
182.3
198.0
9.5
9.4
9.7
188.1
183.3
193.5
7.6
8.3
6.8
Dec/Jan
183.6
175.0
193.6
7.6
8.0
7.1
176.3
167.0
186.3
6.5
5.9
7.2
187.3
178.4
198.0
8.5
9.5
7.2
185.9
179.2
193.6
7.2
7.6
7.0
Jan/Feb
184.5
175.5
195.0
8.0
8.8
7.3
177.2
166.4
188.8
7.4
6.7
8.1
188.5
179.7
199.1
8.9
10.5
7.0
186.0
178.9
194.0
6.9
7.3
6.5
Feb/M
ar
185.1
176.5
195.0
6.2
9.2
3.2
177.4
166.8
188.6
6.4
8.7
4.3
189.2
181.0
199.3
6.5
9.9
2.9
186.7
180.4
193.9
5.2
8.0
2.5
Mar/Apr
185.9
177.9
195.0
5.6
7.9
3.2
177.8
167.6
188.6
5.4
6.5
4.3
190.1
182.7
199.2
6.4
10.0
2.8
187.5
181.9
193.9
3.5
4.5
2.5
Apr/May
187.3
180.2
195.4
4.6
6.1
3.0
179.4
170.6
188.7
4.4
4.4
4.3
190.8
183.5
199.8
5.0
7.3
2.6
190.6
187.2
194.5
4.0
5.6
2.3
May/Jun
187.6
180.8
195.4
4.5
5.8
3.1
179.6
171.1
188.7
4.9
5.7
4.3
191.3
184.3
199.8
4.2
5.6
2.7
190.6
187.2
194.5
4.3
6.3
2.3
Jun/Jul
189.8
184.8
195.4
5.1
6.9
3.1
181.0
173.8
188.8
5.1
6.1
4.3
194.0
189.1
199.8
5.0
7.0
2.7
192.9
191.4
194.6
5.1
7.8
2.4
2064/65 (2007/08)
Jul/Aug
194.7
191.9
197.9
6.3
9.7
2.8
185.0
179.9
190.4
5.8
8.6
3.0
199.8
197.6
202.5
6.8
10.5
2.7
197.0
196.2
197.9
6.1
9.3
2.8
Aug/Sep
197.8
197.4
198.1
7.0
10.9
2.8
188.3
186.3
190.5
6.3
9.7
3.0
202.7
202.7
202.7
7.5
11.6
2.7
199.9
201.6
198.0
6.8
10.6
2.6
Sep/Oct
198.7
199.2
198.2
6.3
9.5
2.9
189.5
188.6
190.4
6.1
9.3
2.9
203.8
204.6
202.9
6.5
9.8
2.8
200.3
202.2
198.0
6.1
9.3
2.6

xxvii
Table-2
National Wholesale Price Index
(1999/00=100)
MID-OCTOBER 2007 (ASWIN 2064)
2005/06
2006/07
2007/08P
Percentage Change
Groups and Sub-groups
Weight %
Sep/Oct
Aug/Sep
Jun/Jul
Jul/Aug
Aug/Sep
Sep/Oct
Col 5
Col 5
Col 8
Col 8
1
2
3
4
5
6
7
8
Over 3
Over 4
Over 5
Over 7
1. Overall Index
100.00
135.0
147.1
149.0
160.0
163.5
164.3
10.4
1.3
10.3
0.5
1.1 Agricultural Commodities
49.59
134.0
149.6
153.5
168.2
174.4
175.2
14.6
2.6
14.1
0.5
Food grain
16.58
117.1
130.5
133.2
139.2
141.2
143.1
13.7
2.1
7.4
1.3
Cash Crops
6.09
171.1
207.6
232.4
243.2
249.6
251.8
35.8
11.9
8.3
0.9
Pulses
3.77
126.9
158.3
160.9
181.1
186.1
181.8
26.8
1.6
13.0
-2.3
Fruits and Vegetables
11.18
138.1
144.0
140.7
182.9
197.5
199.4
1.9
-2.3
41.7
1.0
Spices
1.95
102.0
124.6
131.4
129.6
136.2
132.8
28.8
5.5
1.1
-2.5
Livestock Production
10.02
143.7
153.9
154.7
156.8
161.1
160.6
7.7
0.5
3.8
-0.3
1.2 Domestic Manufactured Commodities
20.37
124.6
133.0
132.9
142.8
143.4
143.5
6.7
-0.1
8.0
0.1
Food-Related Products
6.12
116.7
122.7
122.8
133.5
129.2
130.1
5.2
0.1
5.9
0.7
Beverages and Tobacco
5.68
127.9
134.5
134.4
140.8
142.7
141.7
5.1
-0.1
5.4
-0.7
Construction M
aterials
4.50
144.3
163.4
163.2
181.1
187.4
188.5
13.1
-0.1
15.5
0.6
Others
4.07
110.2
112.7
112.7
117.2
116.9
116.5
2.3
0.0
3.4
-0.3
1.3 Imported Commodities
30.04
143.7
152.4
152.4
158.0
159.3
160.2
6.1
0.0
5.1
0.6
Petroleum Products and Coal
5.40
234.5
263.2
263.3
268.6
268.4
268.2
12.3
0.0
1.9
-0.1
Chem
ical Fertilizers and Chem
ical Goods
2.46
161.1
166.8
167.5
185.1
185.8
195.0
4.0
0.4
16.4
5.0
Transport Vehicles and M
achinery Goods
6.97
124.0
126.4
126.4
130.8
132.2
132.9
1.9
0.0
5.1
0.5
Electric and Electronic Goods
1.87
96.8
95.3
95.0
95.7
95.7
94.9
-1.9
-0.3
-0.1
-0.8
Drugs and M
edicine
2.73
112.0
112.3
112.0
115.8
114.0
116.3
0.0
-0.3
3.8
2.0
Textile-Related Products
3.10
111.2
111.6
111.3
108.6
108.7
108.1
0.1
-0.3
-2.9
-0.6
Others
7.51
127.7
137.6
137.9
146.3
150.3
150.5
8.0
0.2
9.1
0.1
P = Provisional, * Revised

xxviii
Table-2
National Wholesale Price Index
(1999/00=100)
Mid-September 2007 (Bhadra 2064)
2005/06
2006/07
2007/08P
Percentage Change
Groups and Sub-groups
Weight %
Aug/Sep
Jul/Aug
Jun/Jul
Jun/Jul
Jul/Aug
Aug/Sep
Col 5
Col 5
Col 8
Col 8
1
2
3
4
5
6
7
8
Over 3 Over 4 Over 5 Over 7
1. Overall Index
100.00
134.8
142.4
147.1
151.8
160.0
163.5
9.1
3.3
11.1
2.2
1.1 Agricultural Commodities
49.59
133.8
140.2
149.6
153.4
168.2
174.4
11.8
6.7
16.6
3.7
Food grains
16.58
117.8
126.2
130.5
130.9
139.2
141.2
10.8
3.4
8.2
1.4
Cash Crops
6.09
171.9
186.4
207.6
221.4
243.2
249.6
20.8
11.4
20.2
2.6
Pulses
3.77
128.6
156.0
158.3
173.6
181.1
186.1
23.1
1.5
17.6
2.8
Fruits and Vegetables
11.18
136.5
124.4
144.0
146.2
182.9
197.5
5.5
15.8
37.2
8.0
Spices
1.95
99.2
115.9
124.6
124.4
129.6
136.2
25.6
7.5
9.3
5.1
Livestock Production
10.02
143.1
151.6
153.9
155.5
156.8
161.1
7.5
1.5
4.7
2.7
1.2 Domestic Manufactured Commodities
20.37
124.0
132.6
133.0
140.5
142.8
143.4
7.3
0.3
7.8
0.4
Food-Related Products
6.12
115.0
121.6
122.7
131.0
133.5
129.2
6.7
0.9
5.3
-3.2
Beverages and Tobacco
5.68
127.9
134.5
134.5
136.0
140.8
142.7
5.2
0.0
6.1
1.3
Construction Materials
4.50
144.5
163.3
163.4
180.6
181.1
187.4
13.1
0.1
14.7
3.5
Others
4.07
109.6
112.5
112.7
116.5
117.2
116.9
2.8
0.2
3.7
-0.3
1.3 Imported Commodities
30.04
143.7
152.8
152.4
157.0
158.0
159.3
6.1
-0.3
4.5
0.8
Petroleum Products and Coal
5.40
234.5
263.2
263.2
268.7
268.6
268.4
12.2
0.0
2.0
-0.1
Chemical Fertilizers and Chemical Goods
2.46
160.7
170.6
166.8
176.7
185.1
185.8
3.8
-2.2
11.4
0.4
Transport Vehicles and Machinery Goods
6.97
123.9
126.4
126.4
130.5
130.8
132.2
2.0
0.0
4.6
1.1
Electric and Electronic Goods
1.87
96.8
95.3
95.3
95.7
95.7
95.7
-1.5
0.0
0.4
0.0
Drugs and Medicine
2.73
112.2
111.3
112.3
117.2
115.8
114.0
0.1
0.9
1.5
-1.6
Textile-Related Products
3.10
111.2
111.8
111.6
107.8
108.6
108.7
0.4
-0.2
-2.6
0.1
Others
7.51
127.8
138.5
137.6
144.7
146.3
150.3
7.7
-0.6
9.2
2.7
P = Provisional, * Revised
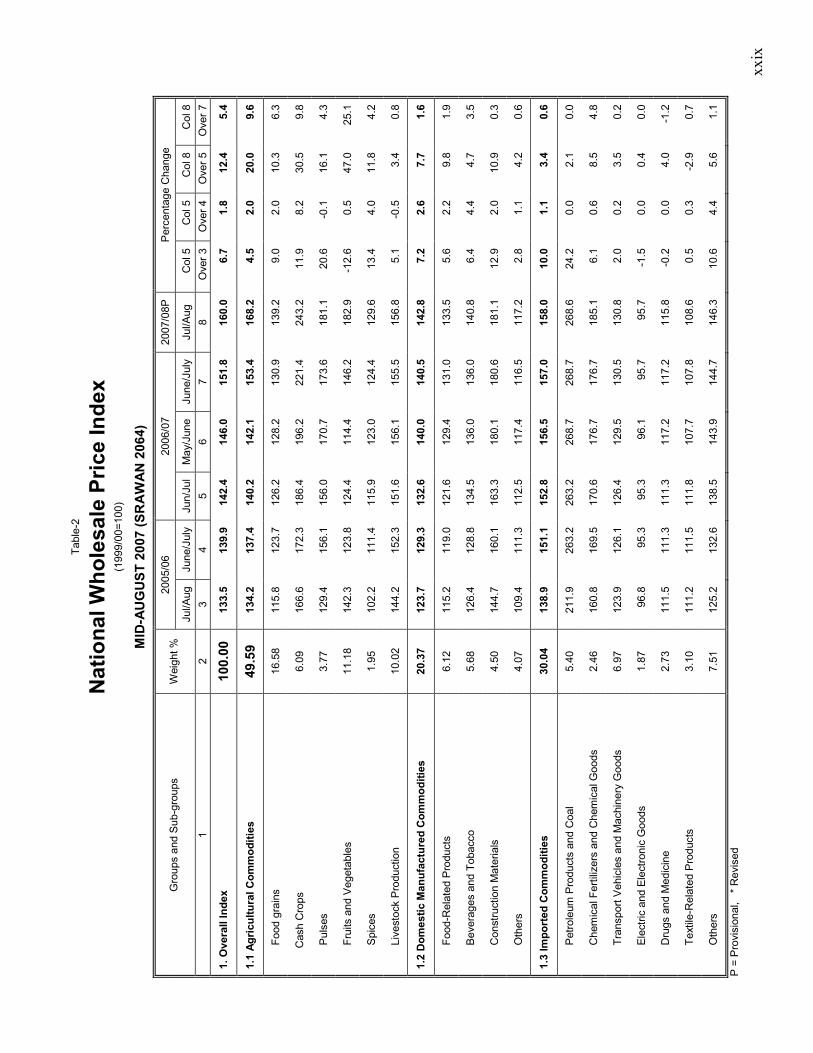
xxix
Table-2
National Wholesale Price Index
(1999/00=100)
MID-AUGUST 2007 (SRAWAN 2064)
2005/06
2006/07
2007/08P
Percentage Change
Groups and Sub-groups
Weight %
Jul/Aug June/July Jun/Jul May/June June/July
Jul/Aug
Col 5
Col 5
Col 8
Col 8
1
2
3
4
5
6
7
8
Over 3 Over 4 Over 5 Over 7
1. Overall Index
100.00
133.5
139.9
142.4
146.0
151.8
160.0
6.7
1.8
12.4
5.4
1.1 Agricultural Commodities
49.59
134.2
137.4
140.2
142.1
153.4
168.2
4.5
2.0
20.0
9.6
Food grains
16.58
115.8
123.7
126.2
128.2
130.9
139.2
9.0
2.0
10.3
6.3
Cash Crops
6.09
166.6
172.3
186.4
196.2
221.4
243.2
11.9
8.2
30.5
9.8
Pulses
3.77
129.4
156.1
156.0
170.7
173.6
181.1
20.6
-0.1
16.1
4.3
Fruits and Vegetables
11.18
142.3
123.8
124.4
114.4
146.2
182.9
-12.6
0.5
47.0
25.1
Spices
1.95
102.2
111.4
115.9
123.0
124.4
129.6
13.4
4.0
11.8
4.2
Livestock Production
10.02
144.2
152.3
151.6
156.1
155.5
156.8
5.1
-0.5
3.4
0.8
1.2 Domestic Manufactured Commodities
20.37
123.7
129.3
132.6
140.0
140.5
142.8
7.2
2.6
7.7
1.6
Food-Related Products
6.12
115.2
119.0
121.6
129.4
131.0
133.5
5.6
2.2
9.8
1.9
Beverages and Tobacco
5.68
126.4
128.8
134.5
136.0
136.0
140.8
6.4
4.4
4.7
3.5
Construction Materials
4.50
144.7
160.1
163.3
180.1
180.6
181.1
12.9
2.0
10.9
0.3
Others
4.07
109.4
111.3
112.5
117.4
116.5
117.2
2.8
1.1
4.2
0.6
1.3 Imported Commodities
30.04
138.9
151.1
152.8
156.5
157.0
158.0
10.0
1.1
3.4
0.6
Petroleum Products and Coal
5.40
211.9
263.2
263.2
268.7
268.7
268.6
24.2
0.0
2.1
0.0
Chemical Fertilizers and Chemical Goods
2.46
160.8
169.5
170.6
176.7
176.7
185.1
6.1
0.6
8.5
4.8
Transport Vehicles and Machinery Goods
6.97
123.9
126.1
126.4
129.5
130.5
130.8
2.0
0.2
3.5
0.2
Electric and Electronic Goods
1.87
96.8
95.3
95.3
96.1
95.7
95.7
-1.5
0.0
0.4
0.0
Drugs and Medicine
2.73
111.5
111.3
111.3
117.2
117.2
115.8
-0.2
0.0
4.0
-1.2
Textile-Related Products
3.10
111.2
111.5
111.8
107.7
107.8
108.6
0.5
0.3
-2.9
0.7
Others
7.51
125.2
132.6
138.5
143.9
144.7
146.3
10.6
4.4
5.6
1.1
P = Provisional, * Revised

xxx
Table-2.1
Wholesale Price Index of Agricultural commodities (1999/00=100)
Mid- October 2007 (Aswin 2064)
Code 2005/06 2006/07 2007/08P Percentage Change
No. Sep/Oct Aug/Sep Sep/Oct Jul/Aug Aug/Sep Sep/Oct Column 5 Column 5 Column 8 Column 8
Groups and Sub-groups 1 Weight %
3 4 5 6 7 8 Over 3 Over 4 Over 5 Over 7
Overall Index 100.00 100.00 134.0 149.6 153.5 168.2 174.4 175.2 14.6 2.6 14.1 0.5
1 Rice 22.10 22.10 119.2 121.2 122.1 134.2 136.4 137.8 2.4 0.7 12.9 1.0
2 Maize 1.80 1.80 95.4 107.2 110.3 126.2 117.6 118.3 15.6 2.9 7.3 0.6
3 Wheat 9.54 9.54 116.6 156.7 163.5 153.2 156.6 160.1 40.2 4.3 -2.1 2.2
4 Sugarcane* 2.52 0.00 0.00 0.00 0.00 0.00 0.00 0.00 0.00 0.00 0.00 0.00
5 Oilseeds 2.56 3.23 130.8 138.4 138.9 180.6 181.4 181.2 6.2 0.4 30.5 -0.1
6 Jute 0.30 0.37 147.7 133.7 147.6 119.4 120.3 118.1 -0.1 10.4 -20.0 -1.8
7 Potato 6.89 8.67 187.1 236.6 270.8 271.8 280.5 283.8 44.7 14.5 4.8 1.2
8 Pulses 7.60 7.60 126.9 158.3 160.9 181.1 186.1 181.8 26.8 1.6 13.0 -2.3
9 Fruits 11.38 11.38 103.2 137.1 125.1 144.1 145.6 118.0 21.2 -8.8 -5.7 -19.0
10 Vegetables 11.17 11.17 173.6 151.0 156.5 222.4 250.3 282.4 -9.9 3.6 80.4 12.8
11 Spices (Other Crops) 3.93 3.93 102.0 124.6 131.4 129.6 136.2 132.8 28.8 5.5 1.1 -2.5
12 Milk 1.96 1.96 122.2 134.8 134.8 147.0 147.0 139.8 10.3 0.0 3.7 -4.9
13 Meat (Buffalo) 8.05 8.05 175.5 188.4 188.4 188.4 193.7 193.7 7.4 0.0 2.8 0.0
14 Mutton 5.20 5.20 128.1 137.3 136.1 139.5 139.5 139.5 6.2 -0.9 2.5 0.0
15 Pork 1.09 1.09 140.8 140.8 147.9 155.0 155.0 155.0 5.0 5.0 4.8 0.0
16 Chicken 1.05 1.05 103.8 116.6 131.4 119.9 137.9 137.2 26.6 12.7 4.4 -0.5
17 Eggs 1.51 1.51 109.6 116.0 116.0 119.2 136.6 137.2 5.8 0.0 18.3 0.4
18 Fish 1.34 1.35 116.3 121.2 121.2 121.2 121.2 124.2 4.2 0.0 2.5 2.5
Table-2.1
Wholesale Price Index of Agricultural commodities (1999/00=100)
Mid- September 2007 (Bhadra 2064)
Code 2005/06 2006/07 2007/08P Percentage Change
No. Aug/Sep Jul/Aug Aug/Sep Jun/Jul Jul/Aug Aug/Sep Column 5 Column 5 Column 8 Column 8
Groups and Sub-groups 1 Weight %
3 4 5 6 7 8 Over 3 Over 4 Over 5 Over 7
Overall Index 100.00 100.00 133.8 140.2 149.6 153.4 168.2 174.4 11.8 6.7 16.6 3.7
1 Rice 22.10 22.10 119.6 120.7 121.2 128.1 134.2 136.4 1.3 0.4 12.5 1.6
2 Maize 1.80 1.80 99.8 110.2 107.2 117.5 126.2 117.6 7.4 -2.7 9.7 -6.8
3 Wheat 9.54 9.54 117.1 142.1 156.7 139.9 153.2 156.6 33.8 10.3 -0.1 2.2
4 Sugarcane* 2.52 0.0 0.0 0.0 0.0 0.0 0.0 0.0 0.0 0.0 0.0 0.0
5 Oilseeds 2.56 3.23 131.3 133.2 138.4 169.5 180.6 181.4 5.4 3.9 31.1 0.4
6 Jute 0.30 0.37 162.2 133.7 133.7 118.1 119.4 120.3 -17.6 0.0 -10.0 0.8
7 Potato 6.89 8.67 187.4 208.4 236.6 245.1 271.8 280.5 26.3 13.5 18.6 3.2
8 Pulses 7.60 7.60 128.6 156.0 158.3 173.6 181.1 186.1 23.1 1.5 17.6 2.8
9 Fruits 11.38 11.38 126.1 135.6 137.1 119.6 144.1 145.6 8.7 1.1 6.2 1.0
10 Vegetables 11.17 11.17 147.0 113.0 151.0 173.3 222.4 250.3 2.7 33.6 65.8 12.5
11 Spices (Other Crops) 3.93 3.93 99.2 115.9 124.6 124.4 129.6 136.2 25.6 7.5 9.3 5.1
12 Milk 1.96 1.96 122.2 134.8 134.8 142.8 147.0 147.0 10.3 0.0 9.1 0.0
13 Meat (Buffalo) 8.05 8.05 175.5 188.4 188.4 188.4 188.4 193.7 7.4 0.0 2.8 2.8
14 Mutton 5.20 5.20 128.1 133.0 137.3 139.5 139.5 139.5 7.2 3.2 1.6 0.0
15 Pork 1.09 1.09 117.8 140.8 140.8 155.0 155.0 155.0 19.5 0.0 10.1 0.0
16 Chicken 1.05 1.05 118.8 104.4 116.6 114.0 119.9 137.9 -1.9 11.7 18.3 15.0
17 Eggs 1.51 1.51 111.1 106.8 116.0 111.7 119.2 136.6 4.4 8.6 17.8 14.6
18 Fish 1.34 1.35 112.9 124.2 121.2 121.2 121.2 121.2 7.4 -2.4 0.0 0.0
Table-2.1
Wholesale Price Index of Agricultural commodities (1999/00=100)
Mid- August 2007 (Srawan 2064)
Code 2005/06 2006/07 2007/08P Percentage Change
No. Jul/Aug June/July Jul/Aug May/June June/July Jul/Aug Column 5 Column 5 Column 8 Column 8
Groups and Sub-groups 1 Weight %
3 4 5 6 7 8 Over 3 Over 4 Over 5 Over 7
Overall Index 100.00 100.00 134.2 137.4 140.2 142.1 153.4 168.2 4.5 2.0 20.0 9.6
1 Rice 22.10 22.10 117.4 121.0 120.7 125.0 128.1 134.2 2.8 -0.2 11.2 4.8
2 Maize 1.80 1.80 97.3 104.5 110.2 118.5 117.5 126.2 13.3 5.5 14.5 7.4
3 Wheat 9.54 9.54 115.4 133.7 142.1 137.4 139.9 153.2 23.1 6.3 7.8 9.5
4 Sugarcane* 2.52 0.0 0.0 0.0 0.0 0.0 0.0 0.0 0.0 0.0 0.0
5 Oilseeds 2.56 3.23 134.1 132.2 133.2 160.6 169.5 180.6 -0.7 0.8 35.6 6.5
6 Jute 0.30 0.37 162.2 173.7 133.7 118.1 118.1 119.4 -17.6 -23.0 -10.7 1.1
7 Potato 6.89 8.67 178.9 187.1 208.4 212.7 245.1 271.8 16.5 11.4 30.4 10.9
8 Pulses 7.60 7.60 129.4 156.1 156.0 170.7 173.6 181.1 20.6 -0.1 16.1 4.3
9 Fruits 11.38 11.38 146.5 135.7 135.6 117.1 119.6 144.1 -7.4 -0.1 6.3 20.5
10 Vegetables 11.17 11.17 138.0 111.6 113.0 111.7 173.3 222.4 -18.1 1.3 96.8 28.3
11 Spices (Other Crops) 3.93 3.93 102.2 111.4 115.9 123.0 124.4 129.6 13.4 4.0 11.8 4.2
12 Milk 1.96 1.96 122.2 133.4 134.8 134.0 142.8 147.0 10.3 1.0 9.1 2.9
13 Meat (Buffalo) 8.05 8.05 175.5 188.4 188.4 188.4 188.4 188.4 7.4 0.0 0.0 0.0
14 Mutton 5.20 5.20 132.2 133.0 133.0 140.6 139.5 139.5 0.6 0.0 4.9 0.0
15 Pork 1.09 1.09 117.8 140.8 140.8 155.0 155.0 155.0 19.5 0.0 10.1 0.0
16 Chicken 1.05 1.05 119.4 127.3 104.4 125.0 114.0 119.9 -12.6 -18.0 14.8 5.2
17 Eggs 1.51 1.51 111.4 105.1 106.8 119.2 111.7 119.2 -4.1 1.6 11.6 6.7
18 Fish 1.34 1.35 112.9 120.8 124.2 121.2 121.2 121.2 10.0 2.8 -2.4 0.0
P = Provisional , * Revised
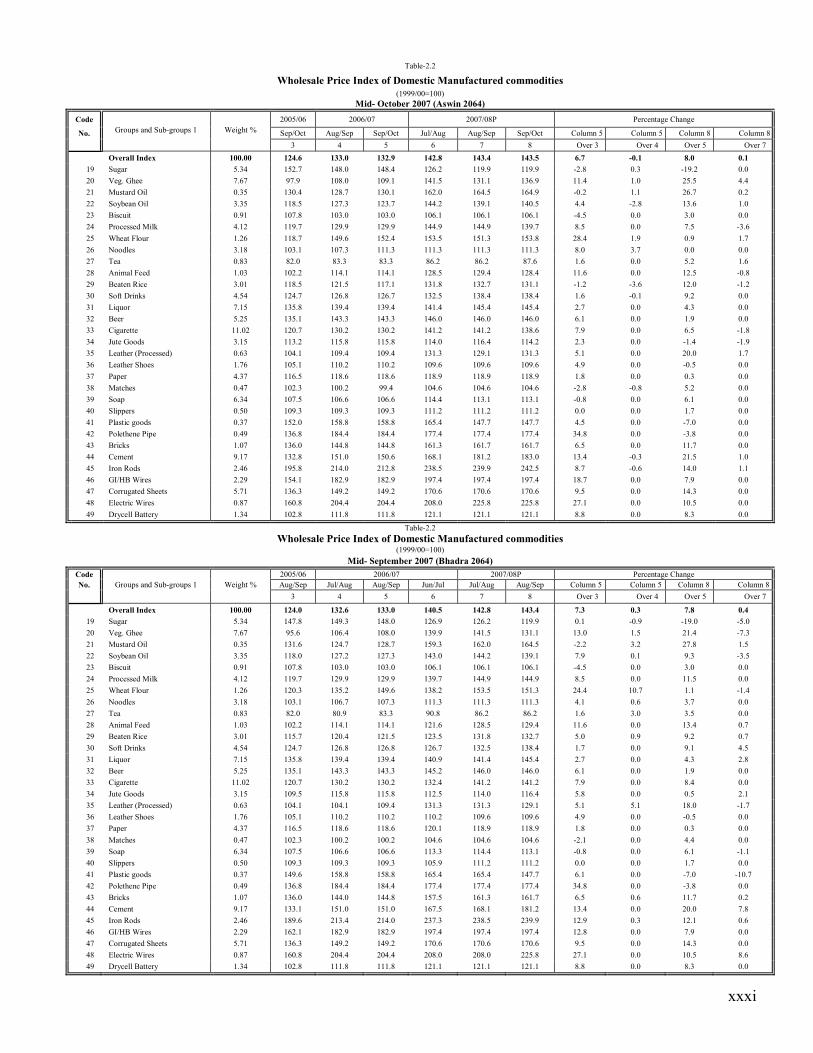
xxxi
Table-2.2
Wholesale Price Index of Domestic Manufactured commodities
(1999/00=100)
Mid- October 2007 (Aswin 2064)
Code 2005/06 2006/07 2007/08P Percentage Change
No. Sep/Oct Aug/Sep Sep/Oct Jul/Aug Aug/Sep Sep/Oct Column 5 Column 5 Column 8 Column 8
Groups and Sub-groups 1 Weight %
3 4 5 6 7 8 Over 3 Over 4 Over 5 Over 7
Overall Index 100.00 124.6 133.0 132.9 142.8 143.4 143.5 6.7 -0.1 8.0 0.1
19 Sugar 5.34 152.7 148.0 148.4 126.2 119.9 119.9 -2.8 0.3 -19.2 0.0
20 Veg. Ghee 7.67 97.9 108.0 109.1 141.5 131.1 136.9 11.4 1.0 25.5 4.4
21 Mustard Oil 0.35 130.4 128.7 130.1 162.0 164.5 164.9 -0.2 1.1 26.7 0.2
22 Soybean Oil 3.35 118.5 127.3 123.7 144.2 139.1 140.5 4.4 -2.8 13.6 1.0
23 Biscuit 0.91 107.8 103.0 103.0 106.1 106.1 106.1 -4.5 0.0 3.0 0.0
24 Processed Milk 4.12 119.7 129.9 129.9 144.9 144.9 139.7 8.5 0.0 7.5 -3.6
25 Wheat Flour 1.26 118.7 149.6 152.4 153.5 151.3 153.8 28.4 1.9 0.9 1.7
26 Noodles 3.18 103.1 107.3 111.3 111.3 111.3 111.3 8.0 3.7 0.0 0.0
27 Tea 0.83 82.0 83.3 83.3 86.2 86.2 87.6 1.6 0.0 5.2 1.6
28 Animal Feed 1.03 102.2 114.1 114.1 128.5 129.4 128.4 11.6 0.0 12.5 -0.8
29 Beaten Rice 3.01 118.5 121.5 117.1 131.8 132.7 131.1 -1.2 -3.6 12.0 -1.2
30 Soft Drinks 4.54 124.7 126.8 126.7 132.5 138.4 138.4 1.6 -0.1 9.2 0.0
31 Liquor 7.15 135.8 139.4 139.4 141.4 145.4 145.4 2.7 0.0 4.3 0.0
32 Beer 5.25 135.1 143.3 143.3 146.0 146.0 146.0 6.1 0.0 1.9 0.0
33 Cigarette 11.02 120.7 130.2 130.2 141.2 141.2 138.6 7.9 0.0 6.5 -1.8
34 Jute Goods 3.15 113.2 115.8 115.8 114.0 116.4 114.2 2.3 0.0 -1.4 -1.9
35 Leather (Processed) 0.63 104.1 109.4 109.4 131.3 129.1 131.3 5.1 0.0 20.0 1.7
36 Leather Shoes 1.76 105.1 110.2 110.2 109.6 109.6 109.6 4.9 0.0 -0.5 0.0
37 Paper 4.37 116.5 118.6 118.6 118.9 118.9 118.9 1.8 0.0 0.3 0.0
38 Matches 0.47 102.3 100.2 99.4 104.6 104.6 104.6 -2.8 -0.8 5.2 0.0
39 Soap 6.34 107.5 106.6 106.6 114.4 113.1 113.1 -0.8 0.0 6.1 0.0
40 Slippers 0.50 109.3 109.3 109.3 111.2 111.2 111.2 0.0 0.0 1.7 0.0
41 Plastic goods 0.37 152.0 158.8 158.8 165.4 147.7 147.7 4.5 0.0 -7.0 0.0
42 Polethene Pipe 0.49 136.8 184.4 184.4 177.4 177.4 177.4 34.8 0.0 -3.8 0.0
43 Bricks 1.07 136.0 144.8 144.8 161.3 161.7 161.7 6.5 0.0 11.7 0.0
44 Cement 9.17 132.8 151.0 150.6 168.1 181.2 183.0 13.4 -0.3 21.5 1.0
45 Iron Rods 2.46 195.8 214.0 212.8 238.5 239.9 242.5 8.7 -0.6 14.0 1.1
46 GI/HB Wires 2.29 154.1 182.9 182.9 197.4 197.4 197.4 18.7 0.0 7.9 0.0
47 Corrugated Sheets 5.71 136.3 149.2 149.2 170.6 170.6 170.6 9.5 0.0 14.3 0.0
48 Electric Wires 0.87 160.8 204.4 204.4 208.0 225.8 225.8 27.1 0.0 10.5 0.0
49 Drycell Battery 1.34 102.8 111.8 111.8 121.1 121.1 121.1 8.8 0.0 8.3 0.0
Table-2.2
Wholesale Price Index of Domestic Manufactured commodities (1999/00=100)
Mid- September 2007 (Bhadra 2064)
Code 2005/06 2006/07 2007/08P Percentage Change
No. Aug/Sep Jul/Aug Aug/Sep Jun/Jul Jul/Aug Aug/Sep Column 5 Column 5 Column 8 Column 8
Groups and Sub-groups 1 Weight %
3 4 5 6 7 8 Over 3 Over 4 Over 5 Over 7
Overall Index 100.00 124.0 132.6 133.0 140.5 142.8 143.4 7.3 0.3 7.8 0.4
19 Sugar 5.34 147.8 149.3 148.0 126.9 126.2 119.9 0.1 -0.9 -19.0 -5.0
20 Veg. Ghee 7.67 95.6 106.4 108.0 139.9 141.5 131.1 13.0 1.5 21.4 -7.3
21 Mustard Oil 0.35 131.6 124.7 128.7 159.3 162.0 164.5 -2.2 3.2 27.8 1.5
22 Soybean Oil 3.35 118.0 127.2 127.3 143.0 144.2 139.1 7.9 0.1 9.3 -3.5
23 Biscuit 0.91 107.8 103.0 103.0 106.1 106.1 106.1 -4.5 0.0 3.0 0.0
24 Processed Milk 4.12 119.7 129.9 129.9 139.7 144.9 144.9 8.5 0.0 11.5 0.0
25 Wheat Flour 1.26 120.3 135.2 149.6 138.2 153.5 151.3 24.4 10.7 1.1 -1.4
26 Noodles 3.18 103.1 106.7 107.3 111.3 111.3 111.3 4.1 0.6 3.7 0.0
27 Tea 0.83 82.0 80.9 83.3 90.8 86.2 86.2 1.6 3.0 3.5 0.0
28 Animal Feed 1.03 102.2 114.1 114.1 121.6 128.5 129.4 11.6 0.0 13.4 0.7
29 Beaten Rice 3.01 115.7 120.4 121.5 123.5 131.8 132.7 5.0 0.9 9.2 0.7
30 Soft Drinks 4.54 124.7 126.8 126.8 126.7 132.5 138.4 1.7 0.0 9.1 4.5
31 Liquor 7.15 135.8 139.4 139.4 140.9 141.4 145.4 2.7 0.0 4.3 2.8
32 Beer 5.25 135.1 143.3 143.3 145.2 146.0 146.0 6.1 0.0 1.9 0.0
33 Cigarette 11.02 120.7 130.2 130.2 132.4 141.2 141.2 7.9 0.0 8.4 0.0
34 Jute Goods 3.15 109.5 115.8 115.8 112.5 114.0 116.4 5.8 0.0 0.5 2.1
35 Leather (Processed) 0.63 104.1 104.1 109.4 131.3 131.3 129.1 5.1 5.1 18.0 -1.7
36 Leather Shoes 1.76 105.1 110.2 110.2 110.2 109.6 109.6 4.9 0.0 -0.5 0.0
37 Paper 4.37 116.5 118.6 118.6 120.1 118.9 118.9 1.8 0.0 0.3 0.0
38 Matches 0.47 102.3 100.2 100.2 104.6 104.6 104.6 -2.1 0.0 4.4 0.0
39 Soap 6.34 107.5 106.6 106.6 113.3 114.4 113.1 -0.8 0.0 6.1 -1.1
40 Slippers 0.50 109.3 109.3 109.3 105.9 111.2 111.2 0.0 0.0 1.7 0.0
41 Plastic goods 0.37 149.6 158.8 158.8 165.4 165.4 147.7 6.1 0.0 -7.0 -10.7
42 Polethene Pipe 0.49 136.8 184.4 184.4 177.4 177.4 177.4 34.8 0.0 -3.8 0.0
43 Bricks 1.07 136.0 144.0 144.8 157.5 161.3 161.7 6.5 0.6 11.7 0.2
44 Cement 9.17 133.1 151.0 151.0 167.5 168.1 181.2 13.4 0.0 20.0 7.8
45 Iron Rods 2.46 189.6 213.4 214.0 237.3 238.5 239.9 12.9 0.3 12.1 0.6
46 GI/HB Wires 2.29 162.1 182.9 182.9 197.4 197.4 197.4 12.8 0.0 7.9 0.0
47 Corrugated Sheets 5.71 136.3 149.2 149.2 170.6 170.6 170.6 9.5 0.0 14.3 0.0
48 Electric Wires 0.87 160.8 204.4 204.4 208.0 208.0 225.8 27.1 0.0 10.5 8.6
49 Drycell Battery 1.34 102.8 111.8 111.8 121.1 121.1 121.1 8.8 0.0 8.3 0.0
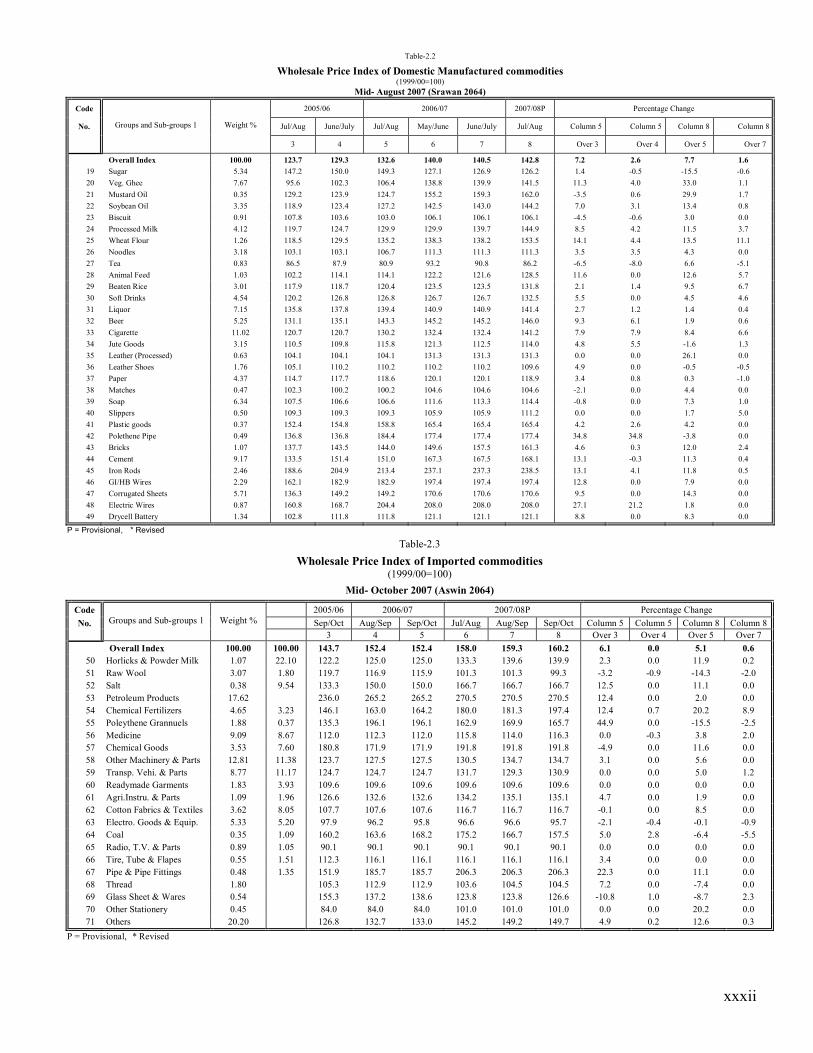
xxxii
Table-2.2
Wholesale Price Index of Domestic Manufactured commodities (1999/00=100)
Mid- August 2007 (Srawan 2064)
Code 2005/06 2006/07 2007/08P Percentage Change
No. Jul/Aug June/July Jul/Aug May/June June/July Jul/Aug Column 5 Column 5 Column 8 Column 8
Groups and Sub-groups 1 Weight %
3 4 5 6 7 8 Over 3 Over 4 Over 5 Over 7
Overall Index 100.00 123.7 129.3 132.6 140.0 140.5 142.8 7.2 2.6 7.7 1.6
19 Sugar 5.34 147.2 150.0 149.3 127.1 126.9 126.2 1.4 -0.5 -15.5 -0.6
20 Veg. Ghee 7.67 95.6 102.3 106.4 138.8 139.9 141.5 11.3 4.0 33.0 1.1
21 Mustard Oil 0.35 129.2 123.9 124.7 155.2 159.3 162.0 -3.5 0.6 29.9 1.7
22 Soybean Oil 3.35 118.9 123.4 127.2 142.5 143.0 144.2 7.0 3.1 13.4 0.8
23 Biscuit 0.91 107.8 103.6 103.0 106.1 106.1 106.1 -4.5 -0.6 3.0 0.0
24 Processed Milk 4.12 119.7 124.7 129.9 129.9 139.7 144.9 8.5 4.2 11.5 3.7
25 Wheat Flour 1.26 118.5 129.5 135.2 138.3 138.2 153.5 14.1 4.4 13.5 11.1
26 Noodles 3.18 103.1 103.1 106.7 111.3 111.3 111.3 3.5 3.5 4.3 0.0
27 Tea 0.83 86.5 87.9 80.9 93.2 90.8 86.2 -6.5 -8.0 6.6 -5.1
28 Animal Feed 1.03 102.2 114.1 114.1 122.2 121.6 128.5 11.6 0.0 12.6 5.7
29 Beaten Rice 3.01 117.9 118.7 120.4 123.5 123.5 131.8 2.1 1.4 9.5 6.7
30 Soft Drinks 4.54 120.2 126.8 126.8 126.7 126.7 132.5 5.5 0.0 4.5 4.6
31 Liquor 7.15 135.8 137.8 139.4 140.9 140.9 141.4 2.7 1.2 1.4 0.4
32 Beer 5.25 131.1 135.1 143.3 145.2 145.2 146.0 9.3 6.1 1.9 0.6
33 Cigarette 11.02 120.7 120.7 130.2 132.4 132.4 141.2 7.9 7.9 8.4 6.6
34 Jute Goods 3.15 110.5 109.8 115.8 121.3 112.5 114.0 4.8 5.5 -1.6 1.3
35 Leather (Processed) 0.63 104.1 104.1 104.1 131.3 131.3 131.3 0.0 0.0 26.1 0.0
36 Leather Shoes 1.76 105.1 110.2 110.2 110.2 110.2 109.6 4.9 0.0 -0.5 -0.5
37 Paper 4.37 114.7 117.7 118.6 120.1 120.1 118.9 3.4 0.8 0.3 -1.0
38 Matches 0.47 102.3 100.2 100.2 104.6 104.6 104.6 -2.1 0.0 4.4 0.0
39 Soap 6.34 107.5 106.6 106.6 111.6 113.3 114.4 -0.8 0.0 7.3 1.0
40 Slippers 0.50 109.3 109.3 109.3 105.9 105.9 111.2 0.0 0.0 1.7 5.0
41 Plastic goods 0.37 152.4 154.8 158.8 165.4 165.4 165.4 4.2 2.6 4.2 0.0
42 Polethene Pipe 0.49 136.8 136.8 184.4 177.4 177.4 177.4 34.8 34.8 -3.8 0.0
43 Bricks 1.07 137.7 143.5 144.0 149.6 157.5 161.3 4.6 0.3 12.0 2.4
44 Cement 9.17 133.5 151.4 151.0 167.3 167.5 168.1 13.1 -0.3 11.3 0.4
45 Iron Rods 2.46 188.6 204.9 213.4 237.1 237.3 238.5 13.1 4.1 11.8 0.5
46 GI/HB Wires 2.29 162.1 182.9 182.9 197.4 197.4 197.4 12.8 0.0 7.9 0.0
47 Corrugated Sheets 5.71 136.3 149.2 149.2 170.6 170.6 170.6 9.5 0.0 14.3 0.0
48 Electric Wires 0.87 160.8 168.7 204.4 208.0 208.0 208.0 27.1 21.2 1.8 0.0
49 Drycell Battery 1.34 102.8 111.8 111.8 121.1 121.1 121.1 8.8 0.0 8.3 0.0
P = Provisional, * Revised
Table-2.3
Wholesale Price Index of Imported commodities (1999/00=100)
Mid- October 2007 (Aswin 2064)
Code 2005/06 2006/07 2007/08P Percentage Change
No. Sep/Oct Aug/Sep Sep/Oct Jul/Aug Aug/Sep Sep/Oct Column 5 Column 5 Column 8 Column 8
Groups and Sub-groups 1 Weight %
3 4 5 6 7 8 Over 3 Over 4 Over 5 Over 7
Overall Index 100.00 100.00 143.7 152.4 152.4 158.0 159.3 160.2 6.1 0.0 5.1 0.6
50 Horlicks & Powder Milk 1.07 22.10 122.2 125.0 125.0 133.3 139.6 139.9 2.3 0.0 11.9 0.2
51 Raw Wool 3.07 1.80 119.7 116.9 115.9 101.3 101.3 99.3 -3.2 -0.9 -14.3 -2.0
52 Salt 0.38 9.54 133.3 150.0 150.0 166.7 166.7 166.7 12.5 0.0 11.1 0.0
53 Petroleum Products 17.62 236.0 265.2 265.2 270.5 270.5 270.5 12.4 0.0 2.0 0.0
54 Chemical Fertilizers 4.65 3.23 146.1 163.0 164.2 180.0 181.3 197.4 12.4 0.7 20.2 8.9
55 Poleythene Grannuels 1.88 0.37 135.3 196.1 196.1 162.9 169.9 165.7 44.9 0.0 -15.5 -2.5
56 Medicine 9.09 8.67 112.0 112.3 112.0 115.8 114.0 116.3 0.0 -0.3 3.8 2.0
57 Chemical Goods 3.53 7.60 180.8 171.9 171.9 191.8 191.8 191.8 -4.9 0.0 11.6 0.0
58 Other Machinery & Parts 12.81 11.38 123.7 127.5 127.5 130.5 134.7 134.7 3.1 0.0 5.6 0.0
59 Transp. Vehi. & Parts 8.77 11.17 124.7 124.7 124.7 131.7 129.3 130.9 0.0 0.0 5.0 1.2
60 Readymade Garments 1.83 3.93 109.6 109.6 109.6 109.6 109.6 109.6 0.0 0.0 0.0 0.0
61 Agri.Instru. & Parts 1.09 1.96 126.6 132.6 132.6 134.2 135.1 135.1 4.7 0.0 1.9 0.0
62 Cotton Fabrics & Textiles 3.62 8.05 107.7 107.6 107.6 116.7 116.7 116.7 -0.1 0.0 8.5 0.0
63 Electro. Goods & Equip. 5.33 5.20 97.9 96.2 95.8 96.6 96.6 95.7 -2.1 -0.4 -0.1 -0.9
64 Coal 0.35 1.09 160.2 163.6 168.2 175.2 166.7 157.5 5.0 2.8 -6.4 -5.5
65 Radio, T.V. & Parts 0.89 1.05 90.1 90.1 90.1 90.1 90.1 90.1 0.0 0.0 0.0 0.0
66 Tire, Tube & Flapes 0.55 1.51 112.3 116.1 116.1 116.1 116.1 116.1 3.4 0.0 0.0 0.0
67 Pipe & Pipe Fittings 0.48 1.35 151.9 185.7 185.7 206.3 206.3 206.3 22.3 0.0 11.1 0.0
68 Thread 1.80 105.3 112.9 112.9 103.6 104.5 104.5 7.2 0.0 -7.4 0.0
69 Glass Sheet & Wares 0.54 155.3 137.2 138.6 123.8 123.8 126.6 -10.8 1.0 -8.7 2.3
70 Other Stationery 0.45 84.0 84.0 84.0 101.0 101.0 101.0 0.0 0.0 20.2 0.0
71 Others 20.20 126.8 132.7 133.0 145.2 149.2 149.7 4.9 0.2 12.6 0.3
P = Provisional, * Revised

xxxiii
Table-2.3
Wholesale Price Index of Imported commodities (1999/00=100)
Mid- September 2007 (Bhadra 2064)
Code 2005/06 2006/07 2007/08P Percentage Change
No. Aug/Sep Jul/Aug Aug/Sep Jun/Jul Jul/Aug Aug/Sep Column 5 Column 5 Column 8 Column 8
Groups and Sub-groups 1 Weight %
3 4 5 6 7 8 Over 3 Over 4 Over 5 Over 7
Overall Index 100.00 100.00 143.7 152.8 152.4 157.0 158.0 159.3 6.1 -0.3 4.5 0.8
50 Horlicks & Powder Milk 1.07 22.10 122.2 125.0 125.0 131.2 133.3 139.6 2.3 0.0 11.7 4.7
51 Raw Wool 3.07 1.80 119.7 117.3 116.9 101.3 101.3 101.3 -2.3 -0.3 -13.3 0.0
52 Salt 0.38 9.54 133.3 150.0 150.0 166.7 166.7 166.7 12.5 0.0 11.1 0.0
53 Petroleum Products 17.62 236.0 265.2 265.2 270.6 270.5 270.5 12.4 0.0 2.0 0.0
54 Chemical Fertilizers 4.65 3.23 145.4 163.0 163.0 165.2 180.0 181.3 12.1 0.0 11.2 0.7
55 Poleythene Grannuels 1.88 0.37 135.3 196.1 196.1 165.7 162.9 169.9 44.9 0.0 -13.4 4.3
56 Medicine 9.09 8.67 112.2 111.3 112.3 117.2 115.8 114.0 0.1 0.9 1.5 -1.6
57 Chemical Goods 3.53 7.60 180.8 180.6 171.9 191.8 191.8 191.8 -4.9 -4.8 11.6 0.0
58 Other Machinery & Parts 12.81 11.38 123.7 127.5 127.5 130.5 130.5 134.7 3.1 0.0 5.6 3.2
59 Transp. Vehi. & Parts 8.77 11.17 124.7 123.9 124.7 130.2 131.7 129.3 0.0 0.6 3.7 -1.8
60 Readymade Garments 1.83 3.93 109.6 109.6 109.6 109.6 109.6 109.6 0.0 0.0 0.0 0.0
61 Agri.Instru. & Parts 1.09 1.96 124.8 133.0 132.6 140.8 134.2 135.1 6.3 -0.3 1.9 0.7
62 Cotton Fabrics & Textiles 3.62 8.05 107.7 107.6 107.6 114.4 116.7 116.7 -0.1 0.0 8.5 0.0
63 Electro. Goods & Equip. 5.33 5.20 97.9 96.2 96.2 96.6 96.6 96.6 -1.7 0.0 0.4 0.0
64 Coal 0.35 1.09 160.2 160.2 163.6 175.2 175.2 166.7 2.1 2.1 1.9 -4.9
65 Radio, T.V. & Parts 0.89 1.05 90.1 90.1 90.1 90.1 90.1 90.1 0.0 0.0 0.0 0.0
66 Tire, Tube & Flapes 0.55 1.51 112.3 126.8 116.1 116.1 116.1 116.1 3.4 -8.4 0.0 0.0
67 Pipe & Pipe Fittings 0.48 1.35 151.9 185.7 185.7 206.3 206.3 206.3 22.3 0.0 11.1 0.0
68 Thread 1.80 105.3 112.9 112.9 103.6 103.6 104.5 7.2 0.0 -7.4 0.9
69 Glass Sheet & Wares 0.54 155.3 134.6 137.2 130.1 123.8 123.8 -11.7 1.9 -9.8 0.0
70 Other Stationery 0.45 84.0 84.0 84.0 101.0 101.0 101.0 0.0 0.0 20.2 0.0
71 Others 20.20 127.0 133.8 132.7 143.0 145.2 149.2 4.5 -0.8 12.4 2.8
Table-2.3
Wholesale Price Index of Imported commodities (1999/00=100)
Mid- August 2007 (Srawan 2064)
Code 2005/06 2006/07 2007/08P Percentage Change
No. Jul/Aug June/July Jul/Aug May/June June/July Jul/Aug Column
5
Column
5
Column
8
Column
8
Groups and Sub-groups
1 Weight %
3 4 5 6 7 8 Over 3 Over 4 Over 5 Over 7
Overall Index 100.00 100.00 138.9 151.1 152.8 156.5 157.0 158.0 10.0 1.1 3.4 0.6
50 Horlicks & Powder Milk 1.07 22.10 125.6 123.3 125.0 131.2 131.2 133.3 -0.5 1.4 6.6 1.6
51 Raw Wool 3.07 1.80 119.7 116.4 117.3 101.3 101.3 101.3 -2.0 0.8 -13.6 0.0
52 Salt 0.38 9.54 133.3 150.0 150.0 166.7 166.7 166.7 12.5 0.0 11.1 0.0
53 Petroleum Products 17.62 213.0 265.2 265.2 270.6 270.6 270.5 24.5 0.0 2.0 0.0
54 Chemical Fertilizers 4.65 3.23 145.5 163.0 163.0 165.2 165.2 180.0 12.0 0.0 10.4 9.0
55 Poleythene Grannuels 1.88 0.37 135.3 165.7 196.1 165.7 165.7 162.9 44.9 18.3 -16.9 -1.7
56 Medicine 9.09 8.67 111.5 111.3 111.3 117.2 117.2 115.8 -0.2 0.0 4.0 -1.2
57 Chemical Goods 3.53 7.60 180.8 178.0 180.6 191.8 191.8 191.8 -0.1 1.5 6.2 0.0
58 Other Machinery & Parts 12.81 11.38 123.7 127.0 127.5 130.5 130.5 130.5 3.1 0.4 2.4 0.0
59 Transp. Vehi. & Parts 8.77 11.17 124.7 125.3 123.9 127.5 130.2 131.7 -0.6 -1.1 6.3 1.2
60 Readymade Garments 1.83 3.93 109.6 109.6 109.6 109.6 109.6 109.6 0.0 0.0 0.0 0.0
61 Agri.Instru. & Parts 1.09 1.96 124.8 127.9 133.0 140.8 140.8 134.2 6.6 4.0 0.9 -4.7
62 Cotton Fabrics & Textiles 3.62 8.05 107.7 107.6 107.6 114.4 114.4 116.7 -0.1 0.0 8.5 2.0
63 Electro. Goods & Equip. 5.33 5.20 97.9 96.2 96.2 97.1 96.6 96.6 -1.7 0.0 0.4 0.0
64 Coal 0.35 1.09 160.2 160.2 160.2 175.2 175.2 175.2 0.0 0.0 9.4 0.0
65 Radio, T.V. & Parts 0.89 1.05 90.1 90.1 90.1 90.1 90.1 90.1 0.0 0.0 0.0 0.0
66 Tire, Tube & Flapes 0.55 1.51 113.5 112.5 126.8 116.1 116.1 116.1 11.7 12.7 -8.4 0.0
67 Pipe & Pipe Fittings 0.48 1.35 151.9 151.9 185.7 206.3 206.3 206.3 22.3 22.3 11.1 0.0
68 Thread 1.80 105.3 112.9 112.9 103.6 103.6 103.6 7.2 0.0 -8.2 0.0
69 Glass Sheet & Wares 0.54 149.6 132.5 134.6 135.8 130.1 123.8 -10.0 1.6 -8.0 -4.8
70 Other Stationery 0.45 84.0 84.0 84.0 101.0 101.0 101.0 0.0 0.0 20.2 0.0
71 Others 20.20 123.7 130.3 133.8 141.8 143.0 145.2 8.2 2.7 8.5 1.5
P = Provisional, * Revised

xxxiv
Table - 2a
NATIONAL WHOLESALE PRICE INDEX (1999/00 = 100)
Agricultural
Commodities
Domestic
Manufactured
Commodities
Imported
Commodities Overall WPI
Agricultural
Commodities
Domestic
Manufactured
Commodities
Imported
Commodities Overall WPI
FY / Months
Index % Change Index % Change Index % Change Index % Change
FY / Months
Index % Change Index % Change Index % Change Index % Change
100.0 100.0 100.0
1900/00
(2056/57) 100.0 100.0 100.0 100.0
2004/05
(2061/62) 118.5 5.9 121.6 6.2 132.3 10.2 123.3 7.3
Jul/Aug 105.0 - 101.4 - 97.0 - 101.9 - Jul/Aug 122.1 7.3 118.9 7.5 124.3 5.5 122.1 6.7
Aug/Sep 107.2 - 101.6 - 97.0 - 103.0 - Aug/Sep 123.2 5.4 118.9 7.3 125.7 6.5 123.1 6.1
Sep/Oct 109.1 - 101.3 - 97.4 - 104.0 - Sep/Oct 121.8 3.7 119.5 7.8 128.5 8.6 123.4 6.0
Oct/Nov 105.2 - 100.4 - 100.3 - 102.7 - Oct/Nov 120.2 1.2 119.4 7.4 128.6 8.4 122.6 4.6
Nov/Dec 97.6 - 99.5 - 100.8 - 99.0 - Nov/Dec 113.1 0.8 119.4 7.6 128.4 8.1 119.0 4.5
Dec/Jan 96.6 - 99.8 - 101.0 - 98.6 - Dec/Jan 112.0 4.2 119.8 7.2 132.4 10.8 119.7 6.9
Jan/Feb 95.3 - 99.9 - 101.1 - 98.0 - Jan/Feb 111.2 3.4 121.7 5.6 136.6 13.7 121.0 7.2
Feb/Mar 94.8 - 99.3 - 100.7 - 97.5 - Feb/Mar 115.5 7.6 122.4 4.3 136.3 12.4 123.2 8.5
Mar/Apr 95.2 - 99.1 - 100.6 - 97.6 - Mar/Apr 115.9 7.7 123.3 4.1 136.9 12.2 123.7 8.3
Apr/May 95.8 - 99.2 - 100.4 - 97.9 - Apr/May 118.1 9.9 125.4 5.4 136.6 11.8 125.2 9.5
May/Jun 96.6 - 99.3 - 101.4 - 98.6 - May/Jun 120.7 8.6 126.0 5.6 136.6 11.4 126.5 8.9
Jun/Jul 101.6 - 99.2 - 102.1 - 101.3 - Jun/Jul 127.7 10.8 124.9 5.2 136.7 11.7 129.9 10.0
2000/01
(2057/58) 98.2 -1.8 100.0 0.0 107.8 7.8 101.4 1.4
2005/06
(2062/63) 130.2 9.9 126.0 3.6 146.5 10.7 134.3 8.9
Jul/Aug 99.8 -5.0 99.6 -1.8 102.8 6.0 100.7 -1.2 Jul/Aug 134.2 9.9 123.7 4.0 138.9 11.7 133.5 9.3
Aug/Sep 100.6 -6.2 99.6 -2.0 103.4 6.6 101.2 -1.7 Aug/Sep 133.8 8.6 124.0 4.3 143.7 14.3 134.8 9.5
Sep/Oct 101.3 -7.1 98.6 -2.7 111.1 14.1 103.7 -0.3 Sep/Oct 134.0 10.0 124.6 4.3 143.7 11.8 135.0 9.4
Oct/Nov 101.1 -3.9 98.5 -1.9 111.5 11.2 103.7 1.0 Oct/Nov 136.3 13.4 124.9 4.6 144.3 12.2 136.4 11.3
Nov/Dec 95.9 -1.7 99.7 0.2 109.6 8.7 100.8 1.8 Nov/Dec 132.1 16.8 124.7 4.4 144.4 12.5 134.3 12.9
Dec/Jan 93.9 -2.8 99.6 -0.2 109.6 8.5 99.8 1.2 Dec/Jan 122.5 9.4 124.5 3.9 144.3 9.0 129.5 8.2
Jan/Feb 92.8 -2.6 99.5 -0.4 107.2 6.0 98.5 0.5 Jan/Feb 120.9 8.7 124.9 2.6 144.8 6.0 128.9 6.5
Feb/Mar 94.5 -0.3 100.3 1.0 107.3 6.6 99.5 2.1 Feb/Mar 120.9 4.7 126.7 3.5 150.0 10.1 130.8 6.2
Mar/Apr 95.3 0.1 100.8 1.7 107.2 6.6 100.0 2.5 Mar/Apr 125.0 7.9 126.7 2.8 150.7 10.1 133.1 7.6
Apr/May 97.5 1.8 100.9 1.7 108.1 7.7 101.3 3.5 Apr/May 131.8 11.6 128.7 2.6 150.9 10.5 136.9 9.3
May/Jun 101.6 5.2 101.3 2.0 108.3 6.8 103.5 5.0 May/Jun 133.9 10.9 129.4 2.7 151.2 10.7 138.2 9.2
Jun/Jul 103.8 2.2 102.2 3.0 107.7 5.5 104.6 3.3 Jun/Jul 137.4 7.6 129.3 3.5 151.1 10.5 139.9 7.7
2001/02
(2058/59) 105.6 7.5 105.5 5.5 108.4 0.6 106.4 4.9
2006/07
(2063/64) 145.3 11.6 136.7 8.5 154.7 5.6 146.4 9.0
Jul/Aug 109.4 9.6 104.4 4.8 108.0 5.1 108.0 7.2 Jul/Aug 140.2 4.5 132.6 7.2 152.8 10.0 142.4 6.7
Aug/Sep 111.1 10.4 104.5 4.9 108.6 5.0 109.0 7.7 Aug/Sep 149.6 11.8 133.0 7.3 152.4 6.1 147.1 9.1
Sep/Oct 114.0 12.5 105.2 6.7 108.7 -2.2 110.6 6.7 Sep/Oct 153.5 14.6 132.9 6.7 152.4 6.1 149.0 10.4
Oct/Nov 117.5 16.2 104.8 6.4 108.7 -2.5 112.3 8.3 Oct/Nov 154.2 13.1 135.5 8.5 154.5 7.1 150.5 10.3
Nov/Dec 106.5 11.1 105.0 5.3 108.3 -1.2 106.7 5.9 Nov/Dec 145.6 10.2 136.0 9.1 154.5 7.0 146.3 8.9
Dec/Jan 104.3 11.1 104.8 5.2 108.3 -1.2 105.6 5.8 Dec/Jan 138.5 13.1 136.6 9.7 154.7 7.2 143.0 10.4
Jan/Feb 99.9 7.7 106.1 6.6 108.3 1.0 103.7 5.3 Jan/Feb 142.1 17.5 137.2 9.8 155.4 7.3 145.1 12.6
Feb/Mar 99.4 5.2 106.6 6.3 108.2 0.8 103.5 4.0 Feb/Mar 145.0 19.9 137.7 8.7 155.5 3.7 146.7 12.2
Mar/Apr 96.6 1.4 106.5 5.7 108.4 1.1 102.2 2.2 Mar/Apr 137.5 10.0 139.3 9.9 155.3 3.1 143.2 7.6
Apr/May 100.1 2.7 106.9 5.9 108.5 0.4 104.0 2.7 Apr/May 141.7 7.5 139.5 8.4 155.4 3.0 145.4 6.2
May/Jun 103.0 1.4 105.9 4.5 108.6 0.3 105.2 1.6 May/Jun 142.1 6.1 140.0 8.2 156.5 3.5 146.0 5.6
Jun/Jul 105.0 1.2 105.7 3.4 108.8 1.0 106.3 1.6 Jun/Jul 153.4 11.6 140.5 8.7 157.0 3.9 151.8 8.5
2002/03
(2059/60) 109.6 3.8 108.4 2.7 113.1 4.3 110.4 3.8
2007/08
(2064/65)
Jul/Aug 113.8 4.0 106.3 1.8 109.2 1.1 110.9 2.7 Jul/Aug 168.2 20.0 142.8 7.7 158.0 3.4 160.0 12.4
Aug/Sep 116.7 5.0 106.7 2.1 109.3 0.6 112.4 3.1 Aug/Sep 174.4 16.6 143.4 7.8 159.3 4.5 163.5 11.1
Sep/Oct 116.5 2.2 106.8 1.5 109.5 0.7 112.5 1.7 Sep/Oct 175.2 14.1 143.5 8.0 160.2 5.1 164.3 10.3
Oct/Nov 116.5 -0.9 107.0 2.1 109.8 1.0 112.6 0.3
Nov/Dec 105.1 -1.3 108.2 3.0 111.1 2.6 107.5 0.7
Dec/Jan 99.4 -4.7 107.9 3.0 111.0 2.5 104.6 -0.9
Jan/Feb 104.3 4.4 108.5 2.3 111.5 3.0 107.3 3.5
Feb/Mar 108.6 9.3 108.9 2.2 111.7 3.2 109.6 5.9
Mar/Apr 106.0 9.7 110.0 3.3 120.8 11.4 111.3 8.9
Apr/May 109.8 9.7 110.3 3.2 117.8 8.6 112.3 8.0
May/Jun 107.4 4.3 110.5 4.3 117.9 8.6 111.2 5.7
Jun/Jul 110.7 5.4 110.1 4.2 117.9 8.4 112.7 6.0
2003/04
(2060/61) 111.9 2.1 114.5 5.6 120.1 6.2 114.9 4.1
Jul/Aug 113.8 0.0 110.6 4.0 117.8 7.9 114.4 3.2
Aug/Sep 116.9 0.2 110.8 3.8 118.0 8.0 116.0 3.2
Sep/Oct 117.5 0.9 110.9 3.8 118.3 8.0 116.4 3.5
Oct/Nov 118.8 2.0 111.2 3.9 118.6 8.0 117.2 4.1
Nov/Dec 112.2 6.8 111.0 2.6 118.8 6.9 113.9 6.0
Dec/Jan 107.5 8.1 111.8 3.6 119.5 7.7 112.0 7.1
Jan/Feb 107.5 3.1 115.3 6.3 120.1 7.7 112.9 5.2
Feb/Mar 107.3 -1.2 117.4 7.8 121.3 8.6 113.5 3.6
Mar/Apr 107.6 1.5 118.5 7.7 122.0 1.0 114.2 2.6
Apr/May 107.5 -2.1 119.0 7.9 122.2 3.7 114.3 1.8
May/Jun 111.1 3.4 119.3 8.0 122.6 4.0 116.2 4.5
Jun/Jul 115.3 4.2 118.7 7.8 122.4 3.8 118.1 4.8
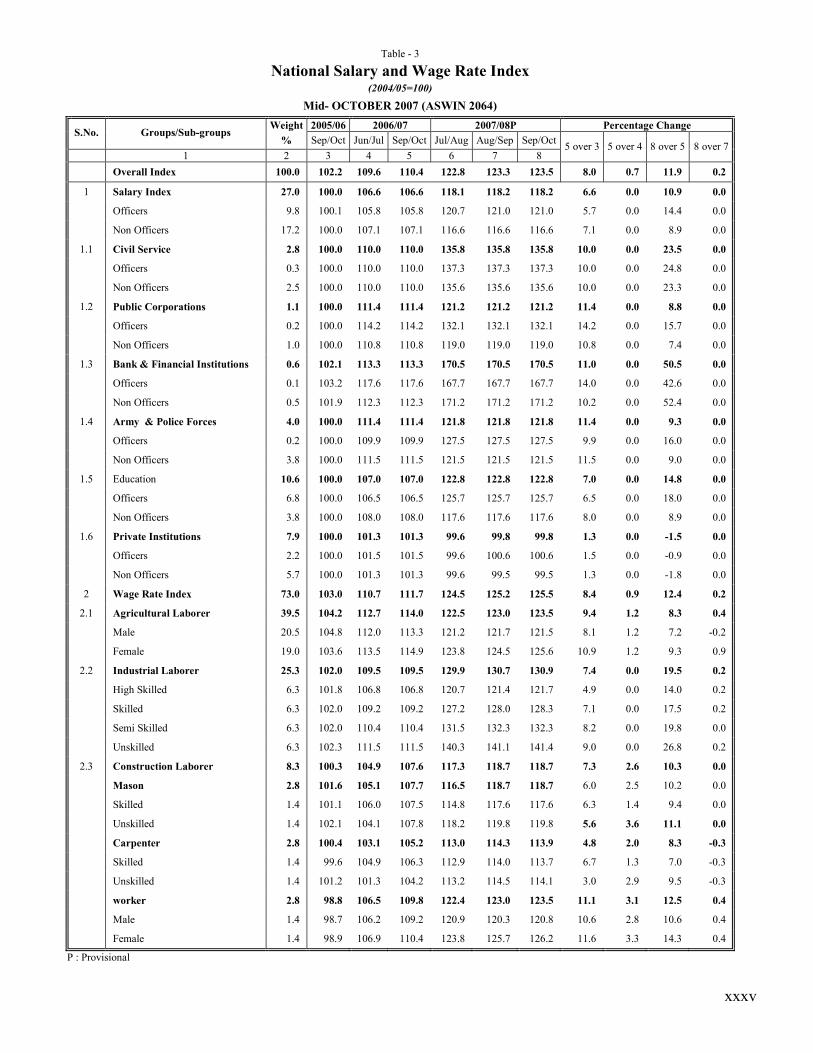
xxxv
Table - 3
National Salary and Wage Rate Index (2004/05=100)
Mid- OCTOBER 2007 (ASWIN 2064)
Weight 2005/06 2006/07 2007/08P Percentage Change S.No. Groups/Sub-groups
% Sep/Oct Jun/Jul Sep/Oct Jul/Aug Aug/Sep Sep/Oct
1 2 3 4 5 6 7 8 5 over 3 5 over 4 8 over 5 8 over 7
Overall Index 100.0 102.2 109.6 110.4 122.8 123.3 123.5 8.0 0.7 11.9 0.2
1 Salary Index 27.0 100.0 106.6 106.6 118.1 118.2 118.2 6.6 0.0 10.9 0.0
Officers 9.8 100.1 105.8 105.8 120.7 121.0 121.0 5.7 0.0 14.4 0.0
Non Officers 17.2 100.0 107.1 107.1 116.6 116.6 116.6 7.1 0.0 8.9 0.0
1.1 Civil Service 2.8 100.0 110.0 110.0 135.8 135.8 135.8 10.0 0.0 23.5 0.0
Officers 0.3 100.0 110.0 110.0 137.3 137.3 137.3 10.0 0.0 24.8 0.0
Non Officers 2.5 100.0 110.0 110.0 135.6 135.6 135.6 10.0 0.0 23.3 0.0
1.2 Public Corporations 1.1 100.0 111.4 111.4 121.2 121.2 121.2 11.4 0.0 8.8 0.0
Officers 0.2 100.0 114.2 114.2 132.1 132.1 132.1 14.2 0.0 15.7 0.0
Non Officers 1.0 100.0 110.8 110.8 119.0 119.0 119.0 10.8 0.0 7.4 0.0
1.3 Bank & Financial Institutions 0.6 102.1 113.3 113.3 170.5 170.5 170.5 11.0 0.0 50.5 0.0
Officers 0.1 103.2 117.6 117.6 167.7 167.7 167.7 14.0 0.0 42.6 0.0
Non Officers 0.5 101.9 112.3 112.3 171.2 171.2 171.2 10.2 0.0 52.4 0.0
1.4 Army & Police Forces 4.0 100.0 111.4 111.4 121.8 121.8 121.8 11.4 0.0 9.3 0.0
Officers 0.2 100.0 109.9 109.9 127.5 127.5 127.5 9.9 0.0 16.0 0.0
Non Officers 3.8 100.0 111.5 111.5 121.5 121.5 121.5 11.5 0.0 9.0 0.0
1.5 Education 10.6 100.0 107.0 107.0 122.8 122.8 122.8 7.0 0.0 14.8 0.0
Officers 6.8 100.0 106.5 106.5 125.7 125.7 125.7 6.5 0.0 18.0 0.0
Non Officers 3.8 100.0 108.0 108.0 117.6 117.6 117.6 8.0 0.0 8.9 0.0
1.6 Private Institutions 7.9 100.0 101.3 101.3 99.6 99.8 99.8 1.3 0.0 -1.5 0.0
Officers 2.2 100.0 101.5 101.5 99.6 100.6 100.6 1.5 0.0 -0.9 0.0
Non Officers 5.7 100.0 101.3 101.3 99.6 99.5 99.5 1.3 0.0 -1.8 0.0
2 Wage Rate Index 73.0 103.0 110.7 111.7 124.5 125.2 125.5 8.4 0.9 12.4 0.2
2.1 Agricultural Laborer 39.5 104.2 112.7 114.0 122.5 123.0 123.5 9.4 1.2 8.3 0.4
Male 20.5 104.8 112.0 113.3 121.2 121.7 121.5 8.1 1.2 7.2 -0.2
Female 19.0 103.6 113.5 114.9 123.8 124.5 125.6 10.9 1.2 9.3 0.9
2.2 Industrial Laborer 25.3 102.0 109.5 109.5 129.9 130.7 130.9 7.4 0.0 19.5 0.2
High Skilled 6.3 101.8 106.8 106.8 120.7 121.4 121.7 4.9 0.0 14.0 0.2
Skilled 6.3 102.0 109.2 109.2 127.2 128.0 128.3 7.1 0.0 17.5 0.2
Semi Skilled 6.3 102.0 110.4 110.4 131.5 132.3 132.3 8.2 0.0 19.8 0.0
Unskilled 6.3 102.3 111.5 111.5 140.3 141.1 141.4 9.0 0.0 26.8 0.2
2.3 Construction Laborer 8.3 100.3 104.9 107.6 117.3 118.7 118.7 7.3 2.6 10.3 0.0
Mason 2.8 101.6 105.1 107.7 116.5 118.7 118.7 6.0 2.5 10.2 0.0
Skilled 1.4 101.1 106.0 107.5 114.8 117.6 117.6 6.3 1.4 9.4 0.0
Unskilled 1.4 102.1 104.1 107.8 118.2 119.8 119.8 5.6 3.6 11.1 0.0
Carpenter 2.8 100.4 103.1 105.2 113.0 114.3 113.9 4.8 2.0 8.3 -0.3
Skilled 1.4 99.6 104.9 106.3 112.9 114.0 113.7 6.7 1.3 7.0 -0.3
Unskilled 1.4 101.2 101.3 104.2 113.2 114.5 114.1 3.0 2.9 9.5 -0.3
worker 2.8 98.8 106.5 109.8 122.4 123.0 123.5 11.1 3.1 12.5 0.4
Male 1.4 98.7 106.2 109.2 120.9 120.3 120.8 10.6 2.8 10.6 0.4
Female 1.4 98.9 106.9 110.4 123.8 125.7 126.2 11.6 3.3 14.3 0.4
P : Provisional

xxxvi
Table - 3
National Salary and Wage Rate Index (2004/05=100)
Mid-September 2007 (Bhadra 2064)
Weight 2005/06 2006/07 2007/08P Percentage Change S.No. Groups/Sub-groups
% Aug/Sep Jun/Jul Aug/Sep Jun/Jul Jul/Aug Aug/Sep
1 2 3 4 5 6 7 8
5 over 3
5 over 4
8 over 5
8 over 7
Overall Index 100.0 101.9 109.3 109.6 119.3 122.8 123.3 7.6 0.3 12.5 0.4
1 Salary Index 27.0 100.0 106.4 106.6 106.6 118.1 118.2 6.6 0.2 10.9 0.1
Officers 9.8 100.1 105.7 105.8 105.8 120.7 121.0 5.7 0.1 14.4 0.2
Non Officers 17.2 100.0 106.8 107.1 107.1 116.6 116.6 7.1 0.3 8.9 0.0
1.1 Civil Service 2.8 100.0 110.0 110.0 110.0 135.8 135.8 10.0 0.0 23.5 0.0
Officers 0.3 100.0 110.0 110.0 110.0 137.3 137.3 10.0 0.0 24.8 0.0
Non Officers 2.5 100.0 110.0 110.0 110.0 135.6 135.6 10.0 0.0 23.3 0.0
1.2 Public Corporations 1.1 100.0 107.0 111.4 111.4 121.2 121.2 11.4 4.1 8.8 0.0
Officers 0.2 100.0 109.1 114.2 114.2 132.1 132.1 14.2 4.7 15.7 0.0
Non Officers 1.0 100.0 106.6 110.8 110.8 119.0 119.0 10.8 3.9 7.4 0.0
1.3 Bank & Financial Institutions 0.6 102.1 110.9 113.3 113.3 170.5 170.5 11.0 2.2 50.5 0.0
Officers 0.1 103.2 114.1 117.6 117.6 167.7 167.7 14.0 3.1 42.6 0.0
Non Officers 0.5 101.9 110.1 112.3 112.3 171.2 171.2 10.2 2.0 52.4 0.0
1.4 Army & Police Forces 4.0 100.0 111.4 111.4 111.4 121.8 121.8 11.4 0.0 9.3 0.0
Officers 0.2 100.0 109.9 109.9 109.9 127.5 127.5 9.9 0.0 16.0 0.0
Non Officers 3.8 100.0 111.5 111.5 111.5 121.5 121.5 11.5 0.0 9.0 0.0
1.5 Education 10.6 100.0 107.0 107.0 107.0 122.8 122.8 7.0 0.0 14.8 0.0
Officers 6.8 100.0 106.5 106.5 106.5 125.7 125.7 6.5 0.0 18.0 0.0
Non Officers 3.8 100.0 108.0 108.0 108.0 117.6 117.6 8.0 0.0 8.9 0.0
1.6 Private Institutions 7.9 100.0 101.3 101.3 101.3 99.6 99.8 1.3 0.0 -1.5 0.2
Officers 2.2 100.0 101.5 101.5 101.5 99.6 100.6 1.5 0.0 -0.9 1.0
Non Officers 5.7 100.0 101.3 101.3 101.3 99.6 99.5 1.3 0.0 -1.8 -0.1
2 Wage Rate Index 73.0 102.6 110.4 110.7 124.0 124.5 125.2 7.9 0.3 13.1 0.6
2.1 Agricultural Labor 39.5 104.6 113.7 112.7 122.5 122.5 123.0 7.7 -0.9 9.1 0.4
Male 20.5 104.4 113.2 112.0 121.2 121.2 121.7 7.3 -1.1 8.7 0.4
Female 19.0 104.8 114.2 113.5 123.8 123.8 124.5 8.3 -0.6 9.7 0.6
2.2 Industrial Labor 25.3 100.2 107.0 109.5 129.2 129.9 130.7 9.3 2.3 19.4 0.6
High Skilled 6.3 100.2 104.3 106.8 122.0 120.7 121.4 6.6 2.4 13.7 0.6
Skilled 6.3 100.2 106.4 109.2 126.8 127.2 128.0 9.0 2.6 17.2 0.6
Semi Skilled 6.3 100.2 108.2 110.4 129.2 131.5 132.3 10.2 2.0 19.8 0.6
Unskilled 6.3 100.4 109.0 111.5 139.0 140.3 141.1 11.1 2.3 26.5 0.6
2.3 Construction Labor 8.3 100.5 104.8 104.9 115.6 117.3 118.7 4.4 0.1 13.2 1.2
Mason 2.8 101.8 105.1 105.1 115.6 116.5 118.7 3.2 0.0 12.9 1.9
Skilled 1.4 101.5 106.0 106.0 114.2 114.8 117.6 4.4 0.0 10.9 2.4
Unskilled 1.4 102.1 104.1 104.1 116.9 118.2 119.8 2.0 0.0 15.1 1.4
Carpenter 2.8 100.7 103.1 103.1 112.7 113.0 114.3 2.4 0.0 10.9 1.2
Skilled 1.4 100.1 104.9 104.9 112.2 112.9 114.0 4.8 0.0 8.7 1.0
Unskilled 1.4 101.2 101.3 101.3 113.2 113.2 114.5 0.1 0.0 13.0 1.1
worker 2.8 99.1 106.2 106.5 118.4 122.4 123.0 7.5 0.3 15.5 0.5
Male 1.4 99.0 106.4 106.2 117.6 120.9 120.3 7.3 -0.2 13.3 -0.5
Female 1.4 99.2 106.0 106.9 119.2 123.8 125.7 7.8 0.8 17.6 1.5
P : Provisional

xxxvii
Table - 3
National Salary and Wage Rate Index (2004/05=100)
Mid- August 2007 (Srawan 2064)
Weight 2005/06 2006/07 2007/08P Percentage Change S.No. Groups/Sub-groups
% Jul/Aug Jun/Jul Jul/Aug May/Jun Jun/Jul Jul/Aug
1 2 3 4 5 6 7 8 5 over 3 5 over 4 8 over 5 8 over 7
Overall Index 100.0 101.9 106.2 109.3 118.0 119.3 122.8 7.3 2.9 12.4 2.9
1 Salary Index 27.0 100.0 100.4 106.4 106.6 106.6 118.6 6.4 6.0 11.5 11.3
Officers 9.8 100.1 100.3 105.7 105.8 105.8 121.2 5.6 5.4 14.7 14.6
Non Officers 17.2 100.0 100.4 106.8 107.1 107.1 117.2 6.8 6.4 9.7 9.4
1.1 Civil Service 2.8 100.0 100.0 110.0 110.0 110.0 135.8 10.0 10.0 23.5 23.5
Officers 0.3 100.0 100.0 110.0 110.0 110.0 137.3 10.0 10.0 24.8 24.8
Non Officers 2.5 100.0 100.0 110.0 110.0 110.0 135.6 10.0 10.0 23.3 23.3
1.2 Public Corporations 1.1 100.0 104.4 107.0 111.4 111.4 121.2 7.0 2.5 13.3 8.8
Officers 0.2 100.0 106.4 109.1 114.2 114.2 132.1 9.1 2.5 21.1 15.7
Non Officers 1.0 100.0 104.0 106.6 110.8 110.8 119.0 6.6 2.5 11.6 7.4
1.3 Bank & Financial Institutions 0.6 101.5 110.0 110.9 113.3 113.3 170.5 9.3 0.8 53.7 50.5
Officers 0.1 102.5 112.6 114.1 117.6 117.6 167.7 11.3 1.3 47.0 42.6
Non Officers 0.5 101.3 109.4 110.1 112.3 112.3 171.2 8.7 0.6 55.5 52.4
1.4 Army & Police Forces 4.0 100.0 100.0 111.4 111.4 111.4 121.8 11.4 11.4 9.3 9.3
Officers 0.2 100.0 100.0 109.9 109.9 109.9 127.5 9.9 9.9 16.0 16.0
Non Officers 3.8 100.0 100.0 111.5 111.5 111.5 121.5 11.5 11.5 9.0 9.0
1.5 Education 10.6 100.0 100.0 107.0 107.0 107.0 122.8 7.0 7.0 14.8 14.8
Officers 6.8 100.0 100.0 106.5 106.5 106.5 125.7 6.5 6.5 18.0 18.0
Non Officers 3.8 100.0 100.0 108.0 108.0 108.0 117.6 8.0 8.0 8.9 8.9
1.6 Private Institutions 7.9 100.0 100.0 101.3 101.3 101.3 101.3 1.3 1.3 0.0 0.0
Officers 2.2 100.0 100.0 101.5 101.5 101.5 101.5 1.5 1.5 0.0 0.0
Non Officers 5.7 100.0 100.0 101.3 101.3 101.3 101.3 1.3 1.3 0.0 0.0
2 Wage Rate Index 73.0 102.5 108.4 110.4 122.3 124.0 124.4 7.7 1.8 12.7 0.3
2.1 Agricultural Labor 39.5 104.5 110.0 113.7 119.3 122.5 122.5 8.8 3.4 7.7 0.0
Male 20.5 104.2 109.1 113.2 118.0 121.2 121.2 8.6 3.8 7.1 0.0
Female 19.0 104.8 110.9 114.2 120.6 123.8 123.8 9.0 3.0 8.4 0.0
2.2 Industrial Labor 25.3 100.0 107.0 107.0 129.2 129.2 129.6 7.0 0.0 21.1 0.3
High Skilled 6.3 100.0 104.3 104.3 122.0 122.0 120.5 4.3 0.0 15.5 -1.2
Skilled 6.3 100.0 106.4 106.4 126.8 126.8 127.0 6.4 0.0 19.4 0.2
Semi Skilled 6.3 100.0 108.2 108.2 129.2 129.2 131.1 8.2 0.0 21.2 1.5
Unskilled 6.3 100.1 109.0 109.0 139.0 139.0 140.0 8.9 0.0 28.4 0.7
2.3 Construction Labor 8.3 100.7 104.8 104.8 115.2 115.6 117.3 4.1 0.0 11.9 1.5
Mason 2.8 101.8 105.1 105.1 115.2 115.6 116.5 3.2 0.0 10.8 0.8
Skilled 1.4 101.5 106.0 106.0 113.5 114.2 114.8 4.4 0.0 8.3 0.5
Unskilled 1.4 102.1 104.1 104.1 116.9 116.9 118.2 2.0 0.0 13.5 1.1
Carpenter 2.8 100.3 103.1 103.1 112.7 112.7 113.0 2.8 0.0 9.6 0.3
Skilled 1.4 100.1 104.9 104.9 112.2 112.2 112.9 4.8 0.0 7.6 0.6
Unskilled 1.4 100.5 101.3 101.3 113.2 113.2 113.2 0.8 0.0 11.7 0.0
worker 2.8 100.0 106.2 106.2 117.6 118.4 122.4 6.2 0.0 15.3 3.4
Male 1.4 100.0 106.4 106.4 116.8 117.6 120.9 6.4 0.0 13.6 2.8
Female 1.4 100.0 106.0 106.0 118.4 119.2 123.8 6.0 0.0 16.8 3.9
P : Provisional

xxxviii
Table 4
Average Retail Prices of Selected Commodities in Border Market Mid-October 2007
(Prices in NRs)
Nepal* India**
Mid-Oct 06 Jun/Jul Mid-Oct 07 Mid-Oct 06 Mid-Sep 07 Mid-Oct 07 Percetage Change
S.NO. Description Unit
1 2 3 4 5 6 3 Over 2 6 Over 5 3 Over 6
Food grains
1 Paddy Coarse Qtl. 1132.75 1427.09 1308.34 1027.33 1301.34 1204.00 -8.3 -7.5 8.7
2 Paddy Fine (Basmati ) Qtl. 2225.00 2112.50 2150.00 2084.00 2533.33 2533.33 1.8 0.0 -15.1
3 Maize Qtl. 1121.25 1297.92 1243.75 1029.33 1272.00 1186.67 -4.2 -6.7 4.8
4 Rice Fine ( Basmati ) Kg. 42.09 44.38 44.50 38.00 43.54 42.94 0.3 -1.4 3.7
5 Rice ( Mansuli ) Kg. 24.09 27.00 27.25 20.47 23.60 23.73 0.9 0.6 14.8
6 Rice Coarse Kg. 18.92 22.42 22.67 16.13 20.40 20.00 1.1 -2.0 13.3
7 Beaten Rice Kg. 24.17 26.75 26.83 22.27 25.60 23.87 0.3 -6.8 12.4
8 Wheat Flour ( Atta ) Kg. 22.00 25.25 25.50 19.87 20.67 20.87 1.0 1.0 22.2
9 Wheat Flour ( Maida ) Kg. 25.50 27.17 27.17 22.14 23.60 23.87 0.0 1.1 13.8
Pulses
10 Black Gram Kg. 77.75 74.50 77.42 81.33 73.07 68.80 3.9 -5.8 12.5
11 Arahar Kg. 56.25 70.08 69.67 51.87 63.87 63.73 -0.6 -0.2 9.3
12 Mung Kg. 85.75 84.58 81.84 75.33 72.54 69.74 -3.2 -3.9 17.4
13 Musuro Kg. 47.17 58.75 60.08 42.13 61.33 57.87 2.3 -5.7 3.8
14 Moog (Broken ) Kg. 83.75 84.75 79.75 64.27 72.53 68.67 -5.9 -5.3 16.1
15 Chick Pea Kg. 61.83 57.58 56.25 56.27 49.20 48.00 -2.3 -2.4 17.2
Vegetables Kg.
16 Red Potato Kg. 23.00 24.67 22.50 17.20 16.00 16.53 -8.8 3.3 36.1
17 White Potato Kg. 22.17 22.75 19.75 14.80 15.20 16.00 -13.2 5.3 23.4
18 Dry Onion Kg. 17.58 40.00 44.25 13.07 31.87 37.60 10.6 18.0 17.7
19 Tomato Kg. 43.08 31.17 37.75 37.33 27.87 32.27 21.1 15.8 17.0
20 Cabbage Kg. 16.34 24.00 22.08 23.73 30.40 30.00 -8.0 -1.3 -26.4
21 Cauli Flower Kg. 46.67 57.92 44.58 41.07 52.27 57.60 -23.0 10.2 -22.6
Fruits
22 Banana ( Harichhal ) Doz. 20.67 21.17 19.42 20.27 20.74 18.00 -8.3 -13.2 7.9
23 Apple (Chocolate ) Kg. 69.17 65.42 70.00 70.67 53.34 56.27 7.0 5.5 24.4
24 Orange Kg. 50.00 0.00 26.00 0.00 0.00 51.20 0.0 0.0 0.0
25 Sweet Orange Kg. 35.17 39.17 43.75 32.27 36.00 35.20 11.7 -2.2 24.3
Spices
26 Salt Kg. 10.00 11.00 11.00 13.40 14.40 14.00 0.0 -2.8 -21.4
27 Turmeric 250g 22.92 22.09 22.09 23.73 24.07 23.53 0.0 -2.2 -6.2
28 Garlic 250g 22.00 18.67 18.33 22.87 18.53 19.07 -1.8 2.9 -3.8
29 Ginger 250g 10.34 10.50 11.09 10.67 12.93 13.60 5.5 5.2 -18.5
30 Cuminseed Kg. 174.00 253.34 250.84 196.67 252.00 250.00 -1.0 -0.8 0.3
31 Dry Chilli 250g 35.25 28.84 31.34 32.80 27.73 26.93 8.7 -2.9 16.3
32 Coriander 250g 18.50 19.50 21.75 17.07 19.34 18.67 11.5 -3.5 16.5
Milk & Milk Products
33 Dairy Milk Lit. 25.50 27.58 27.25 26.40 28.27 28.13 -1.2 -0.5 -3.1
34 Lactogen Refill Pack No.2 500g 227.50 245.34 246.59 212.80 229.20 231.07 0.5 0.8 6.7
35 Horlicks 500g 168.75 183.50 183.50 178.00 185.48 181.08 0.0 -2.4 1.3
Meat & Fish
36 Mutton Kg. 228.33 241.67 242.50 208.67 229.33 216.00 0.3 -5.8 12.3
37 Chicken Kg. 131.67 137.50 152.50 107.33 158.67 161.33 10.9 1.7 -5.5
38 Fish (Rahu) Kg. 102.09 115.84 114.58 102.00 107.47 103.47 -1.1 -3.7 10.7
39 Egg Piece 4.46 4.88 4.92 2.40 3.47 3.39 0.9 -2.3 45.2
Oil & Ghee
40 Mustard Oil Lit. 94.58 108.67 107.83 87.60 102.53 98.80 -0.8 -3.6 9.1
41 Vegetable Ghee Lit. 60.33 76.00 76.92 80.67 84.93 86.67 1.2 2.0 -11.2
42 Soya bean Oil Lit. 69.67 82.25 84.50 78.00 90.67 93.47 2.7 3.1 -9.6
43 Sunflower Oil Lit. 92.75 99.44 99.44 109.69 117.33 120.80 0.0 3.0 -17.7
Soap
44 Laundry Soap Piece 9.00 10.30 10.30 8.80 9.20 9.20 0.0 0.0 12.0
45 Bath Soap (Lux) Piece 17.00 17.00 17.00 20.80 22.80 22.40 0.0 -1.8 -24.1
Chemical Fertilizers
46 Urea 50Kg. 980.42 1204.92 1204.92 404.93 412.73 397.00 0.0 -3.8 203.5
47 D.A.P. 50Kg. 1340.00 1296.25 1296.25 782.00 799.20 774.67 0.0 -3.1 67.3
48 Potas 50Kg. 699.44 717.22 717.22 363.87 379.60 376.27 0.0 -0.9 90.6
Construction Materials
49 Cement (Indian) 50Kg. 429.44 491.25 480.42 327.33 361.87 366.53 -2.2 1.3 31.1
50 Iron Rods (10 mm.) Kg. 47.28 53.85 54.66 40.01 47.59 47.79 1.5 0.4 14.4
51 Corrugated Sheet (26 Gage) Bundle 4895.83 5732.50 5761.67 5560.00 5785.47 5869.47 0.5 1.5 -1.8
52 Bricks (Big Size) Thou. 3779.17 4700.00 4716.67 3440.00 4106.67 4146.67 0.4 1.0 13.7
53 Timber 3''x4''x12' (Sal Tree) Cft. 1122.92 1118.75 1122.92 1273.33 1388.67 1386.00 0.4 -0.2 -19.0
Wages
54 Mason Day 224.17 237.08 252.08 242.67 249.34 249.34 6.3 0.0 1.1
55 Carpenter Day 217.92 230.83 247.92 228.00 236.67 236.67 7.4 0.0 4.8
56 Labour (Male) Day 122.08 129.17 131.67 138.00 150.93 154.13 1.9 2.1 -14.6
57 Labour (Female) Day 115.83 126.25 127.08 132.00 144.93 148.13 0.7 2.2 -14.2
Petroleum Products
58 Kerosene (Open) Lit. 47.63 47.25 47.25 44.91 43.87 43.87 0.0 0.0 7.7
59 Kerosene (Quota) Lit. 0.00 0.00 0.00 17.90 17.63 17.63 0.0 0.0 0.0
60 Diesel Lit. 52.39 52.39 52.39 56.90 53.67 53.43 0.0 -0.5 -1.9
61 Petrol Lit. 67.24 67.24 67.24 81.02 74.39 74.19 0.0 -0.3 -9.4
62 L.P. Gas Cylinder 900.00 900.00 900.00 484.72 479.78 478.88 0.0 -0.2 87.9
Other
63 Sugar Kg. 36.75 29.25 29.25 32.07 24.60 25.80 0.0 4.9 13.4
64 Tea (Red Label) 250g 85.50 85.50 85.50 74.33 78.00 76.50 0.0 -1.9 11.8
Service Sector
65 Electricity Tariff 30 Ampiar 664.00 664.00 664.00 155.20 194.40 194.40 0.0 0.0 241.6
66 Telephone Tariff Minimum 248.60 248.60 248.60 310.64 311.60 311.60 0.0 0.0 -20.2
67 Drinking Water Tariff Minimum 50.00 50.00 50.00 80.00 88.00 88.00 0.0 0.0 -43.2
68 Postal Stamp (Registry) Minimum 10.00 10.00 10.00 35.20 35.20 35.20 0.0 0.0 -71.6
69 Doctor Fee (Specialist) Per Patient 210.42 210.42 210.42 208.00 208.00 208.00 0.0 0.0 1.2
70 Chest X-Ray Per X-Ray 126.25 136.25 136.25 150.67 149.33 149.33 0.0 0.0 -8.8
* Average Prices of Biratnagar, Birganj,Sidhdharthanagar and Nepalganj., ** Average Prices of Purnia, Mujjaffurpur, Gorakhpur and Baharaich.

xxxix
Table 4
Average Retail Prices of Selected Commodities in Border Market Mid-September 2007
(Prices in NRs) Nepal* India**
Mid-Sep
06 Jun/Jul
Mid-Sep
07
Mid-Sep
06 Mid-Aug 07
Mid-Sep
07
Percentage Change S.NO. Description Unit
1 2 3 4 5 6 3 Over 2 6 Over 5 3 Over 6
Food grains
1 Paddy Coarse Qtl. 1133.75 1395.83 1427.09 1037.33 1292.00 1301.34 2.2 0.7 9.7
2 Paddy Fine (Basmati ) Qtl. 2225.00 2112.50 2112.50 2084.00 2533.33 2533.33 0.0 0.0 -16.6
3 Maize Qtl. 1173.33 1289.58 1297.92 1030.67 1253.33 1272.00 0.6 1.5 2.0
4 Rice Fine ( Basmati ) Kg. 41.17 43.71 44.38 39.20 41.14 43.54 1.5 5.8 1.9
5 Rice ( Mansuli ) Kg. 24.34 25.75 27.00 19.93 21.80 23.60 4.9 8.3 14.4
6 Rice Coarse Kg. 18.84 21.50 22.42 16.60 19.47 20.40 4.3 4.8 9.9
7 Beaten Rice Kg. 23.58 25.50 26.75 20.53 24.53 25.60 4.9 4.4 4.5
8 Wheat Flour ( Atta ) Kg. 21.59 23.17 25.25 19.00 20.53 20.67 9.0 0.6 22.2
9 Wheat Flour ( Maida ) Kg. 24.58 27.00 27.17 21.07 23.07 23.60 0.6 2.3 15.1
Pulses
10 Black Gram Kg. 75.33 73.50 74.50 76.14 72.00 73.07 1.4 1.5 2.0
11 Arahar Kg. 55.33 70.08 70.08 50.53 63.47 63.87 0.0 0.6 9.7
12 Mung Kg. 89.50 85.08 84.58 75.33 71.47 72.54 -0.6 1.5 16.6
13 Musuro Kg. 47.17 57.92 58.75 40.80 59.87 61.33 1.4 2.5 -4.2
14 Moog (Broken ) Kg. 84.50 86.00 84.75 63.73 72.00 72.53 -1.5 0.7 16.8
15 Chick Pea Kg. 58.08 58.83 57.58 50.67 46.53 49.20 -2.1 5.7 17.0
Vegetables Kg.
16 Red Potato Kg. 19.50 22.92 24.67 15.20 16.40 16.00 7.6 -2.4 54.2
17 White Potato Kg. 18.17 21.83 22.75 13.87 15.60 15.20 4.2 -2.6 49.7
18 Dry Onion Kg. 16.42 28.33 40.00 14.27 23.80 31.87 41.2 33.9 25.5
19 Tomato Kg. 36.67 46.50 31.17 38.13 41.07 27.87 -33.0 -32.1 11.8
20 Cabbage Kg. 16.17 23.67 24.00 26.40 31.07 30.40 1.4 -2.1 -21.1
21 Cauli Flower Kg. 51.08 45.92 57.92 66.80 61.33 52.27 26.1 -14.8 10.8
Fruits
22 Banana ( Harichhal ) Doz. 22.50 21.67 21.17 18.00 22.34 20.74 -2.3 -7.2 2.1
23 Apple (Chocolate ) Kg. 72.50 80.00 65.42 64.67 75.56 53.34 -18.2 -29.4 22.6
24 Orange Kg. 0.00 0.00 0.00 0.00 0.00 0.00 0.0 0.0 0.0
25 Sweet Orange Kg. 35.17 41.67 39.17 30.80 35.73 36.00 -6.0 0.7 8.8
Spices
26 Salt Kg. 10.00 11.00 11.00 13.40 14.00 14.40 0.0 2.9 -23.6
27 Turmeric 250g 22.75 22.42 22.09 23.13 24.07 24.07 -1.5 0.0 -8.2
28 Garlic 250g 19.67 18.50 18.67 20.47 16.93 18.53 0.9 9.4 0.7
29 Ginger 250g 9.00 10.25 10.50 10.67 12.53 12.93 2.5 3.2 -18.8
30 Cuminseed Kg. 169.17 253.34 253.34 178.00 256.00 252.00 0.0 -1.6 0.5
31 Dry Chilli 250g 34.50 29.17 28.84 27.60 25.87 27.73 -1.1 7.2 4.0
32 Coriander 250g 18.50 17.92 19.50 16.47 18.67 19.34 8.8 3.6 0.9
Milk & Milk Products
33 Dairy Milk Lit. 25.50 27.42 27.58 25.60 28.13 28.27 0.6 0.5 -2.4
34 Lactogen Refill Pack No.2 500g 227.50 240.34 245.34 213.60 229.20 229.20 2.1 0.0 7.0
35 Horlicks 500g 168.75 179.00 183.50 178.80 185.56 185.48 2.5 0.0 -1.1
Meat & Fish
36 Mutton Kg. 228.33 237.50 241.67 206.67 224.00 229.33 1.8 2.4 5.4
37 Chicken Kg. 125.00 140.00 137.50 107.33 156.67 158.67 -1.8 1.3 -13.3
38 Fish (Rahu) Kg. 105.42 118.75 115.84 98.67 110.67 107.47 -2.5 -2.9 7.8
39 Egg Piece 4.25 4.75 4.88 2.35 3.47 3.47 2.6 0.0 40.6
Oil & Ghee
40 Mustard Oil Lit. 94.58 106.42 108.67 86.40 100.53 102.53 2.1 2.0 6.0
41 Vegetable Ghee Lit. 60.83 74.67 76.00 76.80 84.93 84.93 1.8 0.0 -10.5
42 Soyabean Oil Lit. 70.92 81.25 82.25 76.80 90.67 90.67 1.2 0.0 -9.3
43 Sunflower Oil Lit. 92.58 95.89 99.44 109.69 117.33 117.33 3.7 0.0 -15.2
Soap
44 Lundry Soap Piece 9.00 10.30 10.30 8.60 9.20 9.20 0.0 0.0 12.0
45 Bath Soap (Lux) Piece 17.00 17.00 17.00 20.80 22.67 22.80 0.0 0.6 -25.4
Chemical Fertilizers
46 Urea 50Kg. 977.92 1022.75 1204.92 402.80 401.00 412.73 17.8 2.9 191.9
47 D.A.P. 50Kg. 1298.75 1331.25 1296.25 766.00 769.60 799.20 -2.6 3.8 62.2
48 Potas 50Kg. 683.33 735.83 717.22 352.80 372.27 379.60 -2.5 2.0 88.9
Construction Materials
49 Cement (Indian) 50Kg. 410.56 496.67 491.25 312.80 372.53 361.87 -1.1 -2.9 35.8
50 Iron Rods (10 mm.) Kg. 47.47 53.62 53.85 39.08 47.56 47.59 0.4 0.1 13.1
51 Corrugated Sheet (26 Gage) Bundle 4845.83 5715.83 5732.50 5456.00 5934.80 5785.47 0.3 -2.5 -0.9
52 Bricks (Big Size) Thou. 3741.67 4708.34 4700.00 3440.00 4073.34 4106.67 -0.2 0.8 14.4
53 Timber 3''x4''x12' (Sal Tree) Cft. 1122.92 1122.92 1118.75 1260.00 1390.00 1388.67 -0.4 -0.1 -19.4
Wages
54 Mason Day 224.17 237.92 237.08 242.67 249.34 249.34 -0.4 0.0 -4.9
55 Carpenter Day 217.92 231.67 230.83 228.00 236.67 236.67 -0.4 0.0 -2.5
56 Labourer (Male) Day 122.08 130.42 129.17 138.00 148.00 150.93 -1.0 2.0 -14.4
57 Labourer (Female) Day 115.83 124.17 126.25 132.00 142.00 144.93 1.7 2.1 -12.9
Petroleium Products
58 Kerosene (Open) Lit. 47.58 47.25 47.25 44.91 43.87 43.87 0.0 0.0 7.7
59 Kerosene (Quota) Lit. 0.00 0.00 0.00 17.90 17.63 17.63 0.0 0.0 0.0
60 Diesel Lit. 52.39 52.39 52.39 56.94 53.45 53.67 0.0 0.4 -2.4
61 Petrol Lit. 67.24 67.24 67.24 81.06 74.23 74.39 0.0 0.2 -9.6
62 L.P. Gas Cylinder 900.00 900.00 900.00 484.72 479.78 479.78 0.0 0.0 87.6
Other
63 Sugar Kg. 36.05 29.50 29.25 32.60 25.20 24.60 -0.8 -2.4 18.9
64 Tea (Red Label) 250g 85.50 88.00 85.50 73.93 78.80 78.00 -2.8 -1.0 9.6
Service Sector
65 Electricity Tariff 30 Ampiar 664.00 664.00 664.00 155.20 184.00 194.40 0.0 5.7 241.6
66 Telephone Tariff Minimum 248.60 248.60 248.60 310.64 311.60 311.60 0.0 0.0 -20.2
67 Drinking Water Tariff Minimum 50.00 50.00 50.00 80.00 88.00 88.00 0.0 0.0 -43.2
68 Postal Stamp (Registry) Minimum 10.00 10.00 10.00 35.20 35.20 35.20 0.0 0.0 -71.6
69 Doctor Fee (Specialist) Per Patient 210.42 210.42 210.42 208.00 208.00 208.00 0.0 0.0 1.2
70 Chest X-Ray Per X-Ray 126.25 136.25 136.25 150.67 149.33 149.33 0.0 0.0 -8.8
* Average Prices of Biratnagar, Birganj,Sidhdharthanagar and Nepalganj., ** Average Prices of Purnia, Mujjaffurpur, Gorakhpur and Baharaich.
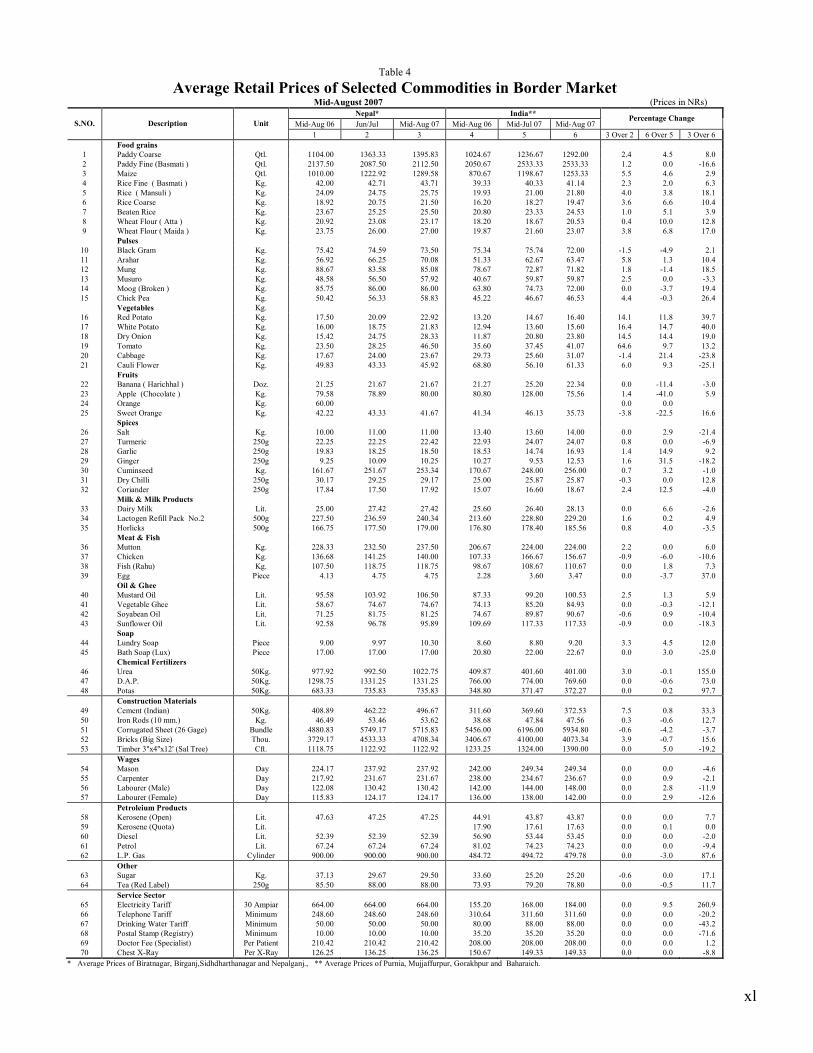
xl
Table 4
Average Retail Prices of Selected Commodities in Border Market Mid-August 2007 (Prices in NRs)
Nepal* India**
Mid-Aug 06 Jun/Jul Mid-Aug 07 Mid-Aug 06 Mid-Jul 07 Mid-Aug 07 Percentage Change
S.NO. Description Unit
1 2 3 4 5 6 3 Over 2 6 Over 5 3 Over 6
Food grains
1 Paddy Coarse Qtl. 1104.00 1363.33 1395.83 1024.67 1236.67 1292.00 2.4 4.5 8.0
2 Paddy Fine (Basmati ) Qtl. 2137.50 2087.50 2112.50 2050.67 2533.33 2533.33 1.2 0.0 -16.6
3 Maize Qtl. 1010.00 1222.92 1289.58 870.67 1198.67 1253.33 5.5 4.6 2.9
4 Rice Fine ( Basmati ) Kg. 42.00 42.71 43.71 39.33 40.33 41.14 2.3 2.0 6.3
5 Rice ( Mansuli ) Kg. 24.09 24.75 25.75 19.93 21.00 21.80 4.0 3.8 18.1
6 Rice Coarse Kg. 18.92 20.75 21.50 16.20 18.27 19.47 3.6 6.6 10.4
7 Beaten Rice Kg. 23.67 25.25 25.50 20.80 23.33 24.53 1.0 5.1 3.9
8 Wheat Flour ( Atta ) Kg. 20.92 23.08 23.17 18.20 18.67 20.53 0.4 10.0 12.8
9 Wheat Flour ( Maida ) Kg. 23.75 26.00 27.00 19.87 21.60 23.07 3.8 6.8 17.0
Pulses
10 Black Gram Kg. 75.42 74.59 73.50 75.34 75.74 72.00 -1.5 -4.9 2.1
11 Arahar Kg. 56.92 66.25 70.08 51.33 62.67 63.47 5.8 1.3 10.4
12 Mung Kg. 88.67 83.58 85.08 78.67 72.87 71.82 1.8 -1.4 18.5
13 Musuro Kg. 48.58 56.50 57.92 40.67 59.87 59.87 2.5 0.0 -3.3
14 Moog (Broken ) Kg. 85.75 86.00 86.00 63.80 74.73 72.00 0.0 -3.7 19.4
15 Chick Pea Kg. 50.42 56.33 58.83 45.22 46.67 46.53 4.4 -0.3 26.4
Vegetables Kg.
16 Red Potato Kg. 17.50 20.09 22.92 13.20 14.67 16.40 14.1 11.8 39.7
17 White Potato Kg. 16.00 18.75 21.83 12.94 13.60 15.60 16.4 14.7 40.0
18 Dry Onion Kg. 15.42 24.75 28.33 11.87 20.80 23.80 14.5 14.4 19.0
19 Tomato Kg. 23.50 28.25 46.50 35.60 37.45 41.07 64.6 9.7 13.2
20 Cabbage Kg. 17.67 24.00 23.67 29.73 25.60 31.07 -1.4 21.4 -23.8
21 Cauli Flower Kg. 49.83 43.33 45.92 68.80 56.10 61.33 6.0 9.3 -25.1
Fruits
22 Banana ( Harichhal ) Doz. 21.25 21.67 21.67 21.27 25.20 22.34 0.0 -11.4 -3.0
23 Apple (Chocolate ) Kg. 79.58 78.89 80.00 80.80 128.00 75.56 1.4 -41.0 5.9
24 Orange Kg. 60.00 0.0 0.0
25 Sweet Orange Kg. 42.22 43.33 41.67 41.34 46.13 35.73 -3.8 -22.5 16.6
Spices
26 Salt Kg. 10.00 11.00 11.00 13.40 13.60 14.00 0.0 2.9 -21.4
27 Turmeric 250g 22.25 22.25 22.42 22.93 24.07 24.07 0.8 0.0 -6.9
28 Garlic 250g 19.83 18.25 18.50 18.53 14.74 16.93 1.4 14.9 9.2
29 Ginger 250g 9.25 10.09 10.25 10.27 9.53 12.53 1.6 31.5 -18.2
30 Cuminseed Kg. 161.67 251.67 253.34 170.67 248.00 256.00 0.7 3.2 -1.0
31 Dry Chilli 250g 30.17 29.25 29.17 25.00 25.87 25.87 -0.3 0.0 12.8
32 Coriander 250g 17.84 17.50 17.92 15.07 16.60 18.67 2.4 12.5 -4.0
Milk & Milk Products
33 Dairy Milk Lit. 25.00 27.42 27.42 25.60 26.40 28.13 0.0 6.6 -2.6
34 Lactogen Refill Pack No.2 500g 227.50 236.59 240.34 213.60 228.80 229.20 1.6 0.2 4.9
35 Horlicks 500g 166.75 177.50 179.00 176.80 178.40 185.56 0.8 4.0 -3.5
Meat & Fish
36 Mutton Kg. 228.33 232.50 237.50 206.67 224.00 224.00 2.2 0.0 6.0
37 Chicken Kg. 136.68 141.25 140.00 107.33 166.67 156.67 -0.9 -6.0 -10.6
38 Fish (Rahu) Kg. 107.50 118.75 118.75 98.67 108.67 110.67 0.0 1.8 7.3
39 Egg Piece 4.13 4.75 4.75 2.28 3.60 3.47 0.0 -3.7 37.0
Oil & Ghee
40 Mustard Oil Lit. 95.58 103.92 106.50 87.33 99.20 100.53 2.5 1.3 5.9
41 Vegetable Ghee Lit. 58.67 74.67 74.67 74.13 85.20 84.93 0.0 -0.3 -12.1
42 Soyabean Oil Lit. 71.25 81.75 81.25 74.67 89.87 90.67 -0.6 0.9 -10.4
43 Sunflower Oil Lit. 92.58 96.78 95.89 109.69 117.33 117.33 -0.9 0.0 -18.3
Soap
44 Lundry Soap Piece 9.00 9.97 10.30 8.60 8.80 9.20 3.3 4.5 12.0
45 Bath Soap (Lux) Piece 17.00 17.00 17.00 20.80 22.00 22.67 0.0 3.0 -25.0
Chemical Fertilizers
46 Urea 50Kg. 977.92 992.50 1022.75 409.87 401.60 401.00 3.0 -0.1 155.0
47 D.A.P. 50Kg. 1298.75 1331.25 1331.25 766.00 774.00 769.60 0.0 -0.6 73.0
48 Potas 50Kg. 683.33 735.83 735.83 348.80 371.47 372.27 0.0 0.2 97.7
Construction Materials
49 Cement (Indian) 50Kg. 408.89 462.22 496.67 311.60 369.60 372.53 7.5 0.8 33.3
50 Iron Rods (10 mm.) Kg. 46.49 53.46 53.62 38.68 47.84 47.56 0.3 -0.6 12.7
51 Corrugated Sheet (26 Gage) Bundle 4880.83 5749.17 5715.83 5456.00 6196.00 5934.80 -0.6 -4.2 -3.7
52 Bricks (Big Size) Thou. 3729.17 4533.33 4708.34 3406.67 4100.00 4073.34 3.9 -0.7 15.6
53 Timber 3''x4''x12' (Sal Tree) Cft. 1118.75 1122.92 1122.92 1233.25 1324.00 1390.00 0.0 5.0 -19.2
Wages
54 Mason Day 224.17 237.92 237.92 242.00 249.34 249.34 0.0 0.0 -4.6
55 Carpenter Day 217.92 231.67 231.67 238.00 234.67 236.67 0.0 0.9 -2.1
56 Labourer (Male) Day 122.08 130.42 130.42 142.00 144.00 148.00 0.0 2.8 -11.9
57 Labourer (Female) Day 115.83 124.17 124.17 136.00 138.00 142.00 0.0 2.9 -12.6
Petroleium Products
58 Kerosene (Open) Lit. 47.63 47.25 47.25 44.91 43.87 43.87 0.0 0.0 7.7
59 Kerosene (Quota) Lit. 17.90 17.61 17.63 0.0 0.1 0.0
60 Diesel Lit. 52.39 52.39 52.39 56.90 53.44 53.45 0.0 0.0 -2.0
61 Petrol Lit. 67.24 67.24 67.24 81.02 74.23 74.23 0.0 0.0 -9.4
62 L.P. Gas Cylinder 900.00 900.00 900.00 484.72 494.72 479.78 0.0 -3.0 87.6
Other
63 Sugar Kg. 37.13 29.67 29.50 33.60 25.20 25.20 -0.6 0.0 17.1
64 Tea (Red Label) 250g 85.50 88.00 88.00 73.93 79.20 78.80 0.0 -0.5 11.7
Service Sector
65 Electricity Tariff 30 Ampiar 664.00 664.00 664.00 155.20 168.00 184.00 0.0 9.5 260.9
66 Telephone Tariff Minimum 248.60 248.60 248.60 310.64 311.60 311.60 0.0 0.0 -20.2
67 Drinking Water Tariff Minimum 50.00 50.00 50.00 80.00 88.00 88.00 0.0 0.0 -43.2
68 Postal Stamp (Registry) Minimum 10.00 10.00 10.00 35.20 35.20 35.20 0.0 0.0 -71.6
69 Doctor Fee (Specialist) Per Patient 210.42 210.42 210.42 208.00 208.00 208.00 0.0 0.0 1.2
70 Chest X-Ray Per X-Ray 126.25 136.25 136.25 150.67 149.33 149.33 0.0 0.0 -8.8
* Average Prices of Biratnagar, Birganj,Sidhdharthanagar and Nepalganj., ** Average Prices of Purnia, Mujjaffurpur, Gorakhpur and Baharaich.

xli
Table -5.1
Weekly Average Retail Prices of Some Essential Commodities Kathmandu
Mid - October 2007 (Prices in Rupees)
Sept.24 Jun/Jul Oct.09 Oct.17 Percentage Change
S. No. Name Unit Ashwin 7 Ashwin 15 Ashwin 22 Ashwin 30 Column 3 Column 4
1 2 3 4 Over 2 Over 3
Food grains
1 Rice Fine(Pokhreli) Kg. 40.00 40.67 41.33 41.33 1.6 0.0
2 Rice Mansuli(Terai ) Kg. 27.00 28.67 28.67 28.67 0.0 0.0
3 Rice Mansuli (Trishuli ) Kg. 32.00 33.33 33.33 33.33 0.0 0.0
4 Beaten Rice (Tikan) Kg. 55.00 55.00 55.00 53.33 0.0 -3.0
5 Wheat Flour (Atta) Kg. 25.00 25.00 25.00 25.00 0.0 0.0
6 Bread Pound 18.00 18.00 18.00 18.00 0.0 0.0
Pulses
7 Black Gram Kg. 83.67 81.67 81.67 78.33 0.0 -4.1
8 Mung Kg. 86.00 83.33 83.33 81.67 0.0 -2.0
9 Musuro Kg. 70.00 70.00 70.00 70.00 0.0 0.0
10 Chick Pea Kg. 75.00 78.33 78.33 78.33 0.0 0.0
Vegetables
11 Cabbage Kg. 25.00 28.33 28.67 29.33 1.2 2.3
12 Tomato Kg. 38.33 41.67 35.00 36.67 -16.0 4.8
13 Beans Green Kg. 35.00 40.00 38.33 26.67 -4.2 -30.4
14 Red Potato Kg. 33.00 33.33 35.00 35.00 5.0 0.0
15 White Potato Kg. 28.67 28.67 28.67 28.67 0.0 0.0
16 Dried Onion Kg. 40.00 43.33 50.00 51.67 15.4 3.3
Fruits
17 Apple Kg. 66.67 66.67 68.33 68.33 2.5 0.0
18 Banana (Harichhal) Doz. 30.00 30.00 30.00 36.67 0.0 22.2
Spices
19 Salt Kg. 11.00 11.00 11.00 11.00 0.0 0.0
20 Cuminseed 200g. 50.00 49.33 49.33 49.33 0.0 0.0
21 Turmeric 200g. 18.67 23.00 21.33 21.33 -7.3 0.0
22 Garlic 200g. 12.33 12.33 12.33 12.33 0.0 0.0
Milk & Milk Products
23 Dairy Milk 500 ml. 14.00 14.00 14.00 14.00 0.0 0.0
24 Lactogen 500g 263.33 263.33 263.33 263.33 0.0 0.0
Oil and Ghee
25 Mustard Oil Lit. 111.67 111.67 113.33 113.33 1.5 0.0
26 Soybean Oil Lit. 83.33 83.33 83.33 84.33 0.0 1.2
27 Vegetable Ghee Lit. 80.00 80.00 80.00 80.00 0.0 0.0
Meat & Fish
28 Mutton Kg. 320.00 320.00 320.00 320.00 0.0 0.0
29 Fish( Rahu ) Kg. 140.00 140.00 140.00 140.00 0.0 0.0
Soap
30 Bath Soap 100g. 17.00 17.00 17.00 17.00 0.0 0.0
31 Laundry Soap 200g. 11.11 11.11 11.11 11.11 0.0 0.0
Construction Materials
32 Cement (Nepali -Everest ) 50Kg. 530.00 530.00 530.00 530.00 0.0 0.0
33 Cement ( Indian - Buland ) 50Kg. 550.00 550.00 550.00 550.00 0.0 0.0
34 Iron Rods ( Himal ) Kg. 56.78 56.78 56.78 56.78 0.0 0.0
35 Corrugated Sheets ( Hulas ) Bundle 5596.00 5596.00 5596.00 5596.00 0.0 0.0
36 Bricks (Big Size) Thou. 3700.00 3700.00 3700.00 3700.00 0.0 0.0
37 Timber 3"x4"x12'(Sal Tree ) C.F. 1300.00 1300.00 1300.00 1300.00 0.0 0.0
Others
38 Sugar Kg. 33.00 32.00 32.00 32.00 0.0 0.0
39 Tea 200g. 40.00 40.00 40.00 38.67 0.0 -3.3
40 Kerosene ( Open market ) Lit. 48.00 48.00 48.00 48.00 0.0 0.0

xlii
Table -5.1
Weekly Average Retail Prices of Some Essential Commodities Kathmandu
Mid - September 2007 (Prices in Rupees)
August24 Jun/Jul Sept 09 Sept.17 Percentage Change
S. No. Name Unit Bhadra 7 Bhadra16 Bhadra 23 Bhadra 31 Column 3 Column 4
1 2 3 4 Over 2 Over 3
Food grains
1 Rice Fine(Pokhreli) Kg. 40.00 40.00 40.00 40.00 0.0 0.0
2 Rice Mansuli(Terai ) Kg. 27.33 27.33 27.33 27.67 0.0 1.2
3 Rice Mansuli (Trishuli ) Kg. 30.00 30.67 30.67 32.00 0.0 4.3
4 Beaten Rice (Tikan) Kg. 54.00 54.00 54.00 54.00 0.0 0.0
5 Wheat Flour (Atta) Kg. 25.00 25.00 25.00 25.00 0.0 0.0
6 Bread Pound 18.00 18.00 18.00 18.00 0.0 0.0
Pulses
7 Black Gram Kg. 88.33 88.33 88.33 86.67 0.0 -1.9
8 Mung Kg. 88.33 88.33 88.33 88.33 0.0 0.0
9 Musuro Kg. 70.00 70.00 70.00 70.00 0.0 0.0
10 Chick Pea Kg. 78.33 78.33 78.33 76.67 0.0 -2.1
Vegetables
11 Cabbage Kg. 24.33 24.33 21.33 25.00 -12.3 17.2
12 Tomato Kg. 45.00 35.00 41.67 36.67 19.1 -12.0
13 Beans Green Kg. 43.33 35.00 45.00 45.00 28.6 0.0
14 Red Potato Kg. 29.33 32.00 32.00 32.67 0.0 2.1
15 White Potato Kg. 26.67 28.00 28.00 28.00 0.0 0.0
16 Dried Onion Kg. 40.00 40.00 40.00 40.00 0.0 0.0
Fruits
17 Apple Kg. 71.67 65.00 65.00 66.67 0.0 2.6
18 Banana (Harichhal) Doz. 33.33 33.33 35.00 35.00 5.0 0.0
Spices
19 Salt Kg. 11.00 11.00 11.00 11.00 0.0 0.0
20 Cuminseed 200g. 50.67 50.67 50.67 50.67 0.0 0.0
21 Turmeric 200g. 19.33 19.33 19.33 19.33 0.0 0.0
22 Garlic 200g. 14.33 12.00 12.00 12.33 0.0 2.8
Milk & Milk Products
23 Dairy Milk 500
ml. 15.00 15.00 15.00 15.00 0.0 0.0
24 Lactogen 500g 263.33 263.33 263.33 263.33 0.0 0.0
Oil and Ghee
25 Mustard Oil Lit. 110.00 110.00 110.00 111.67 0.0 1.5
26 Soybean Oil Lit. 82.33 82.33 82.33 83.33 0.0 1.2
27 Vegetable Ghee Lit. 79.33 79.33 79.33 78.33 0.0 -1.3
Meat & Fish
28 Mutton Kg. 320.00 320.00 320.00 320.00 0.0 0.0
29 Fish( Rahu ) Kg. 118.33 140.00 140.00 140.00 0.0 0.0
Soap
30 Bath Soap 100g. 17.00 17.00 17.00 17.00 0.0 0.0
31 Lundry Soap 200g. 10.91 10.91 10.91 10.91 0.0 0.0
Construction Materials
32 Cement (Nepali -Everest ) 50Kg. 526.67 526.67 530.00 530.00 0.6 0.0
33 Cement ( Indian - Buland ) 50Kg. 555.00 555.00 550.00 550.00 -0.9 0.0
34 Iron Rods ( Himal ) Kg. 56.56 56.56 56.78 56.78 0.4 0.0
35 Corrugated Sheets ( Hulas ) Bundle 5596.00 5596.00 5596.00 5596.00 0.0 0.0
36 Bricks (Big Size) Thou. 3700.00 3700.00 3700.00 3700.00 0.0 0.0
37 Timber 3"x4"x12'(Sal Tree ) C.F. 1300.00 1300.00 1300.00 1300.00 0.0 0.0
Others
38 Sugar Kg. 32.00 32.00 32.00 32.00 0.0 0.0
39 Tea 200g. 40.00 40.00 40.00 40.00 0.0 0.0
40 Kerosene ( Open market ) Lit. 48.00 48.00 48.00 48.00 0.0 0.0

xliii
Table -5.1
Weekly Average Retail Prices of Some Essential Commodities Kathmandu
Mid - August 2007
(Prices in Rupees)
23 July Jun/Jul 7 August 15 August Percentage Change
S. No. Name Unit Srawan 07 Srawan 15 Srawan 22 Srawan 30 Column 3 Column 4
1 2 3 4 Over 2 Over 3
Food grains
1 Rice Fine(Pokhreli) Kg. 40.00 40.00 40.00 40.00 0.0 0.0
2 Rice Mansuli(Terai ) Kg. 23.33 23.33 23.33 23.33 0.0 0.0
3 Rice Mansuli (Trishuli ) Kg. 29.33 29.33 29.33 29.33 0.0 0.0
4 Beaten Rice (Tikan) Kg. 52.33 52.33 52.33 52.33 0.0 0.0
5 Wheat Flour (Atta) Kg. 25.00 25.00 25.00 25.00 0.0 0.0
6 Bread Pound 18.00 18.00 18.00 18.00 0.0 0.0
Pulses
7 Black Gram Kg. 86.67 86.67 88.33 88.33 1.9 0.0
8 Mung Kg. 86.67 86.67 86.67 86.67 0.0 0.0
9 Musuro Kg. 70.00 70.00 70.00 70.00 0.0 0.0
10 Chick Pea Kg. 78.33 78.33 78.33 78.33 0.0 0.0
Vegetables
11 Cabbage Kg. 20.00 25.00 25.00 25.00 0.0 0.0
12 Tomato Kg. 43.33 51.67 41.67 26.67 -19.4 -36.0
13 Beans Green Kg. 26.00 43.33 40.00 30.00 -7.7 -25.0
14 Red Potato Kg. 25.33 28.67 29.33 29.33 2.3 0.0
15 White Potato Kg. 22.67 26.00 26.00 26.00 0.0 0.0
16 Dried Onion Kg. 28.00 29.33 29.33 29.33 0.0 0.0
Fruits
17 Apple Kg. 76.67 78.33 71.67 71.67 -8.5 0.0
18 Banana (Harichhal) Doz. 33.33 33.33 33.33 33.33 0.0 0.0
Spices
19 Salt Kg. 11.00 11.00 11.00 11.00 0.0 0.0
20 Cuminseed 200g. 51.33 54.00 54.00 53.00 0.0 -1.9
21 Turmeric 200g. 19.33 19.33 19.33 19.33 0.0 0.0
22 Garlic 200g. 14.00 14.33 14.33 14.33 0.0 0.0
Milk & Milk Products
23 Dairy Milk 500 ml. 15.00 15.00 15.00 15.00 0.0 0.0
24 Lactogen 500g 263.33 263.33 263.33 263.33 0.0 0.0
Oil and Ghee
25 Mustard Oil Lit. 110.00 110.00 110.00 110.00 0.0 0.0
26 Soybean Oil Lit. 80.67 80.00 80.67 80.67 0.8 0.0
27 Vegetable Ghee Lit. 75.00 76.00 76.00 77.67 0.0 2.2
Meat & Fish
28 Mutton Kg. 320.00 320.00 320.00 320.00 0.0 0.0
29 Fish( Rahu ) Kg. 118.33 118.33 118.33 118.33 0.0 0.0
Soap
30 Bath Soap 100g. 17.00 17.00 17.00 17.00 0.0 0.0
31 Lundry Soap 200g. 10.91 10.91 10.91 10.91 0.0 0.0
Construction Materials
32 Cement (Nepali -Everest ) 50Kg. 520.00 526.67 526.67 526.67 0.0 0.0
33 Cement ( Indian - Buland ) 50Kg. 555.00 555.00 555.00 555.00 0.0 0.0
34 Iron Rods ( Himal ) Kg. 56.56 56.56 56.56 56.56 0.0 0.0
35 Corrugated Sheets ( Hulas ) Bundle 5789.00 5596.00 5596.00 5596.00 0.0 0.0
36 Bricks (Big Size) Thou. 3600.00 3600.00 3700.00 3700.00 2.8 0.0
37 Timber 3"x4"x12'(Sal Tree ) C.F. 1300.00 1300.00 1300.00 1300.00 0.0 0.0
Others
38 Sugar Kg. 32.00 32.67 32.67 32.67 0.0 0.0
39 Tea 200g. 40.00 40.00 40.00 40.00 0.0 0.0
40 Kerosene ( Open market ) Lit. 48.00 48.00 48.00 48.00 0.0 0.0

xliv
Table - 5.2
Weekly Average Retail Prices of Some Essential Commodities Terai*
Mid - October 2007 (Prices in Rupees)
Sept.24 Jun/Jul Oct.09 Oct.17 Percentage Change
S.No. Name Unit Ashwin 7 Ashwin 15 Ashwin 22 Ashwin 30 Column 3 Column 4
1 2 3 4 Over 2 Over 3
Foodgrains
1 Rice Fine (Basmati) Kg. 44.50 44.50 44.50 44.59 0.0 0.2
2 Rice Mansuli Kg. 27.25 27.25 27.58 27.58 1.2 0.0
3 Beaten Rice Kg. 26.67 26.67 26.92 26.92 0.9 0.0
4 Wheat Flour (Atta) Kg. 25.33 25.33 25.33 25.33 0.0 0.0
5 Local Bread Pound 19.17 19.17 19.17 19.17 0.0 0.0
Pulses
6 Black Gram Kg. 77.00 77.08 76.92 76.92 -0.2 0.0
7 Arahar Kg. 69.84 70.09 69.75 70.00 -0.5 0.4
8 Musuro Kg. 62.33 62.42 62.33 62.33 -0.1 0.0
9 Chick Pea Kg. 63.58 63.58 62.92 63.58 -1.0 1.1
Vegetables
10 Cabbage Kg. 22.83 29.75 28.00 24.83 -5.9 -11.3
11 Local Tomato Kg. 27.58 35.25 33.75 31.33 -4.3 -7.2
12 Green Beans Kg. 44.44 54.44 47.78 45.11 -12.2 -5.6
13 Red Potato Kg. 23.50 21.17 20.84 22.34 -1.6 7.2
14 White Potato Kg. 22.67 22.00 22.33 22.33 1.5 0.0
15 Dried Onion Kg. 40.42 44.08 45.92 47.08 4.2 2.5
Fruits
16 Apple (Delicious) Kg. 63.33 62.09 62.09 65.84 0.0 6.0
17 Banana (Harichhal) Doz. 21.17 20.33 19.50 18.50 -4.1 -5.1
Spices
18 Salt Kg. 11.00 11.00 11.00 11.00 0.0 0.0
19 Turmeric 250g. 22.09 22.09 22.09 22.09 0.0 0.0
20 Cuminseed 250g. 62.00 60.75 60.75 60.75 0.0 0.0
21 Dry Chilli 250g. 28.84 31.34 31.34 31.34 0.0 0.0
Milk and Milk Products
22 Dairy Milk (500 ml.) Pound 14.13 14.00 14.00 14.00 0.0 0.0
23 Lactogen Refill Pack NO.2 500g 247.00 248.25 248.25 248.25 0.0 0.0
Oil and Ghee
24 Mustard Oil Lit. 108.11 107.00 107.00 107.00 0.0 0.0
25 Soybean Oil Lit. 81.67 82.42 82.42 82.42 0.0 0.0
26 Vegetable Ghee Lit. 76.00 76.00 75.92 75.92 -0.1 0.0
Meat and Fish
27 Mutton Kg. 241.67 241.67 241.67 241.67 0.0 0.0
28 Fish( Rahu ) Kg. 114.17 115.84 115.84 114.58 0.0 -1.1
Soap
29 Bath Soap 100g. 17.00 17.00 17.00 17.00 0.0 0.0
30 Lundry Soap 200g. 10.23 10.23 10.23 10.23 0.0 0.0
Construction Materials
31 Cement ( Nepali ) 50Kg. 428.75 428.33 427.08 426.67 -0.3 -0.1
32 Cement ( Indian ) 50Kg. 482.50 480.83 476.67 476.92 -0.9 0.1
33 Iron Rods Kg. 53.66 53.73 53.73 53.84 0.0 0.2
34 Corrugated Sheets Bundle 5760.84 5760.84 5760.84 5760.84 0.0 0.0
35 Bricks (Big Size) Thou. 4700.00 4700.00 4716.67 4716.67 0.4 0.0
36 Timber 3"x4"x12' ( Sal Tree) C.F.. 1118.75 1118.75 1118.75 1118.75 0.0 0.0
Others
37 Sugar Kg. 28.75 28.75 29.00 29.08 0.9 0.3
38 Tea Dust (Nepali) 100g. 20.96 20.96 20.96 20.96 0.0 0.0
39 Kerosene( open market ) Lit. 47.25 47.25 47.25 47.25 0.0 0.0
*Average Prices of Biratnagar, Birgunj, Sidhdharthanagar and Nepalgunj.

xlv
Table - 5.2
Weekly Average Retail Prices of Some Essential Commodities Terai*
Mid - September 2007
(Prices in Rupees)
August24 Jun/Jul Sept 09 Sept.17 Percentage Change
S.No.
Name Unit Bhadra 7 Bhadra16 Bhadra 23 Bhadra 31 Column 3 Column 4
4 4 4 4 Over 2 Over 3
Foodgrains
1 Rice Fine (Basmati) Kg. 44.09 44.09 44.50 44.50 0.9 0.0
2 Rice Mansuli Kg. 26.09 27.00 27.04 27.21 0.1 0.6
3 Beaten Rice Kg. 27.42 27.42 27.50 26.67 0.3 -3.0
4 Wheat Flour (Atta) Kg. 25.25 25.25 25.25 25.33 0.0 0.3
5 Local Bread Pound 19.17 19.17 19.17 19.17 0.0 0.0
Pulses
6 Black Gram Kg. 74.33 75.42 74.50 74.50 -1.2 0.0
7 Arahar Kg. 70.00 70.17 70.25 69.84 0.1 -0.6
8 Musuro Kg. 61.17 60.83 61.00 62.33 0.3 2.2
9 Chick Pea Kg. 62.58 63.83 63.08 63.08 -1.2 0.0
Vegetables
10 Cabbage Kg. 25.92 26.09 25.00 24.33 -4.2 -2.7
11 Local Tomato Kg. 44.67 41.67 34.17 26.42 -18.0 -22.7
12 Green Beans Kg. 41.78 42.00 46.11 57.22 9.8 24.1
13 Red Potato Kg. 25.00 24.50 24.67 25.67 0.7 4.1
14 White Potato Kg. 22.67 23.00 22.75 22.75 -1.1 0.0
15 Dried Onion Kg. 40.00 39.67 40.00 40.00 0.8 0.0
Fruits
16 Apple (Delicious) Kg. 71.67 70.00 65.42 62.92 -6.5 -3.8
17 Banana (Harichhal) Doz. 21.00 20.58 20.17 21.17 -2.0 5.0
Spices
18 Salt Kg. 11.00 11.00 11.00 11.00 0.0 0.0
19 Turmeric 250g. 22.25 22.25 22.09 22.09 -0.8 0.0
20 Cuminseed 250g. 63.75 63.75 63.33 62.00 -0.7 -2.1
21 Dry Chilli 250g. 29.17 29.17 28.84 28.84 -1.1 0.0
Milk and Milk Products
22 Dairy Milk (500 ml.) Pound 14.25 14.25 14.25 14.25 0.0 0.0
23 Lactogen Refill Pack NO.2 500g 244.50 247.00 247.00 247.00 0.0 0.0
Oil and Ghee
24 Mustard Oil Lit. 107.44 107.44 108.22 108.22 0.7 0.0
25 Soybean Oil Lit. 83.17 83.17 83.00 82.25 -0.2 -0.9
26 Vegetable Ghee Lit. 76.50 76.25 76.00 76.00 -0.3 0.0
Meat and Fish
27 Mutton Kg. 236.67 237.50 236.67 241.67 -0.4 2.1
28 Fish( Rahu ) Kg. 115.84 116.25 115.84 115.84 -0.4 0.0
Soap
29 Bath Soap 100g. 17.00 17.00 17.00 17.00 0.0 0.0
30 Lundry Soap 200g. 10.23 10.23 10.23 10.23 0.0 0.0
Construction Materials
31 Cement ( Nepali ) 50Kg. 437.50 435.83 435.42 431.67 -0.1 -0.9
32 Cement ( Indian ) 50Kg. 496.67 501.25 496.25 488.75 -1.0 -1.5
33 Iron Rods Kg. 53.70 53.51 53.85 53.85 0.6 0.0
34 Corrugated Sheets Bundle 5732.50 5732.50 5732.50 5732.50 0.0 0.0
35 Bricks (Big Size) Thou. 4700.00 4700.00 4700.00 4700.00 0.0 0.0
36 Timber 3"x4"x12' ( Sal Tree) C.F.. 1122.92 1122.92 1118.75 1118.75 -0.4 0.0
Others
37 Sugar Kg. 29.83 29.50 29.25 29.25 -0.8 0.0
38 Tea Dust (Nepali) 100g. 20.88 20.88 20.88 20.88 0.0 0.0
39 Kerosene( open market ) Lit. 47.25 47.25 47.25 47.25 0.0 0.0
*Average Prices of Biratnagar, Birgunj, Sidhdharthanagar and Nepalgunj.
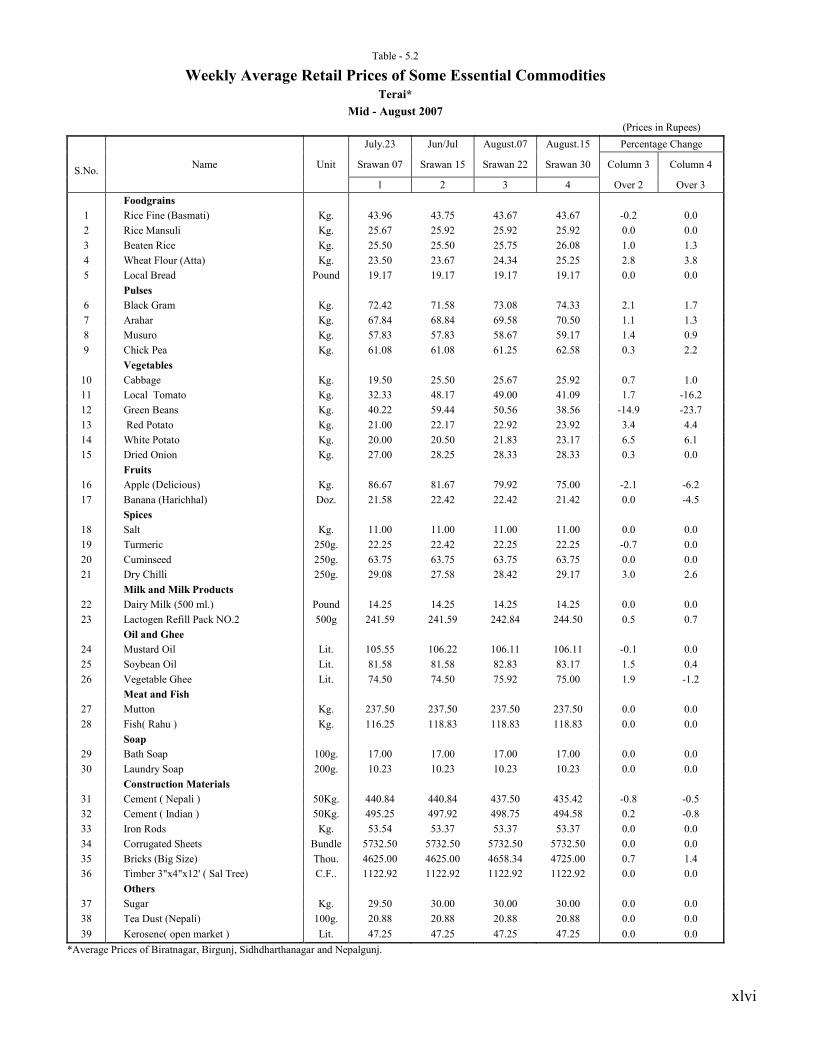
xlvi
Table - 5.2
Weekly Average Retail Prices of Some Essential Commodities Terai*
Mid - August 2007
(Prices in Rupees)
July.23 Jun/Jul August.07 August.15 Percentage Change
S.No. Name Unit Srawan 07 Srawan 15 Srawan 22 Srawan 30 Column 3 Column 4
1 2 3 4 Over 2 Over 3
Foodgrains
1 Rice Fine (Basmati) Kg. 43.96 43.75 43.67 43.67 -0.2 0.0
2 Rice Mansuli Kg. 25.67 25.92 25.92 25.92 0.0 0.0
3 Beaten Rice Kg. 25.50 25.50 25.75 26.08 1.0 1.3
4 Wheat Flour (Atta) Kg. 23.50 23.67 24.34 25.25 2.8 3.8
5 Local Bread Pound 19.17 19.17 19.17 19.17 0.0 0.0
Pulses
6 Black Gram Kg. 72.42 71.58 73.08 74.33 2.1 1.7
7 Arahar Kg. 67.84 68.84 69.58 70.50 1.1 1.3
8 Musuro Kg. 57.83 57.83 58.67 59.17 1.4 0.9
9 Chick Pea Kg. 61.08 61.08 61.25 62.58 0.3 2.2
Vegetables
10 Cabbage Kg. 19.50 25.50 25.67 25.92 0.7 1.0
11 Local Tomato Kg. 32.33 48.17 49.00 41.09 1.7 -16.2
12 Green Beans Kg. 40.22 59.44 50.56 38.56 -14.9 -23.7
13 Red Potato Kg. 21.00 22.17 22.92 23.92 3.4 4.4
14 White Potato Kg. 20.00 20.50 21.83 23.17 6.5 6.1
15 Dried Onion Kg. 27.00 28.25 28.33 28.33 0.3 0.0
Fruits
16 Apple (Delicious) Kg. 86.67 81.67 79.92 75.00 -2.1 -6.2
17 Banana (Harichhal) Doz. 21.58 22.42 22.42 21.42 0.0 -4.5
Spices
18 Salt Kg. 11.00 11.00 11.00 11.00 0.0 0.0
19 Turmeric 250g. 22.25 22.42 22.25 22.25 -0.7 0.0
20 Cuminseed 250g. 63.75 63.75 63.75 63.75 0.0 0.0
21 Dry Chilli 250g. 29.08 27.58 28.42 29.17 3.0 2.6
Milk and Milk Products
22 Dairy Milk (500 ml.) Pound 14.25 14.25 14.25 14.25 0.0 0.0
23 Lactogen Refill Pack NO.2 500g 241.59 241.59 242.84 244.50 0.5 0.7
Oil and Ghee
24 Mustard Oil Lit. 105.55 106.22 106.11 106.11 -0.1 0.0
25 Soybean Oil Lit. 81.58 81.58 82.83 83.17 1.5 0.4
26 Vegetable Ghee Lit. 74.50 74.50 75.92 75.00 1.9 -1.2
Meat and Fish
27 Mutton Kg. 237.50 237.50 237.50 237.50 0.0 0.0
28 Fish( Rahu ) Kg. 116.25 118.83 118.83 118.83 0.0 0.0
Soap
29 Bath Soap 100g. 17.00 17.00 17.00 17.00 0.0 0.0
30 Laundry Soap 200g. 10.23 10.23 10.23 10.23 0.0 0.0
Construction Materials
31 Cement ( Nepali ) 50Kg. 440.84 440.84 437.50 435.42 -0.8 -0.5
32 Cement ( Indian ) 50Kg. 495.25 497.92 498.75 494.58 0.2 -0.8
33 Iron Rods Kg. 53.54 53.37 53.37 53.37 0.0 0.0
34 Corrugated Sheets Bundle 5732.50 5732.50 5732.50 5732.50 0.0 0.0
35 Bricks (Big Size) Thou. 4625.00 4625.00 4658.34 4725.00 0.7 1.4
36 Timber 3"x4"x12' ( Sal Tree) C.F.. 1122.92 1122.92 1122.92 1122.92 0.0 0.0
Others
37 Sugar Kg. 29.50 30.00 30.00 30.00 0.0 0.0
38 Tea Dust (Nepali) 100g. 20.88 20.88 20.88 20.88 0.0 0.0
39 Kerosene( open market ) Lit. 47.25 47.25 47.25 47.25 0.0 0.0
*Average Prices of Biratnagar, Birgunj, Sidhdharthanagar and Nepalgunj.

47
Table - 6
Average Wage Rates in Nepal
(Rupees)
2034/35
2035/36
2036/37
2037/38
2038/39
2039/40
2040/41
2041/42
2042/43
2043/44
2044/45
2045/46
2046/47
2047/48
2048/49
1977/78
1978/79
1979/80
1980/81
1981/82
1982/83
1983/84
1984/85
1985/86
1986/87
1987/88
1988/89
1989/90
1990/91
1991/92
CARPENTER
1.SKILLED
Per Day
16.60
17.45
19.75
22.03
25.06
29.27
32.00
35.80
42.40
49.71
55.54
61.72
66.61
77.96
92.00
2.SEMI-SKILLED
Per Day
14.40
15.17
17.45
19.53
21.62
25.40
28.37
31.77
35.50
40.63
45.54
52.85
56.71
68.71
80.21
MASON
1.SKILLED
Per Day
15.80
16.85
20.01
22.03
24.18
28.67
31.40
35.20
41.40
49.44
57.54
61.97
67.02
78.05
89.08
2.SEMI-SKILLED
Per Day
14.00
14.85
17.36
19.53
21.51
25.07
28.05
31.13
35.48
40.63
45.54
53.10
57.50
68.71
77.71
INDUSTRIAL LABOURERS
1.HIG
H-SKILLED
Monthly
320.00
507.00
507.00
507.00
507.00
507.00
507.00
598.00
598.00
636.33
669.93
864.95
873.00
1141.00
1141.00
2.SKILLED
Monthly
257.40
293.74
306.04
325.78
342.94
371.74
392.26
438.10
452.08
484.93
523.53
683.73
690.00
958.00
958.00
3.SEMI-SKILLED
Monthly
173.00
299.00
299.00
299.00
299.00
299.00
299.00
365.00
365.00
403.33
439.23
577.23
582.00
850.00
850.00
4.UN-SKILLED
Monthly
198.00
216.76
214.84
232.36
247.96
270.46
271.00
310.70
324.92
363.33
403.23
528.40
532.00
800.00
800.00
AGRICULTURE LABOURERS
1.M
ALE
Per Day
7.50
8.17
8.75
10.25
11.60
13.22
14.87
16.10
18.27
20.80
24.49
28.60
30.93
35.69
40.26
2.FEMALE
Per Day
6.50
6.83
7.09
8.85
10.12
11.33
12.78
14.00
16.18
18.87
23.65
26.25
29.13
32.17
35.02
LABOURERS
1.M
ALE
Per Day
- -
- -
- -
12.50
12.50
14.58
19.50
25.58
28.33
30.00
36.85
41.83
2.FEMALE
Per Day
- -
- -
- -
- -
- 20.00
24.33
25.50
27.50
34.10
37.86
2049/50
2050/51
2051/52
2052/53
2053/54
2054/55
2055/56
2056/57
2057/58
2058/59
2059/60
2060/61
2061/62
2062/63
2063/64
1992/93
1993/94
1994/95
1995/96
1996/97
1997/98
1998/99
1999/00
2000/01
2001/02
2002/03
2003/04
2004/05
2005/06
2006/07
CARPENTER
1.SKILLED
Per Day
107.33
116.33
124.75
134.42
142.17
146.17
159.75
195.00
205.33
214.00
223.94
234.06
234.06
247.53
266.50
2.SEMI-SKILLED
Per Day
91.08
97.83
106.00
113.58
116.17
120.67
138.34
153.00
157.67
168.33
178.31
184.50
184.50
190.67
175.00
MASON
1.SKILLED
Per Day
105.26
112.33
123.08
133.42
142.17
146.17
159.75
192.00
202.67
210.33
217.28
229.25
229.25
242.53
262.33
2.SEMI-SKILLED
Per Day
89.22
95.83
104.33
112.58
115.25
120.67
140.21
150.00
157.67
165.33
176.78
183.69
183.69
185.78
195.31
INDUSTRIAL LABOURERS
1.HIG
H-SKILLED
Monthly
1355.99
1482.22
1527.22
1602.22
1692.22
1874.72
1950.55
3705.13
3739.13
3979.53
4159.60
4344.70
4344.70
5434.45
6012.84
2.SKILLED
Monthly
1154.96
1275.25
1333.92
1403.58
1486.92
1669.42
1745.25
2968.60
3000.60
3261.39
3433.73
3523.53
3523.53
4302.72
4895.07
3.SEMI-SKILLED
Monthly
1050.86
1153.42
1198.42
1273.42
1363.42
1545.92
1621.75
2359.00
2421.00
2567.59
2736.40
2889.73
2889.73
3689.06
4068.21
4.UN-SKILLED
Monthly
996.32
1091.95
1136.95
1211.95
1301.95
1489.75
1560.28
1865.47
1893.47
2056.27
2222.83
2385.82
2385.82
3083.67
3652.33
AGRICULTURE LABOURERS
1.M
ALE
Per Day
45.67
47.25
52.08
55.83
59.33
64.83
65.92
80.00
84.60
87.33
89.33
97.03
97.03
111.53
124.92
2.FEMALE
Per Day
37.71
40.17
44.08
47.54
51.63
59.83
60.92
56.60
61.67
66.00
70.32
80.86
80.86
91.17
99.80
LABOURERS
1.M
ALE
Per Day
46.42
53.42
59.08
62.42
68.50
73.67
79.75
91.00
98.33
104.00
106.86
109.00
109.00
120.94
132.39
2.FEMALE
Per Day
42.58
48.75
53.08
55.50
62.08
69.67
75.75
84.00
90.27
95.40
97.58
101.00
101.00
111.19
122.17
Source : Nepal Rastra Bank