Consumers and Food Price Inflation
37
Consumers and Food Price Inflation Updated May 11, 2015 Congressional Research Service https://crsreports.congress.gov R40545
Transcript of Consumers and Food Price Inflation
Consumers and Food Price Inflation
Updated May 11, 2015
Congressional Research Service
https://crsreports.congress.gov
R40545

Consumers and Food Price Inflation
Congressional Research Service
Summary The heightened price volatility of global commodity markets in 2008, the devastating U.S.
drought of 2012, China’s growing demand for international commodities, and almost routine
media reports of daunting world population growth all raise the specter of food price inflation and
generate many questions about farm and food price movements. Understanding food price
changes and their effects on consumers is an important matter for Members of Congress and their
constituents. This report provides information on the current status and outlook for U.S. food
prices, measuring their changes and how such changes relate to U.S. consumers.
Despite the hype associated with media coverage of international catastrophes, historical evidence
suggests that prices for retail food products are driven more by consumer demand (strongly linked
to general economic conditions), than by price changes in raw commodity markets, although this
linkage varies with the degree of raw commodity content in the retail product. For a discussion of
the relationship between farm and retail prices, and the major factors influencing farm-level and
wholesale food prices, see CRS Report R40621, Farm-to-Food Price Dynamics.
During the 1991 to 2006 period, U.S. food prices were fairly stable—annual food price inflation,
as measured by the Consumer Price Index (CPI) for All Food (excluding alcoholic beverages),
averaged a relatively low 2.5%. However, several economic factors emerged in late 2005 that
began to gradually push market prices higher for both raw agricultural commodities and energy
costs, and ultimately retail food prices. U.S. food price inflation increased at a rate of 4% in 2007
and at 5.5% in 2008—the highest since 1990 and well above the general inflation rate of 3.8%.
The situation of sharply rising prices came to a sudden halt in late 2008, when the financial crisis
led to a severe global economic recession. Annual food price inflation dropped to 1.8% in 2009
and 0.8% in 2010, driven by the global financial crisis and its aftermath. In 2011, improving U.S.
and global economic conditions led to a 3.7% rise in average food prices. However, since 2012,
food price inflation has averaged 2.5%—due in part to continued sluggish economic growth and
stagnant wages, which combined to weaken consumer purchasing power. The U.S. Department of
Agriculture (USDA) projects that annual U.S. food price inflation will be in the 2% to 3% range
in 2015 compared with 2.4% in 2014.
For households with low disposable income levels where food expenditures are a large share of
the budget, rising food prices result in diminished purchasing power and may force difficult
budgetary tradeoffs. To help food-deficient households during periods of rising prices, many
domestic food assistance programs are linked to price inflation through escalation clauses, in
order to retain consumer purchasing power during periods of rising food prices. However, even
for programs with escalation clauses, a time lag usually occurs between the time the price
inflation is measured and the time when the wage or program benefit is adjusted upward to
compensate.
The All-Food CPI has two components—Food-at-Home and Food-Away-from-Home. The Food-
at-Home CPI is most representative of retail food prices and is significantly more volatile than the
Food-Away-from-Home index. However, both indexes, Food-at-Home and Food-Away-from-
Home, are projected at 2% to 3% for 2015.

Consumers and Food Price Inflation
Congressional Research Service
Contents
Introduction ..................................................................................................................................... 1
Consumer Demand .......................................................................................................................... 1
Price Responsiveness ................................................................................................................ 2 Income Responsiveness ............................................................................................................ 3 Tastes and Preferences .............................................................................................................. 3 Demographics ........................................................................................................................... 3 Other Non-Economic Factors ................................................................................................... 4 Summary ................................................................................................................................... 4
The Consumer Price Index (CPI) .................................................................................................... 4
Historic Price Inflation Patterns ................................................................................................ 5 Overall Inflation Versus Core Inflation ..................................................................................... 7
Consumer Income and Expenditures ............................................................................................... 8
Food as a Share of Consumer’s Budget .................................................................................... 9 At-Home Versus Away-from-Home Consumption................................................................... 11 International Comparisons ...................................................................................................... 13
Recent Food Price Inflation ........................................................................................................... 14
Annual All-Food Versus All-Items Price Inflation .................................................................. 14 Rapidly Inflating Global Commodity Markets, 2006 to 2008 .......................................... 14 The 2008 Financial Crisis Triggers a Severe Recession and Price Deflation ................... 16 Strong Inflationary-Deflationary Cycles Have Emerged Since 2008 ............................... 16 On-Again, Off-Again Economic Activity Drives Retail Food Price Pattern .................... 19
At-Home Versus Away-from-Home Food Price Inflation ....................................................... 20 Supply-Side Influences on Food Price Inflation ............................................................... 21
Annual Price Movements by Major Food Categories ............................................................. 21 Monthly Price Movements by Major Food Categories ..................................................... 23
Effect of Retail Price Changes....................................................................................................... 28
Price Inflation Escalator Clauses Often Respond with a Lag ................................................. 28 Federal Spending for Domestic Food Assistance Programs ................................................... 28
Supplemental Nutrition Assistance Program (SNAP, formerly Food Stamps) ................. 30 Child Nutrition .................................................................................................................. 30 The WIC Program ............................................................................................................. 31 Additional Commodity Assistance Programs ................................................................... 31
Foreign Food Aid .................................................................................................................... 31
Figures
Figure 1. CPI Weights for Major Categories ................................................................................... 5
Figure 2. Annual Price Inflation, 1915-2014: All-Items vs. All-Food ............................................. 6
Figure 3. Annual Price Inflation Since 1960: All-Items, All-Food, and Energy .............................. 8
Figure 4. Comparison of Real U.S. Disposable Personal Income (DPI) per Capita and the
Share of DPI Spent on Food, 1930-2013 ..................................................................................... 9
Figure 5. Average U.S. Food Expenditure Shares: At-Home vs. Away-from-Home ..................... 12
Figure 6. Monthly Food Price Inflation Since 2000: At-Home vs. Away-from-Home ................. 12
Figure 7. Annual Price Inflation: All-Items vs. All-Food, 1985-2016F ......................................... 15

Consumers and Food Price Inflation
Congressional Research Service
Figure 8. Annual Food Price Inflation Since 1997 ........................................................................ 15
Figure 9. Annual Change in Real GDP and DPI per Capita .......................................................... 17
Figure 10. U.S. Annual Average Unemployment Rate .................................................................. 17
Figure 11. Monthly Retail Food Price Inflation Appears to Follow a Cycle Up-Down
Pattern, with a Downward Trend into 2015 ............................................................................... 18
Figure 12. Food Price Inflation Volatility Has Increased Since 2005 ........................................... 19
Figure 13. Monthly Retail Food Price Inflation, At-Home vs. Away-from-Home ........................ 20
Figure 14. Monthly Retail Price Indexes: Various Major Food Groups ........................................ 23
Figure 15. Monthly Retail Price Indexes: Beef, Pork, Poultry, and Eggs ..................................... 25
Figure 16. Monthly Retail Price Indexes: Dairy, Fresh Milk, Cheese, and Ice Cream ................. 25
Figure 17. Monthly Retail Price Indexes: Fruits and Vegetables .................................................. 26
Figure 18. Monthly Retail Price Indexes: Sugar, Fat & Oils, and Snacks ..................................... 27
Figure 19. Monthly Retail Price Indexes: Coffee, Carbonated Beverages, and Prepared
Foods .......................................................................................................................................... 27
Figure 20. Annual Outlays for USDA Food and Nutrition Programs Since 1970 ......................... 29
Tables
Table 1. Retail Price Change, Mean and Variability, by Historic Time Period ................................ 7
Table 2. Average U.S. Household Food Expenditures in 2013 by Income Quintiles .................... 10
Table 3. International Comparison of Food-at-Home Budget Shares, Selected Countries,
2012 ............................................................................................................................................ 13
Table 4. The Food-at-Home CPI by Category Since 2008 ............................................................ 22
Contacts
Author Information ....................................................................................................................... 32

Consumers and Food Price Inflation
Congressional Research Service R40545 · VERSION 20 · UPDATED 1
Introduction Everyone eats. As a result, everyone is affected to some degree by food price changes. This
makes understanding food price changes and their effects on consumers an important matter for
Congress. This report provides information on the current status and outlook for U.S. food prices,
measuring their changes and how such changes relate to U.S. consumers.
The first section of the report, “Consumer Demand,” briefly reviews the major economic
concepts underlying consumer food behavior. The second section, “The Consumer Price Index
(CPI),” describes how U.S. food price inflation rates have evolved since 1915, when federal price
data collection for inflation-measuring purposes began. The third section, “Consumer Income and
Expenditures,” provides information on recent history and projections for U.S. food expenditure
shares relative to total household budget, with comparisons across income quintiles, as well as
internationally. The fourth section, “Recent Food Price Inflation,” examines retail food price
inflation, including a review and discussion of the level of food price inflation registered by the
consumer price index for all-food, at-home-food, and away-from-home-food purchases as well as
for major food groups. Finally, a fifth section, entitled “Effect of Retail Price Changes,” briefly
discusses the impact that rapid food price inflation can have on government food programs and
the more vulnerable consumer groups.
Each section may be read independently of the others. Thus, those readers that are concerned
primarily with the current status of U.S. retail food price inflation may proceed directly to the
sections entitled “Historic Price Inflation Patterns,” “Recent Food Price Inflation,” or “Effect of
Retail Price Changes.”
Note to Readers
This is one of several CRS reports that respond to concerns about the nature, causes, and effects of farm and
food price movements.
This specific report focuses on aggregate food price inflation with comparisons of recent price inflation for both
At-Home (i.e., retail) purchases and Away-from-Home consumption, as well as by major food groups. In addition,
the report briefly discusses the potential economic and food security implications of food price changes.
A related report, CRS Report R40621, Farm-to-Food Price Dynamics, provides both background and complementary
information for the material presented in this report by describing the linkages between farm, wholesale, and retail
food prices.
Another related report, CRS Report R40152, U.S. Farm Income Outlook for 2015, describes the income outlook for
the U.S. agricultural sector based on semi-annual (February and August) USDA forecasts for agricultural
production and expenses, as well as for farm-level commodity prices and asset values.
An earlier report, CRS Report RL33204, Price Determination in Agricultural Commodity Markets: A Primer, describes
unique characteristics of market conditions for agricultural products in general, as well as for specific types of
agricultural commodities. It also reviews both the U.S. Department of Agriculture’s (USDA’s) forecast and
reporting procedures, their relevance to commodity price formation, and the critical role of price discovery
played by futures contract exchanges.
Consumer Demand Consumer demand is influenced by economic factors—own-price, the price of close substitutes,
the price of complementary items, and household income—as well as by several non-economic
factors including tastes and preferences, family size, age of family members, geographic location,
shopping behavior, and lifestyle choices. Economists attempt to study and measure the nature of

Consumers and Food Price Inflation
Congressional Research Service R40545 · VERSION 20 · UPDATED 2
consumer behavior in response to changes in prices, incomes, and household characteristics, with
an eye for understanding the potential social welfare outcomes that may result from price and
income changes across different socioeconomic groups. Policymakers, in turn, often attempt to
use that information to design and implement policies that mitigate the more deleterious effects of
price and income changes on consumers.
Price Responsiveness
In general, consumers will use less of any good if its price increases relative to other goods
(referred to as the pure “substitution effect” by economists). However, a consumer’s price
responsiveness is a matter of degree and is subject to the potential influence of disposable income
as well as other non-price factors such as those listed in the preceding paragraph.
Under most circumstances, the availability of many close substitutes is likely to make consumers
more sensitive or responsive to price changes, because they have the opportunity to switch to
similar alternatives. In contrast, a lack of substitutes may give the consumer little choice but to
continue to purchase the available good, even as its price rises, especially if it is deemed a
necessity. Strong ethnic or cultural tastes and preferences may endear a person to a particular food
type such that he or she will continue to purchase that food as its price rises even in the presence
of abundant substitutes (for example, ethnic groups that are accustomed to eating rice at every
meal may be reluctant to switch to bread or potatoes even if the price of rice rises relative to those
other foods).
Rapid or unexpected changes in retail food prices will impact some consumers more than others
depending on income levels and the importance of the affected food items in consumers’ budgets.
In general, if an item represents a very small portion of the consumer’s budget (for example,
consider salt), then a consumer is less likely to respond to a price change. For the average
American consumer, basic food staples such as bread, potatoes, pasta, and rice tend to take
smaller shares of the food budget (relative to meat, dairy products, fruits and vegetables, and
more processed food products), and, as a result, consumers are less responsive to a change in their
price. In contrast, high-valued food items such as expensive cuts of meat or seafood probably
represent more costly (and infrequently purchased) delicacies for most households. As a result,
most households will tend to be far more responsive to changes in the prices of such high-valued
products than for basic staples. Often a price change for an item within a specific food group1
may result in consumers switching to lower-quality items within that food category—the classic
example being a switch from steak to hamburger when meat prices rise. In contrast, a widespread
price rise across all food groups may engender substantial reshuffling of consumer food budget
allocations as households try to meet their nutritional goals with their limited budgets.
Of course, the absolute size of a consumer’s disposable income is also important in determining
actual purchasing power. For households with smaller incomes, the food budget itself is likely a
larger portion of total household expenditures, and such households are likely to be more
responsive to price changes across all food categories than are higher-income households.
In summary, lower-income consumers who spend a significant share of their household budget on
food are likely to be impacted more severely by rising food prices (and are likely to be more
responsive to price changes) than high-income consumers with lower food budget shares.
1 Examples of food groups include meat, dairy products, bakery goods, fruits, or vegetables.
Consumers and Food Price Inflation
Congressional Research Service R40545 · VERSION 20 · UPDATED 3
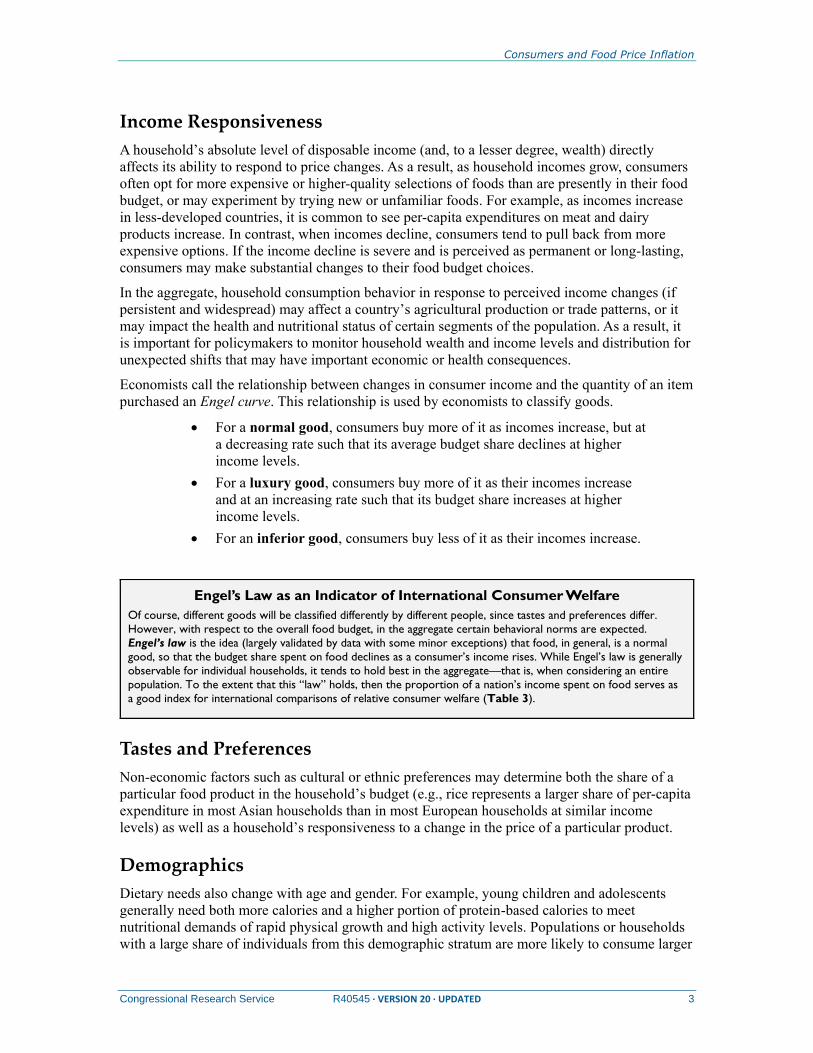
Income Responsiveness
A household’s absolute level of disposable income (and, to a lesser degree, wealth) directly
affects its ability to respond to price changes. As a result, as household incomes grow, consumers
often opt for more expensive or higher-quality selections of foods than are presently in their food
budget, or may experiment by trying new or unfamiliar foods. For example, as incomes increase
in less-developed countries, it is common to see per-capita expenditures on meat and dairy
products increase. In contrast, when incomes decline, consumers tend to pull back from more
expensive options. If the income decline is severe and is perceived as permanent or long-lasting,
consumers may make substantial changes to their food budget choices.
In the aggregate, household consumption behavior in response to perceived income changes (if
persistent and widespread) may affect a country’s agricultural production or trade patterns, or it
may impact the health and nutritional status of certain segments of the population. As a result, it
is important for policymakers to monitor household wealth and income levels and distribution for
unexpected shifts that may have important economic or health consequences.
Economists call the relationship between changes in consumer income and the quantity of an item
purchased an Engel curve. This relationship is used by economists to classify goods.
For a normal good, consumers buy more of it as incomes increase, but at
a decreasing rate such that its average budget share declines at higher
income levels.
For a luxury good, consumers buy more of it as their incomes increase
and at an increasing rate such that its budget share increases at higher
income levels.
For an inferior good, consumers buy less of it as their incomes increase.
Engel’s Law as an Indicator of International Consumer Welfare
Of course, different goods will be classified differently by different people, since tastes and preferences differ.
However, with respect to the overall food budget, in the aggregate certain behavioral norms are expected.
Engel’s law is the idea (largely validated by data with some minor exceptions) that food, in general, is a normal
good, so that the budget share spent on food declines as a consumer’s income rises. While Engel’s law is generally
observable for individual households, it tends to hold best in the aggregate—that is, when considering an entire
population. To the extent that this “law” holds, then the proportion of a nation’s income spent on food serves as
a good index for international comparisons of relative consumer welfare (Table 3).
Tastes and Preferences
Non-economic factors such as cultural or ethnic preferences may determine both the share of a
particular food product in the household’s budget (e.g., rice represents a larger share of per-capita
expenditure in most Asian households than in most European households at similar income
levels) as well as a household’s responsiveness to a change in the price of a particular product.
Demographics
Dietary needs also change with age and gender. For example, young children and adolescents
generally need both more calories and a higher portion of protein-based calories to meet
nutritional demands of rapid physical growth and high activity levels. Populations or households
with a large share of individuals from this demographic stratum are more likely to consume larger

Consumers and Food Price Inflation
Congressional Research Service R40545 · VERSION 20 · UPDATED 4
per-capita portions of meat and dairy products than an older, more mature and sedentary
population would. As a result, population demographics such as household composition, size, and
age structure often play an important role in consumer price sensitivity and income
responsiveness.
Other Non-Economic Factors
Shopping behavior—for example, impulse purchases, quick-stop shopping at convenience stores
to and from work, or weekend shopping at big-box discount stores—can influence the food
choices as well as the average per-item prices paid by a household. Also, a household’s
geographic location—for example, inner city, suburbs, or rural areas—may restrict both a
consumer’s selection of goods and the price range paid for them. Finally, in increasingly affluent
societies, lifestyle choices—for example, frequency of dining out, meal choices, etc.—when
complemented with sufficient purchasing power, can also play an influential role in household
food purchases.
Summary
For households with low disposable income levels where food expenditures are a large share of
the budget, rising food prices result in greater responsiveness and may force more difficult
budgetary tradeoffs than in higher-income households with smaller food-budget shares. Of course
the opposite effect is true during periods of falling prices. However, each household’s price and
income effects also are influenced by its particular set of non-economic characteristics.
The Consumer Price Index (CPI) The CPI is perhaps the most widely reported measure of U.S. price inflation.2 The CPI is used
both as an economic indicator of retail price inflation and as a means of adjusting current-period
values for inflation. The “All-Items” CPI is the index most often referred to (i.e., the headline
CPI) for representing consumer price inflation. It is generally divided into eight major spending
categories, including a “Food and Beverage” category comprising 15.3% of the overall index.
The CPI category of “Food and Beverages” is composed of two major subcategories: “All-Food”
(which has a relative weight of 14.3% in the all-items CPI) and “Alcoholic Beverages” (1.0%).
The All-Food CPI is the principal indicator of consumer food price changes (Figure 1). The All-
Food CPI can be subdivided into the “Food-at-Home” (59.1%) and “Food-Away-from-Home”
(40.9%) categories.
The Food-at-Home CPI reflects changes in the prices of foods
consumed at home. As such it is the principal indicator of changes in
retail food prices in the United States and includes prices of foods
purchased at grocery stores, food marts, and big-box discounters (e.g.,
Walmart, COSTCO, etc.).
The Food-Away-from-Home CPI reflects changes in the prices of foods
purchased and consumed outside of the home, such as restaurants and
other eating and drinking establishments. However, it also includes price
changes for ready-to-eat foods purchased at hotels and motels,
2 See CRS Report RL30074, The Consumer Price Index: A Brief Overview.

Consumers and Food Price Inflation
Congressional Research Service R40545 · VERSION 20 · UPDATED 5
recreational places and sporting events, vending machines, and school
and work cafeterias.
Figure 1. CPI Weights for Major Categories
Source: U.S. Department of Labor, Bureau of Labor Statistics (BLS), CPI-U, 2011-12 weights, December 2014.
Historic Price Inflation Patterns
Over time, the All-Food and All-Items CPIs have moved together, although the All-Food CPI has
been consistently more variable than the All-Items CPI (Table 1 and Figure 2).
Alcoholic
Beverages, 1.0%
Transportation,
15.3%Other goods &
services, 3.4%
Education &
communication,
7.1%
Recreation, 5.8%
Medical care,
7.7%
Apparel, 3.3%
Housing,
42.2%
All Food,
14.3%
Food-at-
Home,
59.1%
Food-
Away-
From-
Home,
40.9%

Consumers and Food Price Inflation
Congressional Research Service R40545 · VERSION 20 · UPDATED 6
Figure 2. Annual Price Inflation, 1915-2014: All-Items vs. All-Food
Source: BLS, CPI 1915 to 2014. Forecast CPI values by Global Insights April 2015 (All-Items, 2015-2016) and
the U.S. Department of Agriculture’s (USDA’s) Economic Research Service (ERS) (All-Food, 2015).
Notes: The percent change is calculated from the annual average CPI for successive years.
Prior to 1960, both of these indexes exhibited higher average inflation rates and more volatility
than in recent years. During the 1914-1920 period—which encompassed the international market
turmoil associated with World War I—both price indexes recorded double-digit average annual
inflation. Food inflation hit its all-time high of 28.7% in 1917 (Figure 2). All-Items price
inflation peaked a year later at 18%. Just four years later, starting in 1921, retail prices entered a
prolonged deflationary period, with a plunge of -24.2% for All-Food and -10.5% for All-Items,
that essentially lasted until 1941 when the wartime shortages of World War II finally renewed
retail price inflation.
The variability of the overall CPI and its individual components is important because uncertainty
about price changes makes planning more difficult—whether the meal planning of a household,
the investment planning of a business, or the policy intervention planning of a federal agency.
During the 1941-1960 period, price inflation remained extremely volatile, alternating between
spikes of inflation and steep disinflationary (i.e., deflationary) drops. It was not until 1960 that
retail prices stabilized with tolerably mild inflation. However, this proved short-lived as the 1970s
saw a return to sharp price spikes generated by an energy crisis and rapid, unexpected shifts in
global crop supply and demand.3 By the early 1980s, retail price inflation had returned to modest
levels below 5%. Since 1983 retail prices, as measured by the All-Items and the All-Food CPIs,
3 For a discussion of 1970s energy markets, see CRS Report R40187, U.S. Energy: Overview and Key Statistics. For a
discussion of 1970s agricultural markets, see M. Peters, S. Langley, and P. Westcott, “Agricultural Commodity Price
Spikes in the 1970s and 1990s,” Amber Waves, ERS, USDA, March 2009, at http://www.ers.usda.gov/; and P. Riley,
“Global Grain Markets in 1996: Shades of 1972-74?” Agricultural Outlook, AO-233, ERS, USDA, Sept. 1996, pp. 2-6.
-30%
-20%
-10%
0%
10%
20%
30%
1915 1925 1935 1945 1955 1965 1975 1985 1995 2005 2015
% A
nn
ual
Ch
an
ge
All-FoodAll-Items

Consumers and Food Price Inflation
Congressional Research Service R40545 · VERSION 20 · UPDATED 7
have been relatively low and relatively stable, except for temporary surges in 1989-1990 and
again in 2007-2008.
Table 1. Retail Price Change, Mean and Variability, by Historic Time Period
(all data—mean and standard deviation [SD]—are percentages)
1914-1920 1921-1941 1941-1960 1960-1983 1983-2014
CPI Series Mean SD Mean SD Mean SD Mean SD Mean SD
All-Items 10.8 7.4 -1.4 4.6 3.9 4.1 5.3 3.6 2.9 1.1
Energy — — — — — — 6.9 9.1 3.1 7.9
All-Food 11.6 9.6 -1.8 9.0 4.9 7.2 5.2 4.1 3.0 1.2
At-Home — — — — — — 5.0 4.5 2.8 1.7
Away-from-Home — — — — — — 6.0 3.1 3.1 0.9
Corea — — — — — — 5.1 3.3 3.0 0.9
Source: CRS calculations based on CPI data from the Bureau of Labor Statistics (BLS), U.S. Department of
Labor.
Notes: “—” = not available. The mean is the average annual price change for each period. The standard
deviation (SD) is a measure of dispersion around the mean value for each period. Plus or minus one (two) SD
captures 68.2% (95.4%) of the variation around the mean value for each period. The mean and SD have been
calculated using the annual percent change data for each of the five different periods. A larger SD implies greater
variability, for example, all-food price inflation has shown a clear pattern of declining variability as the SD has
fallen from 9.6% during the 1914-20 period to 4.1% during 1960-83 (more than halving the variability), and finally
to 1.2% during 1983-2014. This decline in variability is clearly evident in Figure 2.
a. The “Core” price index is the all-items CPI without the energy and all-food components.
Overall Inflation Versus Core Inflation
Many economists and policymakers believe that the food and energy components of the CPI are
volatile and subject to shocks not easily dealt with through government monetary policy. In
response, BLS also reports another price index, referred to as the “core” index because it removes
the food and energy price components from the All-Items CPI.4 The so-called core CPI is thought
to be a useful measure of underlying trend inflation in the short run. The food component of the
CPI, although more volatile than the overall CPI, is substantially less volatile than the energy
component (Figure 3 and Table 1).
Since 1960, the energy price index has been a more volatile component of the All-Items CPI than
the food price index by a substantial margin. For example, the energy price inflation standard
deviation (SD) of 9.1% was more than double the All-Food SD of 4.1% during the 1960-1983
period, and over six times larger since 1983 (7.9% versus 1.2%).
4 For more information, see CRS Report RS22705, Inflation: Core vs. Headline.
Consumers and Food Price Inflation
Congressional Research Service R40545 · VERSION 20 · UPDATED 8
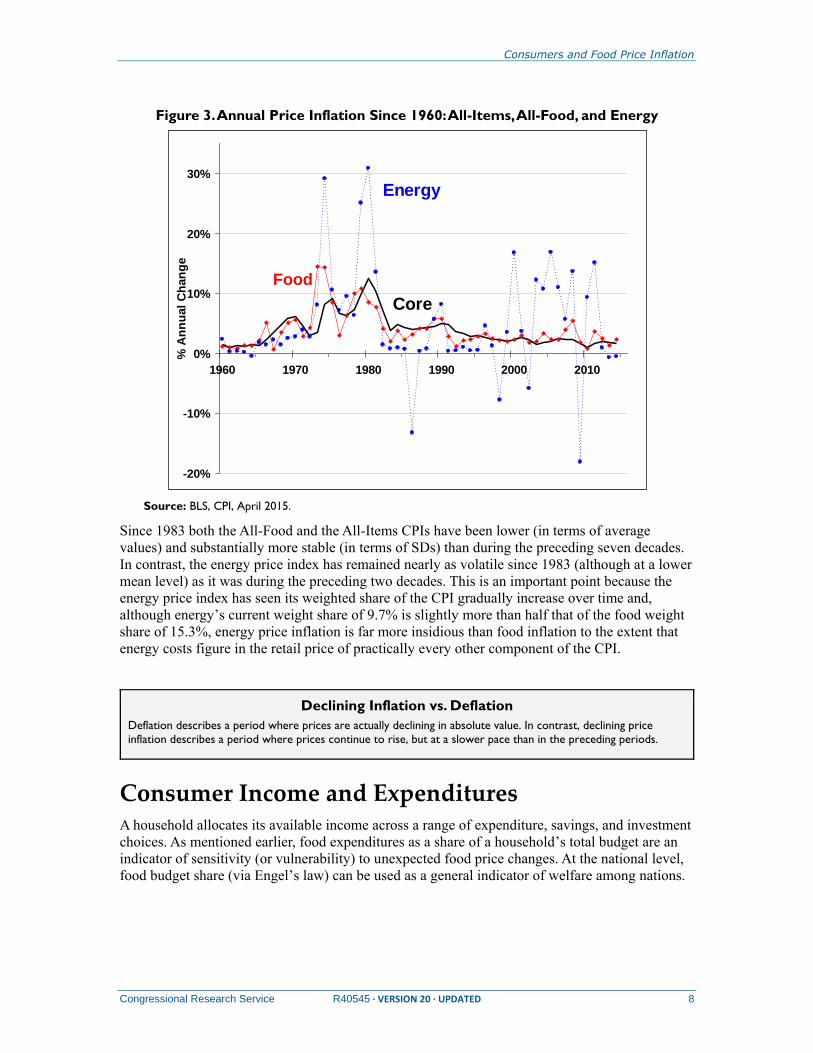
Figure 3. Annual Price Inflation Since 1960: All-Items, All-Food, and Energy
Source: BLS, CPI, April 2015.
Since 1983 both the All-Food and the All-Items CPIs have been lower (in terms of average
values) and substantially more stable (in terms of SDs) than during the preceding seven decades.
In contrast, the energy price index has remained nearly as volatile since 1983 (although at a lower
mean level) as it was during the preceding two decades. This is an important point because the
energy price index has seen its weighted share of the CPI gradually increase over time and,
although energy’s current weight share of 9.7% is slightly more than half that of the food weight
share of 15.3%, energy price inflation is far more insidious than food inflation to the extent that
energy costs figure in the retail price of practically every other component of the CPI.
Declining Inflation vs. Deflation
Deflation describes a period where prices are actually declining in absolute value. In contrast, declining price
inflation describes a period where prices continue to rise, but at a slower pace than in the preceding periods.
Consumer Income and Expenditures A household allocates its available income across a range of expenditure, savings, and investment
choices. As mentioned earlier, food expenditures as a share of a household’s total budget are an
indicator of sensitivity (or vulnerability) to unexpected food price changes. At the national level,
food budget share (via Engel’s law) can be used as a general indicator of welfare among nations.
-20%
-10%
0%
10%
20%
30%
1960 1970 1980 1990 2000 2010
% A
nn
ual
Ch
an
ge
Food
Core
Energy

Consumers and Food Price Inflation
Congressional Research Service R40545 · VERSION 20 · UPDATED 9
Food as a Share of Consumer’s Budget
U.S. consumers have seen their “well-being” improve substantially over the past 80 years (Figure
4) as measured by both food budget share and real disposable personal income (DPI) per capita.
However, these national averages ignore any potential income distribution issues.
Figure 4. Comparison of Real U.S. Disposable Personal Income (DPI) per Capita
and the Share of DPI Spent on Food, 1930-2013
Source: Table 7, Food Expenditures Data Set, ERS, USDA; at http://www.ers.usda.gov/data-products/food-
expenditures.aspx.
Notes: Real DPI is BEA nominal DPI series deflated by the all-items CPI with base 1982-1984 = 100; real food
expenditures are the ERS series of food expenditures deflated by the all-food CPI with base 1982-1984 = 100.
In 2013 total U.S. DPI was $12,505 billion, or $39,518 per capita—in
inflation-adjusted 1982-1984 dollars this equaled nearly $17,000 per
capita DPI. On average, 9.8% of disposable personal income was spent
on food in 2013.5
The U.S. food share of real DPI has fallen from a high of 25.2% in 1933
to under 10% since 2000, while the average DPI per capita (in 1982-
1984 dollars) has risen from $2,838 in 1933 to nearly $17,000 by 2013.
Based on 2013 Consumer Expenditure Survey (CES) data (Table 2),
average food outlays of $6,602 per household accounted for 13.0% of
average total consumer expenditures of $51,100 per household.6
5 The DPI and DPI-food-share estimates are for 2011 from Table 7, Food Expenditures Data Set, ERS, USDA; at
http://www.ers.usda.gov/data-products/food-expenditures.aspx.
6 CES data are calculated “per consumer unit” which is described as “similar to a household” by BLS.
$0
$3,000
$6,000
$9,000
$12,000
$15,000
$18,000
1930 1940 1950 1960 1970 1980 1990 2000 2010
Dis
po
sa
ble
Pe
rso
na
l In
co
me
(D
PI)
pe
r c
ap
ita
0%
5%
10%
15%
20%
25%
30%
Fo
od
Sh
are
of
DP
I p
er
ca
pit
a
Food Budget
Share as % of DPI
Real DPI per capita
in 1982-84 dollars

Consumers and Food Price Inflation
Congressional Research Service R40545 · VERSION 20 · UPDATED 10
The difference between the two food-budget-share estimates (9.8% based
on DPI versus 13.0% based on CES total expenditures) is due to how
disposable income and food expenditures are calculated for each of these
indicators.
Table 2. Average U.S. Household Food Expenditures in 2013 by Income Quintiles
Income Quintile Total All Food Food-at-Home
Food-Away-
from-Home
Expenditures (and Share of Expenditures) per Household
Lowest 20% $22,393 $3,655 16.6% $2,514 11.4% $1,142 5.2%
Second 20% $32,559 $4,781 14.8% $3,221 10.0% $1,561 4.8%
Third 20% $42,495 $5,728 13.4% $3,606 8.5% $2,122 5.0%
Fourth 20% $58,842 $7,655 13.0% $4,482 7.6% $3,173 5.4%
Highest 20% $99,237 $11,184 11.5% $6,058 6.2% $5,125 5.3%
Average Outlay ($) $51,100 $6,602 13.0% $3,977 7.9% $2,625 5.2%
Share of Food Expenditures
Lowest 20% 100% 68.8% 31.2%
Second 20% 100% 67.4% 32.7%
Third 20% 100% 63.0% 37.0%
Fourth 20% 100% 58.5% 41.5%
Highest 20% 100% 54.2% 45.8%
Average Outlay ($) 100% 60.2% 39.8%
Source: “Table 1. Quintiles of before-tax income: Average annual expenditures and characteristics,” BLS,
Consumer Expenditure Survey, 2013, at http://www.bls.gov/cex.
The share of household All Food and Food-at-Home expenditures
(Table 2) varied across income quintiles, in accordance with Engel’s
law—that is, each succeeding higher income quintile increased its
absolute dollar expenditures on food, but at a decreasing rate such that
the Food-at-Home budget share declines across higher quintiles.
For example, the lowest 20% of U.S. households spent $2,514 on Food-
at-Home, or 11.4% of their average total expenditures of $22,393 in
2013, whereas the highest 20% of households spent $6,058 on Food-at-
Home, or a 6.2% share of their average total expenditures of $99,237.
However, the budget shares for Food-Away-from-Home do not fully
comply with Engel’s law—they decline across income quintiles until the
third income quintile, then decline until the fifth quintile. This pattern
suggests that other factors (possibly lifestyle and/or work-related) are
influencing Food-Away-from-Home spending choices.
In summary, BLS data show that lower-income U.S. households tend to spend a larger share of
their food budget on Food-at-Home consumption and are thus more vulnerable to unexpected
retail food price increases (this is discussed further in the next section).
Consumers and Food Price Inflation
Congressional Research Service R40545 · VERSION 20 · UPDATED 11
At-Home Versus Away-from-Home Consumption
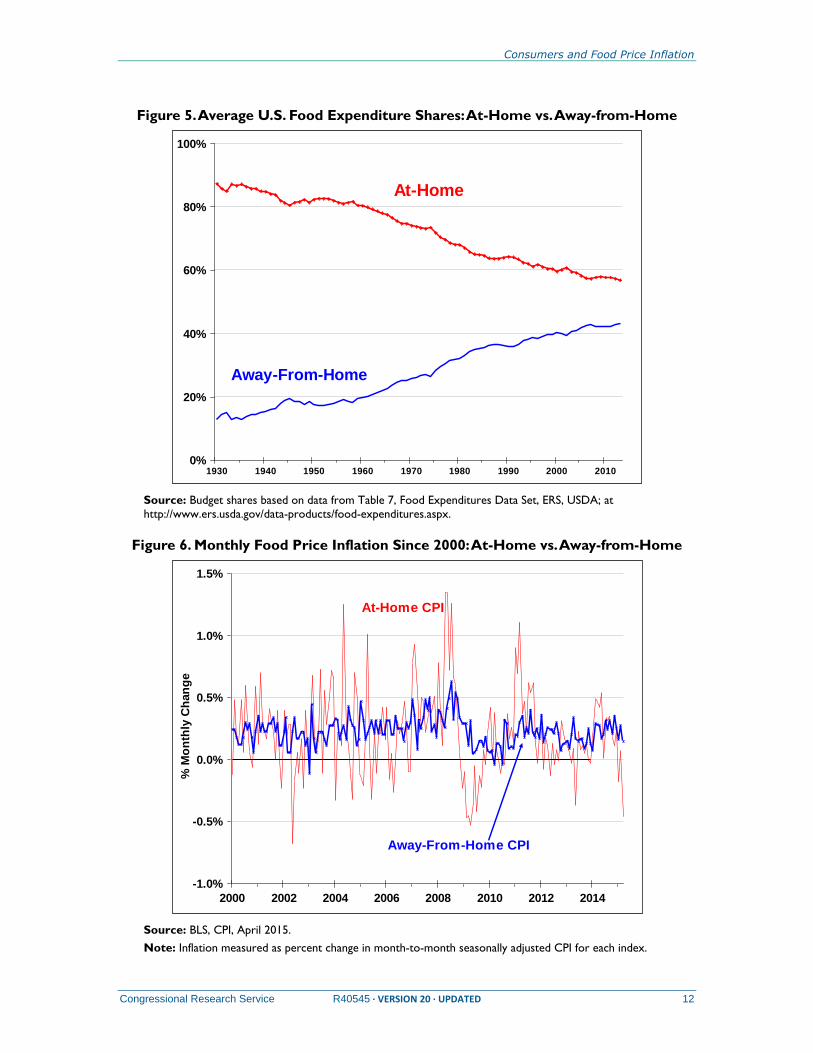
U.S. households have shown a strong propensity over time to increase their share of annual food
consumption outside of the home (Figure 5). With the exception of a brief period following the
end of World War II, the portion of the national food budget spent on food consumption away
from the home has steadily increased from 12.7% in 1930 to an estimated 43.2% in 2013.
This phenomenon is associated with:7
increasing per-capita disposable income,
increasing female participation in the labor force,
more two-earner households,
increased advertising and promotion by large food-service chains,
increasing time constraints on household members (e.g., longer
commutes, increased work hours and less leisure time, etc.),
the smaller size of U.S. households, and
the increased availability of relatively low-cost, fast-food establishments.
The tendency for increased Away-from-Home food consumption has important implications for
consumer responsiveness to price and income changes, as well as for household nutrition. This is
because prices of Food-at-Home purchases are significantly more volatile than are prices of food-
away-from-home purchases (Table 1 and Figure 6).
ERS research suggests that Away-from-Home expenditures are typically higher for single-person
households and households containing multiple adults without living-at-home children.8 By
implication, households with living-at-home children typically rely more on Food-at-Home
consumption (as a share of their budget) and are thus more vulnerable to the normally higher
price variability associated with retail food prices.
Is Food-Away-from-Home Consumption a Luxury Good?
Although increased Food-Away-from-Home expenditure is associated with higher income (both in absolute terms
and as a share of the household food budget), it is not always a luxury item. A partial key to understanding how
increasing food-away-from-home consumption may impact consumer behavior is the extent to which such
consumption is a choice (for example, made in the evenings or on weekends during leisure hours) or more of an
obligation (made during work hours), as well as the extent to which a consumer has alternative dining choices
when eating out (for example, subsidized cafeteria meals are often available at schools or in large institutional
work settings).
7 For a discussion of this issue, see “Food Away From Home,” Diet Quality and Food Consumption Briefing Room,
ERS, USDA, at http://www.ers.usda.gov/Briefing/DietQuality/.
8 Hayden Stewart, Noel Blisard, Sanjib Bhuyan, and Rodolfo M. Nayga, Jr., The Demand for Food Away From Home:
Full-Service or Fast Food? AER No. 829, ERS, January 2004.
Consumers and Food Price Inflation
Congressional Research Service R40545 · VERSION 20 · UPDATED 12
Figure 5. Average U.S. Food Expenditure Shares: At-Home vs. Away-from-Home
Source: Budget shares based on data from Table 7, Food Expenditures Data Set, ERS, USDA; at
http://www.ers.usda.gov/data-products/food-expenditures.aspx.
Figure 6. Monthly Food Price Inflation Since 2000: At-Home vs. Away-from-Home
Source: BLS, CPI, April 2015.
Note: Inflation measured as percent change in month-to-month seasonally adjusted CPI for each index.
0%
20%
40%
60%
80%
100%
1930 1940 1950 1960 1970 1980 1990 2000 2010
Away-From-Home
At-Home
-1.0%
-0.5%
0.0%
0.5%
1.0%
1.5%
2000 2002 2004 2006 2008 2010 2012 2014
% M
on
thly
Ch
an
ge
At-Home CPI
Away-From-Home CPI

Consumers and Food Price Inflation
Congressional Research Service R40545 · VERSION 20 · UPDATED 13
International Comparisons
A comparison of food budget shares (based on Food-at-Home expenditures) from over 70
countries (Table 3) suggests that, on average, the United States has achieved a higher level of
social welfare (based on this particular indicator) than any of the other countries in the database.
Table 3. International Comparison of Food-at-Home Budget Shares,
Selected Countries, 2012
Country
Total Expenditures
per Capita
At-Home Food
Expenditures per
Capita
At-Home
Food Share
United States $34,541 $2,723 6.6%
United Kingdom $24,260 $2,214 9.1%
Canada $27,761 $2,679 9.6%
Germany $22,762 $2,481 10.9%
South Korea $12,002 $1,468 12.2%
France $22,945 $3,037 13.2%
Japan $27,761 $3,188 13.8%
Italy $20,362 $2,892 14.2%
Brazil $7,063 $1,123 15.9%
Poland $7,773 $1,521 19.6%
Mexico $6,518 $1,625 24.9%
India $871 $220 25.2%
China $2,149 $577 26.9%
Russia $6,709 $2,120 31.6%
Indonesia $1,964 $655 33.4%
Nigeria $966 $381 39.5%
Egypt $2,410 $1,030 42.7%
Philippines $1,925 $823 42.8%
Algeria $1,749 $764 43.7%
Pakistan $871 $415 47.7%
Source: ERS, USDA, Food Expenditure Data Products, “Expenditures on food and alcoholic beverages that
were consumed at home by selected countries,” http://www.ers.usda.gov/data-products/food-expenditures.aspx/.
The food budget share is only one indicator of national welfare and ignores any unfavorable
distribution of the food expenditure share (should any exist). Even the lowest 20% of U.S.
households, on average, spent less than 12% of their budgets on at-home food consumption in
2013 and, thus, appear relatively well-off in food terms based on this particular international
standard (Table 2).
Readers should note that this cursory assessment is aggregate in nature and does not exclude the
possibility that there are food-deficient individuals within the lowest 20% quintile of the U.S.
population. According to ERS, in 2012, an estimated 14.5% of U.S. households were food-
insecure at least some time during the course of the year—meaning that the food intake of one or

Consumers and Food Price Inflation
Congressional Research Service R40545 · VERSION 20 · UPDATED 14
more household members was reduced and their eating patterns were disrupted at times during
the year because the household lacked money and other resources for food.9
Recent Food Price Inflation This section provides a discussion of recently observed food price inflation, first based on an
annual aggregate perspective, then from a monthly disaggregate perspective that examines price
inflation for both Food-at-Home versus Food-Away-from-Home and major food groups.
Annual All-Food Versus All-Items Price Inflation
As a general rule, the All-Item and All-Food CPIs tend to move together.10 Following a relatively
tumultuous period of price inflation in the late 1980s, both price indexes entered an extended
period of relative stability. From 1991 through 2006, the All-Food CPI measured average annual
inflation of 2.5%, compared with 2.7% annual average All-Items price inflation (Figure 7).
Rapidly Inflating Global Commodity Markets, 2006 to 2008
Several economic factors emerged in late 2005 that began to gradually push market prices higher
for both raw agricultural commodities and energy costs.11 These factors included the rapid
development of the U.S. biofuels sector, as well as rising consumer incomes, not just in the
United States but globally, which sparked demand for meat and dairy products, food and feed
grains, as well as energy and transportation resources, and a wide assortment of raw materials
ranging from minerals and metals to coal and petroleum. Driven largely by these demand forces,
both general inflation and food price inflation began to accelerate in 2007 and reached a peak in
2008 when the All-Items CPI reached 3.8%, highest since 1991, and the All-Food CPI peaked at
5.5%, highest since 1990 (Figure 7 and Figure 8).
For a given level of income, higher prices mean lower effective purchasing power, since the same
household budget will now acquire a smaller volume of products. The negative aspects of the
sharp rise in retail food prices that occurred in 2007 and 2008 were magnified by a global
financial crisis that emerged in 2008 and led to declines in both real (i.e., inflation-adjusted) gross
domestic product (GDP) and real household disposable personal income (DPI)—after 15
consecutive years of positive growth both aggregate income indicators fell modestly in 2008, real
GDP by 0.3%, and real DPI per capita by 0.2% (Figure 9).
9 Household Food Security in the United States in 2012, Economic Research Report No. (ERR-155), by Alisha
Coleman-Jensen, Mark Nord, and Anita Singh, 41 pp., September 2013, ERS, USDA.
10 The various CPI categories discussed here are indicative of price changes at the retail level in U.S. urban settings.
Approximately 87% of U.S. consumers are covered by the CPI data collection process, thus CPI data are indicative of
prices faced by most U.S. consumers.
11 For more information on the factors behind the sharp run-up in global commodity prices in the first half of 2008, see
CRS Report RL34474, High Agricultural Commodity Prices: What Are the Issues? by Randy Schnepf.

Consumers and Food Price Inflation
Congressional Research Service R40545 · VERSION 20 · UPDATED 15
Figure 7. Annual Price Inflation: All-Items vs. All-Food, 1985-2016F
Sources: Historical data for 1985-2014, adjusted for seasonality, are from BLS; 2015 forecast of All-Food CPI is
from USDA, ERS, April 24, 2015; 2015 and 2016 forecasts of All-Items CPI are from Global Insights, U.S.
Executive Summary, April 2015. Percent change is calculated from annual average CPI for successive years.
Figure 8. Annual Food Price Inflation Since 1997
Sources: Historical data (1997-2014) from BLS; 2015 forecast is from USDA, ERS, April 24, 2015.
-1%
0%
1%
2%
3%
4%
5%
6%
1985 1990 1995 2000 2005 2010 2015
% A
nn
ual C
han
ge
All-Food CPI
All-Items CPI
2.6%
2.2%2.1%2.3%
3.2%
1.8%
2.2%
3.4%
2.4%2.4%
4.0%
5.5%
1.8%
0.8%
3.7%
2.6%
1.4%
2.4%
2.0%
3.0%
0%
2%
4%
6%
1997 1999 2001 2003 2005 2007 2009 2011 2013 2015F
% Annual Change
All-Food CPI

Consumers and Food Price Inflation
Congressional Research Service R40545 · VERSION 20 · UPDATED 16
The 2008 Financial Crisis Triggers a Severe Recession and Price Deflation
The situation of sharply rising prices through the first half of 2008 came to a sudden halt when
the financial crisis hit U.S. and global commodity and financial markets in mid-2008 leading to a
severe economic recession in 2009. Annual average real GDP declined by 2.8% in 2009, the
sharpest decline since 1946 (Figure 9). Real DPI per capita also plunged downward in 2009,
falling by 1%, sharply reducing average consumer purchasing power.
The economic downturn also manifested itself in a decline in household wealth due to sharply
lower real estate values, tighter business and consumer credit, stagnant wage rates, and rising
unemployment numbers (Figure 10). Unemployment is generally a lagging indicator in that it
moves slowly and with a substantial delay relative to an economic downturn. This is primarily
because employers need several months to determine the permanency of an economic downturn
before idling productive resources including laying off workers. As a result, the U.S.
unemployment rate associated with the economic recession of 2008 and 2009 did not peak until
2010, when it reached 9.6%. From 1995 to its upturn in 2009, the unemployment rate had
averaged 5.1%.
Strong Inflationary-Deflationary Cycles Have Emerged Since 2008
Monthly retail food price inflation responds with lags of up to several months to farm-level price
changes in their underlying raw commodity markets. This is because, in part, the prices for raw
commodities must work their way through the marketing chain to the retail level.12 Also, food
processors and retailers are traditionally slow to pass on price decreases that they experience at
the wholesale level for several reasons, including substantial inherent operating risk associated
with volatile markets.
Prices for most farm-level agricultural commodities peaked in early 2008, then began a steady
decline through 2010 reflecting abundant supplies, as well as the economic crises and diminished
consumer purchase power. However, most retail prices were slow to reflect farm-level
commodity price declines, and it was only in late 2008 that retail prices began to significantly
retreat for most foods. As a result, annual retail food price inflation peaked at 5.5% in 2008 before
falling to 1.8% in 2009 and 0.8% in 2010 (Figure 8).
Monthly price data (Figure 11 and Figure 12) more clearly show the strong inflationary and
deflationary cycles that have dominated food price movements since 2008.13 After spiking up
sharply during 2008, sharply lower raw commodity and energy costs combined with weak
domestic and global economies to reduce inflationary pressures by mid-2009 for both the All-
Items and All-Food price indexes. The change in month-to-month retail food prices declined
precipitously through 2009 even though farm prices had stabilized by early 2009. The downward
monthly price inflation trend reversed itself in mid-2009; however, average annual food price
inflation continued to fall, hitting 0.8% in 2010. However, the All-Items CPI was subject to much
stronger deflationary pressures than the All-Food CPI, particularly from weakening energy
markets. As a result, the disparity between the two indexes widened in 2009 as the All-Items CPI
fell at an annual rate of -0.4% (Figure 7).
12 These issues are discussed in more detail in CRS Report R40621, Farm-to-Food Price Dynamics, by Randy Schnepf.
13 ERS updates its food price forecast monthly at Food CPI and Expenditures Briefing Room, ERS, USDA, at
http://www.ers.usda.gov/data-products/food-price-outlook.aspx.

Consumers and Food Price Inflation
Congressional Research Service R40545 · VERSION 20 · UPDATED 17
Figure 9. Annual Change in Real GDP and DPI per Capita
Source: Bureau of Economic Analysis (BEA), U.S. Department of Commerce, data as of May 7, 2015.
Note: GDP = Gross Domestic Product; DPI = Disposable Personal Income. DPI has been converted to per
capita basis by CRS using Census Bureau population data.
Figure 10. U.S. Annual Average Unemployment Rate
Source: Historical data for 1950-2014, Department of Labor, BLS, May 7, 2015. The 2015 and 2016 forecasts of
All-Items CPI are from Global Insights, U.S. Executive Summary, April 2015
-4%
-2%
0%
2%
4%
6%
8%
1970 1975 1980 1985 1990 1995 2000 2005 2010 2015
Change in Real GDP
Change in Real DPI Per Capita
4%
6%
8%
10%
1970 1980 1990 2000 2010

Consumers and Food Price Inflation
Congressional Research Service R40545 · VERSION 20 · UPDATED 18
Figure 11. Monthly Retail Food Price Inflation Appears to Follow a Cycle Up-Down
Pattern, with a Downward Trend into 2015
Source: Data, adjusted for seasonality, are from BLS, CPI May 7, 2015.
Notes: The percent change is calculated from the CPI for successive months. Multiply any given month’s value
by 12 to approximate the annual inflation rate experienced during that particular month, without compounding.
By late 2009 global economies resumed growing, albeit slowly, followed in 2010 by more robust
growth in the U.S. economy (Figure 9), thus reversing the deflationary price pattern. Because of
the lags in the price-signal response process (referred to as price transmission by economists)
described earlier, the price deflationary trend persisted into 2010 and provided some budgetary
relief for households with employed members. However, surging unemployment numbers (also
lagging well behind the general economy) meant that many households were unable to take
advantage of food price declines.14
By late 2010, prices for most food groups had resumed their upward surge into 2011 (Figure 11)
before sharply slowing their growth due to another bout of general economic weakness and
persistently high unemployment. The unemployment rate peaked at 9.6% in 2010 but declined
slowly to 8.9% in 2011 and 8.1% in 2012—still historically high levels. The U.S. and global
economies remained sluggish through 2012 and into 2013, dampened by high unemployment,
continued financial turmoil in Europe, and a slowing economy in China. This economic turn-
around was reflected in declining monthly price inflation data into 2013 (Figure 11). In early
2014, the U.S. economy again rebounded slightly (Figure 9) and with it came a mild rebound in
commodity price inflation. However, other major international economies remained weak, with
little or no growth. U.S. agricultural exports peaked at record value in 2014, but by the end of the
year, international market prospects dimmed. Food price rises slowed considerably and turned
14 The economic recovery with persistently high unemployment is referred to as a “jobless recovery” or “jobless
growth.” See Natalia Kolesnikova and Yang Liu, “Jobless Recoveries: Causes and Consequences,” Federal Reserve
Bank of St. Louis, April 2011.
-0.25%
0.00%
0.25%
0.50%
0.75%
1.00%
2007 2008 2009 2010 2011 2012 2013 2014 2015
% M
on
thly
Ch
an
ge
All-Food CPI
(Seasonally Adjusted)

Consumers and Food Price Inflation
Congressional Research Service R40545 · VERSION 20 · UPDATED 19
negative in early 2015. According to USDA, U.S. food price inflation is projected in the 2% to
3% range in 2015 (Table 4 and Figure 8).
On-Again, Off-Again Economic Activity Drives Retail Food Price Pattern
Retail food prices have clearly been responding to the on-again, off-again demand driven by the
cyclical nature of U.S. and global economic activity. Monthly All-Food price inflation data
(adjusted for seasonality) are presented in Figure 12, but for a longer time period and
accompanied by their 11-month moving average (MA).15
Figure 12. Food Price Inflation Volatility Has Increased Since 2005
(monthly change vs. 11-month moving average)
Source: Data, adjusted for seasonality, are from BLS CPI, May 7, 2015.
The 11-month MA series reveals three recent pronounced inflationary-deflationary trends for
retail food prices that have occurred since 2005:
1. a strong upward inflationary trend that began at the end of 2005 and persisted
through June 2008—in line with the demand-driven price rises in global markets
for agricultural commodities as well as for energy, transportation, and raw
materials; followed by a severe deflationary price pattern from late 2008 until
mid-2009, driven by the U.S. and global financial crisis of 2008 and its
aftermath;
2. another upward trend starting in late 2010 as U.S. and global economic
conditions slowly improved, followed by a decline in inflationary pressure in
mid-2011 into 2013—again due largely to sluggish economic growth, stagnant
15 Moving averages are used to reveal underlying patterns or trends that can otherwise be hidden by a substantial
amount of month-to-month variation in price movements.
-0.50%
-0.25%
0.00%
0.25%
0.50%
0.75%
1.00%
1990 1993 1996 1999 2002 2005 2008 2011 2014
Perc
en
t
Monthly Change
All-Food CPI (SA)
11- month
Moving Average

Consumers and Food Price Inflation
Congressional Research Service R40545 · VERSION 20 · UPDATED 20
wages, and persistently high unemployment, which combined to weaken
consumer purchasing power; and finally
3. food price inflation returning in 2014 due to a strengthening U.S. economy and
strong employment gains; followed once again by an apparent economic
downturn heading into 2015.
At-Home Versus Away-from-Home Food Price Inflation
As shown earlier (Figure 6), At-Home food prices are substantially more volatile than Away-
from-Home food prices (see also Table 1). This volatility is apparent, even when using a shorter
time period (Figure 13).
Figure 13. Monthly Retail Food Price Inflation, At-Home vs. Away-from-Home
Source: Historical data, adjusted for seasonality, are from BLS CPI, May 7, 2015.
Notes: The percent change is calculated from the CPI for successive months. Multiply any given month’s value
by 12 to approximate the annual inflation rate experienced during that particular month, without compounding.
When displayed in terms of monthly price changes, the pattern exhibited by At-Home food price
inflation (Figure 13) appears very similar to the pattern for All-Food price inflation (Figure 11),
although the At-Home food price movements are more extreme. In contrast, monthly Away-from-
Home price inflation is much more stable. Note that both At-Home and Away-from-Home
monthly price inflation show a distinct downturn beginning in July 2008 and running into early
2009, followed by a steady recovery into 2011. However, the monthly Away-from-Home price
inflation does not show the same declining trend that started in mid-2011 for At-Home monthly
price inflation, nor the follow-on downturn in early 2015.
-0.5%
0.0%
0.5%
1.0%
1.5%
2007 2008 2009 2010 2011 2012 2013 2014 2015
% M
on
thly
Ch
an
ge
At-Home CPIAway-From-
Home CPI

Consumers and Food Price Inflation
Congressional Research Service R40545 · VERSION 20 · UPDATED 21
Supply-Side Influences on Food Price Inflation
The demand-side influences of income growth (and decline) and the global financial crisis that
emerged in late 2008 have already been discussed. On the supply side, food price inflation is the
result of dynamic forces that occur both at the farm, where the raw agricultural ingredients for
retail food items are produced, and along the marketing chain, as the farm output is transformed
and moved to the retail customer. An array of costs are layered on top of the price of the raw
agricultural commodity, including handling, transportation, storage, and processing, as well as the
insurance, financing, and advertising costs necessary to move the product to the retail customer.
The relative importance of these marketing costs varies widely for different retail food products
depending on the degree of processing and transformation (i.e., cleaning, packaging, shipping,
advertising, etc.). As a result, economic forces such as higher energy costs or increased labor rates
do not impact all food categories equally. More highly processed food products, where the farm-
level commodity value contributes a small share to the final price, are less influenced by farm-
level price changes than are those food products that have very little marketing and processing as
part of the final retail product—for example, eggs, fresh meat, and certain fruits and vegetables.
Annual Price Movements by Major Food Categories
Food price inflation is not felt evenly across all food groups, but varies widely in terms of both
the timing and the relative magnitude. However, the patterns displayed for At-Home food prices
in Figure 13 are for the most part replicated across the individual food groups of Table 4.
In 2008, at-home food prices inflation of 6.4% was the highest since
1990.
In 2009 and 2010, most food groups experienced very modest price
inflation (0.5% and 0.3%, respectively); several categories experienced
price deflation.
Food price inflation turned upward sharply across most food categories
in 2011.
Food price inflation returned to its long-run trend of about 2.5% in 2012
with the notable exception of beef and poultry products, and fats and oils,
which were up sharply. High feed costs and lack of pasture during 2012
(due to a severe drought across the Plains States and Cornbelt)
contributed to substantial declines in livestock and poultry populations
and cut into cattle feedlot and chicken grow-out profit margins, thus
sparking concerns—but not shortages—at the retail level.
Tight animal product supplies in 2011 and 2012 supported most animal
product prices at above average price inflation levels during those years.
As feed supplies rebounded in 2013, the hog, poultry, and dairy sectors
began to expand (the beef sector is constrained by biology from rapid
expansion).
In 2014, prices moderated for most food categories except for dairy and
livestock products, most notably beef prices, which surged at a 12.1%
rate. Most commodity prices (with the exception of beef) are expected
remain in the 2% to 3% range in 2015.

Consumers and Food Price Inflation
Congressional Research Service R40545 · VERSION 20 · UPDATED 22
Table 4. The Food-at-Home CPI by Category Since 2008
Weightsa Annual Percent Change
Category
% % 2008 200
9
2010 201
1
2012 201
3
2014 2015F
Food at Home 100% 6.4 0.5 0.3 4.8 2.5 0.9 2.4 2.0 to
3.0
1-Cereal & Bakery Prod. 13.5% 10.2 3.2 -0.8 3.9 2.8 1.0 0.2 0.5 to 1.5
Cereals and prod.b 4.4% 10.1 3.4 -1.8 4.4 2.5 -0.1 0.1 Na
Bakery productsc 9.1% 10.3 3.0 -0.4 3.7 3.1 1.7 0.4 Na
2-Meats; Poultry; & Fish 23.9% 4.2 0.5 1.9 7.4 3.6 2.1 7.2 3.0 to 4.0
Beef & veal 6.9% 4.5 -1.0 2.9 10.2 6.4 2.0 12.1 5.0 to 6.0
Pork 4.4% 2.3 -2.0 4.7 8.5 0.3 0.9 9.1 0.0 to 1.0
Poultry 4.3% 5.0 1.7 -0.1 2.9 5.5 4.7 2.0 2.5 to 3.5
Fish & seafood 3.5% 6.0 3.6 1.1 7.1 2.4 2.5 5.8 2.5 to 3.5
3-Eggs 1.6% 14.0 -14.7 1.5 9.2 3.2 3.3 8.4 2.5 to 3.5
4-Dairy & Products 10.7% 8.0 -6.4 1.1 6.8 2.1 0.1 3.6 2.0 to 3.0
Milk 3.4% 6.0 -13.2 3.6 9.2 1.1 1.2 5.0 Na
Cheese 3.4% 12.1 -5.2 0.7 6.2 2.2 -0.2 5.5 Na
Ice Cream 1.5% 5.1 2.0 -0.8 7.2 3.0 0.0 0.0 Na
Other 2.4% 7.7 -2.4 -0.7 3.3 2.9 -0.9 1.1 Na
5-Fruits & Vegetables 16.4% 6.2 -2.1 0.2 4.1 2.9 2.5 1.5 2.0 to 3.0
Fresh fruits 6.8% 4.8 -6.1 -0.6 3.3 1.0 2.0 4.8 2.5 to 3.5
Fresh vegetables 5.9% 5.6 -3.4 2.0 5.6 -5.1 4.7 -1.3 2.0 to 3.0
Proc. fruits & veg. 3.6% 9.5 6.6 -1.3 2.9 3.8 0.3 0.1 2.0 to 3.0
6-Non-alcoholic Bev. 11.3% 4.3 1.9 -0.9 3.2 1.1 -1.0 -0.5 2.0 to 3.0
Juices & non-alc. 8.3% 4.4 2.6 -1.4 1.8 1.1 -0.3 -0.5 Na
Coffee, tea, & other 3.0% 4.2 -0.9 0.1 14.7 1.7 -5.9 -1.8 Na
7-Sugar & Sweets 3.5% 5.5 5.6 2.2 3.3 3.3 -1.7 -0.8 1.5 to 2.5
8-Fats & Oils 2.9% 13.8 2.3 -0.3 9.3 6.1 -1.4 0.1 0.0 to 1.0
9-Other Foodsd 17.8% 5.2 3.7 -0.5 2.3 3.5 0.5 1.0 1.5 to 2.5
Froz./frz-dried
foods
3.4% 4.3 2.8 -1.7 1.5 1.2 -1.2 0.5 Na
Snacks 3.9% 8.1 6.7 1.6 3.5 6.5 1.7 0.6 Na
Sources: Historical data, adjusted for seasonality, for 2008 to 2014 are from BLS for the U.S. City Average
(CPI-U). The 2015 forecast is from ERS, USDA, as of April 24, 2015.
a. Weights are “as a percent of total at-home food expenditures” based on BLS 2011-2012 weights,
December 2014.
b. Flour and prepared flour mixes, breakfast cereals, rice, pasta, and cornmeal.
c. Bread, fresh biscuits, rolls, muffins, cakes, cupcakes, cookies, and other bakery products.
d. Includes soups, spices, seasonings, condiments, sauces, baby food, and other miscellaneous foods.

Consumers and Food Price Inflation
Congressional Research Service R40545 · VERSION 20 · UPDATED 23
Monthly Price Movements by Major Food Categories
Annual averages can cloud over substantial inter-year price movements. As a result, it is
worthwhile to glance over the monthly price indexes by major food group to get a better sense of
the general pattern of retail food price movements across the various food groups.
A “common theme” across the various food product prices in the
following charts is a sharp deflationary move associated with the fiscal
crises of 2008 and subsequent recession, followed by a slow but
sustained upward price trend since 2010, with a flattening of the upward
price movement since 2012 (meat being the exception with its continued
upward trend into 2015).
Also, evidence (as presented in the following charts) suggests that highly
processed foods more consistently adhere to steady, stable upward price
trends dependent on general economic conditions. In contrast, prices for
less-processed retail food products—such as eggs, milk, and fresh fruits
and vegetables—respond far more quickly to changes in both farm
commodity prices and economic conditions.
Figure 14. Monthly Retail Price Indexes: Various Major Food Groups
Source: Seasonally adjusted monthly CPI data, BLS, May 7, 2015.
Monthly price indexes (Figure 14) for the four principal food groups—cereals and bakery
products; meats (including beef, pork, poultry, and seafood); dairy products (including milk,
85
95
105
115
125
135
2007 2008 2009 2010 2011 2012 2013 2014 2015 2016
Cereals & Bakery
Meat
Dairy
Fruit & Vegetables
Line 5
Jan.-Dec.
2008=100

Consumers and Food Price Inflation
Congressional Research Service R40545 · VERSION 20 · UPDATED 24
cheese, ice cream, and other); and fruits and vegetables (including fresh as well as processed)—
reveal variations of the “common theme” of price movement.16
The meat price index has shown the strongest increase since 2008, rising
32% by 2015.
The cereals and bakery product price index has shown the least volatility.
The dairy price index rose declined sharply from mid-2008 through
2009, before moving steadily upward from mid-2009 until 2015.
The fruit and vegetable price index has shown considerable volatility. A
general upward pattern has been punctuated by significant deflationary
movements during 2007, 2009, 2010, late 2011, and again heading into
2015.
Animal product prices (Figure 15 and Figure 16) show a similar pattern of decline between 2008
and 2010, before rising into 2015. Steady U.S. economic growth coupled with relatively tight
animal product supplies sustained retail prices for most animal products through 2014.
Beef and pork prices have shown considerable strength since early 2010
although pork prices temporarily tailed off during 2012-2013. Low cattle
populations are expected to support beef prices through 2015. However,
the rapid expansion of the hog sector in 2013 and 2014 has pushed
supply past current demand, thus triggering lower prices heading into
2015.
Poultry prices have been more stable and have ticked upward since late
2010, helped in part by high beef prices and consumer switching of meat
choices.
Perhaps the most dramatic and volatile of the individual animal product
price indexes has been eggs (Figure 15), which underwent a severe
deflationary period from mid-2008 through 2009 before growing steadily
into 2015. Stronger egg production coupled with the global economic
crisis dampened prices starting in the latter half of 2008. General
economic growth has pulled egg prices upward steadily since mid-2009,
just surpassing their mid-2008 peak in June 2013.
The individual components of the dairy group (Figure 16) followed distinctly different patterns.
Cheese and fresh milk prices exhibited deflation from mid-2008 until late 2009 due to initially
tight supplies and expensive feed costs, followed by increased supplies and a sharp drop in
demand. A resumption of U.S. and global economic growth (albeit slow) has helped sustain price
increases in late 2009. The dairy sector experienced a slow down with the stalling economy in
2012 and 2013 before surging upward in 2014 as the general economy surged.
The overall dairy index mimics closely the cheese index since cheese is
the principal use category and accounts for much of dairy price
formation.
Prices for highly processed ice cream showed a far more stable pattern
and have generally reflected overall economic conditions.
16 Note that these statistics (based on the change in monthly price indexes) differ from the statistics reported in Table 4,
where the inflation rates are calculated using the difference from annual averages rather than monthly averages.

Consumers and Food Price Inflation
Congressional Research Service R40545 · VERSION 20 · UPDATED 25
Figure 15. Monthly Retail Price Indexes: Beef, Pork, Poultry, and Eggs
Source: Seasonally adjusted monthly CPI data, BLS, May 7, 2015.
Figure 16. Monthly Retail Price Indexes: Dairy, Fresh Milk, Cheese, and Ice Cream
Source: Seasonally adjusted monthly CPI data, BLS, May 7, 2015.
75
100
125
150
2007 2008 2009 2010 2011 2012 2013 2014 2015 2016
Beef
Pork
Poultry
Eggs
Jan. - Dec.
2008 = 100
80
90
100
110
120
2007 2008 2009 2010 2011 2012 2013 2014 2015 2016
Dairy
Fresh Milk
Cheese
Ice Cream
Jan. - Dec.
2008 = 100

Consumers and Food Price Inflation
Congressional Research Service R40545 · VERSION 20 · UPDATED 26
Figure 17. Monthly Retail Price Indexes: Fruits and Vegetables
Source: Seasonally adjusted monthly CPI data, BLS, May 7, 2015.
Similar to ice cream, the price index for processed fruits and vegetables
(Figure 17) has tended to follow general economic conditions.
In contrast, the price indexes for both fresh fruit and fresh vegetables
have exhibited greater volatility, incorporating aspects of both the
general economy as well as supply and demand conditions for the raw
commodities.
The ongoing drought in California is likely to have a major impact on the
state’s agricultural production. Long-term moisture deficits across most
of the state remain at near-record levels. Because California is the major
U.S. producer of fruit, vegetables, tree nuts, and dairy, the drought has
potential implications for U.S. supplies and prices of affected products.
USDA currently projects combined U.S. fruit and vegetable prices to rise
by 2% to 3% in 2015, with fresh fruits projected up 2.5% to 3.5%.17
The price indexes for highly processed snacks, sugar and sweets, and fats
and oils (Figure 18) are similar to other processed food products or
products with inelastic demand—they tend to follow general economic
conditions.
Again, the prepared-food group (which includes frozen and freeze-dried
prepared foods) and the carbonated beverages indexes tend to follow the
swings in consumer demand as reflected by the general economy (Figure
19).
17 For more information see “California Drought: Farm and Food Impacts,” ERS, USDA, at
http://www.ers.usda.gov/topics/in-the-news/california-drought-farm-and-food-impacts.aspx.
85
90
95
100
105
110
115
2007 2008 2009 2010 2011 2012 2013 2014 2015 2016
Fruit & Vegetables
Processed Fruits & Veg.
Fresh Fruit
Fresh Vegetables
Jan. - Dec.
2008 = 100

Consumers and Food Price Inflation
Congressional Research Service R40545 · VERSION 20 · UPDATED 27
Carbonated beverages have shown greater price inflation since 2010
compared with prepared foods which are more dependent on the U.S.
market.
Coffee prices are strongly linked to international supply and demand
conditions and have exhibited greater volatility as a result.
Figure 18. Monthly Retail Price Indexes: Sugar, Fat & Oils, and Snacks
Source: Seasonally adjusted monthly CPI data, BLS, May 7, 2015.
Figure 19. Monthly Retail Price Indexes: Coffee, Carbonated Beverages,
and Prepared Foods
Source: Seasonally adjusted monthly CPI data, BLS, May 7, 2015.
80
90
100
110
120
130
2007 2008 2009 2010 2011 2012 2013 2014 2015 2016
Sugar & Sweets
Fats & Oils
Snacks
Jan. - Dec.
2008 = 100
90
95
100
105
110
115
120
125
2007 2008 2009 2010 2011 2012 2013 2014 2015 2016
Carbonated Beverages
Coffee
Prepared Foods
Jan. - Dec.
2008 = 100
Consumers and Food Price Inflation
Congressional Research Service R40545 · VERSION 20 · UPDATED 28
Effect of Retail Price Changes As stated earlier in this report, lower-income consumers who spend a significant share of their
household budget on food are likely to be impacted more severely by rising food prices, to be
more responsive to price changes, and to be forced to make more difficult budgetary tradeoffs
than high-income consumers with lower food budget shares.
The United States has several domestic programs that are designed to help consumers meet their
household food and nutrition needs during periods of economic downturn when household
purchasing power is diminished. In addition, the United States has a history of providing
significant international food aid during periods of famine or food shortages throughout the
world. Both domestic and international U.S. food assistance programs are directly influenced by
food price inflation.
Price Inflation Escalator Clauses Often Respond with a Lag
Many wages and salaries, as well as federal programs (including several domestic food assistance
programs), are linked to price inflation through escalation clauses in order to retain their
purchasing power. For households where income does not keep up with price inflation, declines
in purchasing power are both real and immediate. However, even for households with escalation
clauses that adjust incomes or benefits for price inflation, there is a time lag between the time the
price inflation is measured and the time when the wage or program benefit is adjusted upward to
compensate. As a result, for households with incomes or federal benefits linked to price inflation
escalators, higher prices can cause a short-term decline in real purchasing power. This is most
meaningful when prices are accelerating. When prices are falling, as during a deflationary period,
consumers with fixed incomes realize gains in real income (provided that they are not subject to
wage cuts or layoffs).
Federal Spending for Domestic Food Assistance Programs18
The U.S. Department of Agriculture (USDA) administers several domestic food and nutrition
programs that provide a nutritional safety net for millions of low-income households, as well as
schoolchildren and nutritionally vulnerable groups such as pregnant and/or lactating mothers. The
past decade has seen a tremendous expansion in use of USDA’s food and nutrition assistance
programs—since FY2000, expenditures for food and nutrition assistance have more than tripled
(Figure 20).
Federal expenditures totaled $109.2 billion in FY2013 and marked the 13th consecutive year in
which food and nutrition assistance expenditures exceeded the previous historical record.19 Total
outlays declined slightly to $103.6 billion in FY2014.
18 For more information on the domestic food and nutrition programs discussed in this section, please contact Randy
Alison Aussenberg, Analyst in Social Policy. For information on specific programs see CRS Report R42353, Domestic
Food Assistance: Summary of Programs, by Randy Alison Aussenberg and Kirsten J. Colello.
19 ERS, USDA, The Food Assistance Landscape, FY2012 Annual Report, Economic Information Bulletin No. 109,
March 2013, at http://www.ers.usda.gov/publications/eib-economic-information-bulletin/eib109.aspx.

Consumers and Food Price Inflation
Congressional Research Service R40545 · VERSION 20 · UPDATED 29
Figure 20. Annual Outlays for USDA Food and Nutrition Programs Since 1970
Source: USDA, Food and Nutrition Service, Program Data, downloaded on May 7, 2015.
USDA’s expenditures for food and nutrition assistance programs can be grouped into five main
categories: (1) the Supplemental Nutrition Assistance Program (SNAP); (2) school food programs
(including the National School Lunch Program and the School Breakfast Program); (3) the
Special Supplemental Nutrition Program for Women, Infants, and Children (WIC); (4) the Child
and Adult Care Food Program; and (5) food distribution programs including Nutrition Services
Incentive Program (NSIP), Food Distribution on Indian Reservations (FDPIR), Commodity
Supplemental Food Program (CSFP), and the Emergency Food Assistance Program (TEFAP).
SNAP is the largest of these programs and accounted for 73% of federal food and nutrition
assistance spending in FY2014. SNAP provides monthly benefits for eligible participants to
purchase food items at authorized food stores.
A substantial portion of spending on food and nutrition assistance programs is in the form of
entitlements (i.e., mandatory spending) whereby eligibility and participation rates govern outlays.
For mandatory programs, food price inflation leads to more spending on domestic assistance
efforts. Increasing prices encourage those who are eligible, but not participating, to enroll. They
also translate directly (albeit with a time lag) into higher benefit payments and per-meal subsidies
for “entitlement” programs in which benefits are indexed to food-price inflation. However, many
of these programs also include discretionary components where outlays are determined through
the annual appropriations process. Increasing prices place pressure on appropriators to provide
more funding to support caseloads for “discretionary” programs like the WIC program.
The 2008-2009 global economic crisis—with its higher unemployment, income loss, and lower
effective household purchasing power—following on the heels of higher retail prices, brought on
higher participation rates and greater costs for domestic food aid programs. Although the U.S.
economy resumed growth during 2010, unemployment ranks have been slow to follow. This is
reflected in high SNAP participation levels, which hit an all-time high of 47.8 million (or 15.2%
$0
$20
$40
$60
$80
$100
1970 1980 1990 2000 2010
Summer Food Programs
Food Distr Programs
Child-Adult Care Programs
WIC
School Food Programs
SNAP

Consumers and Food Price Inflation
Congressional Research Service R40545 · VERSION 20 · UPDATED 30
of the U.S. population) in December 2012.20 SNAP monthly benefit costs have grown from $2.4
billion in May 2006 to a peak of $6.5 billion in November 2012, with average per-person monthly
benefit spending rising from $93 to $135.73. Other domestic food assistance programs have seen
similar increases in participation (and costs).
Supplemental Nutrition Assistance Program (SNAP, formerly Food Stamps)
The SNAP, with over $74.1 billion in outlays in FY2014,21 is the largest of the federally
supported domestic food assistance programs.22 SNAP benefits normally are indexed annually
(each October) for changes in the cost of USDA’s least costly food plan, the “Thrifty Food Plan”
(TFP). However, the increases are lagged by three months in reflecting rising food costs—they
were (by law) based on prices from the immediately previous June. Thus, there is a three-month
gap between the calculation of the price inflation index in June and its use to adjust SNAP
benefits in October.
In recognition of the lag in the inflation index for SNAP benefits, increased food needs, and
reduced income, the 2009 American Recovery and Reinvestment Act (ARRA; P.L. 111-5)
provided additional support for domestic food assistance programs: an estimated $11.5 billion for
FY2009-FY2010 and $20.8 billion through FY2019.23 SNAP was the primary recipient of this
new money, most of which is being used to pay for added benefits, loosened eligibility standards,
and administrative costs.
However, these increased SNAP benefits were reduced as part of P.L. 111-226 (a law providing
funding for education jobs and Medicaid) and were further reduced by child nutrition
reauthorization legislation (the Healthy, Hunger-Free Kids Act of 2010; P.L. 111-296).24 As a
result of these cuts, in November 2013 SNAP benefits will revert to what basic SNAP law directs
(i.e., as calculated using annual food-price inflation).
Child Nutrition
Federally supported child nutrition programs (e.g., the National School Lunch Program, the
School Breakfast Program, the Special Milk Program, Child and Adult Care Food Program, and
the Summer Food Service Program) and initiatives reach over 30 million children annually. In
FY2014, federal spending on these programs totaled nearly $20 billion, the second-largest federal
commitment to domestic food assistance.25 The basic goals of federal child nutrition programs are
to improve children’s nutrition, increase lower-income children’s access to nutritious meals and
snacks, and help support the agricultural economy.
Federal payments for meals and snacks served to children are indexed every July to food-price
changes reflected in the Food-Away-from-Home component of the CPI over the 12-month period
20 USDA, Food and Nutrition Service (FNS), Supplemental Nutrition Assistance Program, April 10, 2015, at
http://www.fns.usda.gov/pd/snapmain.htm.
21 Ibid.
22 See CRS Report R42505, Supplemental Nutrition Assistance Program (SNAP): A Primer on Eligibility and Benefits,
by Randy Alison Aussenberg.
23 For more information, see CRS Report R40160, Agriculture, Nutrition, and Rural Provisions in the American
Recovery and Reinvestment Act (ARRA) of 2009, coordinated by Jim Monke.
24 For more information see CRS Report R41374, Reducing SNAP (Food Stamp) Benefits Provided by the ARRA: P.L.
111-226 and P.L. 111-296, by Randy Alison Aussenberg, Jim Monke, and Gene Falk.
25 USDA, FNS, Program Data—Child Nutrition Tables, at http://www.fns.usda.gov/pd/cnpmain.htm.

Consumers and Food Price Inflation
Congressional Research Service R40545 · VERSION 20 · UPDATED 31
ending each May. Commodity support also is indexed annually based on the Bureau of Labor
Statistics’ Producer Price Index for five major food components (cereal and bakery products,
meats, poultry and fish, dairy products, processed fruits and vegetables, and fats and oils).
The WIC Program
Unlike the SNAP and child nutrition programs, which receive mandatory funding, the WIC
program is funded from discretionary sources. Spending depends on annual appropriations, based
largely on estimates of participation and the cost of the food packages that are purchased with
WIC vouchers. In FY2014, $6.2 billion was spent on WIC, including $4.3 billion in food costs
and $1.9 billion in nutrition service and administrative costs.26 The average monthly food cost per
participant was $43.65.
The value of benefits is not indexed to inflation, per se. Rather, WIC vouchers are redeemable at
whatever the participating retailer charges for the items covered by the vouchers, which differ
according to the type of recipient (e.g., pregnant mother, infant, and child). As a result, the cost of
WIC vouchers reflect food price changes without the time lag built into other inflation-indexed
nutrition programs. Just as important, WIC vouchers are highly specific as to the food items they
cover and have a relatively heavy emphasis on certain types of food—for example, dairy items
and infant formula are major components.
In recent years, the cost of WIC food vouchers has varied a great deal, largely because of changes
in dairy-related food prices. The average per-participant monthly cost of vouchers has ranged
from $33.06 in FY2000 to $46.69 in FY2011. However, the annual percentage increase has
actually declined in some years (FY2005 and FY2006) and increased substantially in other years.
Given this significant volatility, it is difficult to produce specific estimates of the effect of food
price inflation on WIC program costs. Although WIC spending is discretionary, Congress has
historically shown a willingness to appropriate whatever amounts are necessary to meet costs
imposed by increased participation or food costs.
Additional Commodity Assistance Programs
USDA operates several additional food assistance programs targeting low-income or vulnerable
populations. The Emergency Food Assistance Program (TEFAP) and meal service programs
under the Older Americans Act (e.g., “meals-on-wheels” and meals served to seniors in
congregate meal settings) provide key food assistance support for vulnerable groups. The
Commodity Supplemental Food Program (CSFP) provides foods purchased by USDA to low-
income infants and children up to age six, low-income pregnant and postpartum women, and to
low-income senior citizens. The Senior Farmers’ Market Nutrition Program (SFMNP) provides
coupons to low-income seniors that can be exchanged for fresh, nutritious, unprepared, locally
grown fruits, vegetables, and herbs at farmers’ markets, roadside stands, and community-
supported agriculture programs. Like WIC, these programs are discretionary, and rising need and
higher food prices have placed pressure on appropriators to add to federal funding.
Foreign Food Aid
USDA’s international food and nutritional assistance activities are funded by discretionary
appropriations—primarily under the Food for Peace Act (P.L. 83-480) as amended by the 2014
26 USDA, FNS, WIC Program Data at http://www.fns.usda.gov/pd/wicmain.htm.

Consumers and Food Price Inflation
Congressional Research Service R40545 · VERSION 20 · UPDATED 32
farm bill (Agricultural Act of 2014; P.L. 113-79).27 Average annual spending on U.S. international
food aid programs has average $2.6 billion since FY2006.
Food aid usually takes the form of basic food grains—such as wheat, sorghum, and corn—and
vegetable oil, as well as blended and/or processed food products. Because foreign food aid is a
budget value and not a food volume, its effective “purchase power” for acquiring U.S.
agricultural commodities in domestic wholesale markets for delivery to foreign countries is
diminished by food price hikes without additional appropriations. Also, higher energy costs
increase the shipping costs to move food purchases and food aid to foreign countries further
limiting the budgetary purchase power of food aid dollars. Unlike some domestic nutrition
programs, foreign food aid does not have an escalation clause to adjust for changing costs.
U.S. food aid also has certain delivery requirements that add to the program’s vulnerability to
general price inflation. Ocean transport of government-generated shipments is governed by the
Cargo Preference Act, P.L. 83-644 (August 26, 1954). This act contains permanent legislation
requiring that at least 50% of the volume of U.S. agricultural commodities financed under U.S.
food aid programs ship on U.S.-flag vessels. Excess costs are usually incurred because freight
rates on U.S.-flag vessels are generally higher than on foreign commercial ships.
There is growing interest from the Administration and certain Members of Congress, but also
from the international development community, for the United States to switch its food assistance
program over to cash rather than kind.28 Such a switch would avoid the costly effects that
domestic food price inflation has on the food aid budget, while sidestepping completely the
obligation to ship food aid on more expensive U.S.-flagged vessels.
Author Information
Randy Schnepf
Specialist in Agricultural Policy
Disclaimer
This document was prepared by the Congressional Research Service (CRS). CRS serves as nonpartisan
shared staff to congressional committees and Members of Congress. It operates solely at the behest of and
under the direction of Congress. Information in a CRS Report should not be relied upon for purposes other
than public understanding of information that has been provided by CRS to Members of Congress in
connection with CRS’s institutional role. CRS Reports, as a work of the United States Government, are not
subject to copyright protection in the United States. Any CRS Report may be reproduced and distributed in
its entirety without permission from CRS. However, as a CRS Report may include copyrighted images or
27 7 U.S.C. 1691 et seq. For more information, see CRS Report R41072, U.S. International Food Aid Programs:
Background and Issues.
28 See CRS Report R41072, U.S. International Food Aid Programs: Background and Issues, for a discussion.

Consumers and Food Price Inflation
Congressional Research Service R40545 · VERSION 20 · UPDATED 33
material from a third party, you may need to obtain the permission of the copyright holder if you wish to
copy or otherwise use copyrighted material.