Industry Trends and Marketing Strategies for the Hardwood Lumber Industry
58
Industry Trends and Marketing Strategies for the Hardwood Lumber Industry Great Lakes Forest, Industry Products, and Resources Summit Scott Bowe June 6, 2012
Transcript of Industry Trends and Marketing Strategies for the Hardwood Lumber Industry

Industry Trends and Marketing Strategies for the Hardwood Lumber
Industry
Great Lakes Forest, Industry Products, and Resources Summit
Scott Bowe
June 6, 2012
Outline
• Status of the hardwood industry
• What are the current marketing strategies employed by the hardwood industry?
• Development of Life Cycle Analysis (LCA) and Environmental Products Declarations (EPDs)

Status of the Hardwood Industry

Hardwood Lumber Markets
-87%
5% 9% 6% 6% 15% 47% 12%
2010 market share:
Data source: Hardwood Market Report. 2009, 2011.

User Group 1972 1982 1992 2002
Industrial 32% 40% 34% 37%
Appearance-based
68% 60% 66% 63%
Hardwood Lumber Market Share
Source: W. Luppold, U.S. Forest Service

User Group 2005 2006 2007 2008 2009 2010
Industrial 41% 42% 44% 52% 60% 59%
Appearance-based
59% 58% 56% 48% 40% 41%
Recent Market Shifts

Hardwood Lumber Markets
-87%
5% 9% 6% 6% 15% 47% 12%
2010 market share:
Data source: Hardwood Market Report. 2009, 2011.
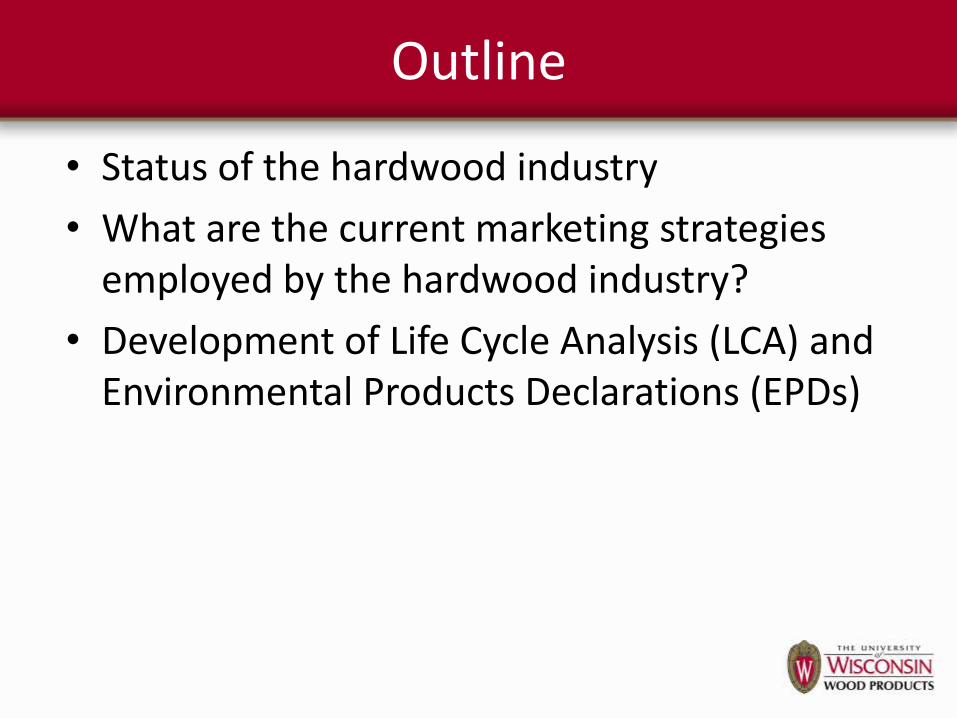
What about softwood lumber?
39%
31%
5%
25%
New residential
Repair/Remodeling
Nonresdiential
Industrial
Most softwood lumber goes to residential construction (70%)

Eastern Hardwood Lumber Production
6
7
8
9
10
11
12
13
14
91 92 93 94 95 96 97 98 99 00 01 02 03 04 05 06 07 08 09 10
Bill
ion
bo
ard
fee
t
Source: W. Luppold, U.S. Forest Service
Four years of decline from 1999-2003 (this last happened in the 1930’s)
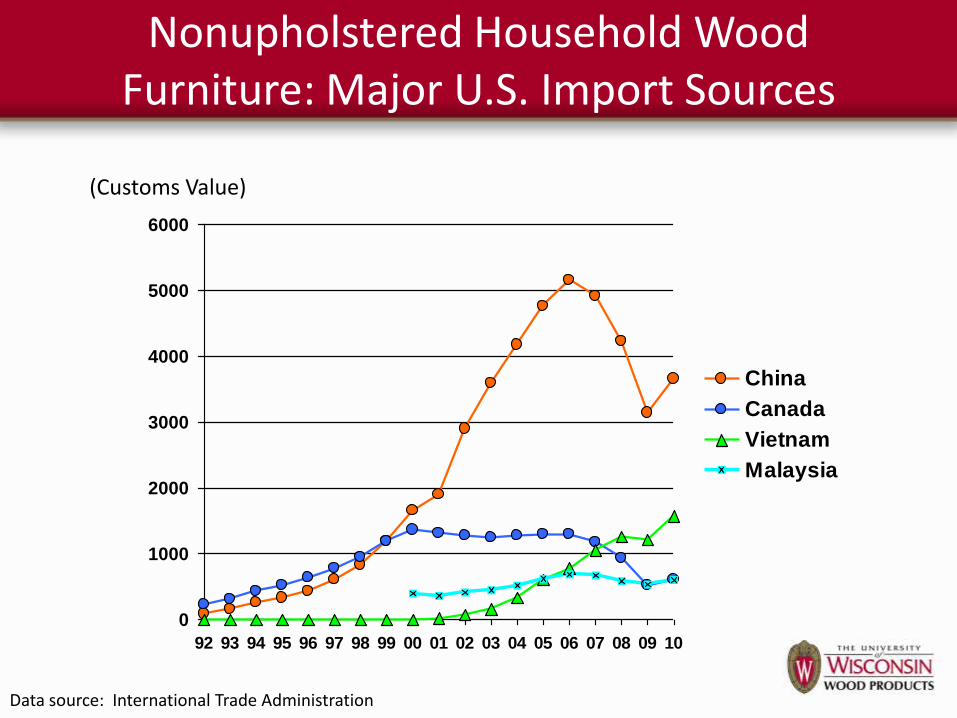
Nonupholstered Household Wood Furniture: Major U.S. Import Sources
0
1000
2000
3000
4000
5000
6000
92 93 94 95 96 97 98 99 00 01 02 03 04 05 06 07 08 09 10
China
Canada
Vietnam
Malaysia
(Customs Value)
Data source: International Trade Administration

*These market shares are conservative because some imported components and finished furniture is included in the domestic shipments
Market share of imports in the U.S.*
0%
10%
20%
30%
40%
50%
60%
19921994
19961998
20002002
20042006
2008
Kitchen cabinets Upholstered HH Furniture
Data source: U.S. Census Bureau, Intl. Trade Admin.
Consumption = value of shipments + imports – exports Import share = imports/consumption
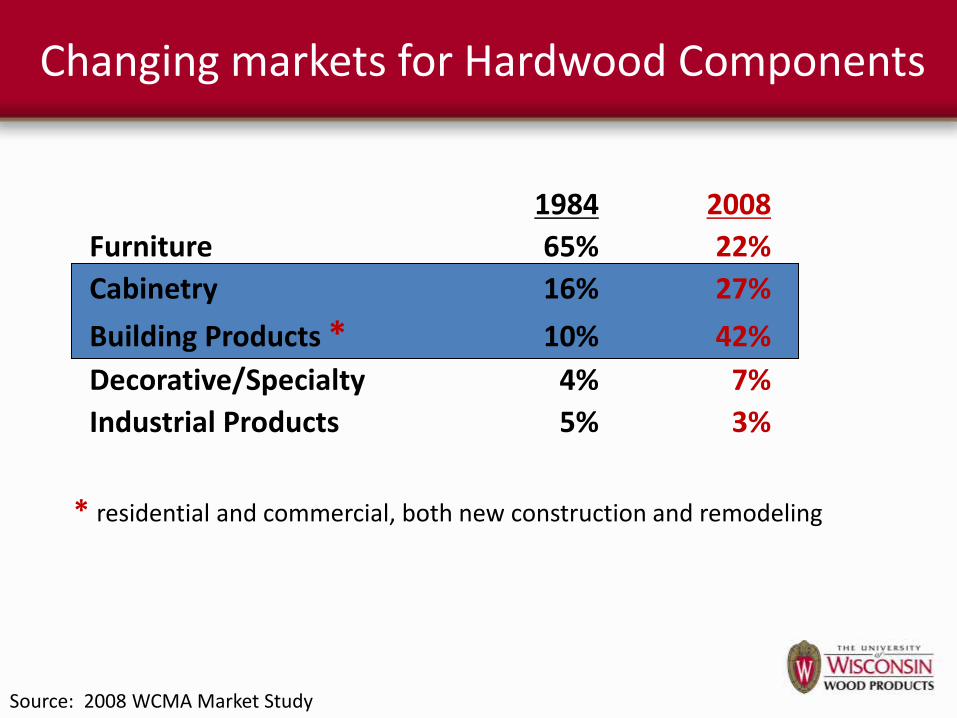
Changing markets for Hardwood Components
1984 2008
Furniture 65% 22%
Cabinetry 16% 27%
Building Products * 10% 42%
Decorative/Specialty 4% 7%
Industrial Products 5% 3%
Source: 2008 WCMA Market Study
* residential and commercial, both new construction and remodeling

Value of private U.S. construction, 2002-2012
The problem with that . . .
Data source: U.S. Census Bureau, Annual Value of Private Construction Put in Place

0
20
40
60
80
100
120
140
160
180
90 92 94 96 98 00 02 04 06 08 10
Year
tho
usan
d e
mp
loyees (
all)
Wood household furniture
Wood kitchen cabinets &
countertops
Data source: Bureau of Labor Statistics, 2009
Employment Trends
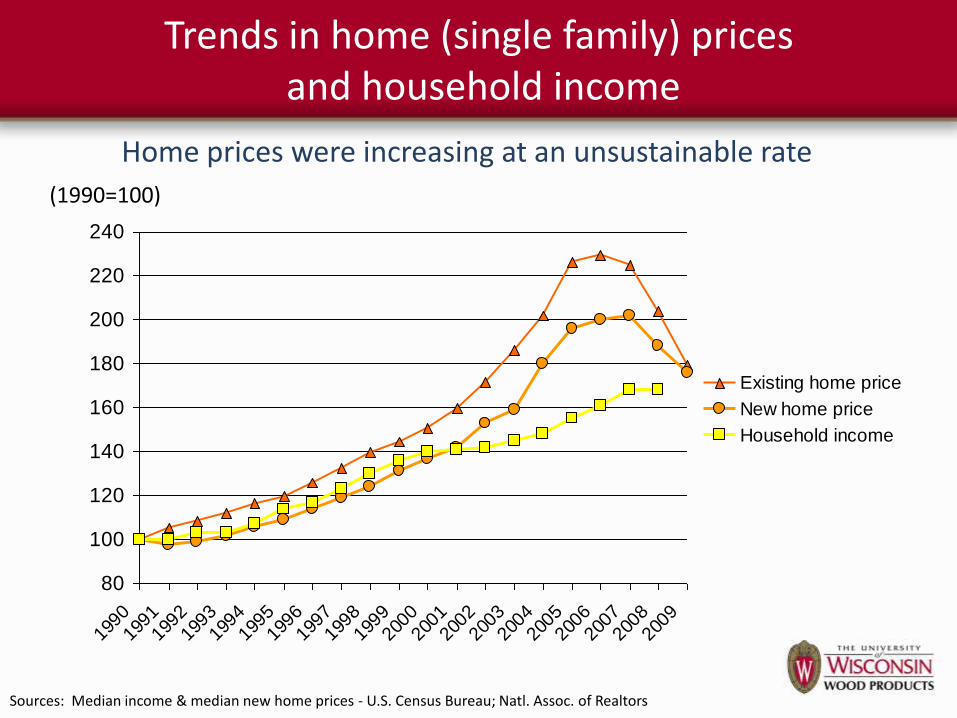
Trends in home (single family) prices and household income
80
100
120
140
160
180
200
220
240
1990
1991
1992
1993
1994
1995
1996
1997
1998
1999
2000
2001
2002
2003
2004
2005
2006
2007
2008
2009
Existing home price
New home price
Household income
Home prices were increasing at an unsustainable rate
(1990=100)
Sources: Median income & median new home prices - U.S. Census Bureau; Natl. Assoc. of Realtors

New and existing home inventories
3
4
5
6
7
8
9
10
11
12
13
2000
2001
2002
2003
2004
2005
2006
2007
2008
2009
2010
2011
2012
New
Existing
Sources: New homes - U.S. Census Bureau; Existing homes – Natl. Assoc. or Realtors
This metric does not count the “shadow” inventory of seriously delinquent, foreclosed, and bank-owned properties, which adds to supply.
Months supply
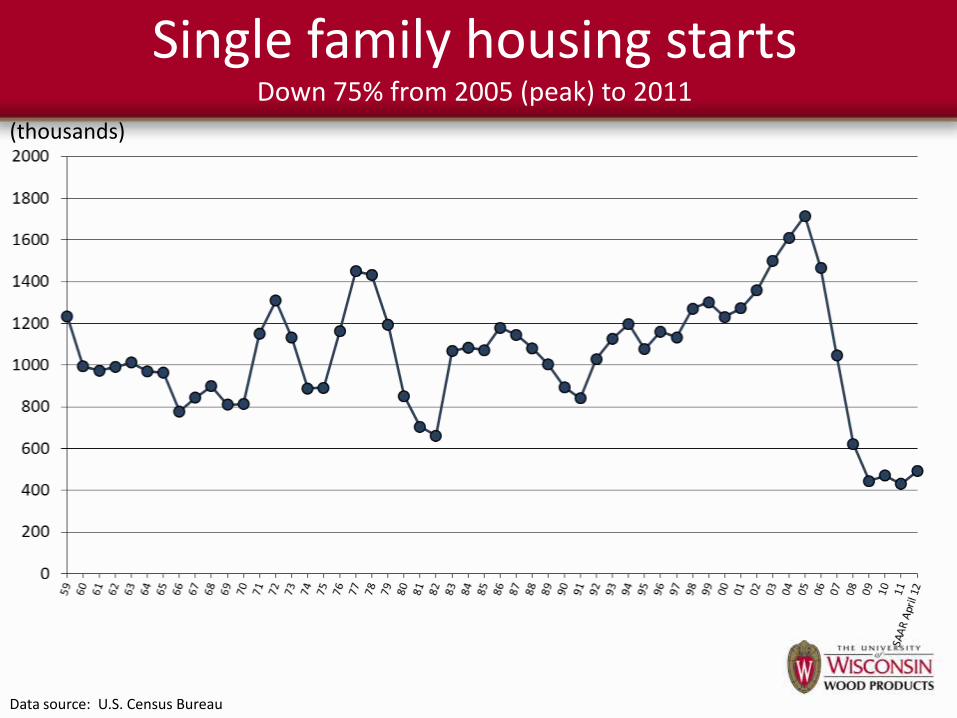
Single family housing starts Down 75% from 2005 (peak) to 2011
(thousands)
Data source: U.S. Census Bureau
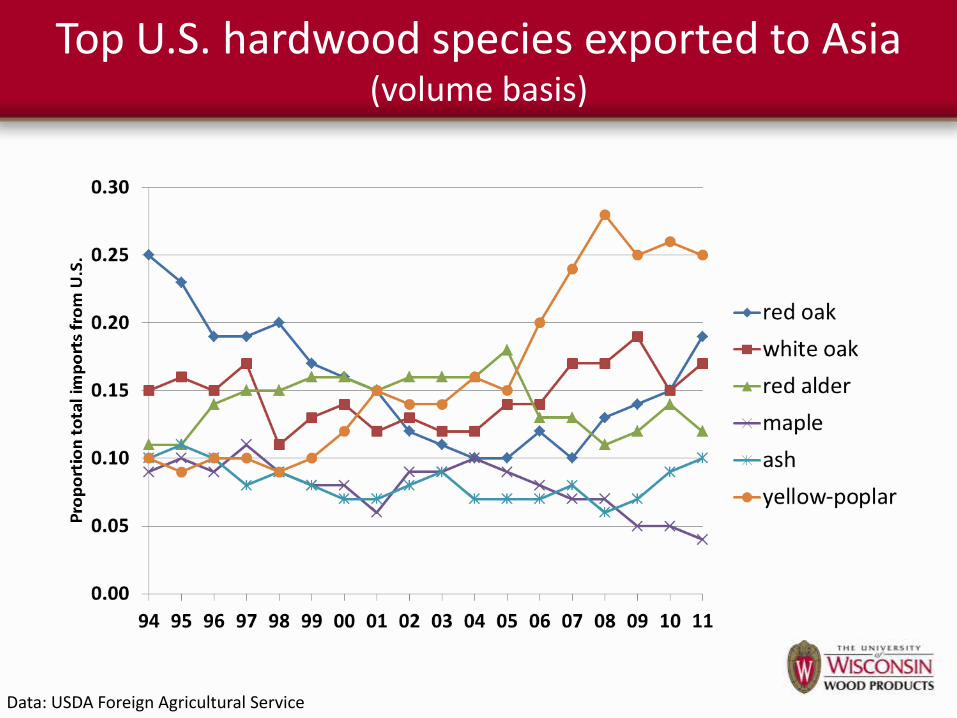
Top U.S. hardwood species exported to Asia (volume basis)
Data: USDA Foreign Agricultural Service

U.S. hardwood lumber exports (top 5 destinations)
Data: USDA Foreign Agricultural Service
~70% of total
Million $
110 other trading partners account for the remaining 30%
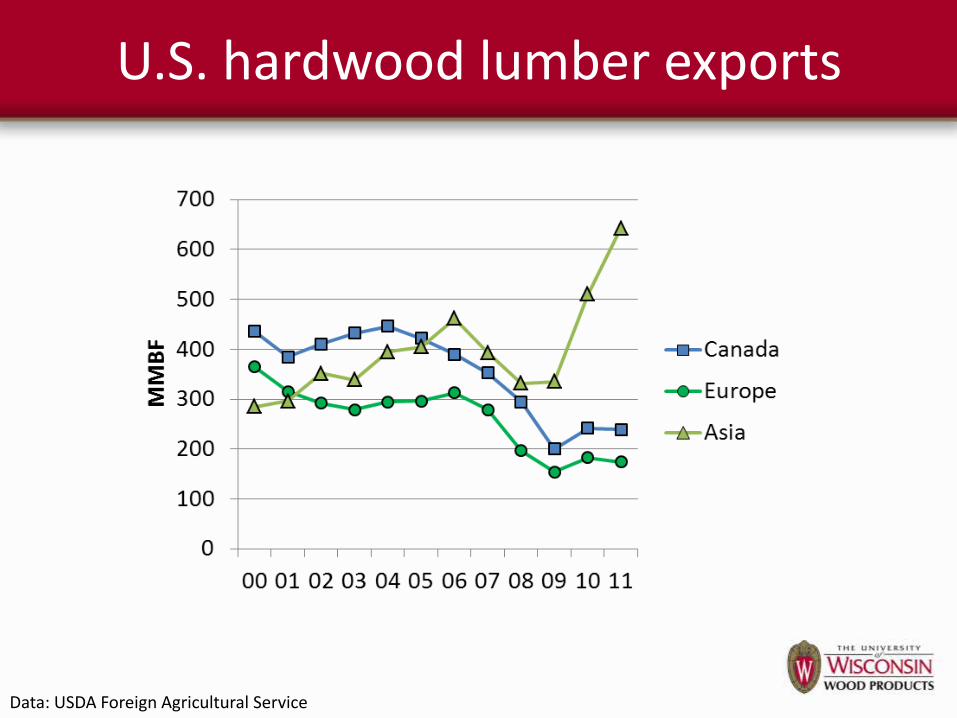
U.S. hardwood lumber exports
Data: USDA Foreign Agricultural Service
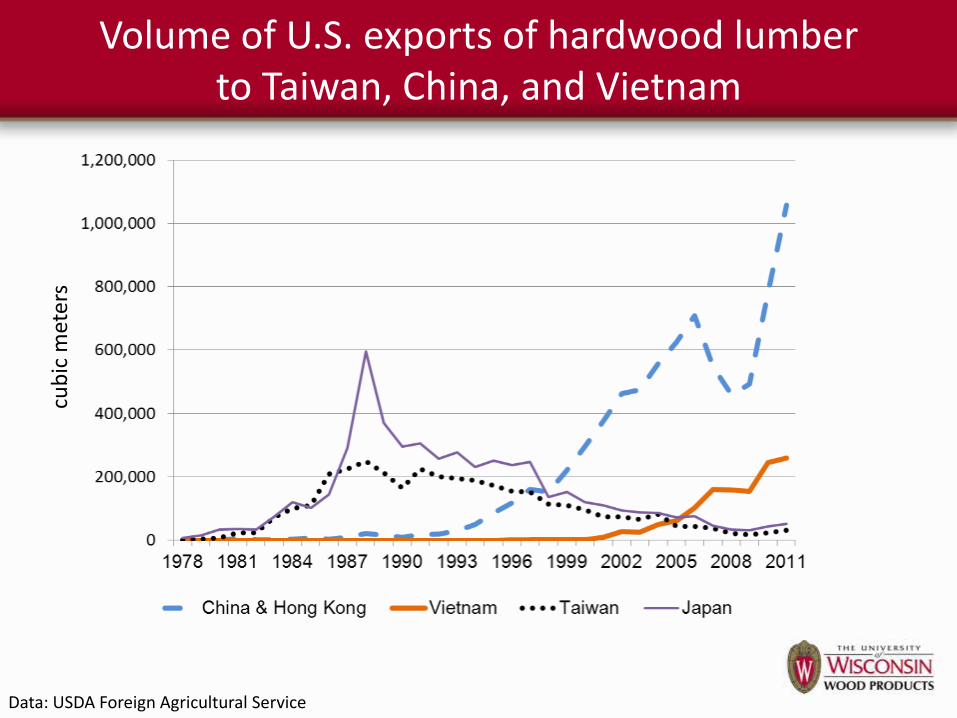
Volume of U.S. exports of hardwood lumber to Taiwan, China, and Vietnam
Data: USDA Foreign Agricultural Service
cub
ic m
eter
s

Current Marketing Strategies

Label Fatigue


“Eco” Ceramic
Tiles....
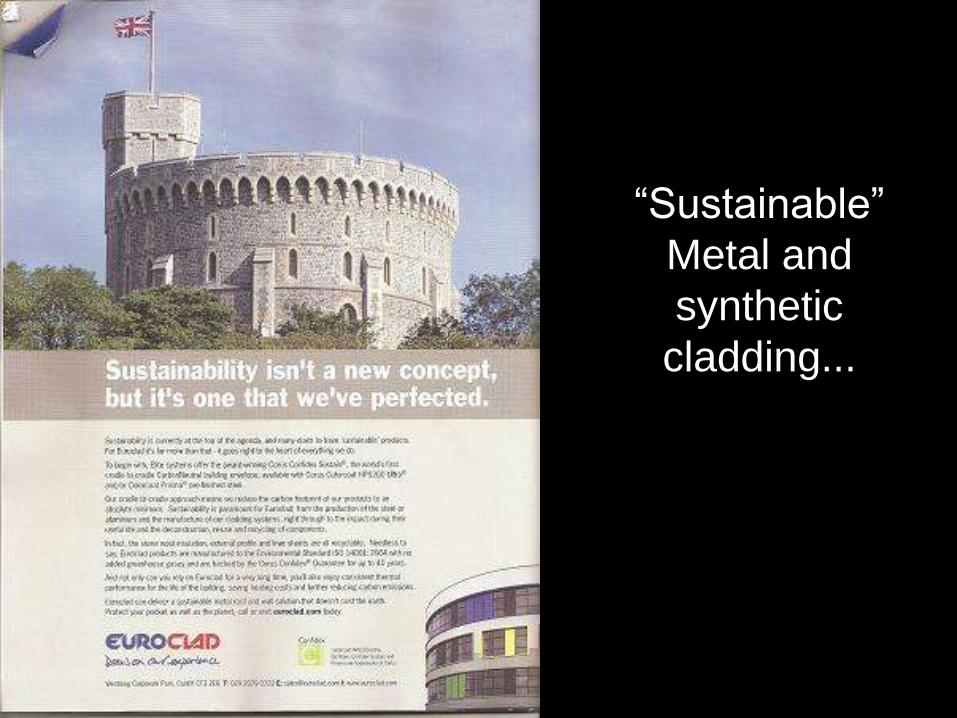
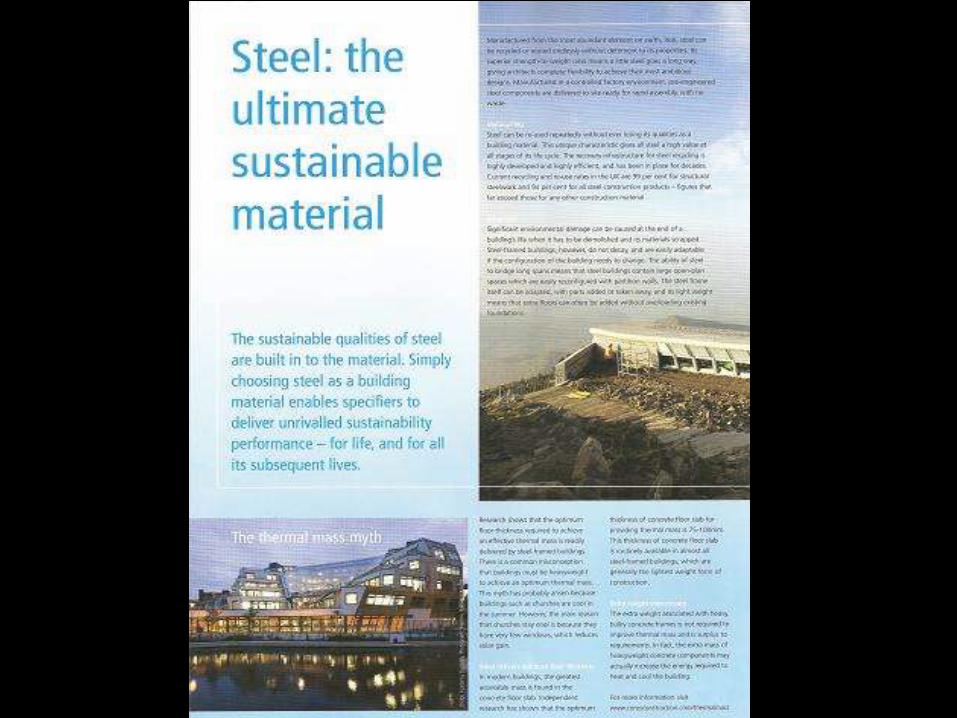
“Sustainable”
Metal and
synthetic
cladding...

Strip mining for iron ore…
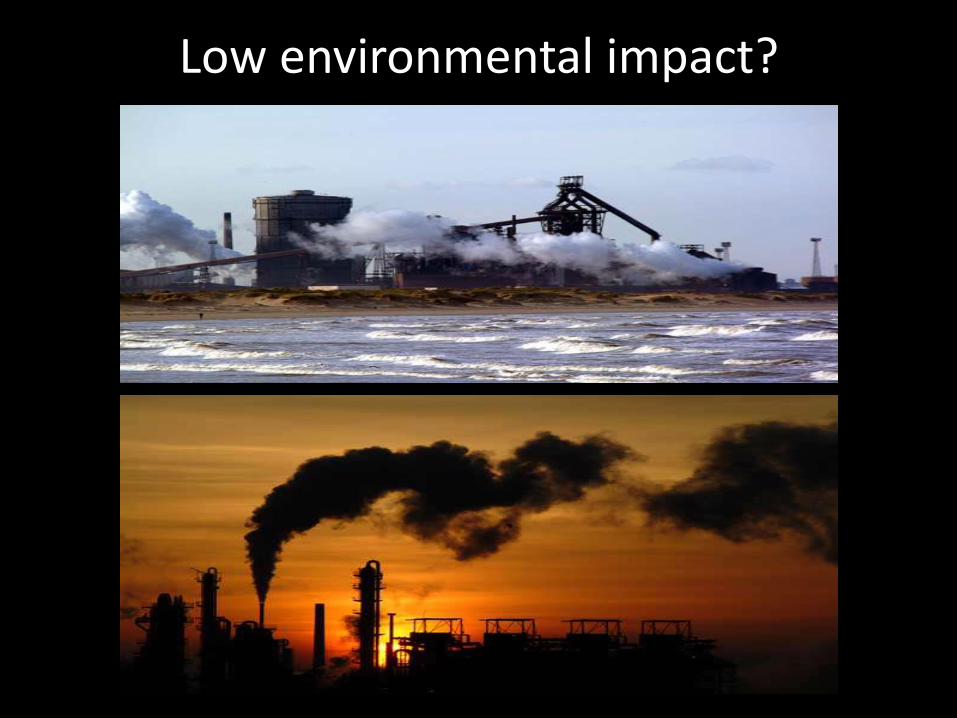
Low environmental impact?

Marketing Strategies
• What marketing strategy will…
– Leveling the playing field for all materials?
– Appeal to a common environmental concern?
– Scientifically demonstrate wood’s small environmental footprint?


What is Life Cycle Science?
• Careful accounting of all inputs and outputs during a product’s manufacture and use
• Other terms: Life Cycle Analysis, Life Cycle Assessment, Life Cycle Inventory, Life Cycle Science, etc.
• Life Cycle Science standards set by International Organization for Standardization (ISO) – ISO 14040 Standard

What is Life Cycle Science?
• Environmental Factors: – Raw Material Resources
• Wood
– Energy • Fossil based • Biomass
– Emissions • Air • Water • Landfilled
• Trace the product and co-products from the Cradle to Grave

Complete Life Cycle from Forest to Final Wood Disposal
(Source: Ritter, Michael A.; Skog, Kenneth; and Bergman, Richard. 2011. Science Supporting the Economic and Environmental Benefits of Using Wood and Wood Products in Green Building
Construction. General Technical Report FPL-GTR-206. Madison, WI: U.S. Department of Agriculture, Forest Service, Forest Products Laboratory. 9 p)
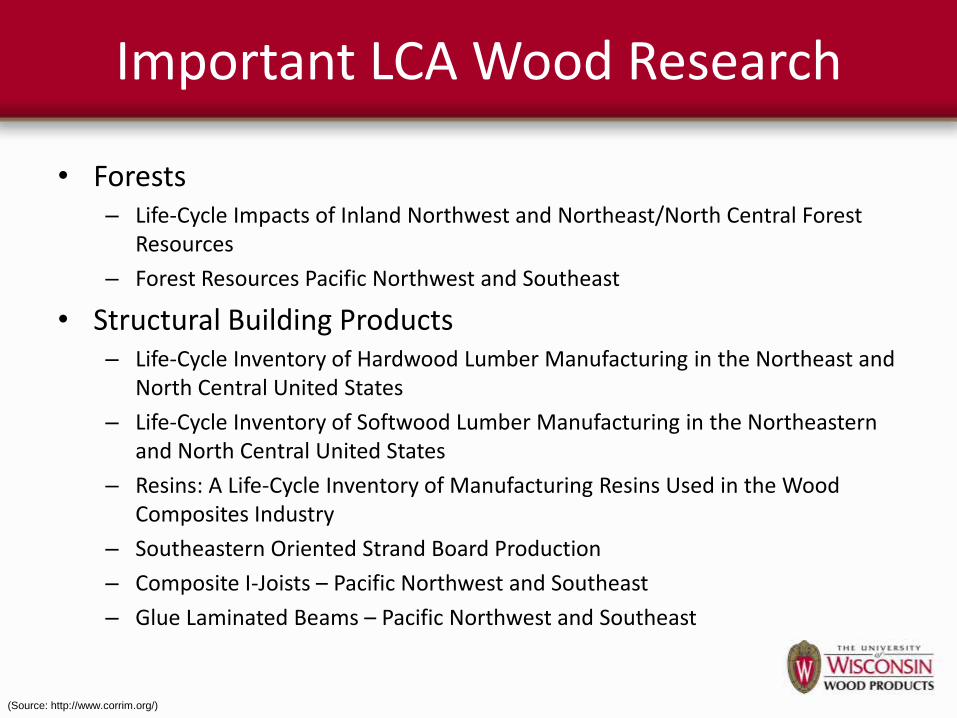
Important LCA Wood Research
• Forests – Life-Cycle Impacts of Inland Northwest and Northeast/North Central Forest
Resources
– Forest Resources Pacific Northwest and Southeast
• Structural Building Products – Life-Cycle Inventory of Hardwood Lumber Manufacturing in the Northeast and
North Central United States
– Life-Cycle Inventory of Softwood Lumber Manufacturing in the Northeastern and North Central United States
– Resins: A Life-Cycle Inventory of Manufacturing Resins Used in the Wood Composites Industry
– Southeastern Oriented Strand Board Production
– Composite I-Joists – Pacific Northwest and Southeast
– Glue Laminated Beams – Pacific Northwest and Southeast
(Source: http://www.corrim.org/)

Important LCA Wood Research
• Interior Finish Products – Life-Cycle Inventory of Solid Strip Hardwood Flooring in the Eastern United
States
– Life-Cycle Inventory of Hardwood Lumber Manufacturing in the United States
– Life-Cycle Inventory of Manufacturing Prefinished Engineered Wood Flooring in the Eastern United States
• Building Assemblies – Design of Residential Building Shells – Minneapolis and Atlanta
– Environmental Impacts of a Single Family Building Shell – From Harvest to Construction
– Life-Cycle Assessments of Subassemblies Evaluated at the Component Level
(Source: http://www.corrim.org/)
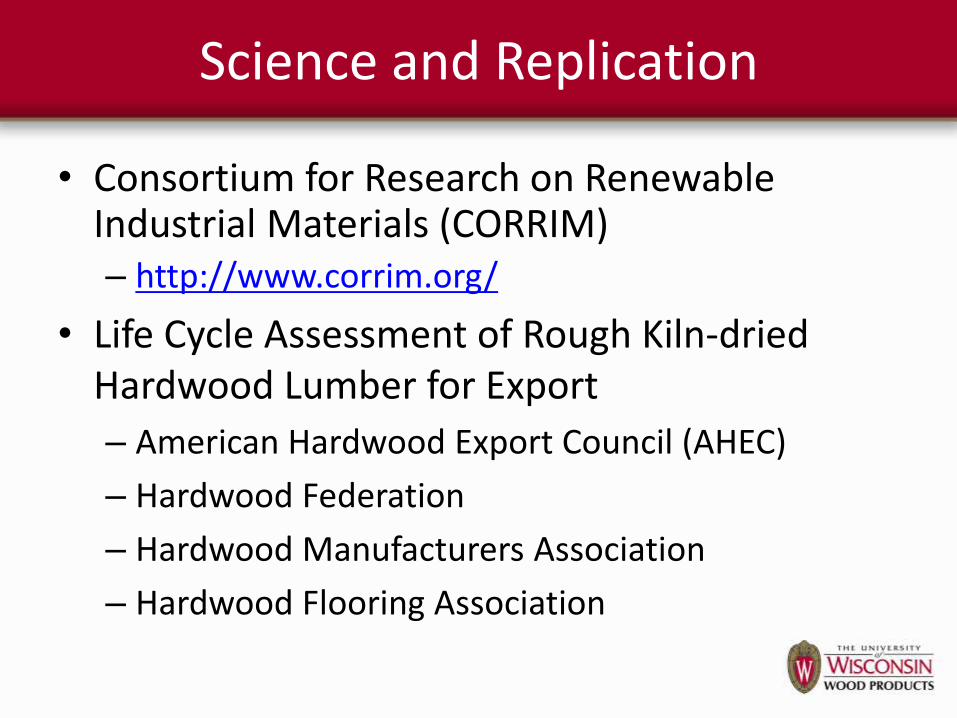
Science and Replication
• Consortium for Research on Renewable Industrial Materials (CORRIM) – http://www.corrim.org/
• Life Cycle Assessment of Rough Kiln-dried Hardwood Lumber for Export
– American Hardwood Export Council (AHEC)
– Hardwood Federation
– Hardwood Manufacturers Association
– Hardwood Flooring Association

(Source: http://www.corrim.org/pubs/reports/2010/phase2/Module_C.pdf)
Hardwood Lumber Production

Complete Life Cycle from Forest to Final Wood Disposal
(Source: Ritter, Michael A.; Skog, Kenneth; and Bergman, Richard. 2011. Science Supporting the Economic and Environmental Benefits of Using Wood and Wood Products in Green Building
Construction. General Technical Report FPL-GTR-206. Madison, WI: U.S. Department of Agriculture, Forest Service, Forest Products Laboratory. 9 p)

What can we do with all of this Life Cycle data?

Environmental Product Declarations
• EPDs
– Leveling the playing field for all materials
– Appeal to a common environmental concern
– Scientifically demonstrate wood’s small environmental footprint
Environmental Product Declarations
• EPDs provide science based, verified and comparable environmental information along product's entire supply chain
• Standardized (ISO 14025)
• Two types:
– Generic EPDs prepared by trade associations
– Product Specific EPDs prepared by manufacturers

Environmental Product Declarations
Source: FPInnovations, Western Red Cedar Decking EPD, 2011.

Why does wood perform so well?
“Growing trees takes carbon out of the atmosphere storing it first in the forest, which
when harvested moves this carbon to storage in products while at the same time displacing fossil
intensive products like steel and concrete.”
(Source: CORRIM Fact 5: Maximizing Forest Contributions to Carbon Mitigation. http://www.corrim.org/pubs/factsheets/fs_05.pdf)
Life Cycle Information
• Consortium for Research on Renewable Industrial Materials (CORRIM) – http://www.corrim.org/
• International Organization for Standardization – http://www.iso.org/iso/home.html
• U.S. Life Cycle Inventory Database – http://www.nrel.gov/lci/
• Athena Institute – http://www.athenasmi.org/

Questions?

Contact Information
Scott Bowe Professor & Wood Products Extension Specialist
Department of Forest and Wildlife Ecology College of Agricultural and Life Sciences
University of Wisconsin 226 Russell Laboratories
1630 Linden Drive Madison, WI 53706-1598
Phone: 608-265-5849 Email: [email protected]
Why are U.S. Hardwoods the Right Choice?
• When compared to other non-wood substitute materials:
– U.S. Hardwoods are abundant
– U.S. Hardwoods are renewable
– U.S. Hardwoods are natural
– U.S. Hardwoods are use less energy to manufacture
– U.S. Hardwoods are create less pollution during manufacturing
– U.S. Hardwoods are carbon neutral
– U.S. Hardwoods are beautiful!

Why are U.S. Hardwoods the Right Choice?
• When compared to wood substitutes from other countries:
– U.S. Hardwoods are abundant
– U.S. Hardwoods are sustainable
– U.S. Hardwoods are legally harvested
– U.S. Hardwoods are consistently well manufactured
Forests, Wood, and the Carbon Relationship

Important Concepts
• As trees grow, they remove carbon from the atmosphere. As trees reach maturity, growth slows and ultimately stops as mortality catches up to growth.
• Alternatively the rate of removal of atmospheric carbon can be sustained by harvesting trees before growth slows moving the carbon into products.
• Continuously moving the growing forest carbon into other wood uses provides the greatest mitigation of carbon emissions.
Important Concepts
• The carbon footprint is quantified by the Global Warming Potential (GWP)
• GWP is categorized using greenhouse gas (GHG) emitted
• GHGs important to forest products industry: Carbon dioxide (#1), methane, and nitrous oxide

Important Concepts
• Forests are carbon neutral sources of energy
• Substitution – wood can be substituted for other materials that do not store carbon and consume far more fossil fuel energy in production such as concrete or steel.
• Displacement – wood biomass can displace fossil fuel energy during a products’ manufacture.

Carbon Pools from Sustainable Forest Management
(Source: http://www.corrim.org/pubs/factsheets/fs_05.pdf)
All Carbon Pools: Forest, Products, Emissions, Displacement, & Substitution

Substitution and Displacement
(Source: http://www.corrim.org/pubs/factsheets/fs_07.pdf)

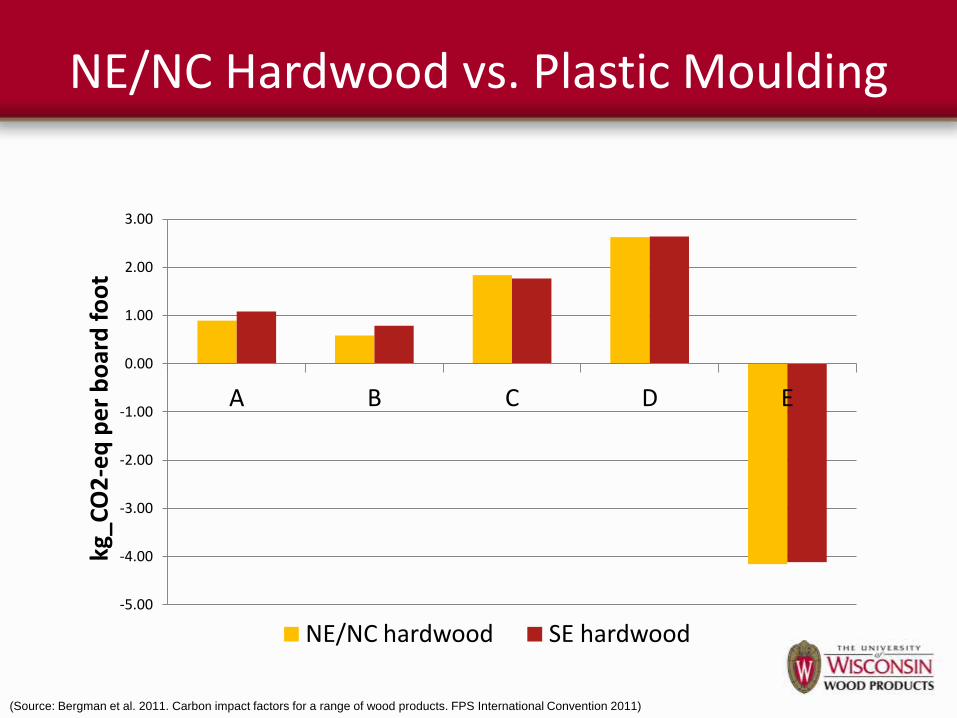
NE/NC Hardwood vs. Plastic Moulding
• A = 0.89 (total CO2 emissions)
• B = 0.59 (biofuel CO2 emissions)
• C = 1.84 (carbon storage)
• D = 2.63 (substitution effect)
• E = 0.89 – 0.59 – 1.84 – 2.63 = - 4.16 kg CO2-eq per bf
E is the net CO2 balance
(Source: Bergman et al. 2011. Carbon impact factors for a range of wood products. FPS International Convention 2011)
NE/NC Hardwood vs. Plastic Moulding
-5.00
-4.00
-3.00
-2.00
-1.00
0.00
1.00
2.00
3.00
A B C D E
kg_C
O2
-eq
pe
r b
oar
d f
oo
t
NE/NC hardwood SE hardwood
(Source: Bergman et al. 2011. Carbon impact factors for a range of wood products. FPS International Convention 2011)

Other Wood Examples
Product Unit Category A B C D Alternative E Hardwood Lumber
One board foot NE/NC 0.89 0.59 1.84 2.63 PVC -4.16
One board foot SE 1.08 0.79 1.77 2.64 PVC -4.12
Softwood Lumber
One 2x4 ‘stud’ NE/NC 1.85 1.23 6.63 6.97 Steel stud -13.0
One 2x4 ‘stud’ SE 3.90 3.32 8.42 7.01 Steel stud -14.9
Wood Flooring
1 square foot Solid wood 1.06 0.69 2.12 -0.13 Linoleum -1.61
1 square foot Engineered 0.98 0.52 1.10 -0.22 Linoleum -0.42
Doors One door Solid wood 46.5 29.4 100 228 Steel door -311
Decking One deck board Treated pine 5.18 1.70 16.1 11.9 WPC -24.5
Siding 100 square feet WRC 37.7 5.96 77.7 20.4 Vinyl -66.3
Poles One 45' pole Treated wood 454 431 1160 1380 Concrete -2520
OSB One 4’x 8' sheet SE 19.0 10.7 34.7 - n/a -26.3
Plywood One 4’x 8' sheet PNW 5.72 4.13 25.5 - n/a -23.9 One 4’x 8' sheet SE 10.1 6.48 30.9 - n/a -27.3
(Source: Bergman et al. 2011. Carbon impact factors for a range of wood products. FPS International Convention 2011)