Industrial energy efficiency
19
Industrial energy efficiency Meeting Europe’s demand for materials in an energy efficient way 16/05/2013 Maarten Neelis Chalmers Energy Conference 2013
-
Upload
ecofys -
Category
Technology
-
view
260 -
download
4
Transcript of Industrial energy efficiency

Industrial energy efficiency
Meeting Europe’s demand for materials in
an energy efficient way
16/05/2013
Maarten Neelis
Chalmers Energy Conference 2013

© ECOFYS | |
Outline
>Demand for materials continues to grow, also in
Europe
>The energy intensity of material production can
still go down significantly, but there are limits
>The challenge of 80-95% GHG emission reduction
in Europe, a fact based discussion on what to
expect from industry is necessary
16/05/20132 Maarten Neelis

© ECOFYS | | © ECOFYS | | 16/05/2013
Demand for materials will continue to grow…
3
Source: Energy Technology Perspectives, 2012, OECD/IEA, 2012
The IEA projects that:
Crude steel production will grow from 1.2 Gt in 2010 to 2.4-2.9 Gt in 2050
Cement production will grow from 3.0 Gt in 2010 to 4.4-4.5 Gt in 2050
Ethylene production will grow from 0.1 Gt in 2010 to 0.3-0.4 Gt in 2050
Etc. Etc.
Maarten Neelis

© ECOFYS | | © ECOFYS | | 16/05/2013
Still billions of people on the growing part of the IOU curve
4
Apparent crude steel consumption per capita 1970-2003. Source: Neelis and Patel, Long term production, energy consumption and CO2 scenarios for the worldwide iron and steel industry, Utrecht University, 2006
Maarten Neelis

© ECOFYS | | © ECOFYS | | 16/05/2013
And Europe’s consumption is produced elsewhere…
5
The net change in territorial emissions (1990-2008) together with the change in the net emission transfer between each country and non-Annex B countries (1990-2008). Source: Peters et al., growth in emission transfers via international trade from 1990 -2008, PNAS, published ahead of print 25 April, 2011
Maarten Neelis

© ECOFYS | | © ECOFYS | | 16/05/2013
An example: Europe’s chemical industry
Source: European chemistry for growth, CEFIC, 2013, supported by Ecofys
6 Maarten Neelis

© ECOFYS | | © ECOFYS | | 16/05/2013
How about the energy intensity, some examples
7
Specific energy use in GJ / t of product
Current EmergingThermodynamic
minimum
Primary steel 19-40 15 7
Ammonia 33-47 25 19
Cement 3-6 2.5 1
> Energy efficiency potentials by shifting all plants to current best available
technologies is about 30% of current energy use
> Emerging technologies have the potential to close part of the remaining gap
with the thermodynamic minima
> But it is difficult to imagine a potential improvement in energy intensity
improvement beyond 50% towards 2050…
Maarten Neelis

© ECOFYS | | © ECOFYS | | 16/05/2013
The picture for steel
8
GHG intensity of steel production. Source: ongoing research ….. (therefore not shown in this public version)
Maarten Neelis

© ECOFYS | | © ECOFYS | | 16/05/2013
Recycling is great, but it will take some time ….
9
Global share of scrap input into steel production towards 2100 under four scenarios. Source: Neelis and Patel, Long term production, energy consumption and CO2 scenarios for the worldwide iron and steel industry, Utrecht University, 2006
Maarten Neelis

© ECOFYS | | © ECOFYS | |
The European chemical industry towards 2050 – energy
16/05/2013
> Upper lines reflect energy use with projected production and 2010 energy intensity
Source: European chemistry for growth, CEFIC, 2013, supported by Ecofys
10 Maarten Neelis

© ECOFYS | | © ECOFYS | | 16/05/2013
> Upper lines reflect GHG emissions with projected production and 2010 GHG emission
intensity;
> Emissions are scope 1 and 2 only
Source: European chemistry for growth, CEFIC, 2013, supported by Ecofys
The European chemical industry towards 2050 – emissions
11 Maarten Neelis
© ECOFYS | | © ECOFYS | | 16/05/2013
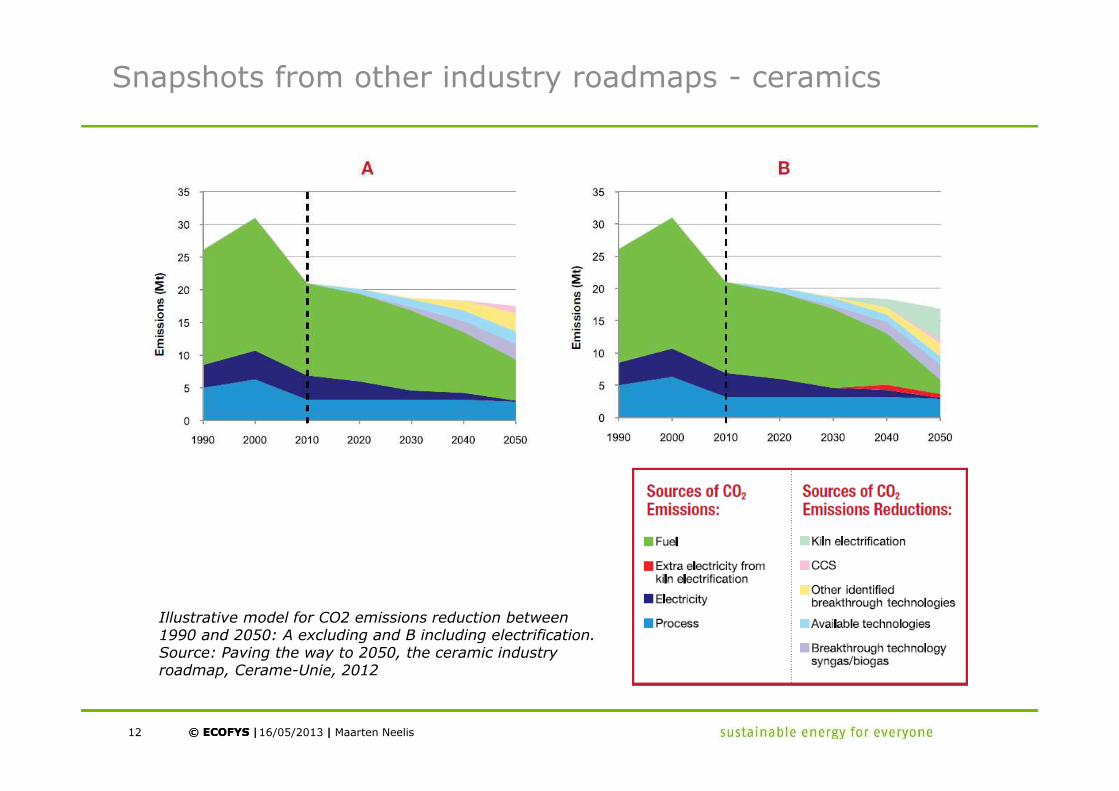
Snapshots from other industry roadmaps - ceramics
12
Illustrative model for CO2 emissions reduction between 1990 and 2050: A excluding and B including electrification. Source: Paving the way to 2050, the ceramic industry roadmap, Cerame-Unie, 2012
Maarten Neelis
© ECOFYS | | © ECOFYS | | 16/05/2013
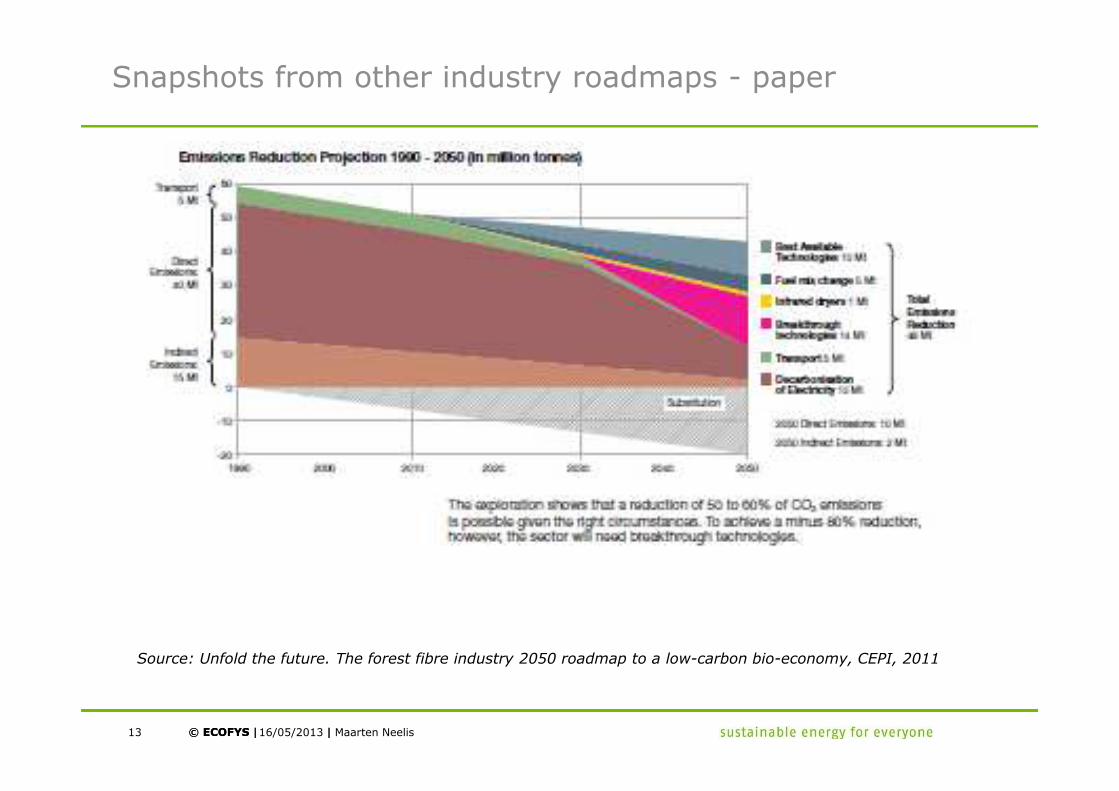
Snapshots from other industry roadmaps - paper
13
Source: Unfold the future. The forest fibre industry 2050 roadmap to a low-carbon bio-economy, CEPI, 2011
Maarten Neelis

© ECOFYS | | © ECOFYS | | 16/05/2013
And the industry projection by the EU….
14
Source: Impact assessment to “A roadmap for moving to a competitive low carbon economy in 2050, European Commission, 2011
Maarten Neelis

© ECOFYS | | © ECOFYS | | 16/05/2013
Some elements of the post 2020 policy debate
15
> Production versus consumption based policies, what is the evidence
for carbon leakage and what to do to avoid it (slide 5 and 6) ?
> What is a realistic abatement path for Europe’s industry, given stock
turnover and technical possibilities (slide 10 – 13) ?
> Innovation: how to bridge the gap from current BAT to emerging
technologies to thermodynamic minima (slide 7-9) ?
> Beyond energy efficiency – what is the role of CCS / fuel shift and
electrification towards deep GHG reductions beyond 2030 (slide 11-
13) ?
> The link to resource efficiency and recycling – how can we keep our
resource demand under control (slide 4 and 9) ?
Maarten Neelis

© ECOFYS | | 16/05/2013
Thank you for your attention
Ecofys Netherlands B.V.
Kanaalweg 15G
3526 KL Utrecht
The Netherlands
T: +31 (0)30 662-3241
I: www.ecofys.com
16 Maarten Neelis

Some background to Ecofys

© ECOFYS | | 16/05/201318
Ecofys domains of expertise
Wind Energy
Bioenergy
Solar Energy
HSE for renewables
Integrated Energy Systems
Power Systems & Markets
Conventional Energy Systems
Policy Design & Evaluation
Market based Mechanisms
International
Climate Policies
Buildings
Sustainable Transport
Industrial Processes
Supply Chains
Energy & CarbonEfficiency
Renewable Energy
Energy Systems& Markets
Energy & Climate Policy
Maarten Neelis

© ECOFYS | | 16/05/2013
Ecofys-Industrial Processes and you
19 Maarten Neelis