Accelerator technique proton and carbon treatment of tumors;

1
CTG035
Industrial Energy Efficiency Accelerator Guide to the confectionery stoving sector

Contents Executive summary ............................................................................................ 3 1. Background to Industrial Energy Efficiency Accelerator ................................. 6 2. Background to the stoving sector ................................................................... 8 What they manufacture......................................................................................... 8 How they manufacture.......................................................................................... 9 Business drivers................................................................................................. 11 Legislation impacts............................................................................................. 11 Energy saving progress ....................................................................................... 12 Environmental drivers ......................................................................................... 12 Operational drivers............................................................................................. 12 Operational barriers............................................................................................ 13 3. Methodology................................................................................................. 14 Sector engagement ............................................................................................ 14 Data gathering and metering ............................................................................... 15 4. Key findings.................................................................................................. 16 Steam stoves .................................................................................................... 16 Typical steam stove example ............................................................................... 19 Heat pump stoves .............................................................................................. 19 Stoving heat balance .......................................................................................... 22 Summary of investigational findings...................................................................... 22 5. Opportunities ............................................................................................... 23 Summary.......................................................................................................... 23 ‘Process-specific’ energy saving opportunities......................................................... 23 Different drying technologies ............................................................................... 24 Technology opportunity conclusions ...................................................................... 27 Implementing conventional heat pumps ................................................................ 27 Implementing enhanced heat pumps..................................................................... 29 Implementing microwave heating ......................................................................... 32 Using microwaves to dry starch............................................................................ 34 Sector wide business cases.................................................................................. 35 Conventional heat pumps .................................................................................... 35 Enhanced heat pumps......................................................................................... 36 Alternative business case – combined heat pump study ........................................... 37 Microwave heating ............................................................................................. 38 Summary of sector-wide opportunities .................................................................. 40 6. Next steps .................................................................................................... 41 Next steps for the confectionery stoving sector....................................................... 41 General good practice measures........................................................................... 41 Process-specific good practice measures................................................................ 41 ‘Innovative’ energy saving opportunities................................................................ 42 Next steps for the Carbon Trust............................................................................ 42 7. Acknowledgements ...................................................................................... 43 Appendix 1 – further monitoring analysis......................................................... 44 Interpreting temperature and humidity measurements ............................................ 44 Investigation findings ......................................................................................... 45 Temperature ..................................................................................................... 45 Relative humidity ............................................................................................... 46 Absolute humidity .............................................................................................. 46 Steam stoves .................................................................................................... 48 Heat pump stoves .............................................................................................. 48
2

3
Executive summary At the Carbon Trust, we believe that industry can reduce its CO2 emissions by improving energy efficiency in sector-specific manufacturing processes. We have been working with many industry sectors, as part of the Industrial Energy Efficiency Accelerator (IEEA), to deliver a reduction in industrial process emissions by accelerating innovation and the uptake of low-carbon technologies. The confectionery stoving industry We have worked closely with the stoved confectionery sector in 2009 and 2010 to understand its energy use and identify opportunities for energy efficiency. The confectionery sector is diverse, and involves many different products, processes and locations. Within the sector the sugar confectionery sub-sector has an annual primary energy consumption of more than 3,000 gigawatt hours (GWh) and a turnover of £1.9 billion a year1. Major companies in this sub-sector include Cadbury Trebor Bassett, Masterfoods (the confectionery division of Mars UK Ltd), Nestlé Rowntree, Tangerine and Haribo. There are also a significant number of smaller companies. Sugar confectionery manufacturing is diverse in terms of its products and processes, and so the stoving process for gums and jellies was chosen for investigation. The process is used by several manufacturers and so offers the potential for replication more readily than many alternative processes within the sector. Stoving products, such as gums and jellies, account for about 25% of the sugar confectionery sub-sector energy consumption. We estimate:
That the total annual production of stoved sweets is around 76,000 tonnes a year, and requires 294GWh of primary energy.
That CO2 emissions from stoving products are 60,000 tonnes a year; some 32% of which (about 20,000 tonnes) is attributed to the stoving process.
That annual energy costs for the production of stoved products are around £6.5 million, where £1.6 million is for the stoving process itself.
Stoving jellies and gums is essentially a gentle drying process in a batch environment where chemical changes take place within the sweet. Jelly and gum products are stoved for different periods and temperatures to produce sweets to different product specifications. Stoves are typically garage-sized enclosures, heated by steam or a heat pump with air circulation fans. Although most stoving facilities are not new – and in some cases are more than 40 years old – some minor design improvements have taken place. Modern designs are among those with the lowest carbon emissions. Our operational investigations showed extensive variation, both between manufacturers and between different products from the same manufacturer. This complicated our analysis, in particular regarding potential energy savings and payback.
1 Carbon Trust data.

Conventional energy saving measures We considered conventional ‘good practice’ energy conservation measures and identified control of humidity and the length of the stoving cycle as the primary factors affecting performance. Modern stove designs feature improved fabric insulation and a tighter seal against air leakage, particularly around the door. Although this improves energy efficiency, many of the older stoves are difficult to improve in retrofit. In older stoves, air ingress is used to limit the humidity within the stove, but is not an energy efficient solution. Few of the stoves we studied featured humidity control, yet our monitoring results indicated considerable variation in air humidity levels between products. Humidity seems to be the most important factor affecting the rate of evaporation. Controlling air ingress in response to humidity levels would improve overall efficiency, with a possible steam saving of 25%. We found that the stoves with the most sophisticated humidity controls were among the lowest energy consumers. ‘Innovative’ energy saving measures We found that the detailed sub-metering data suggested other carbon emission reduction opportunities, which fell into three broad concepts:
Greater use of efficient conventional heat pump designs, similar to those presently used in some stoves, and in retrofit for steam stoves.
Installing enhanced heat pumps, enabling the recovery of end-of-batch cooling energy for heating the next cycle.
Microwave drying. Demonstration projects would be needed to overcome barriers to adoption of some of these technologies, and in particular to ensure that the product quality and ‘feel’ are not affected. Although carbon savings from conventional heat pumps are about 28% (like for like) compared to steam stoves, the payback periods may not be financially attractive. There are additional benefits if stoving cycle times can be shortened, as this could reduce the number of stoves in service or increase output; both are of considerable value to manufacturers. Heat pumps are already in use, but some designs increase rather than decrease cycle times. Wider industry adoption could help overcome scepticism and show the advantage of retrofitting modern heat pumps. Additionally, recovered heat from the cooling phase of a stove can be used for preheating other stoves in the heating phase of the next cycle. Carbon savings from heat pumps in this configuration may be around 41% (like for like), compared to steam stoves with the same operational benefits as conventional heat pumps. Microwave drying also has possibilities for increasing output with a shorter potential energy payback, but the technology is as yet unproven. A developmental approach comprising laboratory piloting followed by on-site testing could help demonstrate feasibility.
4

The carbon benefits of these measures are summarised below:
Project Potential sector carbon savings
Project cost
tonnes CO2 over
a 10-year life £’000s
£ per tonne of CO2
Retrofit heat pump demonstration
56,000 100 1.78
Enhanced heat pump demonstration
82,000 150 1.83
Combined heat pump demonstration
68,000 180 2.64
Stage 1 150 2.49 Microwave technology Stage 2
60,200 350 5.81
The savings shown here assume 100% penetration of the market for each technology, except for microwave technology, where a maximum of 70% seems to be applicable as it may not be suitable for all products. Heat pumps and microwaves are not complementary technologies, and in a sense compete for the same applications, so the table should be read with this understanding. The Carbon Trust is supporting the identification of novel and efficient methods for drying sweets in this guide. We will discuss the opportunities for energy efficiency and carbon reduction in the confectionery stoving process, together with the data gathered as evidence to justify investment in these opportunities.
5

6
1. Background to Industrial Energy Efficiency Accelerator The IEEA aims to deliver a step change reduction in industrial process emissions by accelerating innovation in process control and the uptake of low carbon technologies. Industry is responsible for 25% of the UK’s total CO2 emissions2. The Carbon Trust’s experience supports the view of the Committee on Climate Change, which indicated that savings of 4-6MtCO2 (up to 4% of current emissions) should be realistically achievable in industry with appropriate interventions. We believe that by demonstrating the available opportunities to organisations, far greater CO2 savings than those set in current policy targets are possible. It is also possible to accelerate and increase the impact of policy by helping industry sectors understand their energy use. In this way we can achieve a step change reduction in emissions, rather than having an incremental effect. Direct intervention can also help embed a culture of innovation and good energy management, resulting in a long-term impact. We believe we can significantly reduce industry emissions by working with a range of medium-scale industry sectors that are outside the EU Emissions Trading Scheme (EU ETS), but are affected by either Climate Change Agreements (CCAs) or the Carbon Reduction Commitment Energy Efficiency Scheme (CRC). These industries are moderately energy intensive and, in total, account for 84 million tonnes of CO2 (MtCO2) emissions a year. The Carbon Trust’s existing approach to working with industry is through our advice activities and by supporting companies to reduce their carbon emissions. This is applied across a range of industries, but we cannot look in-depth at sector-specific manufacturing processes. More energy-intensive industries frequently cite that they do not address the majority of their energy use as a reason for not implementing survey recommendations. Between 50%-90% of a site’s energy consumption could typically be used by a sector-specific manufacturing process. In addition, the Carbon Trust Applied Research scheme has supported the development of a number of industry-related technologies. This scheme works in response to applications for support, rather than proactively looking for high-opportunity technologies in development. The IEEA will complement and extend existing advice by supporting industries in tackling significant emissions from sector-specific processes. Recognising the challenge of reducing CO2 emissions from industry, and the potential impact of targeting sector-specific processes, we investigated how we could best engage with industry to deliver significant increases in carbon reduction, beyond those delivered by existing Carbon Trust services. The Carbon Trust launched the IEEA in 2008.
2 Committee on Climate Change Report, December 2008.

The IEEA focuses on identifying and addressing the barriers preventing industries from improving the efficiency of their processes. There are three stages to the approach:
In 2008/2009 we undertook the investigation and solution identification stage with three pilot industry sectors: animal feed milling, asphalt manufacture and plastic bottle blow moulding. This led to six stage 2 implementation projects which we supported in 2010. In 2009 we commissioned three further sectors: dairies, confectionery stoving and industrial bakeries.
7

8
2. Background to the stoving sector This section offers a brief description of the confectionery sector in the UK and describes the stoving process used by major manufacturers. Key statistics are included together with business drivers and barriers to improving energy performance.
What they manufacture The confectionery sector produces many different sugar-rich products, including chocolates, lollipops, fudges, hard-boiled sweets, candies, toffees, gums and jellies, and there are equally diverse processes to manufacture each of them. ‘Stoving’ is the process for manufacturing soft sweets, such as gums and jellies. It is an energy-intensive process that is fundamentally the same for the range of gums and jellies manufactured by different companies. The sugar confectionery sub-sector has a primary annual energy consumption of more than 3,000GWh. Three major companies dominate the sector: Cadbury Trebor Bassett, Masterfoods (the confectionery division of Mars UK Ltd) and Nestlé Rowntree, with growing market shares for Tangerine and Haribo. Glisten Confectionery also manufactures stoved sweets. In 2008, the sugar confectionery market in the UK was estimated at £1.9bn3: As the chart shows, the value of the gums and jellies market is considerable. Most gums and jellies will be produced using the stoving process and it is likely that some medicated confectionery (such as Rinstead pastilles) is made using a similar stoving process. Based on an assessment of the above, the Office for National Statistics’ data and our own findings, we have estimated the annual production of gums and jellies to be about 76,000 tonnes, which would require 294GWh of primary energy. Overall annual CO2 emissions are estimated at 60,000 tonnes, 32% of which relates to the stoving process itself (figure 1).
3 Source: Carbon Trust Project Brief.

68%
32%
Stoving
Balance of Process
Figure 1: Estimated CO2 emissions from the manufacture of gums and jellies Well-known products manufactured using the stoving process include jelly babies, jelly tots, pastilles, wine gums, sours, medicated gums and similar soft gum sweets. The stoving process itself has changed little in the last 40 years – indeed, many confectionery products require drying and curing (dehumidification) of some kind. The manufacturing companies’ suggested energy use in confectionery drying and curing is an area where significant savings from process control and optimisation may be achievable. As stoving is a defined area of energy use common to gum and jelly manufacturers, it was selected as suitable for IEEA investigation. Consequently, the focus of this study is the stoving process in isolation.
How they manufacture A typical gum and jelly production process flow is illustrated in figure 2.
Liquor prod-uc tion
Ingredients
Water
Heat
Electricity
Starch mould and depositing
machineRacking on trolleys
The Stove
Sweet/starch separation
Starch drying (optional)
Product sweetsto packing
Sweets
Starch
Figure 2: Production of stoved products
9

Initially, fruit juices, gelatine, starch and a sugar mixture are combined in a simple heating and mixing plant. The resulting syrupy liquid is poured into starch moulds that rest on trays. These moulds give each sweet its final shape. Starch gently wicks moisture away from the sweet, giving a large surface area to aid drying. The finished product is then removed from the starch moulds and packaged. Spent starch is recycled and remoulded for the next product batch. In some circumstances the starch moisture content is too high for immediate reuse, so manufacturers may use a starch dryer. Stoving is essentially gentle drying in a batch process, during which some chemical changes take place. The stoves we studied were similar to that shown in figure 3, but considerably larger. A generic stove is a garage-sized heated enclosure that cures the product and removes moisture, turning the mixture into a gum. The stoved product may be mechanically cooled when drying is complete.
Figure 3: A typical stove Within a stove, racks of loaded starch moulds are placed on trolleys, forming a tower that allows air to pass between the racks. Trolleys are positioned to fill the stove space as closely as possible and air is blown through the towers at an elevated temperature, causing water to evaporate and drying the sweet. Figure 4 illustrates the typical flow of air across the moulds.
10

Fan Steam coil
Loading door
Side viewEnd view (section)
Fan Steam coil
Loading door
Side viewEnd view (section)
Figure 4: A typical stove air-flow pattern Energy is used to heat and circulate the stove’s internal air. Most stoves are heated by a steam coil, and a minority are heated by a heat pump. In steam stoves the circulating air becomes humid and requires replacement, either periodically or from continuous leakage. Circulation fans are not very large (typically 4 kilowatts (kW)), but a large stove may contain several. Longer stoving times for some products mean that fan energy can contribute considerably to the stove’s energy usage. Mechanical cooling is fitted to some stoves to accelerate product cooling at the end of the drying phase; others simply introduce ambient air into the stove. Mechanical cooling speeds up the cool-down time and avoids the quality difficulties associated with natural cooling during hot and humid weather. However, it does leave the spent starch with a higher moisture content than is ideal for reuse, so it may need to be dried.
Business drivers
Legislation impacts
The major energy-related legislation for this sector is the Climate Change Levy and the associated Climate Change Agreements, which most of the manufacturers hold though the Food and Drink Federation. These require manufacturers to reduce their energy demands by an agreed percentage through a series of milestones. It is therefore in manufacturers’ interests to reduce their carbon emissions.
11

Energy saving progress
Although many manufacturers are engaged in initiatives to reduce energy consumption, such as improving the performance of their steam supplies, there has been little focus on the stoving process itself. Sporadic improvements have been made, such as installing insulated doors or running trials with internal curtains to improve airflow in the stoves. Most stoving installations are not new, and modern designs are considerably more energy efficient, especially in terms of improved insulation and airflow. Out of a UK stock of more than 200 stoves, new units are rarely purchased. New installations reach five in an exceptional year, but often no new stoves will be purchased or installed. In the past 10 years most of the large manufacturers have experimented with heat pump technology in a bid to accelerate product drying times. Early installations resulted in little improvement and quality problems. Overall experience is mixed: one manufacturer was happy with the technology, and others were less happy, but still operate the heat pumps for certain products. Nevertheless, heat pump technology has the potential to offer a considerable reduction in energy consumption and carbon emissions compared to steam stoves.
Environmental drivers
Most of the larger manufacturers recognise the need to reduce their carbon emissions and their environmental impact, so carbon footprinting might be of interest.
Operational drivers
Reduced production times Most sites work at or near full capacity and stoves operate 24 hours a day, seven days a week. Whilst manufacturers have considered expanding their operations, the high capital associated with installing additional stoves has in part deterred this. All manufacturers have experimented with alternative stoving technologies – notably heat pumps – in a bid to reduce production cycle times, and they remain interested in ways to reduce stoving cycle times and increase production capacity. Shorter production cycle times will reduce energy consumption accordingly. Reduced energy costs The energy costs for stoved products for each of the three larger manufacturers in our study were more than £1.5 million. Manufacturers are continually seeking ways to reduce these costs. The industry generally uses a two- to three-year payback criteria on investment decisions. Improved product quality Ensuring consistent product characteristics through reliable stoving operations is a high priority for manufacturers.
12

Operational barriers
High capital value Confectionery manufacturers have high levels of capital invested in their stoving assets and so installation turnover is negligible. It is thus difficult to justify significant changes to this infrastructure. Scaling factor Large manufacturers operate many stoves on a site (more than 50 per site) and the combined costs of upgrading these may be prohibitive. Product quality The quality and texture of the sweets is intrinsically associated with the product brands. Therefore, manufacturers are nervous about introducing any process changes that might change these. Stove utilisation Stoves are used intensively and considered to be reliable. Therefore, any technological or process alteration which may run the risk of reduced reliability will be a deterrent to change.
13

3. Methodology The purpose of the work undertaken in stage 1 of the IEEA was to examine the stoving process in depth to understand energy use and interfaces with other systems, and to identify possible solutions that improve energy efficiency. Our approach included:
Initial engagement with manufacturers – this included discussion about their processes, operational procedures, production priorities and a history of energy measures.
Implementing the monitoring programme – this established what data to collect, identification of processes and equipment to monitor, meter installation and data collection.
Analysis of performance data – to identify where savings opportunities lie. Engagement with industry and technology experts – identifying potential
technology improvements, including a stakeholder workshop to review the findings and discuss opportunities.
Rationalising the opportunities – business cases were developed.
Sector engagement The primary point of engagement with the sector was the Food and Drinks Federation, who kindly facilitated access to their members. Those manufacturers who were not members of the FDF were addressed directly. There are just a few large manufacturers operating the stoving process in the UK. Two major manufacturers participated in operational monitoring, and two other manufacturers contributed data or attended the workshop. These companies represent the majority of the UK manufacturers using the stoving process. Face-to-face meetings were held on-site with representatives at each of the participating companies. Their operations were discussed and potential opportunities for carbon reduction considered. We also engaged in dialogue with equipment suppliers and with academia. Eleven industry stakeholders (manufacturers and equipment suppliers) attended the sector workshop.
14

15
Data gathering and metering Stoving is a batch process, so to understand its energy use and carbon performance, we monitored a sample of stoves and collected performance data from different product batches. The data comprised:
Steam and electricity use to understand the energy balance during the course of a batch cycle. o In the steam-heated stoves energy is in the form of steam for direct heating
and electricity for the fans for circulating air. o In the heat pump stoves energy is in the form of electricity to power the heat
pumps, electric heaters and fans. Temperature and humidity profiles inform the understanding of the operation of
the stove and the drying process. Operational batch data was also collected in the form of product type, product
weight, stoving times, temperature set points and percentage solids at the start and end of the process.
We collected data over one month of multiple batch stoving. Monitoring data was supplemented by observations from around the plants and discussion with the operational staff. The following were examined for multiple product batches:
Preheating of the structure, the product and all of the supporting equipment. Evaporation (weight loss) from the product Humidity of the air within the stove throughout the cycle. The effect of humid air leaving and ambient incoming air. Natural cooling at the end of the process (allowing outside air to enter the stove
and cool the contents) or mechanical cooling. Steam for heating the stove. Electricity for fans to circulate the air.
Due to the commercially sensitive nature of the performance data, only generic results and analysis are presented in this guide.

4. Key findings This section presents an overview of the process and data. Further monitoring detail is given in Appendix 1. To provide a ‘base case’ of the different stove types, a theoretical ‘typical’ steam stove is described and values attributed from the performance indices collected. The typical stove performance was used to exemplify the benefits of deploying alternative technologies identified during the project.
Steam stoves Figure 5 illustrates the processes occurring within a stove where recirculating air is heated by steam coil. Figure 6 shows typical temperature and humidity profiles throughout the key phases of a stoving cycle.
A ‘steam stove’
Air heated & blown
Air picks up moisture from sweet
Tray of sweets
Some air released to balance humidity
Cold air enters to balance air released
Steam & Electricity
Figure 5: Heating processes within a steam stove The main heating phases of the stoving cycle – initial heating and drying over an extended period – are shown in figure 6. When the drying phase is completed (usually defined by measuring product moisture content), there is a cooling period. The two cooling mechanism profiles (natural cooling and mechanical cooling) are not shown in this figure, but can be seen in Appendix 1.
16

Average data for all samples
0
10
20
30
40
50
60
70
80
90
100
start+
0
star
t+1.
5
start+
3
start
+4.5
start+
6
start+
7.5
star
t+9
start
+10.5
end
-11
end
-9.5
end -8
end -
6.5
end
-5
end
-3.5
end -2
end
-0.5
Tem
per
atu
re o
C
0
5
10
15
20
25
30
35
40
45
50
Rel
ativ
e H
um
idit
y %
an
d A
bso
lute
hu
mid
ity
g/k
g
Temperature
Relative humidity
Absolute humidity
Heating phase:Temperature rises as stove and product
w arm. Relative humidity falls due to temperature rise, absolute humidity rises as evaporation begins.
Drying phase: Temperature stable. Relative and absolute humidity gradually fall as moist air is replaced by occasional or continuous venting
Cooling phase:Temperature falls by letting in cold air or mechanical
cooling. Relative humidity rises w ith 'natural cooling' and absolute humidity falls . With mechanical cooling relative humidity falls and absolute humidity rises.
Figure 6: Typical temperature and humidity profiles throughout a steam stoving cycle Our monitoring found the following substantive differences in the ways individual stoves were operated.
Some managed to achieve a high initial rate of evaporation: i.e. the initial rise in absolute humidity was much steeper than shown in figure 6.
Some balanced the humidity level in the stove with a continual bleed of fresh air, while others occasionally vented the hot, humid air to atmosphere.
Some had a higher installed fan power and lower steam consumption. Batch cycle times varied from one to several days and did not necessarily relate to
the weight of moisture evaporated. Further variation occurs because confectionery products have different characteristics in terms of the moisture content at the beginning and the end of the cycle. Also, some formulations appeared to release moisture more quickly than others.
17

Acknowledging these variation factors, we have expressed stoving performance in terms of carbon emissions (i.e. energy consumption) against product weight. This is augmented by comparing energy consumption and associated carbon emissions against the weight of moisture evaporated within a stoving cycle. An intermediate step in calculating the carbon emissions against evaporated water gives an indication of the efficiency of steam use in the stoves. This varied from 10% to 25%, which may seem low, but is within the range the team were advised by a stove manufacturer to expect; it is also consistent with other stove and furnace applications. We found a substantial difference between steam stove performances at the different sites. Figure 7 shows the relative performance range in terms of carbon emissions estimates per kilogram of finished product and per kilogram of water evaporated by the stove.
Stove specific carbon emissions by product weight
0
0.1
0.2
0.3
0.4
Low est Typical Highest
Steam stoves
kg C
O2
per
kg
of
pro
du
ct
Emissions due tosteam
Emissions due toelectricity
Stove specific carbon emissions by water evaporated
0
0.5
1
1.5
2
Low est Typical Highest
Steam stoves
kg C
O2
per
kg
of
pro
du
ct
Emissions due tosteam
Emissions due toelectricity
Figure 7: Steam stove performance range Stoves using steam heating tend to have specific energy consumptions within 0.1kg to 0.4kg of CO2 per kilogram of finished product, emitting between 0.7kg to 2.7kg of CO2 per kilogram of water evaporated. Our analysis attributed this variation to:
The length of the stoving period required for maturing the product. The electrical carbon emission from the fan drives is a variable, but is also a
substantial proportion of the total emission. Other unresolved effects are hidden within the data, such as:
o Humidity control (on some stoves only). o Level of fabric insulation o The relative proportions of steam (heat) input and electrical energy input for
the fans.
18

Typical steam stove example To provide a general illustration of the potential savings, a ‘typical’ steam stove is defined as handling 294 tonnes of finished product and evaporating 44.62 tonnes of water annually. As it is not appropriate to add the respective carbon emissions for steam and electricity, the weighted average of the steam and electricity consumption of the stoves from the participating companies is used to calculate the base cost of stoving in the following chapters. Carbon emissions from electricity and natural gas are assumed as 0.544kgCO2/kWh and 0.184kgCO2/kWh respectively. Figure 8: Base case – energy and operating cost statistics for a ‘typical’ steam stove
* Rounded values
Item Units Result* Specific CO2 ratio kg CO2/kg water evaporated 1.034 Specific gas consumption kWh/kg product 5.617 Gas cost £/kWh 0.020
Steam
Annual gas cost £/year 5,000 Specific CO2 kg CO2/kg water evaporated 0.389 Specific electricity kWh/kg product 0.715 Unit cost £/kWh 0.060
Electricity
Annual electrical cost £/year 1,900 Total carbon emissions (heating + electricity) tonne CO2/year 63.5 Carbon emissions (heating only) tonne CO2/year 46.1 Total cost £/year 6,900 Cost per tonne of water evaporated £/kg water evaporated 155
The base case compared well to operational stoves.
Heat pump stoves With heat pumps, rather than the heat being supplied externally (as with steam) the humid air is taken from the stove, dried and reheated (as shown in figure 9). Thus, unlike steam stoves, where heat energy is supplied externally and vented as hot and humid air, heat pump stoves retain and recycle the heat energy within the system: only condensed moisture leaves the stove. In theory, heat pump stove energy consumption will be lower than an equivalent steam stove, although the electricity required (rather than steam) has a greater carbon emission per unit consumed.
19

Air blown
Air picks up moisture from sweet
Tray of sweets
Heat PumpElectricity
Wet air Dry air Moisture
A ‘heat pump stove’
Figure 9: Heating processes within a heat pump stove In early installations it was assumed that evaporation from nascent product would provide sufficient energy to heat the stove and its contents. However, energy balance analysis showed that this was not the case: insufficient energy is available from the moisture to obtain a reasonable initial temperature increase. Thus all heat pump stoves incorporate electric resistance elements for the initial heating phase. We noted that the electric heating rating in more ‘successful’ stoves was substantially higher than others and that this seems to account for the ‘disappointing’ performance (in terms of cycle time) from some heat pump stoves and ‘good’ performance from others (colloquially referred to as ‘fast stoves’). Including the resistance heating required for start-up, we found that the energy used in heating the stove and contents accounts for around 7.5% of the total stove heat input. This relationship holds true for both steam and heat pump stoves. Heat pump stoves tend to be newer than most of the steam stoves studied, and usually benefit from better insulation and improved controls. Notwithstanding, the heat pump stoves emit around 50% less carbon than the equivalent steam stoves when processing the same product, including all energy consumptions, such as resistance heaters and fans. Figure 10 shows the temperature and humidity profiles for a typical heat pump stove.
20

Heat pump stove performance
0
10
20
30
40
50
60
70
star
t+0
star
t+2
star
t+4
star
t+6
star
t+8
star
t+10
star
t+12
star
t+14
star
t+16
star
t+18
star
t+20
star
t+22
star
t+24
end-
23
end-
21
end-
19
end-
17
end-
15
end-
13
end-
11en
d-9
end-
7
end-
5
end-
3
end-
1
Tem
pera
ture
oC
, RH
% a
nd A
H g
/kg
Temperature
Relative Humidity
Absolute humidity
Figure 10: Typical temperature and humidity profiles throughout a heat pump stoving cycle Profiles are similar to that for steam stoves in figure 6, but with a noticeably slower heat-up time. As none of the stoves have mechanical cooling, the cool-down time is extended. The reason for the higher temperature profile is related to the requirements of the products being processed in the example, rather than a consequence of using heat pumps per say. Figure 11 presents the same performance data as for figure 7, but includes the equivalent data from the heat pump stoves.
Stove specific carbon emissions by product weight
0
0.1
0.2
0.3
0.4
Low est Typical Highest A B
Steam stoves Heat pump stoves
kg C
O2
per
kg
of
pro
du
ct
Emissions due tosteam
Emissions due toelectricity
Stove specific carbon emissions by water evaporated
0
0.5
1
1.5
2
Low est Typical Highest A B
Steam stoves Heat pump stoves
kg C
O2
per
kg
of
pro
du
ct
Emissions due tosteam
Emissions due toelectricity
Figure 11: Comparative CO2 emissions from steam and heat pump stoves Heat pump stove B clearly performs better than stove A, which was one of the ‘disappointing’ installations in terms of a longer batch time compared to the steam stoves.
21

At one manufacturer the heat pump stoves emitted less carbon dioxide than the equivalent steam stoves in terms of both product weight and water evaporated. On the basis of water evaporation performance, the better heat pump stove yields the lowest carbon emissions across all three sites.
Stoving heat balance Based on our findings, energy balance calculations indicate:
That energy used in heating the stove and contents accounts for around 7.5% of the total stove heat input. This relationship holds true for both steam and heat pump stoves.
That air changes during the process cycle typically account for 50% of the heat energy consumed. This is the largest single heat consumption.
Summary of investigational findings Given that product formulation and the way in which the stoves are operated vary considerably between sites, our generic findings are:
There are three distinct phases of any stoving operation: warm-up, drying and cool-down.
There is a stronger relationship between mass carbon emissions and moisture evaporated than between mass carbon emissions and actual product weight.
Although it is difficult to quantify, there is an implied relationship between mass carbon emissions and stoving time.
Some products yield up their moisture more quickly than others, which seems to be mostly a function of the starting formulation moisture content.
Air ingress does have benefit in that it avoids a build-up of moisture in the circulating air within the stove, thus more air-tight stoves have to admit air deliberately.
Stoves where the air moisture content is actively controlled are among those with the lowest carbon emissions, although this effect is masked by other features of the stoves and products within our data set.
The heat pump stoves monitored had lower carbon emissions than steam stoves treating similar products. Where stoves have different results, the difference seems to be related to the stoving time required.
Stoves with a shorter start-up time are associated with lower overall carbon emissions.
Overall, stoving is not an energetically efficient process in terms of energy input for evaporating water.
22

5. Opportunities
Summary The energy saving opportunities fall into three categories:
Conventional energy efficiency measures, which may be implemented by the manufacturers using standard engineering know-how.
Different technologies that have been deployed for drying or could replace stoving.
Technologies that emerge from the above categories as practical possibilities for wider use within the stoved products confectionery sector.
Where appropriate, potential savings are illustrated using the ‘typical’ steam stove example as described previously.
‘Process-specific’ energy saving opportunities Stoves use heat and electrical energy and, as such, benefit from conventional energy saving measures already described in Carbon Trust publications. Examples include boiler optimisation, pipework insulation and energy efficient motors. In addition to generic utility measures, the following process-specific opportunities were noted. Humidity control Few of the stoves investigated featured internal humidity controls or humidity monitoring. Consequently, the humidity level is either controlled manually according to operator experience or automatic venting intervals preset within a stove cycle programme. There is considerable wastage as the relative humidity of the air in most stoves (an index of its ability to absorb moisture) is very low. This is most wasteful towards the end of most of the stove cycle when the relative and absolute humidity fall to very low levels. Yet:
For those controlled automatically, the cyclic open and closing of vents is clear from our investigations at these times (see Appendix 1).
For manual controls the venting of air is generally continuous, whether through deliberate operator action or leakage through poor-quality dampers.
Energy balance calculations indicate that air changes during the process cycle typically account for 50% of the heat energy consumed. This is the largest single heat consumption. Humidity control (relative humidity) of the stoves venting procedures can substantially reduce this loss. Indeed, the stoves fitted with humidity controls (excluding the heat pump stoves) are those with the lowest steam consumption. Potential savings are about 25% of the steam consumption.
23

24
Insulation Most stoves have a concrete fabric, were installed a long time ago and are located adjacent to other stoves. This makes it difficult to add insulation to the stove fabric. If the stoves either side of the one in question are also operating, this is of little consequence, but if either is between batches, the heat losses in the more poorly insulated stoves will be significant. The insulation (and air-seal) properties of stove doors are very variable, with the poorer stoves offering little restriction to air ingress and heat loss. Our metering programme attempted to quantify the effects of insulation, but the many other variables affecting energy consumption prevented any conclusions. Theoretical estimations show that:
The losses from a poorly insulated stove operating with a cold stove either side are about 10% of the heat supplied. Rather more than half of this is lost through the roof and door, which are unaffected by adjacent stoves.
Losses thought the fabric and door can be substantially reduced by fitting good insulation to the roof and walls (U-value 0.83 W/m2K rather than 2.0) with a suggested saving of about 3% of the heat input.
Different drying technologies Our investigations considered alternative drying processes or measures from existing installations, which may be more energy efficient than stoving and be applicable to the industry. The list includes:
Maximising liquor solids content for feed to moulds and optimising product moisture content
Continuous dryers Heat pumps Vacuum drying Di-electric (Radio frequency/Microwave) drying Superheated steam drying.
Figure 12 summarises these processes and screens for their likely applicability to the industry.

Figure 12: Alternative drying processes Measure Rationale Comment Conclusion
Increasing product solids content before stoving
Consideration of the preparation process is important, as maximising the total solids of the material to be dried will reduce drying energy and time.
Manufacturers indicated that this was the subject of much internal study. The limit of solids content for deposition is reached when the deposited liquor will settle in the mould without ‘peaking’ (the liquid fails to flow to become a flat surface). Each manufacturer felt they had reached the limit of possibilities here.
Not considered further
Continuous drying
Mitchell Dryers advised that a continuous dryer for pastilles was operated at a UK site for 12 to 14 years. Also, band dryers for pastilles using five or six solid bands are possible.
A Mitchell dryer processed 4 ton/hr of product using steam heated circulating air and a dehumidified chilled air cooling section. An intensive clean was required once a week. The operating costs for water, chemicals, heat and effluent for this cleaning system may have contributed to taking the unit out of service. A continuous dryer machine is in service at a UK site, but operators report difficulties in its use, as the cycle requirements make it suitable for only one product at a time.
Not considered further
Heat pumps
Heat pumps are in use on some stoves at two of the factories studied. There is also some published performance information.
A 1985 article in Energy Management’s Focus series on heat pumps describes the experience at a now closed UK plant processing ’juicy jellies’. Three chambers were converted from steam coil heating to a heat pump system. The key facts of this operation were:
Drying time of the average load was reduced from two to three days to 18 to 20 hours in heat pump-driven chambers
Monitoring of savings showed an 80% reduction in energy costs (no basis given for this calculation) for a total cost of £65,000 offering a simple payback in 18 months
They quoted a 97% reduction in energy emissions from almost 3,000 kg CO2 per batch to less than 200kg CO2 per batch.
Additional benefits were; a three-fold increase in throughput achieved without a corresponding increase in the number of trays and moulding starch; more consistent product as a result of less severe drying gradients in the chambers; and rejects were virtually eliminated. Taken with the reduced cycle time, this reduction is dramatic, but appears to overstate the case. These results illustrate the potential for this technology. The results of our monitoring work have also shown that this technology can make significant energy savings compared to equivalent steam stoves.
Consider further
25

26
Measure Rationale Comment Conclusion Vacuum drying
Vacuum drying is attractive on a theoretical basis as lower temperatures can be used, thus maintaining the requirement for gentle drying at an acceptable rate. The idea would be to use either a batch or continuous vacuum chamber. Batch units would be pressure vessels with heated platens on which the product would be placed. An air-lock is used to maintain the vacuum at the open ends of the unit; but it is unclear whether this would work with starch moulds.
Mitchell dryers have experience of continuous vacuum shelf dryers for chocolate and milk drinks, where the lower temperature evaporation of water is important to avoid undesirable product changes. In stoved products, however, there is a requirement for an element of curing (cooking) that requires the temperatures presently used. Vacuum dryers, as pressure vessels, also have an extremely high capital cost per tonne of product. For reasons of likely cost and the higher temperature requirements of stoved products, this technology is not discussed further
Not considered further
Superheated steam
Superheated steam has more heat capacity than air and would easily allow heat pumping. This makes it attractive as a heat transfer and drying medium.
At atmospheric pressure, temperatures would be above 100oC, probably causing product damage, so a vacuum condition, with its associated costs and difficulties, would probably be required. This option does not appear to be a practical alternative to stoving.
Not considered further
Di-electric drying (microwaves)
Radio frequency and microwave drying has significant advantages over convection drying methods. Selective heating of the di-electric material avoids the problem of warm air distribution in convection dryers and consequent out-of spec material. Operating temperatures can be achieved within a couple of seconds. Tight process control enables instantaneous temperature changes to optimise the drying process And avoidance of problems in heat transfer was experienced in convection heated ovens.
Potentially, dielectric drying can deliver quick start-up, consistent product quality and fine control of end-point moisture. As the same energy is needed to evaporate the water from the material, no matter what the heating system, it may be beneficial to combine convection drying (perhaps with heat pumps) and microwave drying to gain all potential benefits. This technology can be adapted to existing batch dryers (with improved microwave proof door seals) or to new continuous units. The main disadvantage is the cost of the field generator at ~£1,000/kW. However, capital cost of a complete unit can be minimised if it is tailored precisely to the required duty; a figure of one-quarter the cost of ‘off-the-shelf’ units being quoted.
Consider further

Technology opportunity conclusions
Our technology screening conclusions were:
The most efficient way to produce stoved products might be a continuous dryer with microwave-enhanced heat-up, a heat pumped convection heating/drying section, cooled end-section and end-point moisture control.
Practically, there are possibilities for the wider application of heat pumps and microwave technology could be used to dry product. Both these technologies use electricity, which costs more than gas and has higher carbon emissions per unit.
Gas fuelled heating systems are about 15% efficient in overall thermodynamic terms, so equivalent electrical systems would need to be more than 50% efficient to demonstrate cost or carbon emission benefits. Indications from the monitoring work have indicated that this level of savings is possible.
The speed of drying, especially from microwave technology, and the potential for significantly higher production levels from smaller plant with savings on building area and other operating costs, may produce a completely different business case to that currently experienced. However, the industry has a significant existing capital investment in stoves, so the business case needs to be clearly demonstrated.
Implementing conventional heat pumps Existing conventional heat pumps take the heat of condensing moisture from the air circulating around the stove and recycles it to the stove as heat, augmented by the electrical energy used in the heat pump itself. Only a few stoves use this technology. The key aspects are:
To heat up the stoves quickly and achieve acceptable cycle times, heat pumps need electric resistance heating with the more successful ones augmented by further heaters.
The benefits of the heat pump operation are clear from the key findings section. As the cost of building large numbers of new stoves would be prohibitive, the
difficulties of wider application are associated with the practicalities and potentially the cost of retrofitting this different, bulkier technology to existing stoves. Heat pumps are not in themselves expensive, but retrofit difficulties may arise where stoves have been built for relatively compact steam coils. However, it is possible to envisage a mounting location for one or more heat pumps in almost all locations.
Available savings On the basis of the ‘typical stove’ (steam heated) described previously, the amount of heat actually required is calculated below. The fan electricity consumption is omitted because this is likely to be the same for both steam and heat pump stoves.
27

28
Figure 13: Example of steam stove thermal energy performance
Item Units Result Specific steam kg steam/kg water evaporated 6.45
Water evaporated tonnes water evaporated per year 44.6
Steam in a year kg steam/year 287,665
Latent heat of steam kJ/kg 2,220
Heat applied to stove kWh/year 177,393
Gas energy supplied kWh/year 250,640
CO2 emissions tonnes CO2/year 46.1
Of this, from our heat balance calculations and cross-checked against actual steam stoves, the heat required for resistance heating during the warm-up phase of operation is around 7.5% of the total. Thus, the heat pumps produce about 92.5% of the required heat. With an achievable COP of 3.54, the heat pump electrical energy input is estimated in figure 14 and compared to the conventional steam stove example in figure 13. Figure 14: Comparable heat pump stove example performance
Item Units Result
Heating requirement kWhth/stove per year 177,000 Heat pump electrical energy heating input (0.92 x 177,000 kWhth/year/3.5 = 47,000 kWhe/year) kWhe/stove per year 47,000 Resistance heating preheat energy (0.08 x 177,000 kWhe/year = 14,000kWh/year) kWhe/stove per year 14,000 Total heat pump energy (47,000 + 14,000 kWhe/year) kWhe/stove per year 61,000 CO2 emissions (0.544kg CO2/kWh) tonnes CO2/year 33,000 Electricity cost (6 p/kWh) £/stove/year 3,700 Total cost saved compared to conventional steam stove (see figure 8) £/stove/year 1,300 Percentage cost saved compared to conventional steam stove % 26% Carbon saving compared to conventional steam stove (see figure 8) kg CO2/stove/year 13,100 Percentage carbon saved compared to conventional steam stove % 28%
Figure 14 shows:
CO2 emissions are reduced to 33,000kg CO2 a year compared to steam generated from natural gas at 46,100kg CO2 a year – an approximate 28% saving.
Annual costs at 6p/kWh are £3,700, compared to natural gas at 2p/kWh costing £5,000 per year; a 26% saving.
Compared to the steam stove, energy cost savings amount to £1,300 a year for this heat pump stove example, with a reduction in CO2 emissions of around 13 tonnes (28%).
4 CoP is the ratio of the energy (electricity) input to a heat pump, divided by the heat output. Both are measured in kW or kWh, but usually distinguished by the suffix e for electricity and th for heat. A CoP of 3.5 is a reasonable estimate for a heat pump operating in the prevailing conditions.

Costs to implement As resistance heaters are required to help in the initial heating stage, the heat pump must be sized to meet the peak heating rate during the actual processing, as well as the available component of preheat they can deliver. We calculate that an aggregate capacity of 55kW will be required for the average load (this should be reviewed before implementation). It should be possible to install this for £27,000 each once the principles are established: the first installation is liable to cost considerably more. The payback for retrofitting heat pumps to a typical stove is thus 20 years, although the range for ‘real’ stoves is 11 to 38 years. This payback does not seem impressive, but there are other likely benefits, as outlined below, which may well outweigh the energy cost benefits. Every 10% increase in energy costs reduces the payback by around one year. There are also benefits of scale. Other benefits Evidence from the more successful stoves indicate that batch times can be considerably shorter using heat pumps. This advantage could be realised as either:
the possibility to increase production the possibility to ‘retire’ stoves and perhaps reduce staffing levels.
In order to quantify these benefits, further discussions with each manufacturer would be required. Due to the low humidity achieved with a heat pump, there is the possibility that the fan power could be reduced. This could not be tested during the monitoring work, but would be worthy of investigation in any trial of the technology in retrofit.
Implementing enhanced heat pumps Conventional heat pumps require assistance from resistance heaters to initially heat the stove and its contents at an acceptable rate. In addition, some stoves are fitted with mechanical cooling to expedite the final stages of the cycle. In other stoves the product cools by allowing outside air to enter the stove, which has the disadvantage of being slower and, in hot and humid weather, upsetting the moisture equilibrium within the stove, so product quality could be jeopardised. Heat pumps are a flexible technology with the capability to provide heating and cooling. Thus the conventional technology could be adapted to provide stove cooling and thus reclaim the cooling energy for reheating of stoves for the next batch. Figure 15 shows the function of a conventional heat pump of the type presently used in stoves and figure 16 suggests a theoretical ‘enhanced’ heat pump installation.
29

30
Water from drip tray to drain
Electrical energy
consumed by compressor
motor
Air reheated by refrigerant: energy from- cooling the air- condensing the
water- energy to the
compressor
Air cooled & dried
by refrigerant
Liquid refrigerant boils in coil
Refrigerant compressed
by compressor
Hot refrigerant
gas
Refrigerant condenses to liquid in coilRefrig
-erantliquid
Figure 15: A conventional heat pump installation
Liquid refrigerant boils in coil
Hot refrigerant
gas
Refrigerant condenses to liquid in coilRefrig
-erantliquid
Water loophot & cold
Figure 16: An ‘enhanced heat recovery’ heat pump installation

31
An enhanced heat pump would use two additional refrigerant-to-water heat exchangers which:
in the cooling mode: remove heat from the stove into a water storage loop. in the heating mode: take heat from the water storage loop to warm air in a
stove. Little additional equipment is required to modify a conventional heat pump, but the enhancement means the pump is no longer a standard product, which increases the cost. A water loop system with an insulated water storage tank will also be required to store recovered heat after between batches. As the batches can take several days, the system will be more effective if installed to serve a group of stoves sharing the stored heat resource. Available savings The savings from the enhanced heat pump will be the same as those calculated for the conventional heat pump plus the saved cost of the additional energy for the heating and cooling cycles. In the conventional heat pump example, the heat required from resistance heating for the typical stove was 14,000kWh a year. The enhanced heat pump would operate at an enhanced COP5 of 4.5 (or better) in the heating mode. This means that the energy required would be reduced. Figure 17: Comparable enhanced heat pump stove example performance
Item Units Result Conventional heat pump total electrical energy heating input (see figure 14) kWhe/stove per year 47,000 Conventional heat pump resistance heating preheat energy (see figure 14) kWhe/stove per year 14,000 Conventional heat pump total CO2 emissions (0.544kg CO2/kWh) tonnes CO2/year 33,000 Conventional heat pump preheat CO2 element kg CO2/stove/year 7,700 Enhanced heat pump total electrical energy heating input (from figure 14) kWhe/stove per year 47,000 Enhanced heat pump energy for preheat kWh/stove per year 3,150 Total enhanced heat pump energy (47,000 + 3,150kWhe/year) kWhe/stove per year 50,150 Enhanced heat pump total CO2 emissions (0.544kg CO2/kWh) tonnes CO2/year 27,000 Enhanced heat pump preheat CO2 element kg CO2/stove/year 1,700 Additional carbon saved compared to conventional heat pump kg CO2/stove/year 6,000 Total carbon saved compared to steam stove (46,100 kg CO2/stove/year) kg CO2/stove/year 19,100 Total carbon saved compared to steam stove % 41% Enhanced heat pump electricity cost(6p/kWh) £/stove/year 3,000 Additional cost saved compared to conventional heat pump £/stove/year 600 Cost saved compared to steam stove (natural gas: 2p/kWh – £5,000) £/stove/year 2,000 Total cost saved compared to steam stove % 40%
5 CoP is the ratio of the energy (electricity) input to a heat pump, divided by the heat output. Both are measured in kW or kWh, but usually distinguished by the suffix e for electricity and th for heat. A CoP of 4.5 may be reasonably expected from a heat pump operating in the mode proposed, as it is less onerous than the conditions in which they operate presently.
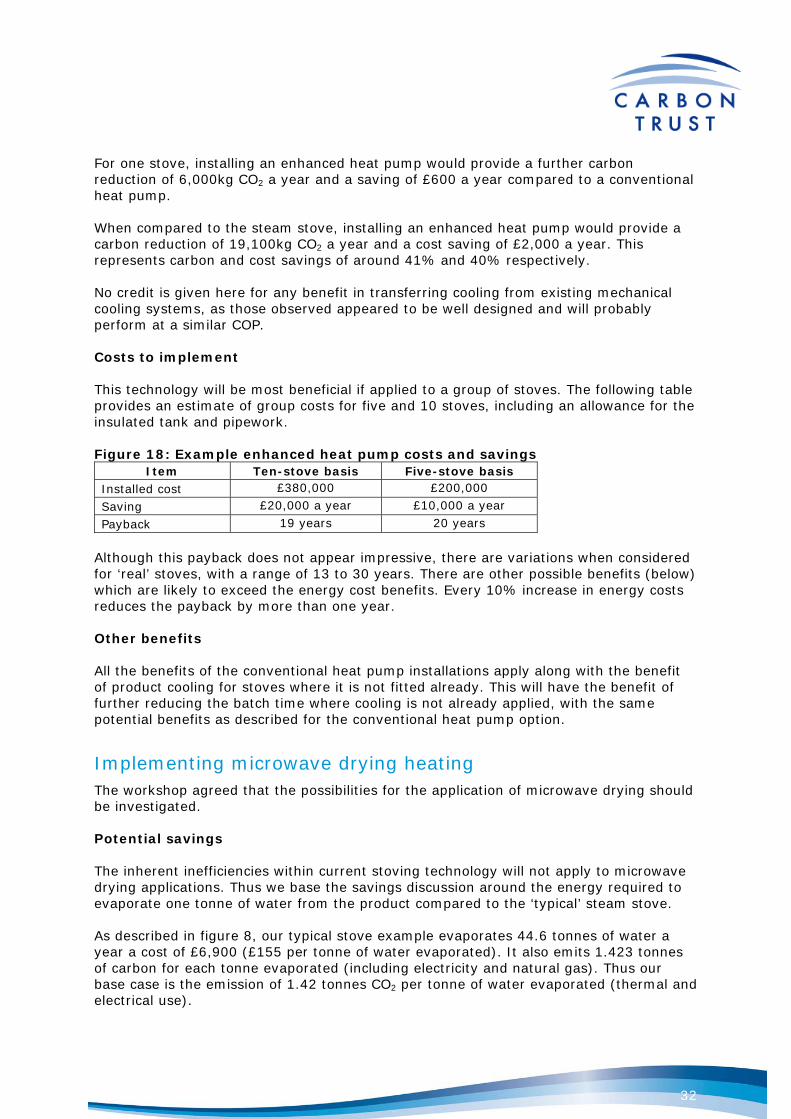
For one stove, installing an enhanced heat pump would provide a further carbon reduction of 6,000kg CO2 a year and a saving of £600 a year compared to a conventional heat pump. When compared to the steam stove, installing an enhanced heat pump would provide a carbon reduction of 19,100kg CO2 a year and a cost saving of £2,000 a year. This represents carbon and cost savings of around 41% and 40% respectively. No credit is given here for any benefit in transferring cooling from existing mechanical cooling systems, as those observed appeared to be well designed and will probably perform at a similar COP. Costs to implement This technology will be most beneficial if applied to a group of stoves. The following table provides an estimate of group costs for five and 10 stoves, including an allowance for the insulated tank and pipework. Figure 18: Example enhanced heat pump costs and savings
Item Ten-stove basis Five-stove basis Installed cost £380,000 £200,000
Saving £20,000 a year £10,000 a year
Payback 19 years 20 years
Although this payback does not appear impressive, there are variations when considered for ‘real’ stoves, with a range of 13 to 30 years. There are other possible benefits (below) which are likely to exceed the energy cost benefits. Every 10% increase in energy costs reduces the payback by more than one year. Other benefits All the benefits of the conventional heat pump installations apply along with the benefit of product cooling for stoves where it is not fitted already. This will have the benefit of further reducing the batch time where cooling is not already applied, with the same potential benefits as described for the conventional heat pump option.
Implementing microwave drying heating The workshop agreed that the possibilities for the application of microwave drying should be investigated. Potential savings The inherent inefficiencies within current stoving technology will not apply to microwave drying applications. Thus we base the savings discussion around the energy required to evaporate one tonne of water from the product compared to the ‘typical’ steam stove. As described in figure 8, our typical stove example evaporates 44.6 tonnes of water a year a cost of £6,900 (£155 per tonne of water evaporated). It also emits 1.423 tonnes of carbon for each tonne evaporated (including electricity and natural gas). Thus our base case is the emission of 1.42 tonnes CO2 per tonne of water evaporated (thermal and electrical use).
32
Applying this duty to microwave technology: Evaporating a tonne of water at 60oC requires 2,360kilojoules per kg or 656kWh
per tonne of water evaporated. Microwaves can evaporate water with an efficiency of 83%. Thus the energy required for the microwave machine would be 656/0.83 =
790kWh per tonne of water evaporated. Any evaporated moisture must be removed from the vicinity of the drying
process, so a similar quantity of electricity for fans to remove the moisture-laden air should be allowed for.
Total electricity consumption per tonne of water evaporated is around 1,500kWhe/tonne, emitting 816kg CO2 and costing £90 per tonne of evaporated water.
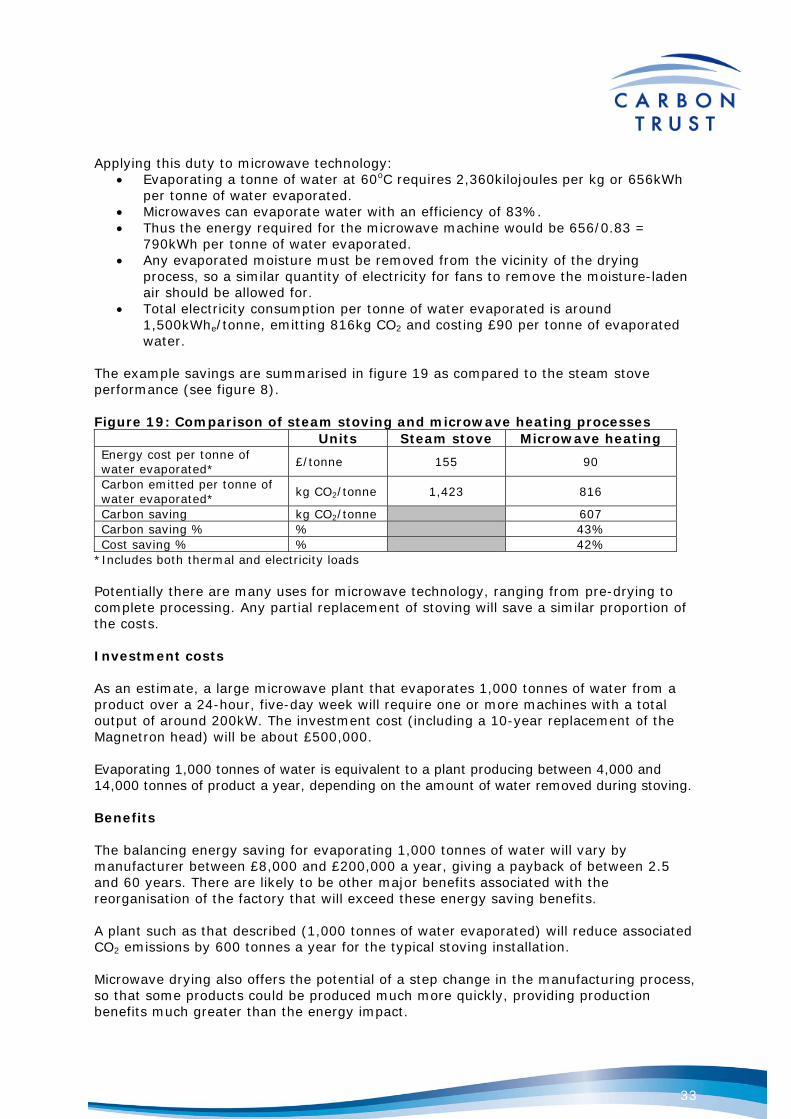
The example savings are summarised in figure 19 as compared to the steam stove performance (see figure 8). Figure 19: Comparison of steam stoving and microwave heating processes
Units Steam stove Microwave heating Energy cost per tonne of water evaporated*
£/tonne 155 90
Carbon emitted per tonne of water evaporated*
kg CO2/tonne 1,423 816
Carbon saving kg CO2/tonne 607 Carbon saving % % 43% Cost saving % % 42%
*Includes both thermal and electricity loads Potentially there are many uses for microwave technology, ranging from pre-drying to complete processing. Any partial replacement of stoving will save a similar proportion of the costs. Investment costs As an estimate, a large microwave plant that evaporates 1,000 tonnes of water from a product over a 24-hour, five-day week will require one or more machines with a total output of around 200kW. The investment cost (including a 10-year replacement of the Magnetron head) will be about £500,000. Evaporating 1,000 tonnes of water is equivalent to a plant producing between 4,000 and 14,000 tonnes of product a year, depending on the amount of water removed during stoving. Benefits The balancing energy saving for evaporating 1,000 tonnes of water will vary by manufacturer between £8,000 and £200,000 a year, giving a payback of between 2.5 and 60 years. There are likely to be other major benefits associated with the reorganisation of the factory that will exceed these energy saving benefits. A plant such as that described (1,000 tonnes of water evaporated) will reduce associated CO2 emissions by 600 tonnes a year for the typical stoving installation. Microwave drying also offers the potential of a step change in the manufacturing process, so that some products could be produced much more quickly, providing production benefits much greater than the energy impact.
33

Using microwaves to dry starch
As a mould material and to assist in removing water from drying product, starch plays an important part in stoving. Spent starch moulding is recovered at the end of the process and recycled as new moulding material. Starch moisture content at the beginning of the process is considered to be operationally important, with quality implications if the moisture is too high. The acceptable dryness range is thought to be between 7% and 7.5% moisture. In certain circumstances, such as if the stove is mechanically cooled or the weather is hot and humid, the moisture level of the starch can be as high as 9%. Thus, most manufacturers include a starch dryer option within their manufacturing process. Starch drying is much closer to the mineral drying processes and seems an ideal candidate for microwave applications. As starch drying was out of scope during the study, no process data was collected. Therefore, indicative savings for an example site stoving process are estimated below from first principles. A site manufacturing 14,250 tonnes of product annually would use about 35,500 tonnes of starch a year (assuming a starch to product ratio of 2.5) the majority of which would be recycled within the process. Removing 1% of the starch moisture (say 7.5% to 6.5%) represents 355 tonnes of evaporated water, which requires about 233,000kWh of energy a year. If the efficiency of the regeneration process is 30% and the steam system efficiency is 75%, this represents a million kWh of gas, emitting around 190 tonnes of CO2 a year. Evaporating the same quantity of water using microwaves at an efficiency of 83% requires 280,000kWh of electricity, emitting 150 tonnes of CO2 a year. In this instance no allowance is required for air to carry away the moisture, as this will be similar for both applications. Annually this represents a modest cost saving of £1,100 and a similarly modest carbon reduction of 40 tonnes. Consequently, replacing an existing steam-powered dryer with a microwave is unlikely to be worthwhile, but if a manufacturer were purchasing a new dryer installation, microwave technology would be worth investigation.
34

Sector-wide business cases We estimate that the sub-sector produces some 76,000 tonnes of gums and jellies a year with the following approximate energy and carbon implications. Figure 20: Confectionery sub-sector energy consumption summary
Units For stoves For overall process Fuel (natural gas) consumed MWh/year 53,000 157,000 Electricity consumed MWh/year 8,000 55,000 CO2 emissions tonnes/year 20,000 60,000 Annual energy costs (rounded up)
£/year 1,600,000 6,500,000
This is the sector basis for the following business case discussion.
Conventional heat pumps
In summary, the rationale for greater use of conventional heat pumps is:
Steam is an external energy source and this heat is lost from the stove when the hot air is emitted.
A heat pump condenses the moisture evaporated within the stove and recycles that energy, augmented by the energy input to the heat pump, to the stove. This theoretically reduces the energy input to the stove dramatically and enables much better control of the moisture level.
Manufacturer experience of heat pumps has given mixed results. The heat pump stoves that are disappointing have longer cycle times than an equivalent steam stove; whereas one of the outstanding benefits of the more successful heat pump stoves is a shorter cycle time. The difference seems to be due to the addition of electrical resistance heaters to boost the speed at which the stove achieves operating temperature.
As a result of the disappointing performance of these early stoves, the industry as a whole has been reluctant to pursue the technology further. However, the success of the later stoves has encouraged some to consider this to be the way forward.
The main barrier, even to those convinced of the viability of the technology, has been a perceived difficulty in retrofitting heat pumps to existing stoves, compounded by a failure to understand the financial benefits of their use. All of the manufacturers we studied have a large number of stoves, all of which represent a considerable capital investment, and the cost of retrofitting any technology is likely to be multiplied by the number of stoves. However, from the analysis, the financial case clearly shows the potential heat pump financial benefit for a typical stove.
A reduction in annual energy costs per stove from £5,000 to £3,700. A reduction in annual carbon emissions of 13 tonnes per stove (28%). A simple payback of less than 20 years (a range of 11 to 38) once the techniques
for retrofitting are understood; there will also be benefits of scale. Potential further benefits in shortening batch cycle time, which could lead either
to greater output or to a rationalisation of production with further cost benefits.
35

Retrofitting heat pumps: proposed plan and benefits Conventional heat pump stoves exist, in some cases are working well and demonstrate savings. However, the benefits from those working well are at least partly obscured by the fact that they are purpose built new stoves with good insulation and air tightness. Those that are not working well are mostly criticised for an extended cycle time, which is sufficient to discourage further implementation. The business case Figure 21 shows the results of our analysis, based upon the industry as a whole. We have assumed 100% market penetration, as there is no reason that with suitable adaptation (allowed for in the project cost) any stove could not be converted to heat pump operation. Figure 21: Business case for conventional heat pump stove implementation
CO2 saving at a steam stove plant 28% Market penetration assumed 100% (within 10 years) Project persistence Indefinite Sector CO2 savings 20,000 x 0.28 = 5,600 tonnes a year Lifetime CO2 savings (10 years) 5,600 x 10 = 56,000 tonnes Sector fuel cost saving at 26% £416,000/year Cost saving large site (20 stoves) £28,000/year
Savings
Cost saving medium site (5 stoves) £7,000/year Large site (20 stoves) £430,000 Costs of
technology Medium site (5 stoves) £135,000 Large site 15 years + production benefits Payback Medium site 19 years + production benefits
While the energy payback for the sector is poor, this masks a wide variation (11 to 30 years) where the project cost would be around £100,000. If the expected market penetration of 100% were to be realised as above, the cost of the CO2 saved over a 10-year project life would be £1.78 per tonne, although the savings would probably continue for much longer.
Enhanced heat pumps
The benefits are the same as for the project described above, but with the addition of heat recovery from a cooling cycle at the end of each batch cycle to preheat the stove at the beginning of the next cycle. This technology is unsuitable for application to one stove alone, and the following case assumes it is applied to a group of stoves. To retain the benefit of the stored heat, sites could organise their stoves into groups, or apply to their whole set of stoves. In the latter case, the costs of implementation could be multiplied up from the 10-stove example below.
36

Enhanced heat pump opportunity: proposed plan and benefits Although heat pumps are understood by the industry, and have been applied, the concept of adding heat recovery is new. Host manufacturers should consider installing it on five to 10 stoves; we have based our business case below on five stoves. The business case The following table shows the results of our analysis, based upon the industry as a whole. We have assumed 100% market penetration, as there is no reason that, with suitable adaptation (allowed for in the project cost) any stove could not be converted to heat pump operation. Figure 22: Business case data for enhanced heat pump stoves
CO2 saving at a steam stove plant 41% Market penetration assumed 100% (within 10 years) Project persistence Indefinite Sector CO2 savings 20,000 x 0.41 = 8,200 tonnes a year Lifetime CO2 savings (10 years)
10 x 8,200 = 82,000 tonnes
Sector fuel cost saving at 41% £640,000/year Cost saving large site (20 stoves) £40,000/year
Savings
Cost saving medium site (5 stoves) £10,000/year Large site (20 stoves) £780,000 Costs of
technology Medium site (5 stoves) £200,000 Large site 19.5 years + production benefits Payback Medium site 20 years + production benefits
Again, the payback period is poor, but this is masked by wide variation in the industry of between 13 and over 30 years. A reasonable project cost could be about £120,000. If 100% market penetration were to be realised as above, the cost of the CO2 saved over 10 years would be £1.83 a tonne, although the savings would probably continue for much longer.
Alternative business case – combined heat pump study
The two demonstration projects above do not offer an especially attractive return on investment. However, it is possible to envisage a combination of the two: install an enhanced heat pump and operate it as both a simple heat pump and a heat recovery heat pump. This would incur costs only slightly above the higher of the two, but potentially gain the market share for both. The potential benefits will fall between the two sets of benefits shown in figure 21 and 22.
37

Figure 23: Business case data for combined heat pump
CO2 saving at a steam stove plant 28 to 41%
Market penetration assumed 100% at an average 34% saving
(within 10 years) Project persistence Indefinite Sector CO2 savings (average of savings %) 20,000 x 34%= 6,800 tonnes a year Lifetime CO2 savings (10 years) 6,800 x 10 = 68,000 tonnes
Sector fuel cost saving at 28 and 41% (448,000 + 640,000)/2 =
£544,000/year Cost saving large site (20 stoves) £28,000 or 40,000 a year
Savings
Cost saving medium site (5 stoves) £7,000 or 10,000 a year Large site (20 stoves) £430,000 or 780,000 Costs of
technology Medium site (5 stoves) £135,000 or 200,000 Large site 15 or 19 years + production benefits Payback Medium site 19 or 20 years + production benefits
A budget cost of the combined project would be £180,000. The cost of the CO2 saved over a 10-year project life would be £2.64 a tonne.
Microwave heating
The concept of using microwaves in creating stoved products is new to the industry. This section discusses how the technology might be tested through a demonstration project. Microwave opportunity: proposed plan and benefits At the workshop and during our site visit, industry representatives were generally positive about the possibilities that microwave technology could contribute to their business. In addition to the drying of sweets, the possibility of drying the starch carrier material was also suggested. As this is a significant energy use, it would seem that further investigation of this opportunity would be worthwhile. Preliminary investigation has suggested that starch drying would be very fast with microwaves, as only the 1% to 2% moisture gained during the drying process needs to be removed. Although this is not a sufficiently attractive project to justify the replacement of existing equipment, it might be worthwhile including this in the work scope to demonstrate when new purchases are appropriate. Before progressing to pilot trials, there would need to be investigation of the di-electric properties of the various products to define conditions best suited to the materials subjected to the microwaves: what absorbs the waves and what is the best frequency; what doesn’t absorb; and how the process reacts to the microwave. At this stage it is difficult to define the form that a microwave system might take and it may be different for each manufacturer. It could either be a stand-alone system dealing with the entire drying requirement, or it could be a hybrid system with a microwave pre-heat and either the existing drying system or a heat pump allied to the existing dryers. The potential business case for this technology proposes energy and carbon savings alone. In addition, there is likely to be a significant increase in productivity, turnover and profit from current systems in the short and medium term, with the potential for a step-change in process to microwave drying in the long-term.
38

We cannot be certain how the technology might be best applied. Different approaches will suit different companies with different products and brands, and this makes it difficult to prepare a generalised case. Nevertheless, a broad outline of potential costs, benefits and the carbon ‘prize’ is presented below. The business case The indicative business case for microwave technology is as follows. A 70% market share is assumed as many but not all products will be suitable for this technology. Figure 24: Business case microwave technology
CO2 saving at a plant 43% Market penetration assumed 70% (within 10 years) Project persistence Indefinite
Sector CO2 savings 20,000 x 0.43 x 0.7 = 6,020 tonnes a year
Lifetime CO2 savings (10 years) 6,020 x 10 = 60,200 tonnes Sector fuel cost saving at 42% £672,000 a year Cost saving large site (45 stoves) £131,000 a year
Savings
Cost saving medium site (10 stoves) £31,000 a year Large site (45 stoves) £450,000 Costs of
technology Medium site (10 stoves) £125,000 Large site 3.4 years + production benefits Payback Medium site 4.0 years + production benefits
The overall strategy could be a staged approach comprising a laboratory demonstration followed by a hosted demonstration at a factory, or to proceed straight to a hosted demonstration in one of the factories.
A laboratory test programme working with samples of product drawn from across the industry with a budget (including setting up the collaboration) of £150,000.
A second stage demonstration at a production site at a cost of £350,000. Based upon the CO2 savings derived from the estimated market penetration over a 10-year project life, the costs of the two stages would be £2.49 and £5.81 per tonne of CO2 with a total cost of £8.31 per tonne of CO2.
39

Summary of sector-wide opportunities The following sector-wide table summarises the projects’ proposed potential, all of which apply to the same carbon emitting process i.e. they are not complementary. Figure 25: Proposed projects’ CO2 savings and costs
Project Potential sector carbon savings
Project cost
tonnes CO2 over a
10-year life £’000s £ per tonne of CO2
Retrofit heat pump demonstration 56,000 100 1.78 Enhanced heat pump demonstration 82,000 150 1.83 Combined heat pump demonstration 68,000 180 2.64
Stage 1 150 2.49 Microwave technology
Stage 2 60,200
350 5.81 Different projects are likely to be applicable for different manufacturers as they consider their products and the needs of their individual businesses.
40

6. Next steps
Next steps for the confectionery stoving sector In general, operational staff do not realise the scale of the cost and carbon saving opportunity that energy efficiency presents. Companies need to do more to engage staff and raise awareness of opportunities to improve energy efficiency. A culture where accepted practices are challenged needs to be encouraged. There are a number of opportunities for energy saving where collaboration as a sector would accelerate implementation.
General good practice measures
Stoves use heat and electrical energy and benefit from conventional energy saving measures already described in Carbon Trust publications. Examples include boiler optimisation, pipework insulation and energy efficient motors.
Process-specific good practice measures
In addition to generic utility efficiency measures, the following process-specific opportunities were identified. Companies using stoving processes will benefit from considering the following efficiency measures (where appropriate): Sub-metering Improved sub-metering of the stoving process will provide the information for more efficient day-to-day operation of the process, as well as providing the evidence for justifying investment in energy-saving opportunities. Humidity control Few of the stoves investigated featured internal humidity control or functional humidity monitoring. Consequently, the humidity level is either controlled manually according to operator experience or automatic venting intervals preset within a stove cycle program. Energy balance calculations indicate that air changes during the process cycle typically account for 50% of the heat energy consumed. This is the largest single heat consumption. Humidity control (relative humidity) of the stoves’ venting procedures can substantially reduce this loss. Potential savings are in the order of 25% of the steam consumption. Insulation The insulation (and air-seal) properties of stove doors are variable, with the poorer doors offering little restriction to air ingress and heat loss. Our metering programme attempted to quantify the effects of insulation, but the many other variables affecting energy consumption prevented any conclusions. Theoretical estimations show that:
The losses from a poorly insulated stove operating with a cold stove either side are about 10% of the heat supplied, and rather more than half of this is lost through the roof and door, which are unaffected by adjacent stoves.
Losses thought the fabric and door can be substantially reduced by fitting insulation to the roof and walls (U-value 0.83W/m2K rather than 2.0W/m2K ) with a suggested saving of about 3% of the heat input.
41

Confectionery manufacturing companies should ensure they are taking advantage of the available support and financial incentives to help them reduce energy and carbon emissions. A variety of support is available through the Carbon Trust to all sizes of business.
‘Innovative’ energy saving opportunities
The sector should maximise energy savings from the manufacturing process. It could consider the following areas capable of achieving a major improvement in the efficiency of the stoving process:
Greater use of heat pumps, similar to those presently used but retrofitted to existing stoves.
Installing enhanced heat pumps that can recover end-of-batch cooling for reheating the next cycle, thereby removing the need for additional resistance heating.
Microwave drying. It is important to note that each of these technologies is addressing the same process, so not all of the benefits can be achieved simultaneously
Next steps for the Carbon Trust The focus of the IEEA Stage 1 investigations was stoving, and therefore any energy saving opportunities identified concern the stoving process, rather than the production of gums and jellies as a whole. The investigations identified microwave drying as innovative and new and capable of a achieving a major step improvement in the efficiency of the stoving process. Therefore, the Carbon Trust is supporting the implementation of identifying novel and efficient methods for drying sweets. Throughout this, the Carbon Trust will continue to disseminate knowledge and help replicate energy-efficiency best-practices across the confectionery sector.
42

43
7. Acknowledgements This report has been prepared by the Carbon Trust from the technical work completed by WSP Environmental UK Ltd with assistance from the Food and Drink Association, host companies, technology suppliers and Nottingham University.

Appendix 1 – further monitoring analysis At the outset of the project, the metering plan was intended to collect data that would support the subsequent investigations. At one site, electricity and steam metering was installed on four stoves of different specifications to collect energy supply data on their operation. This data was supplemented by temperature and relative humidity loggers installed within the stoves to aid understanding of the internal environment and production batch information. At another site, data was used from existing electricity and steam meters on their stoves, again augmented by temperature and humidity loggers installed in the stoves and product batch information. A third site provided data logs from sample stoving batches from a factory. Each of the manufacturers also provided data on:
The construction of their stoves The weights of the tray, trolley, starch and product Recipe and stove programme data to inform the evaporation rates and other key
inputs to the analysis. Data for each manufacturer was analysed separately, but to preserve confidentiality the data presented here is shown without attribution and combined in such a way as to obscure the source of any particular trend or number.
Interpreting temperature and humidity measurements There are two humidity measurements important to stoving:
Relative humidity (RH), expressed as % Absolute humidity (AH), expressed as grams per kilogram of air.
RH is an easily measured indicator of how readily air will receive evaporated moisture. A high percentage discourages evaporation and a low percentage encourages it. AH indicates how much water is present in air. Therefore, in a sealed box, an increase from, say, 10g/kg to 20g/kg of water in 100kg of air means that 1,000g of water has been evaporated. AH cannot be easily measured, but can be calculated by established correlations of RH and temperature. At the same AH (g of water per kg) the RH is much lower at higher temperatures than at lower temperatures. Thus an empty sealed box with ambient air at 21oC and 50% RH will have an AH of 7.85g/kg. If that same air is heated to 55oC without additional water (no evaporation) the RH will fall to 6.8%, while the AH remains the same. Similarly if a sealed box with air at 60oC and 20% RH is allowed to cool without condensing any moisture to 33oC, the RH will rise to 99%; any further cooling will cause condensation as the RH rises to 100%. Stoves are not sealed boxes and, however well sealed, all will suffer inward leakage of ambient air as well as evaporating water through a stoving drying period. This complicates the analysis, as explained below.
44

Investigation findings Figures A1 to A4 present temperature, relative humidity and absolute humidity profiles for multiple stove batches from all participants’ sites. Different stoving times are represented within the data, but in most cases the readings change only marginally, so the graphs focus upon the beginning and end of the stoving periods.
Temperature
Temperature through sample batches
0
10
20
30
40
50
60
70
80
star
t+0
star
t+1
star
t+2
star
t+3
star
t+4
star
t+5
star
t+6
star
t+7
star
t+8
star
t+9
star
t+10
star
t+11
end
-11.
5
end
-10.
5
end
-9.5
end
-8.5
end
-7.5
end
-6.5
end
-5.5
end
-4.5
end
-3.5
end
-2.5
end
-1.5
end
-0.5
Tem
pera
ture
, deg
C
1 T
2 T
3 T
4 T
5 T
6 T
7 T
8 T
9 T
10 T
11 T
12 T
13 T
14 T
15 T
16 T
17 T
18 T
19 T
Figure A1: Example temperature profiles in stoving cycles Stoving temperatures were expected to range between 50oC and 70oC, with some products being stoved at a lower temperature of about 45oC. We found two typical groups of temperature settings of 45-50oC and 65-70oC. Examples from more than one manufacturer occur in each range. At the end of the cycle it is clear which batches involve mechanical cooling, as the rate of temperature reduction is much quicker.
45

Relative humidity Relative humidity through sample batches
0
10
20
30
40
50
60
star
t+0
star
t+1
star
t+2
star
t+3
star
t+4
star
t+5
star
t+6
star
t+7
star
t+8
star
t+9
star
t+10
star
t+11
end
-11.
5
end
-10.
5
end
-9.5
end
-8.5
end
-7.5
end
-6.5
end
-5.5
end
-4.5
end
-3.5
end
-2.5
end
-1.5
end
-0.5
Rel
ativ
e hu
mod
ity (
%)
1 RH
2 RH
3 RH
4 RH
5 RH
6 RH
7 RH
8 RH
9 RH
10 RH
11 RH
12 RH
13 RH
14 RH
15 RH
16 RH
17 RH
18 RH
19 RH
Figure A2: Example relative humidity (RH) profiles in stoving cycles In most cases the relative humidity profiles show the expected pattern. If no evaporation from the product were taking place, the RH would fall as the temperature rose to rather less than 10%, depending upon the starting point. This appears to happen in only one case, batch 12, but this batch starts quite quickly after the previous one and at a higher temperature than is common, exaggerating the effect.
Absolute humidity
The absolute humidity graph combines the results of the temperature and RH data.
Absolute humidity through sample batches
0
10
20
30
40
50
60
star
t+0
star
t+1
star
t+2
star
t+3
star
t+4
star
t+5
star
t+6
star
t+7
star
t+8
star
t+9
star
t+10
star
t+11
end
-11.
5
end
-10.
5
end
-9.5
end
-8.5
end
-7.5
end
-6.5
end
-5.5
end
-4.5
end
-3.5
end
-2.5
end
-1.5
end
-0.5
Abs
olut
e hu
mid
ity (
g/kg
)
1 AH
2 AH
3 AH
4 AH
5 AH
6 AH
7 AH
8 AH
9 AH
10 AH
11 AH
12 AH
13 AH
14 AH
15 AH
16 AH
17 AH
18 AH
19 AH
Figure A3: Example absolute humidity (AH) profiles in stoving cycles
46

Any increase in AH is likely to represent evaporation of water from the product and a reduction indicates either fresh air entering the stove from outside or the application of mechanical cooling at the end of the cycle. The data falls into two groups, matching the two temperature groups:
One set shows an immediate and substantial (dramatic in some cases) increase in AH as the temperature rises, indicating substantial evaporation from the product in this early stage. Some of these increases reduce with time (indicating the input of fresh air) and others remain substantially constant until cooling is applied.
A second set increases only slightly at the outset then reduces through the cycle. This is generally, but not exclusively, the longer batches, and includes sample batches from all three manufacturers. It also includes the heat pump stoves (two manufacturers).
This indicates two different operating patterns related to different product types, including different products from the same manufacturer. A development of this analysis shows the changes in absolute humidity. Some batches show an oscillating pattern, also visible in the temperature and AH graphs, which suggests intermittent bleeding of fresh air into the stove. Others show a low, continuous trace suggesting a slow evaporation rate or a constant bleed of air into the stove, or both. This group includes the heat pump stoves, which continuously remove moisture from the stove air.
Change in AH through sample batches
-15
-10
-5
0
5
10
15
20
25
star
t+0
star
t+1
star
t+2
star
t+3
star
t+4
star
t+5
star
t+6
star
t+7
star
t+8
star
t+9
star
t+10
star
t+11
end
-11.
5
end
-10.
5
end
-9.5
end
-8.5
end
-7.5
end
-6.5
end
-5.5
end
-4.5
end
-3.5
end
-2.5
end
-1.5
end
-0.5
chan
ge in
abs
olut
e hu
mid
ity (
g/kg
)
1 AH
2 AH
3 AH
4 AH
5 AH
6 AH
7 AH
8 AH
9 AH
10 AH
11 AH
12 AH
13 AH
14 AH
15 AH
16 AH
17 AH
18 AH
19 AH
Figure A4: Changes in absolute humidity through stoving cycles
47

Steam stoves
Steam consumption was available for all sites in varying detail. Headline data shows specific steam consumption in a range of 0.40kg to 1.80kg steam/kg product within the stoves themselves. This corresponds to carbon emissions of 0.06kg to 0.30kg CO2/kg of product (see figure A5). Longer term data for the total consumption of the whole gum production process indicates a range of 1.30kg to 6.0kg steam/kg product. This corresponds to carbon emissions of 0.20kg to 1.00kg CO2/kg of product. This significant variation is attributed to:
Differences in stoving times The percentage moisture removed in each batch process Better results from newer stoves.
Hence, specific steam consumption is a poor metric upon which to base comparisons across the industry. An attempt to correlate this with the moisture reduction in the product significantly reduced the spread of these results: 3.5kg to 12kg steam per kilogramme water evaporated, 0.5kg to 1.8kg CO2 per kg of water evaporated (see figure A5). This is still quite a large band, which seems to mainly relate to stoving time. Electrical consumption In steam stoves, the electrical consumption comes from internal fans circulating the air. Installed fan energy varies between and within the sites studied as different generations of stove designs have evolved. Accordingly, the energy ratios for the steam stoves at the three sample sites vary substantially from 0.15kWh to 0.6kWh/kg product, carbon emissions of 0.04kg to 0.08kg CO2/tonne of product.
Heat pump stoves
For heat pump stoves much less data is available as there are fewer in use, but it does show a considerable reduction in energy consumption over steam stoves processing a similar product. This reduction is sufficiently marked that the carbon emissions reduce by around 50% (on the basis of either product weight or water evaporated, but for the same type of product in each case). The reduction is despite the higher carbon emissions from electricity (0.544 kgCO2/kWh), rather than natural gas (0.184kgCO2/kWh). The comparison between steam and heat pump stoves is shown in figure A5. Stove specific carbon emissions by product weight
0
0.1
0.2
0.3
0.4
Low est Typical Highest A B
Steam stoves Heat pump stoves
kg C
O2
per
kg
of
pro
du
ct
Emissions due tosteam
Emissions due toelectricity
Stove specific carbon emissions by water evaporated
0
0.5
1
1.5
2
Low est Typical Highest A B
Steam stoves Heat pump stoves
kg C
O2
per
kg
of
pro
du
ct
Emissions due tosteam
Emissions due toelectricity
Figure A5: CO2 emissions from stoving (steam stoves and heat pump stoves)
48

49
Data analysis We originally intended to model the performance of a typical stove, taking onto account evaporation, its physical properties, trolleys, starch, the product and the influx of air, deliberate or otherwise. However, the data clearly shows very different modes of operation between the stoves. Batch characteristics associated with a similar product type varied within the same factory as well as between different manufacturers. Although the analysis was completed on the initial data set (and presented as a ‘typical stove’), the task of repeating that analysis on the final data set for all these different variables is monumental and of doubtful value. Instead, the justification of the innovative technologies discussed in this report is based on the headline figures, supported by the data collected from each manufacturer’s stoves. This procedure is described in the main text and acknowledges the affects that process variation has on any conclusions.

The Carbon Trust is funded by the Department for Environment and Climate Change (DECC), The Department for Business, Enterprise and Regulatory Reform (BERR), the Scottish Government, the Welsh Assembly Government and Invest Northern Ireland. Whilst reasonable steps have been taken to ensure that the information contained within this publication is correct, the authors, the Carbon Trust, its agents, contractors and sub-contractors give no warranty and make no representation as to its accuracy and accept no liability for any errors or omissions. Carbon Trust trademarks, service marks or logos used in this publication, and copyright in it, are the property of the Carbon Trust. Nothing in this publication shall be construed as granting any licence or right to use or reproduce Carbon Trust trademarks, service marks, logos, copyright or any proprietary information in any way without the Carbon Trust’s prior written permission. The Carbon Trust enforces infringements of its intellectual property rights to the full extent permitted by law. The Carbon Trust is a company limited by guarantee and registered in England and Wales under Company number 4190230 with its Registered Office at: 6th Floor, 5 New Street Square, London, EC4A 3BF.