Indoor Air Quality Assessment and health impact with ... · rural Lucknow homes ... Metro rail...
50
ETH Conference on Combustion Generated Nanoparticles – Session 6B: Health session- Thursday, 22 nd June 2017 Indoor Air Quality Assessment and health impact with respect to household conditions in urban and rural Lucknow homes Dr. Alfred J. Lawrence Asst. Professor, Isabella Thoburn College, Lucknow,India.
-
Upload
vuongkhanh -
Category
Documents
-
view
212 -
download
0
Transcript of Indoor Air Quality Assessment and health impact with ... · rural Lucknow homes ... Metro rail...

ETH Conference on Combustion Generated Nanoparticles – Session 6B: Health session- Thursday, 22nd June 2017
Indoor Air Quality Assessment and
health impact with respect to
household conditions in urban and
rural Lucknow homes
Dr. Alfred J. Lawrence
Asst. Professor,
Isabella Thoburn College,
Lucknow,India.

INTRODUCTION

INDIA AND AIR POLLUTION CRISIS
Two thirds of the deaths and lost life years associated with air pollution on a global scale occur in Asia.
About 340 million people in living in cities and by 2030 this is expected to reach 590 million.
Outdoor air pollution in India contributes to more than half a million premature deaths each year at the cost of hundreds of billions of dollars (Geophysical Research Letters).
Four Indian cities Gwalior (2), Allahabad (3), Patna (6) and Raipur (7) figured in the top seven most polluted cities in the world (WHO).
India reportedly surpassed China early 2016 in the overall amount of fine particulate matter pollution its citizens are exposed to (Greenpeace).
Centre for Science and Environment (CSE), India has declared air pollution as a “national crisis”.
The odd-even scheme was implemented by Delhi government in first and second fortnights of January and April last year as an "emergency" measure to tackle air pollution.
In some of Indian cities air has particulate matter (PM) levels five time more than safety limits, nearly 52% cities at critical PM10 level (equal or more than 1.5 times limit).
according to the State of Global Air Report 2017, a joint study by the Health Effects Institute in Boston, Massachusetts and the Institute of Health Metrics and Evaluation in Seattle, Washington. More than half of the deaths due to PM exposure occurred in India and China together .

A MATTER OF GRAVE CONCERN FOR NORTHERN INDIA
• Not a single city in northern India meets international air quality standards (Greenpeace report) that estimates air pollution kills more than 1 million Indians each year and takes 3% off the country’s GDP.

URBAN AREAS

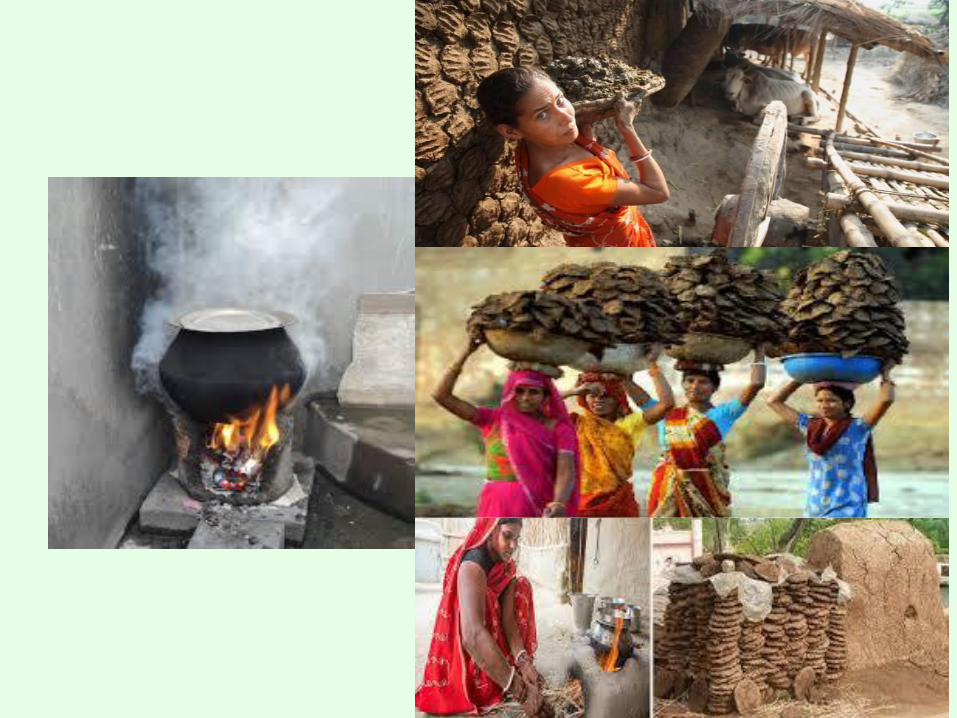
INDIAN RURAL SCENARIO
70% of the population resides in rural areas or villages according to World Bank survey done in 2014.
According to the 2011 Census, an estimated 142 million rural homes (almost 85% of total
rural households in India) depend on traditional biomass fuel for cooking. 45 per cent of total rural households do not have electricity. They use wood and kerosene to
light up homes. 1.3 million deaths are reported in India due to IAP every year from smoke from cooking,
heating and lighting activities- WHO Biomass is used for cooking in 67 percent of all households in India, including 87 percent of
rural households (CENSUS 2011). The use of biomass fuel associated with acute lower respiratory tract infection. In children
with acute lower respiratory infect ion, 24.8% had pneumonia, 45.5% had severe pneumonia, and 29.7% had very severe disease.
A recent Asian emission inventory has reported that the household biomass burning
contributes to about 53% of the total PM2.5 emissions in India

RURAL PLEA

INDOOR AIR POLLUTION
OUTDOOR POLLUTION
INDOOR POLLUTION
US EPA – “Indoor
levels of pollutants
may be 2-5 times, and
occasionally more than 100 times
higher than outdoor levels.”
IAP one of the four most critical global environmental problems in developing countries (WHO). In Southeast Asia, Indoor Air Pollution ranked third among risk factors in the report of the Global Burden of Disease
34 percent of the people who spend most of their time indoors, in offices and at homes, have various types of respiratory diseases because of the IAP - Artemis hospital
Indoor time
Home
55%
Work
33%
Other places
4%
90% time is spent indoors approx.

Global Health Risks Report - WHO
2017 State of Global Air Report

KEY FACTORS AFFECTING THE IAQ
Outdoor air pollutants
Building characteristics
Building Material
Building occupancy
Customs, habits and socio economic status
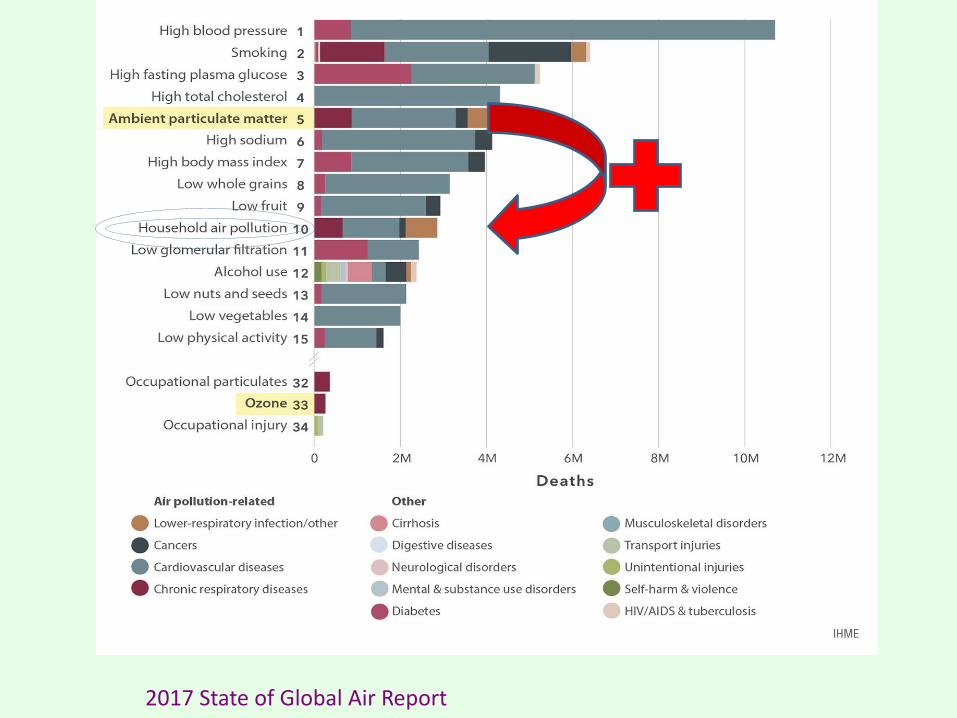
Are we affected by poor IAQ?
• The very young are at risk
– Lungs are not fully developed
– Faster breathing rate: more air volume/body weight
• The very old are at risk
– Undiagnosed lung or heart disease
– Pollution can exacerbate these conditions
• Persons with chronic illnesses: Respiratory,
circulatory, or cardiac diseases
Yes, EVERYONE!
• Even healthy persons can be affected
when they exercise outdoors, or if the
concentration of pollutants is very high indoors

How are we Affected?
• We breathe in 6-10 liters of air per minute (15 -20 m3/d)
– Harmful chemicals may be absorbed quickly without us being aware
• Air pollutants come into contact first with our respiratory system, so the lungs are most affected due to poor IAQ
• Indoor Air pollution may also affect the
– Heart
– Circulatory system
– Immune system

REASON FOR THE STUDY/MOTIVATION

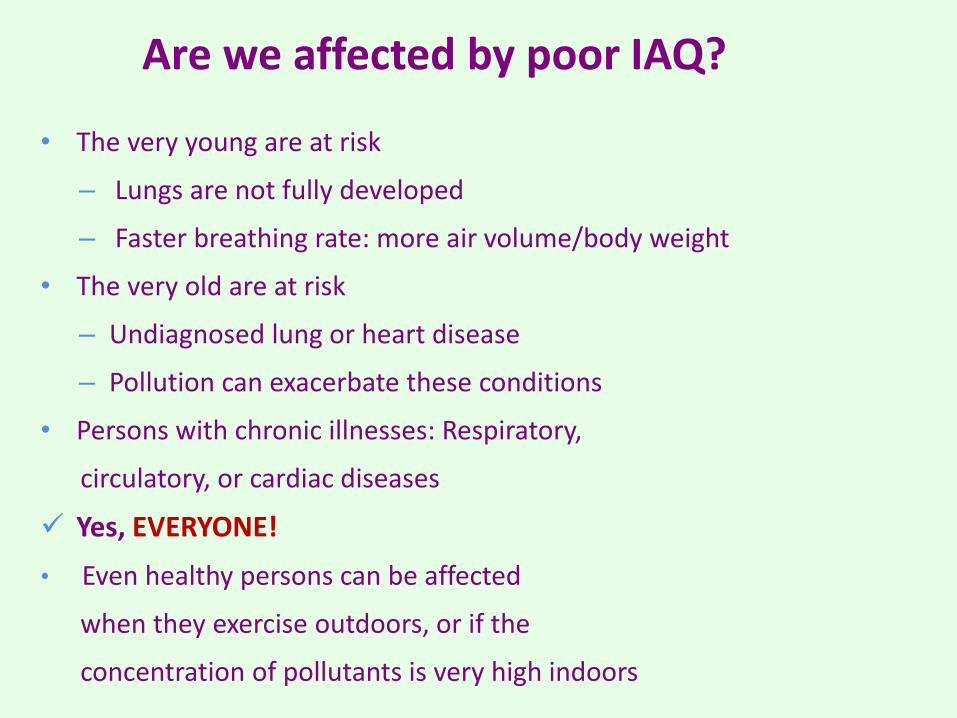
Daily pollution on roads of Urban Lucknow
Occupants exposed to loads of RSPM by heavy Traffic & Road dust.

Increase in Vehicular Rush is the major cause of Pollution in Urban Lucknow

Open garbage burning is one of the major causes of Increased RSPM
pollutants being added to environment by diesel Motors
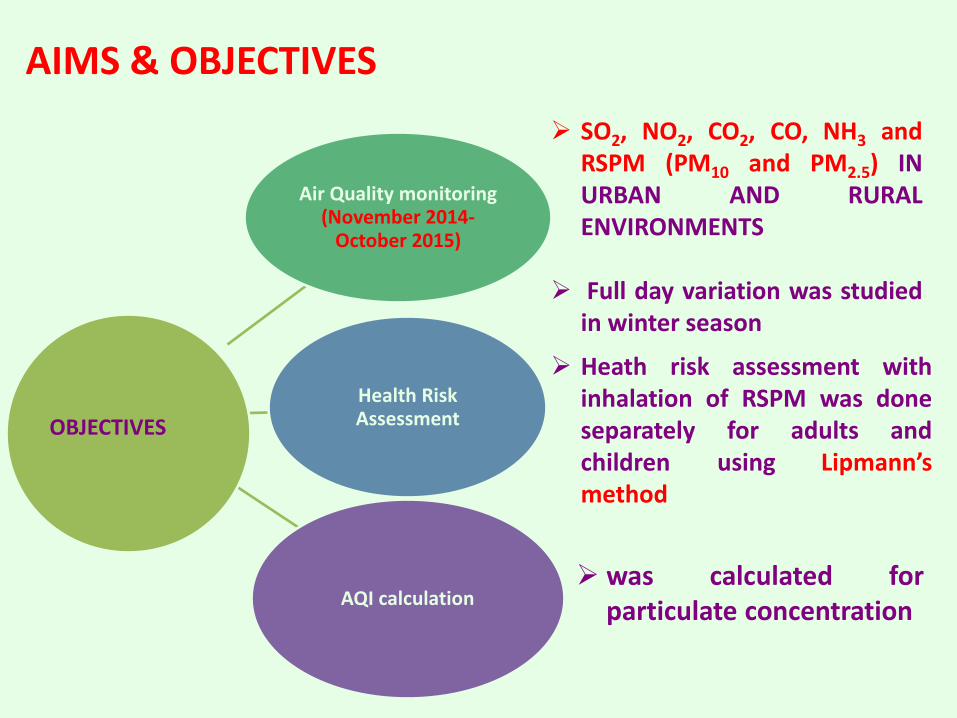
AIMS & OBJECTIVES
Air Quality monitoring (November 2014-
October 2015)
Health Risk Assessment
AQI calculation
OBJECTIVES
SO2, NO2, CO2, CO, NH3 and RSPM (PM10 and PM2.5) IN URBAN AND RURAL ENVIRONMENTS
Full day variation was studied
in winter season
was calculated for particulate concentration
Heath risk assessment with inhalation of RSPM was done separately for adults and children using Lipmann’s method

LUCKNOW- THE CITY OF CULTURAL HERITAGE
Lucknow city is located at 26º51ˈN and 80º55ˈE.
According to the Census of India population of Lucknow is 2815033 and present area (2011) of Lucknow is envisaged to be 310 sq km.
The second largest city of North India and traditionally known for its rich cultural heritage.
Recently added in the central government’s list of “Smart cities” for the improving life style pattern.
Metro rail project and a full fledged international cricket stadium are in the offing.
The major industries in the Lucknow Urban Agglomeration include aeronautics, machine tools, distillery chemicals, furniture and chicken embroidery.
It is among the top 15 cities of India by GDP
Four Indian National Highways originate at Lucknow's Hazratganj intersection
Multiple modes of public transport are available such as taxis, city buses, cycle, rickshaws ,auto rickshaws and compressed natural gas (CNG) low floor buses with and without air conditioning.
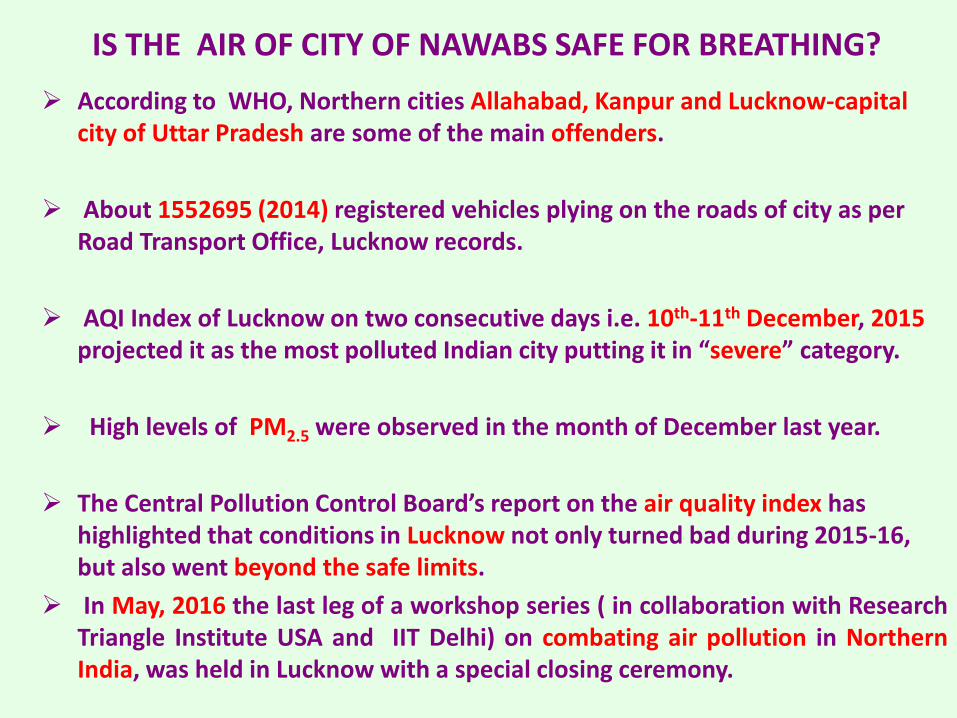
IS THE AIR OF CITY OF NAWABS SAFE FOR BREATHING?
According to WHO, Northern cities Allahabad, Kanpur and Lucknow-capital city of Uttar Pradesh are some of the main offenders.
About 1552695 (2014) registered vehicles plying on the roads of city as per Road Transport Office, Lucknow records.
AQI Index of Lucknow on two consecutive days i.e. 10th-11th December, 2015 projected it as the most polluted Indian city putting it in “severe” category.
High levels of PM2.5 were observed in the month of December last year.
The Central Pollution Control Board’s report on the air quality index has highlighted that conditions in Lucknow not only turned bad during 2015-16, but also went beyond the safe limits.
In May, 2016 the last leg of a workshop series ( in collaboration with Research Triangle Institute USA and IIT Delhi) on combating air pollution in Northern India, was held in Lucknow with a special closing ceremony.

Half of the world’s 20 most polluted cities are in India, said a World Health Organization report, June 2016.
Gwalior in Madhya Pradesh and Allahabad in Uttar Pradesh take the second and third spot, respectively.
Capital City of Uttar Pradesh, Lucknow features at 18th Place.
Lucknow at 18th spot
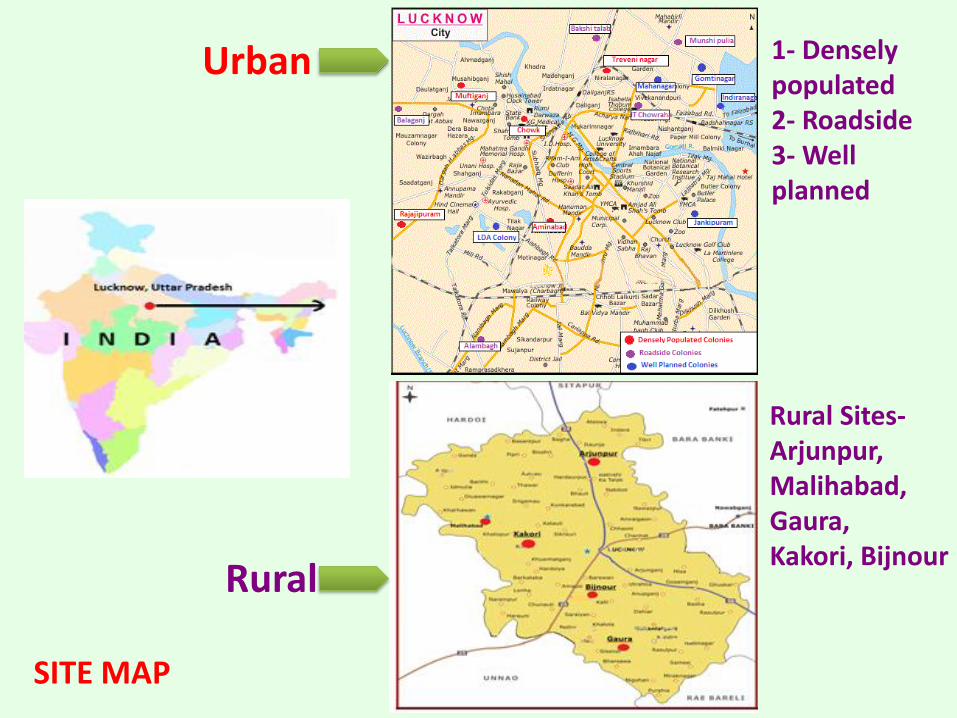
Urban
Rural
SITE MAP
1- Densely populated 2- Roadside 3- Well planned
Rural Sites- Arjunpur, Malihabad, Gaura, Kakori, Bijnour

INSTRUMENTATION Contaminant Concentration in air Principal Instrument
used for
measurement
Outdoor Indoor
CO 5000 1000 Non Dispersive Infra-
Red (NDIR)
YES-205
multigas
monitor
CO2 02 01 Non Dispersive Infra-
Red (NDIR)
YES-206
Falcon IAQ
monitor
SO2 80 40 Improved West and
Gaeke method
Handy
Sampler
NO2 80 40 Jacob and Hochheiser
modified (NaOH-
NaAsO2) method
Handy
Sampler
PM 2.5 60 25 Gravimetric APM 550
PM 10 100 50 Gravimetric APM 550
PRINCIPALS FOR USED TECHNIQUES
A
B
C
A= YES 205- Multigas Monitor, B=Handy Sampler, C= APM 550- Envirotech
QUALITY ASSURANCE
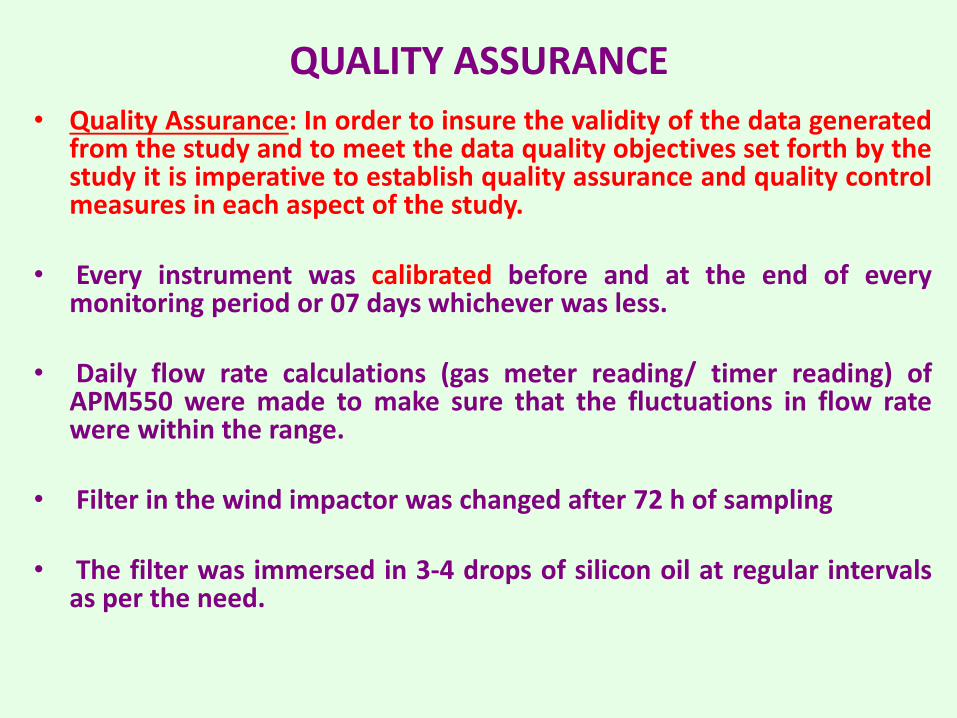
• Quality Assurance: In order to insure the validity of the data generated from the study and to meet the data quality objectives set forth by the study it is imperative to establish quality assurance and quality control measures in each aspect of the study.
• Every instrument was calibrated before and at the end of every
monitoring period or 07 days whichever was less. • Daily flow rate calculations (gas meter reading/ timer reading) of
APM550 were made to make sure that the fluctuations in flow rate were within the range.
• Filter in the wind impactor was changed after 72 h of sampling • The filter was immersed in 3-4 drops of silicon oil at regular intervals
as per the need.

Questionnaire survey
Health Status
Educational profile
Household characteristics
Living Standards
Survey was done in two phases
Hospitals
Houses Survey results formed a basis of
HOUSE SELECTION

The Meteorological data was considered. The Wind profile along with the criteria for house selection
is shown.
Nov 2013
Dec 2013, Sep
2013

House 1
House 2
May 2011
June 2011
August 2011
October 2011
Jan, Mar
2013
Feb, Apr
Jun, Jul
2013
Aug, Oct
2013

RESULTS AND DISCUSSION

Pollutant Summer
Season
Rainy Season Winter Season
CO ( ppm) 0.3±0.5 0.5±0.1 0.8±0.14
CO2 (ppm) 510±22 565±2 498±6
SO2 ( ppm) 0.0367±0.002 0.0217±0.11 0.014±0.082
NO2(ppm) 0.049±0.007 0.024±0.021 0.011±0.017
NH3 ( ppm) 0.010±0.002 0.047±0.04 0.020±0.04
H2S (ppm) BDL 0.01±0.04 0.010±0.03
PM10( µg/m3) 215±36 145±40 280±19
PM2.5(µg/m3) 160±13 84±9 85±18
Pollutant Summer Season Rainy
Season
Winter
Season
CO ( ppm) BDL 0.85±1.0 1.90±0.52
CO2 (ppm) 245±4 326±68 492±16
SO2 (ppm) 0.033±0.003 0.020±0.06
5
0.020±0.03
NO2(ppm) 0.045±0.009 0.026±0.01
3
0.022±0.09
NH3 ( ppm) 0.014±0.006 0.07±0.02 0.025±0.06
H2S ( ppm) BDL 0.03±0.06 0.013±0.06
PM10(µg/m3) 87±11 264±26 315±24
PM2.5(µg/m3) 51±0.45 113±17 190±65
AVERAGE YEARLY CONCENTRATION OF POLLUTANTS IN DIFFERENT ENVIRONMENTS NOVEMBER 2014-OCTOBER 2015
Urban Rural
Mean concentration of PM10 and PM2.5, at both sites (rural and urban) were higher than the WHO Indoor Air Quality Standards.
Mean concentration of gaseous pollutants were within the threshold limit Comparatively lesser concentrations of pollutants in rainy season were attributed to
wash out effect Winter season was more risky for rural population
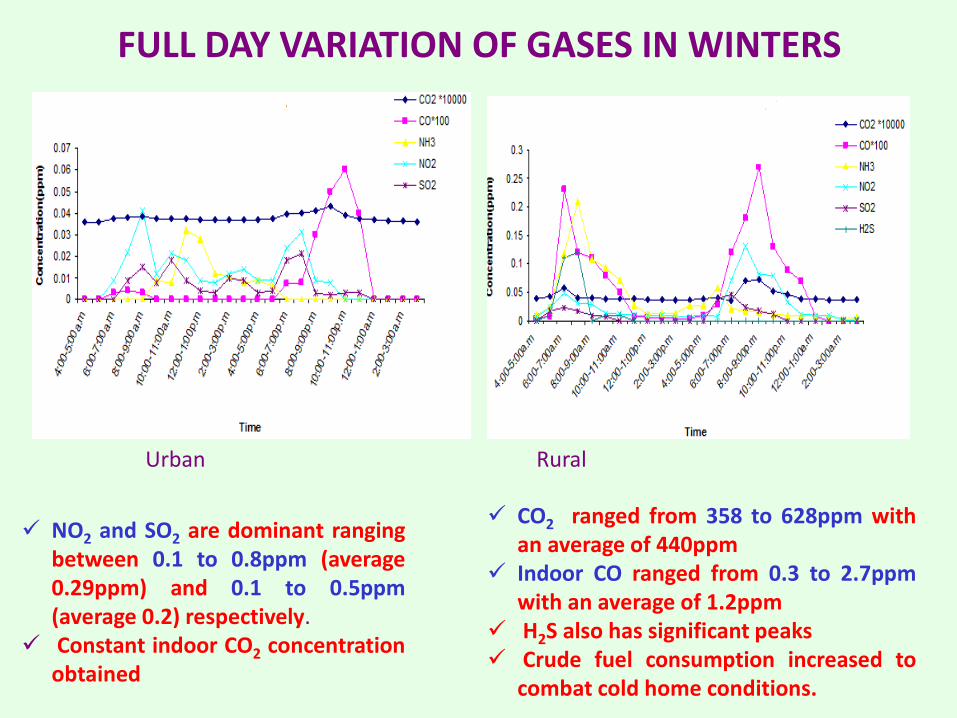
FULL DAY VARIATION OF GASES IN WINTERS
Urban Rural
NO2 and SO2 are dominant ranging between 0.1 to 0.8ppm (average 0.29ppm) and 0.1 to 0.5ppm (average 0.2) respectively.
Constant indoor CO2 concentration obtained
CO2 ranged from 358 to 628ppm with an average of 440ppm
Indoor CO ranged from 0.3 to 2.7ppm with an average of 1.2ppm
H2S also has significant peaks Crude fuel consumption increased to
combat cold home conditions.

Variation of indoor PM2.5 at Urban sites
20
30
40
50
60
70
80
90
100
Mar
chApr
ilM
ayJu
neJu
ly
August
Sept
Oct
NovDec ja
nFe
b
Mar
ch
con
cen
tra
tio
n i
n u
g/
m3
WHO Mahanagar Chowk Alambagh
Variation of Indoor PM10 at Urban Sites
0
50
100
150
200
250
300
350
400
Mar
chApr
ilM
ayJu
neJu
ly
August
Sept
Oct
NovDec jan Fe
b
Mar
ch
Co
nce
ntr
atio
n in
ug/
m3
WHO Mahanagar Chowk Alambagh
Variation of indoor PM2.5 at rural sites
20
30
40
50
60
70
80
Mar
chApr
ilM
ayJu
neJu
ly
August
Sept
Oct
NovDec ja
nFe
b
Mar
ch
con
cen
trat
ion
in u
g/m
3
WHO kakori Gudamba
Variation of Indoor PM10 at rural Sites
0
50
100
150
200
250
300
350
400
Mar
chApr
ilM
ayJu
neJu
ly
August
Sept
Oct
NovDec ja
nFe
b
Mar
ch
Co
nce
ntr
atio
n in
ug/
m3
WHO kakori Gudamba
INDOOR VARIATION OF PM 2.5 AND PM 10 IN URBAN AND RURAL MICROENVIRONMENTS
(a) (b)
(c) (d)

FULL DAY VARIATION OF PARTICULATE MATTER
0
20
40
60
80
100
120
140
160
8:00
AM
9:00
AM
10:00
AM
11:00
AM
12:00
noon
1:00
PM
2:00
PM
3:00
PM
4:00
PM
5:00
PM
6:00
PM
7:00
PM
8:00
PM
Time Scale
Co
ncen
trati
on
in
ug
/m3
Urban
Rural
0
20
40
60
80
100
120
8:00
AM
9:00
AM
10:0
0 AM
11:0
0 AM
12:0
0 noo
n
1:00
PM
2:00
PM
3:00
PM
4:00
PM
5:00
PM
6:00
PM
7:00
PM
8:00
PM
Time scale
Co
ncen
trati
on
in
ug
/m3
Urban
Rural
PM10 and PM2.5 were found to be higher in rural indoor environment as compared to urban environment
Concentration very dangerous in
winter season Highest values being obtained at day
time when cooking was in progress Use of solid fuel like wood/ coal/ cow
dung for cooking and heating was related with the high particulate emission indoors
In urban indoor environment major
source of particulate emission was vehicular emission
Full day variation of (a) PM10 and (b) PM12.5at urban and rural sites
(a)
(b)

CALCULATED INHALATION RATE OF PARTICULATE MATTER
Pollutant Summer Season Rainy Season Winter Season
Adult
(70 kg )
Child
(2year old)
Adult
(70 kg )
Child
(2year old)
Adult
(70 kg )
Child
(2year
old)
PM10 490.27 139.5 439.40 137.6 478.6 165.3
PM2.5 326.19 77.1 325.7 81.45 316.36 89.8
Summer Season Rainy Season Winter Season
Pollutant Adult
(70 kg)
Child
(2year old)
Adult
(70 kg)
Child
(2year old)
Adult
(70 kg )
Child
(2year
old)
PM10 473.3 127.5 432.30 129.2 503.22 187.4
PM2.5 267.4 59.4 301.2 71.2 345.49 102.3
Urban
Rural
Intake= μg/day
In winter season inhalation rate of RSPM is more in rural homes due to excessive crude fuel combustion
For adults inhalation rate of RSPM was highest in summer season mainly due to infiltration.
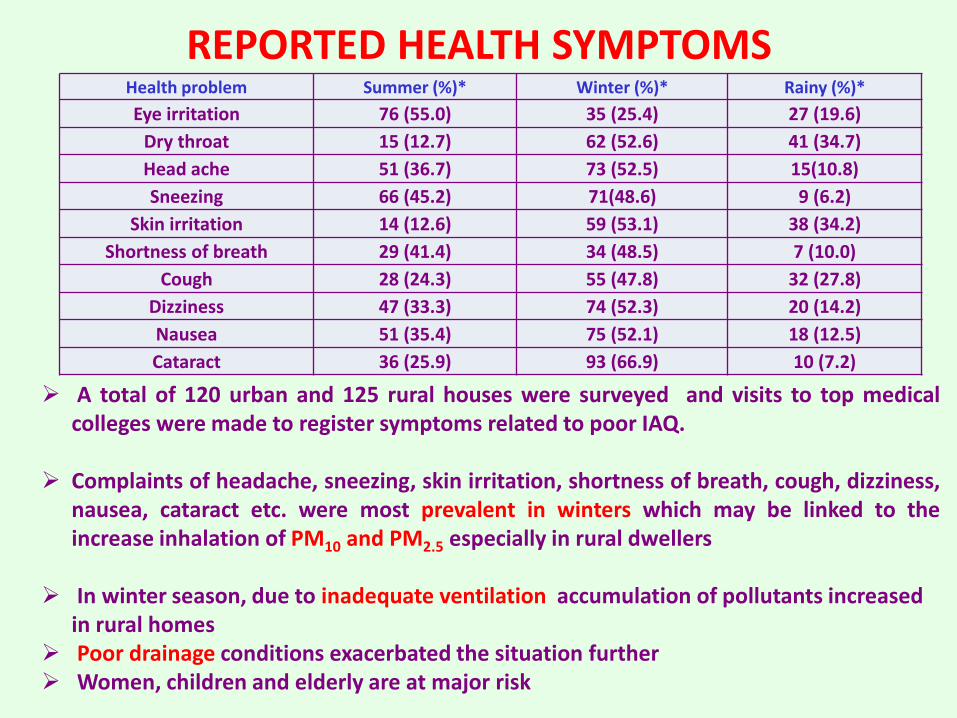
REPORTED HEALTH SYMPTOMS Health problem Summer (%)* Winter (%)* Rainy (%)*
Eye irritation 76 (55.0) 35 (25.4) 27 (19.6)
Dry throat 15 (12.7) 62 (52.6) 41 (34.7)
Head ache 51 (36.7) 73 (52.5) 15(10.8)
Sneezing 66 (45.2) 71(48.6) 9 (6.2)
Skin irritation 14 (12.6) 59 (53.1) 38 (34.2)
Shortness of breath 29 (41.4) 34 (48.5) 7 (10.0)
Cough 28 (24.3) 55 (47.8) 32 (27.8)
Dizziness 47 (33.3) 74 (52.3) 20 (14.2)
Nausea 51 (35.4) 75 (52.1) 18 (12.5)
Cataract 36 (25.9) 93 (66.9) 10 (7.2)
A total of 120 urban and 125 rural houses were surveyed and visits to top medical colleges were made to register symptoms related to poor IAQ.
Complaints of headache, sneezing, skin irritation, shortness of breath, cough, dizziness, nausea, cataract etc. were most prevalent in winters which may be linked to the increase inhalation of PM10 and PM2.5 especially in rural dwellers
In winter season, due to inadequate ventilation accumulation of pollutants increased
in rural homes Poor drainage conditions exacerbated the situation further Women, children and elderly are at major risk

Eye irritation
Skin irritation
Cataract
Nusea Dry throat
Headache
Sneezing
Cough
Sneezing
Dizziness
Eye irritation
Cough Short breath
0
10
20
30
40
50
60
70
80
Summer Rainy Winter
SEASON WIS REPORTED HEALTH SYMPTOMS
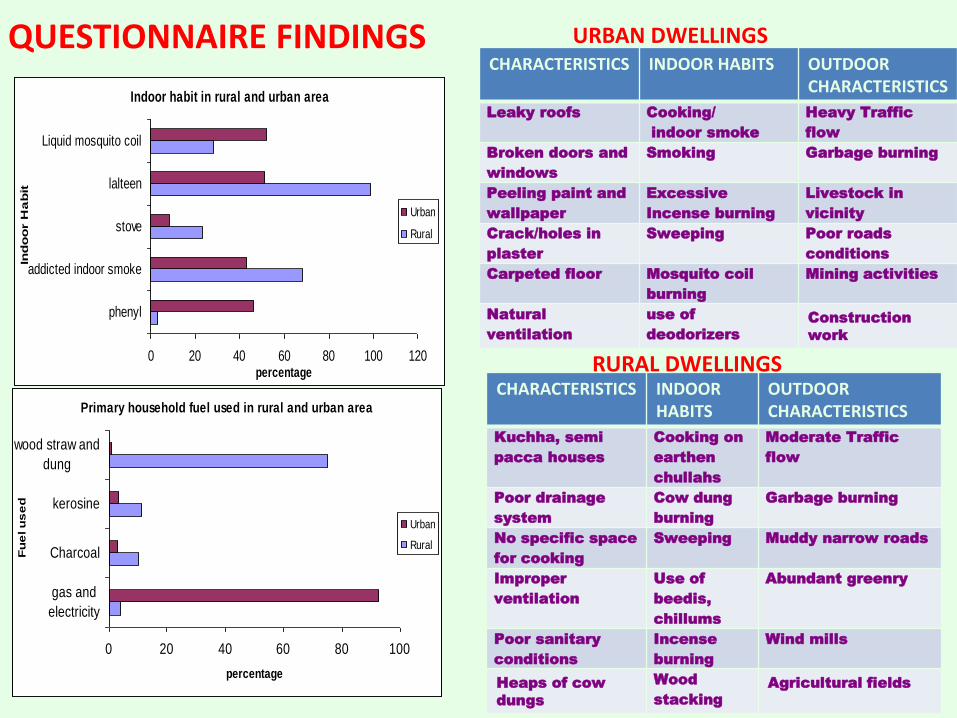
QUESTIONNAIRE FINDINGS
Indoor habit in rural and urban area
0 20 40 60 80 100 120
phenyl
addicted indoor smoke
stove
lalteen
Liquid mosquito coil
Ind
oo
r H
ab
it
percentage
Urban
Rural
Primary household fuel used in rural and urban area
0 20 40 60 80 100
gas and
electricity
Charcoal
kerosine
wood straw and
dung
Fu
el u
se
d
percentage
Urban
Rural
CHARACTERISTICS INDOOR HABITS OUTDOOR CHARACTERISTICS
Leaky roofs Cooking/
indoor smoke
Heavy Traffic
flow
Broken doors and
windows
Smoking Garbage burning
Peeling paint and
wallpaper
Excessive
Incense burning
Livestock in
vicinity
Crack/holes in
plaster
Sweeping Poor roads
conditions
Carpeted floor Mosquito coil
burning
Mining activities
Natural
ventilation
use of
deodorizers
Construction
work
CHARACTERISTICS INDOOR HABITS
OUTDOOR CHARACTERISTICS
Kuchha, semi
pacca houses
Cooking on
earthen
chullahs
Moderate Traffic
flow
Poor drainage
system
Cow dung
burning
Garbage burning
No specific space
for cooking
Sweeping Muddy narrow roads
Improper
ventilation
Use of
beedis,
chillums
Abundant greenry
Poor sanitary
conditions
Incense
burning
Wind mills
Heaps of cow
dungs
Wood
stacking
Agricultural fields
URBAN DWELLINGS
RURAL DWELLINGS
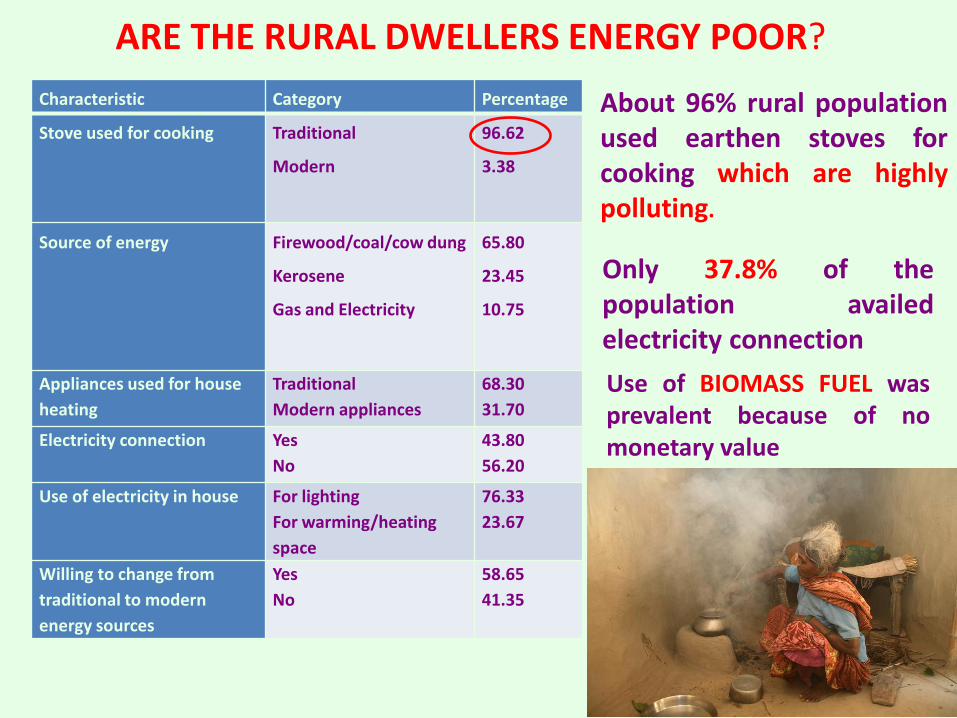
ARE THE RURAL DWELLERS ENERGY POOR?
Characteristic Category Percentage
Stove used for cooking Traditional
Modern
96.62
3.38
Source of energy Firewood/coal/cow dung
Kerosene
Gas and Electricity
65.80
23.45
10.75
Appliances used for house
heating
Traditional
Modern appliances
68.30
31.70
Electricity connection Yes
No
43.80
56.20
Use of electricity in house For lighting
For warming/heating
space
76.33
23.67
Willing to change from
traditional to modern
energy sources
Yes
No
58.65
41.35
About 96% rural population used earthen stoves for cooking which are highly polluting.
Only 37.8% of the population availed electricity connection
Use of BIOMASS FUEL was prevalent because of no monetary value

EDUCATIONAL STATUS AND FUEL CHOICE
Different fuel usage by Urban people
0 10 20 30 40 50 60 70 80
Electricity
gas
kerosene
charcoal
wood straw dung
Fu
el
Percentage
Tertiary
Secondary
Primary
Different fuel usage by Rural people
0 10 20 30 40 50 60
Electricity
gas
kerosene
charcoal
wood straw dung
Fu
el
percentage
Tertiary
Secondary
Primary
In urban areas use of low polluting fuel was more than in rural areas Rural people having no formal education or with primary education are the ones
using maximum percentage of solid fuels Hence the educational level directly influences the living standards

OVERALL HEALTH IMPACT OF BIOMASS FUEL USAGE IN RURAL INDOOR ENVIRONMENT
Regression line establishing a relationship between number of persons affected by disease and type of fuel used at urban sites
Regression line establishing a relationship between the number of people affected by diseases and type of fuel used at rural sites
y = 4.45x + 12.972
R2 = 0.3329
0
10
20
30
40
50
60
70
80
0 2 4 6 8 10 12
Fuel used
nu
mb
er
of
pers
on
s e
ffecte
d b
y D
isease
y = 4.2877x + 3
R2 = 0.7114
0
10
20
30
40
50
60
0 2 4 6 8 10 12 14
Fuel used
nu
mb
er o
f p
erso
ns e
ffected
Statistical analysis established a between respiratory diseases faced by the rural population and the type of solid/liquid fuel used.
Such positive extrapolation was not found in case of urban areas Logistic regression was applied to show association between different
variables.
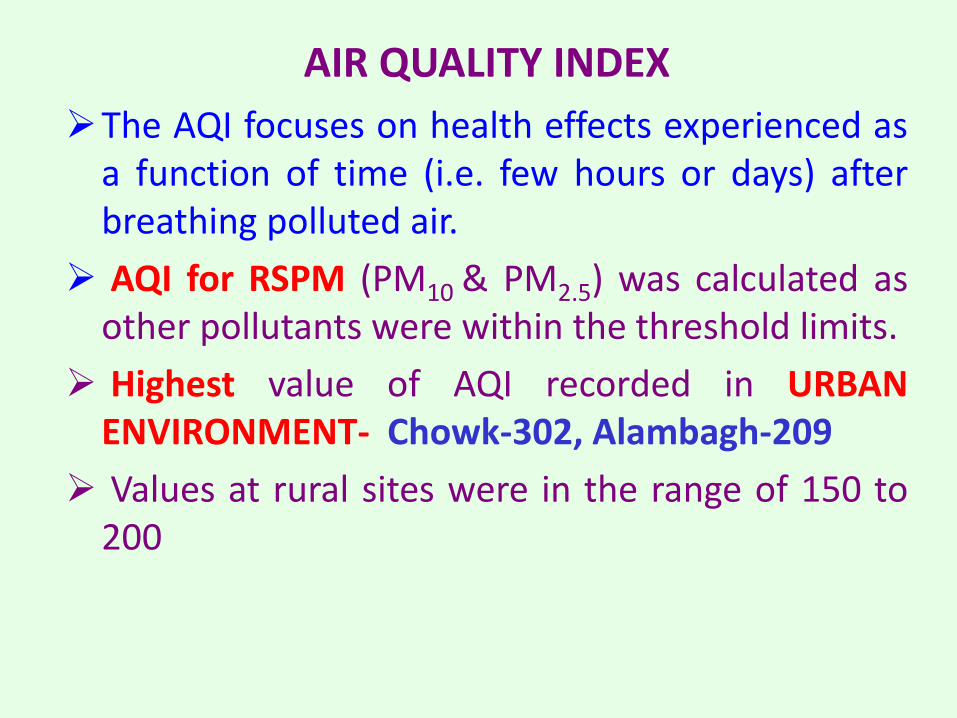
AIR QUALITY INDEX
The AQI focuses on health effects experienced as a function of time (i.e. few hours or days) after breathing polluted air.
AQI for RSPM (PM10 & PM2.5) was calculated as other pollutants were within the threshold limits.
Highest value of AQI recorded in URBAN ENVIRONMENT- Chowk-302, Alambagh-209
Values at rural sites were in the range of 150 to 200

AQI VALUES AND ASSOCIATED HEALTH EFFECTS
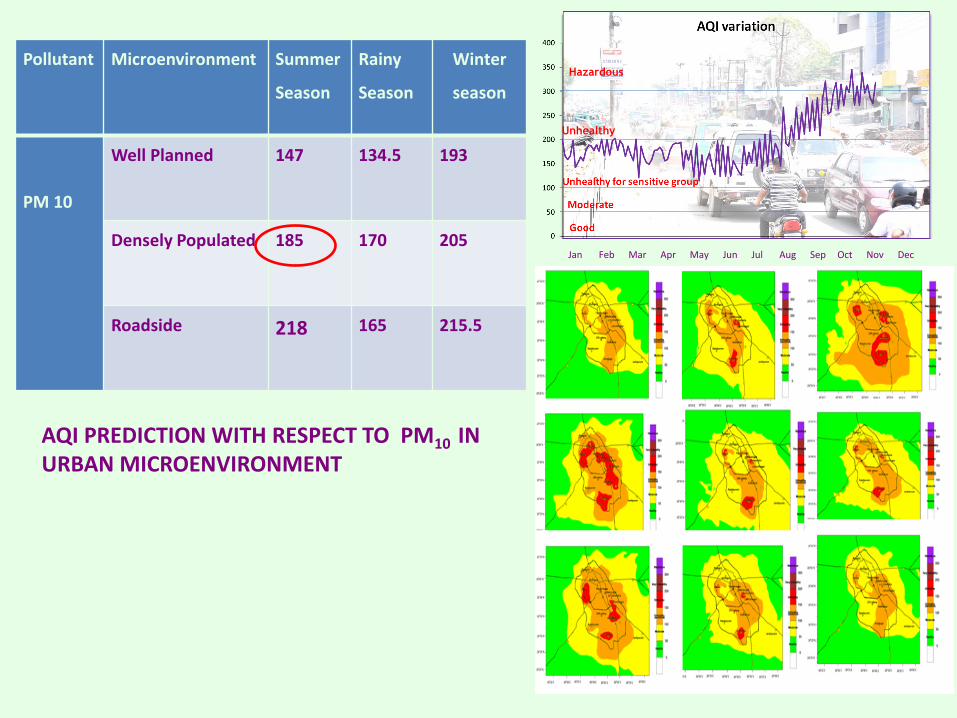
Pollutant Microenvironment Summer
Season
Rainy
Season
Winter
season
PM 10
Well Planned 147 134.5 193
Densely Populated 185 170 205
Roadside 218 165 215.5
Hazardous
Unhealthy
Hazardous
Unhealthy
Jan Feb Mar Apr May Jun Jul Aug Sep Oct Nov Dec
AQI PREDICTION WITH RESPECT TO PM10 IN URBAN MICROENVIRONMENT

MONITORING IN URBAN ENVIRONMENT
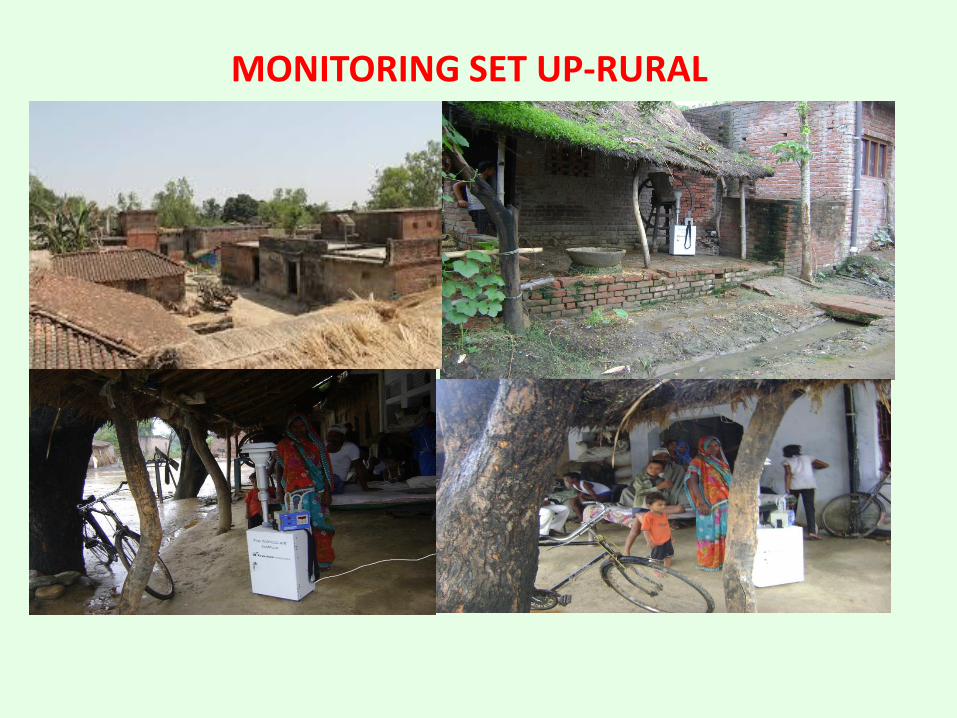
MONITORING SET UP-RURAL

CONCLUSIONS
AVERAGE CONCENTRATIONS OF PM10 AND PM2.5
WERE HIGHER THAN THE WHO
LIMITS AND HIGHEST VALUES WERE OBTAINED IN RURAL HOUSES.
SO2, NO
2, NH
3, H
2S, CO AND CO
2 WERE BELOW PERMISSIBLE LIMIT OF WHO IN
BOTH URBAN AND RURAL HOUSES.
FULL DAY VARIATION SHOWS SIGNIFICANT CHANGE IN RURAL ENVIRONMENT DUE
TO EXCESS CONSUMPTION OF POLLUTING FUEL.
INDOOR AIR QUALITY IN RURAL HOUSES IS ALSO VERY ALARMING
USE OF SOLID FUEL AND LACK OF FORMAL EDUCATION SIGNIFICANT FACTORS
RESPONSIBLE FOR THE DETERIORATING INDOOR AIR QUALITY IN RURAL
HOUSEHOLDS.
WOMEN ARE AT GREATER RISK TO RESPIRATORY TROUBLES
LOW VENTILATION RATES ENHANCE THE RISK OF TRAPPING OF RSPM INDOORS
FOR A LONGER TIME.
STANDARDS OF LIVING DIRECTLY RELATE TO INDOOR AIR QUALITY
EXPOSED POPULATION WAS LARGELY UNAWARE ABOUT THE HAZARDS
ASSOCIATED WITH POOR AIR QUALITY.

22/06/17, 6 :04 AMUrban air pollut ion & it s assessment in Lucknow City — The second largest city of Nor th India - ScienceDirect
Page 2 of 4ht tp:/ /www.sciencedirect .com/science/ar t icle/pi i/S00489 69713012503?via%3Dihub
Get rights and content
•
•
•
•
•
Science of The Total Environment
Volumes 488–489, 1 August 2014, Pages 447-455
Urban air pollution & its assessment in Lucknow City — The
second largest city of North India
Alfred Lawrence , Nishat Fatima
Department of Chemistry, Isabella Thoburn College, 7 Faizabad Road, 226007 Lucknow, IndiaShow more
https://doi.org/10.1016/j.scitotenv.2013.10.106
Highlights
Indoor air quality is an issue of major concern in developing countries like India.
The study deals with urban pollution monitoring.
The work was done in Lucknow City, 3rd most polluted city of India according to
WHO.
By calculating indoor/outdoor ratio we found which one of both is dominant.
I/O correlation was established and the effects of IAQ on human health were
studied.
Abstract
Investigations were carried out during the summer season (March–June 2012) to observe the
quality of indoor air by monitoring the levels of some selected air pollutants at 15 different
houses covering the urban areas of Lucknow City. Concentrations of CO , CO, PM , PM ,
SO and NO were monitored indoors and outdoors simultaneously and I/O ratios were
calculated. Regression analysis for I/O relationship was performed to assess the contribution of
outdoor sources to indoor air quality. Air Quality Index (AQI) for indoor air was also calculated
to have an idea about the quality of indoor air and their health effects. In collaboration with the
medical college doctors of the city, we surveyed 197 persons to find out different
diseases/symptoms being faced due to indoor air pollution. Results of the study revealed that
the average levels of PM and PM were above the permissible limits laid by WHO at
2 10 2.5
2 2
10 2.5
3 3 3

Thank You