Strengthening the Implementation of nfp Process in Indonesia
description

1
Indonesia 2009 Enterprise Surveys Data Set
1. Introduction
1. This document provides additional information on the data collected in Indonesia
between August 2009 and January 2010 as part of the Enterprise Survey component of
the survey East Asia and Pacific Enterprise Survey 2009.
The objective of the survey is to obtain feedback from enterprises on the state of
the private sector in client countries (Lao PDR, Tonga, Samoa, Vanuatu, Timor Leste,
Fiji, Federated States of Micronesia, Vietnam, Philippines, and Papua New Guinea) as
well as to help in building a panel of enterprise data that will make it possible to track
changes in the business environment over time, thus allowing, for example, impact
assessments of reforms.
Through interviews with firms in the manufacturing and services sectors, the
survey will assess the constraints to private sector growth and create statistically
significant business environment indicators that are comparable across countries.
The report outlines and describes the sampling design of the data, the data set
structure as well as additional information that may be useful when using the data, such
as information on non-response cases and the appropriate use of the weights.
2. Sampling Structure 2. The sample for Indonesia was selected using stratified random sampling, following the
methodology explained in the Sampling Manual1. Stratified random sampling
2 was
preferred over simple random sampling for several reasons3:
a. To obtain unbiased estimates for different subdivisions of the population with
some known level of precision.
b. To obtain unbiased estimates for the whole population. The whole population,
or universe of the study, is the non-agricultural economy. It comprises: all manufacturing
sectors according to the group classification of ISIC Revision 3.1: (group D),
construction sector (group F), services sector (groups G and H), and transport, storage,
and communications sector (group I). Note that this definition excludes the following
sectors: financial intermediation (group J), real estate and renting activities (group K,
except sub-sector 72, IT, which was added to the population under study), and all public
or utilities-sectors.
c. To make sure that the final total sample includes establishments from all
different sectors and that it is not concentrated in one or two of industries/sizes/regions.
d. To exploit the benefits of stratified sampling where population estimates, in
most cases, will be more precise than using a simple random sampling method (i.e., lower
standard errors, other things being equal.)
1 The complete text can be found at http://www.enterprisesurveys.org/documents/Implementation_note.pdf
2 A stratified random sample is one obtained by separating the population elements into non-overlapping
groups, called strata, and then selecting a simple random sample from each stratum. (Richard L. Scheaffer;
Mendenhall, W.; Lyman, R., “Elementary Survey Sampling”, Fifth Edition). 3 Cochran, W., 1977, pp. 89; Lohr, Sharon, 1999, pp. 95

2
e. Stratification may produce a smaller bound on the error of estimation than
would be produced by a simple random sample of the same size. This result is
particularly true if measurements within strata are homogeneous.
f. The cost per observation in the survey may be reduced by stratification of the
population elements into convenient groupings.
3. Three levels of stratification were used in this country: industry, establishment
size, and region. The original sample design with specific information of the industries
and regions chosen is described in Appendix E.
4. Industry stratification was designed in the way that follows: the universe was
stratified into 6 manufacturing industries, 1 services industry -retail -, and two residual
sectors as defined in the sampling manual. Each manufacturing industry had a target of
160 interviews. The services industry and the two residual sectors had a target of 120
interviews. For the manufacturing industries sample sizes were inflated by about 33% to
account for potential non-response cases when requesting sensitive financial data and
also because of likely attrition in future surveys that would affect the construction of a
panel. An additional 85 interviews were added to the survey half way through the fieldwork.
Targets were adjusted such that the manufacturing sectors’ targets were increased to 160-180
interviews.
5. Size stratification was defined following the standardized definition for the
rollout: small (5 to 19 employees), medium (20 to 99 employees), and large (more than
99 employees). For stratification purposes, the number of employees was defined on the
basis of reported permanent full-time workers. This seems to be an appropriate definition
of the labor force since seasonal/casual/part-time employment is not a common practice,
except in the sectors of construction and agriculture.
6. Regional stratification was defined in four regions: Bali, Banten, DKI Jakarta,
Jawa Barat, Jawa Tengah, Jawa Timur, Lampung, Sulawesi Selatan, and Sumatera Utara.
These are the largest population and economic centers of the Indonesia constituting over
70% of firms and 68% of employment in Indonesia.
3. Sampling implementation
7. Given the stratified design, sample frames containing a complete and updated list
of establishments as well as information on all stratification variables (number of
employees, industry, and region) are required to draw the sample for the Indicator
Surveys.
8. One frame was used for Indonesia. The sample frame used in the Indonesia was
obtained from Central Bureau of Statistic (Badan Pusat Statistik BPS). Sampling was
conducted by the World Bank team in Washington D.C. This database contained the
following information:
-Name of the firm
-Location
-Contact details

3
-ISIC code
-Number of employees. (except for services establishments)
Universe figures provided by BPS are shown below.
Universe Figures for Indonesia
9. The enumerated establishments were then used as the frame for the selection of a
sample with the aim of obtaining interviews at 1320 establishments with five or more
employees.
10. The quality of the frame was assessed at the onset of the project through calls to a
random subset of firms and local contractor knowledge. The sample frame was not
immune from the typical problems found in establishment surveys: positive rates of non-
eligibility, repetition, non-existent units, etc. The sample frame for the services sectors
did not contain employment data. The implementing firm had to determine employment

4
during the screening process which required extra time in order to target the appropriate
establishments.
11. Given the impact that non-eligible units included in the sample universe may have
on the results, adjustments may be needed when computing the appropriate weights for
individual observations. The percentage of confirmed non-eligible units as a proportion
of the total number of sampled establishments contacted for the survey was 19% (489 out
of 2532 establishments).4 Breaking down by industry, the following numbers of
establishments were surveyed:
15 (Food) 392
17 (textiles 135
18 (Garments) 141
24 (Chemicals) 108
25 (Plastic & Rubber) 111
26 (Non-metallic mineral products) 151
Other manufacturing 141
Retail 133
Other services 132
Local Agency team involved in the study:
Local Agency Name: PT RPC
Location: Utan Kayu, Jakarta, Indonesia
Membership of international organization:
Activities since:
Name of Survey Manager Maria Sri Pangestuti
Local Survey Implementation
Team and corresponding
enumerator codes:
Data Manager : Edy Poernomo
Office manager: Siti Yuniar
Trainer: Bambang Iswantoro
Hendri …..
North Sumatera Supervisor: Sismudjito
Lampung supervisor: Ikram
Banten Supervisor: Amri
DKI Jakarta Supervisor: Barita Daniel Sihombing
West Java Supervisor: Edy Poernomo
Central Java Supervisor: Ari Subowo
East Java Supervisor: Nung Didik Setya Budi
Bali Supervisor: I Gusti Ngurah Sugiana
South Sulawesi: Abdul Basir
Screener:
Barikatul Hikmah
Erlangga
4 Appendix B shows the tabulations for the Philippines sample of registered firms of response codes that
are classified as eligible and non-eligible.

5
Fajri Muslim
Linda
Ranilia
Grahita Purbasantika
Erni
Aditya
Fariq
Data entry:
Bayu
Agus
Yeni
Gufron
Dela
Hezron
Other staff involved: Frances Barns, Indonesia Country Director
Ms
Sample Frame/Universe Indonesia:
Characteristics of sample
frame used
Variables: Name of establishment, address, activity,
telephone number, number of employees
Sources: Central Bureau of Statistic (Badan Pusat Statistik)
Year: 2006
Comments on the quality of
sample frame:
Many inaccurate on addresses and person contact name
Year and Organisation that
conducted the relevant census or
survey
BPS Economics census (household and enterprise)
conducted on 2006, reported in 2008
Other sources for
companies statistics
Sectors included in the sample:
Original Sectors Manufacturing:
15,16,17,19,20,21,22,24,25,26, 28,29,36,37
Retail: 52
Services:
45,50,51,55,60,61,62,63,64,72
Sample:
6
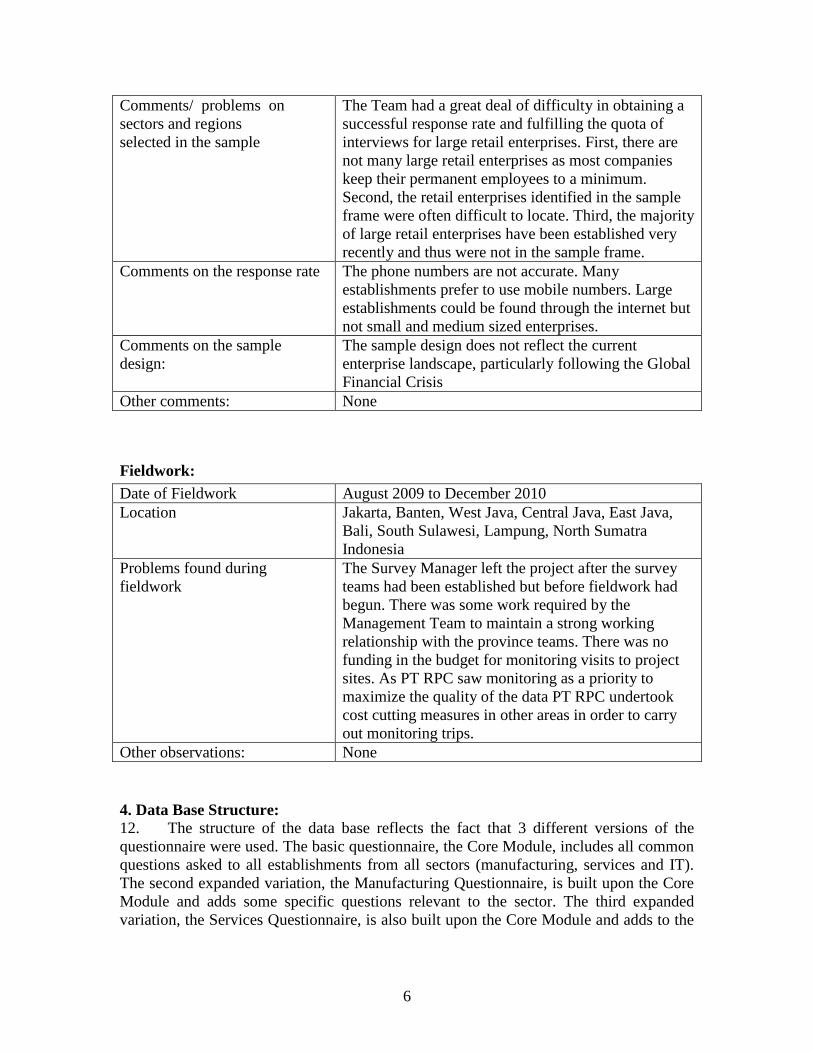
Comments/ problems on
sectors and regions
selected in the sample
The Team had a great deal of difficulty in obtaining a
successful response rate and fulfilling the quota of
interviews for large retail enterprises. First, there are
not many large retail enterprises as most companies
keep their permanent employees to a minimum.
Second, the retail enterprises identified in the sample
frame were often difficult to locate. Third, the majority
of large retail enterprises have been established very
recently and thus were not in the sample frame.
Comments on the response rate
The phone numbers are not accurate. Many
establishments prefer to use mobile numbers. Large
establishments could be found through the internet but
not small and medium sized enterprises.
Comments on the sample
design:
The sample design does not reflect the current
enterprise landscape, particularly following the Global
Financial Crisis
Other comments: None
Fieldwork:
Date of Fieldwork August 2009 to December 2010
Location Jakarta, Banten, West Java, Central Java, East Java,
Bali, South Sulawesi, Lampung, North Sumatra
Indonesia
Problems found during
fieldwork
The Survey Manager left the project after the survey
teams had been established but before fieldwork had
begun. There was some work required by the
Management Team to maintain a strong working
relationship with the province teams. There was no
funding in the budget for monitoring visits to project
sites. As PT RPC saw monitoring as a priority to
maximize the quality of the data PT RPC undertook
cost cutting measures in other areas in order to carry
out monitoring trips.
Other observations: None
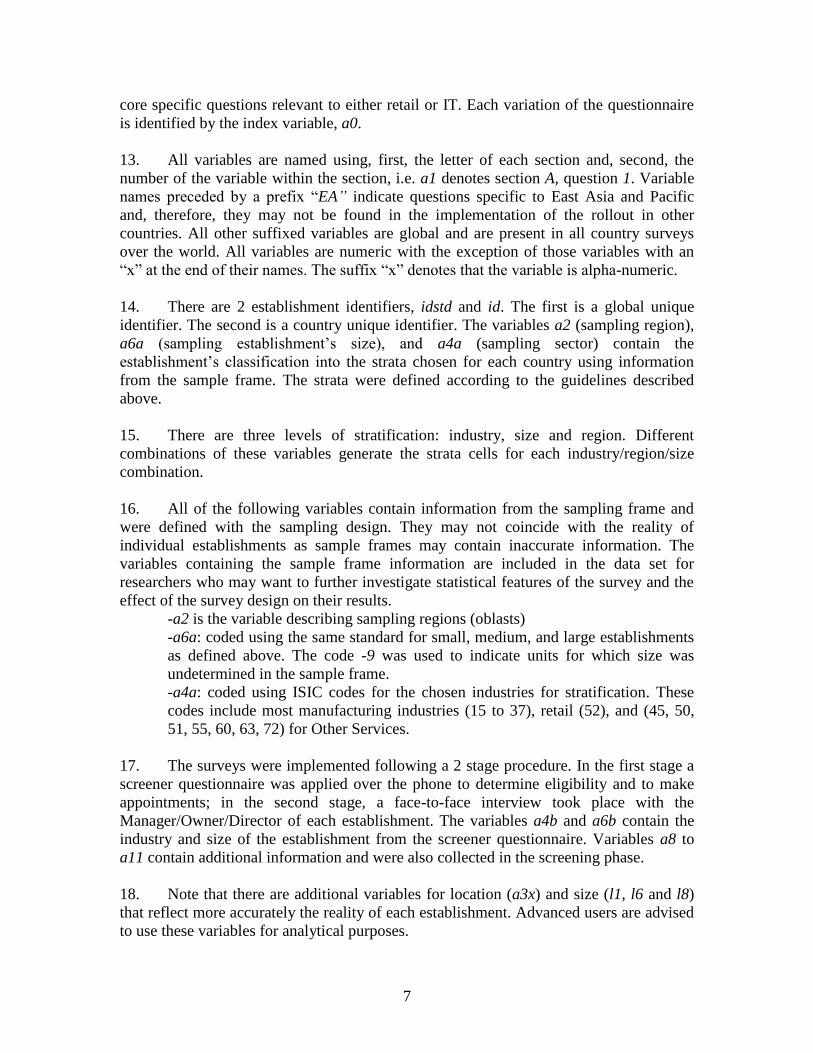
4. Data Base Structure:
12. The structure of the data base reflects the fact that 3 different versions of the
questionnaire were used. The basic questionnaire, the Core Module, includes all common
questions asked to all establishments from all sectors (manufacturing, services and IT).
The second expanded variation, the Manufacturing Questionnaire, is built upon the Core
Module and adds some specific questions relevant to the sector. The third expanded
variation, the Services Questionnaire, is also built upon the Core Module and adds to the
7
core specific questions relevant to either retail or IT. Each variation of the questionnaire
is identified by the index variable, a0.
13. All variables are named using, first, the letter of each section and, second, the
number of the variable within the section, i.e. a1 denotes section A, question 1. Variable
names preceded by a prefix “EA” indicate questions specific to East Asia and Pacific
and, therefore, they may not be found in the implementation of the rollout in other
countries. All other suffixed variables are global and are present in all country surveys
over the world. All variables are numeric with the exception of those variables with an
“x” at the end of their names. The suffix “x” denotes that the variable is alpha-numeric.
14. There are 2 establishment identifiers, idstd and id. The first is a global unique
identifier. The second is a country unique identifier. The variables a2 (sampling region),
a6a (sampling establishment’s size), and a4a (sampling sector) contain the
establishment’s classification into the strata chosen for each country using information
from the sample frame. The strata were defined according to the guidelines described
above.
15. There are three levels of stratification: industry, size and region. Different
combinations of these variables generate the strata cells for each industry/region/size
combination.
16. All of the following variables contain information from the sampling frame and
were defined with the sampling design. They may not coincide with the reality of
individual establishments as sample frames may contain inaccurate information. The
variables containing the sample frame information are included in the data set for
researchers who may want to further investigate statistical features of the survey and the
effect of the survey design on their results.
-a2 is the variable describing sampling regions (oblasts)
-a6a: coded using the same standard for small, medium, and large establishments
as defined above. The code -9 was used to indicate units for which size was
undetermined in the sample frame.
-a4a: coded using ISIC codes for the chosen industries for stratification. These
codes include most manufacturing industries (15 to 37), retail (52), and (45, 50,
51, 55, 60, 63, 72) for Other Services.
17. The surveys were implemented following a 2 stage procedure. In the first stage a
screener questionnaire was applied over the phone to determine eligibility and to make
appointments; in the second stage, a face-to-face interview took place with the
Manager/Owner/Director of each establishment. The variables a4b and a6b contain the
industry and size of the establishment from the screener questionnaire. Variables a8 to
a11 contain additional information and were also collected in the screening phase.
18. Note that there are additional variables for location (a3x) and size (l1, l6 and l8)
that reflect more accurately the reality of each establishment. Advanced users are advised
to use these variables for analytical purposes.

8
19. Variable a3x indicates the actual location of the establishment. There may be
divergences between the location in the sampling frame and the actual location, as
establishments may be listed in one place but the actual physical location is in another
place.
20. Variables l1, l6 and l8 were designed to obtain a more accurate measure of
employment accounting for permanent and temporary employment. Special efforts were
made to make sure that this information was not missing for most establishments.
5. Universe Estimates
21. The enumerated totals were adjusted to take account of the establishments found
to be ineligible when interviews were attempted. Then ratios of the total numbers of
blocks of each type to the totals enumerated were formed. Those ratios were then applied
to the eligible establishments enumerated to provide universe estimates.
22. Appendix C shows the overall estimates of the numbers of establishments in
Indonesia based on the sample frame.
23. For some establishments where contact was not successfully completed during the
screening process (because the firm has moved and it is not possible to locate the new
location, for example), it is not possible to directly determine eligibility. Thus, different
assumptions about the eligibility of establishments result in different adjustments to the
universe cells and thus different sampling weights.
24. Three sets of assumptions on establishment eligibility are used to construct sample
adjustments using the status code information.
25. Strict assumption: eligible establishments are only those for which it was possible to
directly determine eligibility. The resulting weights are included in the variable
w_strict. Strict eligibility = (Sum of the firms with codes 1,2,3,4,&16) / Total
26. Median assumption: eligible establishments are those for which it was possible to
directly determine eligibility and those that rejected the screener questionnaire or an
answering machine or fax was the only response. The resulting weights are included in
the variable w_median. Median eligibility = (Sum of the firms with codes 1,2,3,4,16,10,11, & 13) / Total
27. Weak assumption: in addition to the establishments included in points a and b, all
establishments for which it was not possible to contact or that refused the screening
questionnaire are assumed eligible. This definition includes as eligible establishments
with dead or out of service phone lines, establishments that never answered the phone,
and establishments with incorrect addresses for which it was impossible to find a new
address. Under the weak assumption only observed non-eligible units are excluded from
universe projections. The resulting weights are included in the variable w_weak.

9
Weak eligibility= (Sum of the firms with codes 1,2,3,4,16,91,92,93,10,11,12,&13) /
Total
28. The indicators computed for the Enterprise Survey website use the median weights.
The following graph shows the different eligibility rates calculated for firms in the
sample frame under each set of assumptions.
29. Universe estimates for the number of establishments in each industry-region-size cell
in Indonesia were produced for the strict, weak and median eligibility definitions.
Appendix C shows the universe estimates of the numbers of registered establishments.
30. Once an accurate estimate of the universe cell projection was made, weights for the
probability of selection were computed using the number of completed interviews for
each cell.
6. Weights
31. Since the sampling design was stratified and employed differential sampling,
individual observations should be properly weighted when making inferences about the
population. Under stratified random sampling, unweighted estimates are biased unless
sample sizes are proportional to the size of each stratum. With stratification the
probability of selection of each unit is, in general, not the same. Consequently, individual
observations must be weighted by the inverse of their probability of selection (probability
weights or pw in Stata.)5
32. Special care was given to the correct computation of the weights. It was
imperative to accurately adjust the totals within each region/industry/size stratum to
5 This is equivalent to the weighted average of the estimates for each stratum, with weights equal to the
population shares of each stratum.

10
account for the presence of ineligible units (the firm discontinued businesses or was
unattainable, education or government establishments, establishments with less than 5
employees, no reply after having called in different days of the week and in different
business hours, out of order, no tone in the phone line, answering machine, fax line,
wrong address or moved away and could not get the new references) The information
required for the adjustment was collected in the first stage of the implementation: the
screening process. Using this information, each stratum cell of the universe was scaled
down by the observed proportion of ineligible units within the cell. Once an accurate
estimate of the universe cell (projections) was available, weights were computed using
the number of completed interviews.
33. Appendix D shows the cell weights for registered establishments in Indonesia.
7. Appropriate use of the weights
34. Under stratified random sampling weights should be used when making
inferences about the population. Any estimate or indicator that aims at describing some
feature of the population should take into account that individual observations may not
represent equal shares of the population.
35. However, there is some discussion as to the use of weights in regressions (see
Deaton, 1997, pp.67; Lohr, 1999, chapter 11, Cochran, 1953, pp.150). There is not strong
large sample econometric argument in favor of using weighted estimation for a common
population coefficient if the underlying model varies per stratum (stratum-specific
coefficient): both simple OLS and weighted OLS are inconsistent under regular
conditions. However, weighted OLS has the advantage of providing an estimate that is
independent of the sample design. This latter point may be quite relevant for the
Enterprise Surveys as in most cases the objective is not only to obtain model-unbiased
estimates but also design-unbiased estimates (see also Cochran, 1977, pp 200 who favors
the used of weighted OLS for a common population coefficient.)6
36. From a more general approach, if the regressions are descriptive of the population
then weights should be used. The estimated model can be thought of as the relationship
that would be expected if the whole population were observed.7 If the models are
developed as structural relationships or behavioral models that may vary for different
parts of the population, then, there is no reason to use weights.
8. Non-response
37. Survey non-response must be differentiated from item non-response. The former
refers to refusals to participate in the survey altogether whereas the latter refers to the
6 Note that weighted OLS in Stata using the command regress with the option of weights will estimate
wrong standard errors. Using the Stata survey specific commands svy will provide appropriate standard
errors. 7 The use weights in most model-assisted estimations using survey data is strongly recommended by the
statisticians specialized on survey methodology of the JPSM of the University of Michigan and the
University of Maryland.

11
refusals to answer some specific questions. Enterprise Surveys suffer from both problems
and different strategies were used to address these issues.
38. Item non-response was addressed by two strategies:
a- For sensitive questions that may generate negative reactions from the
respondent, such as corruption or tax evasion, enumerators were instructed to
collect the refusal to respond as a different option from don’t know (-7).
b- Establishments with incomplete information were re-contacted in order to
complete this information, whenever necessary. However, there were clear cases
of low response. The following graph shows non-response rates for the sales
variable, d2, by sector. Please, note that the coding utilized in this dataset does not
allow us to differentiate between “Don’t know” and “refuse to answer”, thus the
non-response in the chart below reflects both categories (DKs and NAs).
39. Survey non-response was addressed by maximizing efforts to contact
establishments that were initially selected for interview. Attempts were made to contact
the establishment for interview at different times/days of the week before a replacement
establishment (with similar strata characteristics) was suggested for interview. Survey
non-response did occur but substitutions were made in order to potentially achieve strata-
specific goals. Further research is needed on survey non-response in the Enterprise
Surveys regarding potential introduction of bias.
40. As the following graph shows, the number of contacted establishments per
realized interview was 1.75. This number is the result of two factors: explicit refusals to
participate in the survey, as reflected by the rate of rejection (which includes rejections of
the screener and the main survey) and the quality of the sample frame, as represented by
the presence of ineligible units. The number of rejections per contact was 0.145.

12
41. Details on the rejection rate, eligibility rate, and item non-response are available
at the level strata. This report summarizes these numbers to alert researchers of these
issues when using the data and when making inferences. Item non-response, selection
bias, and faulty sampling frames are not unique to Indonesia. All enterprise surveys
suffer from these shortcomings, but in very few cases they have been made explicit.
References: Cochran, William G., Sampling Techniques, 1977.
Deaton, Angus, The Analysis of Household Surveys, 1998.
Levy, Paul S. and Stanley Lemeshow, Sampling of Populations: Methods and
Applications, 1999.
Lohr, Sharon L. Samping: Design and Techniques, 1999.
Scheaffer, Richard L.; Mendenhall, W.; Lyman, R., Elementary Survey Sampling, Fifth
Edition, 1996

13
Appendix A
Questionnaires:
Problems for the understanding
of questions (write question
number)
None
Problems found in the
navigability of questionnaires
(for example skip patterns)
Problem with skip pattern for L.10 in the Manufacturing
version of the questionnaire. Question L.6 instructed skip
to L.30 when should have said skip to L.10. Data on L.10
missing for Manufacturing firms.
Comments on questionnaire
length:
The questionnaire length is not a problem as long as the
questions could easily be asked. The flow of questions was
not easy to deliver comfortably.
Suggestions or other comments
on the questionnaire:
Clear up skip patterns and formatting to make more
favorable to enumerator.
Database:
Comments on the data entry
program
Data entry program chosen: CSPro
The software programme required some training by the
MKE Data Entry Team coordinator but was overall easy to
use.
The data entry program allowed for mistakes in skip
patterns to be entered by the data entry team if they did not
use CSPro correctly. It would be helpful to use a different
data entry program in the future that allows for stronger
limits on data entry team errors.
Comments on the data cleaning Checking for data errors and inconsistencies was conducted
by MKE and a quality control report and list of corrections
was provided to the data entry staff
Country Situation:
General aspects of the
economic, political or
Social situation in your
territory that could affect
the results of the survey:
Indonesia economics still has not recovered from the 1997
crisis, furthermore it was affected by the global crisis in the
year of 2008 – 2009. Many enterprises were not doing well
which affected their willingness to participate in the
Survey.
Covering nine provinces, the Survey was also conducted in
14
a range of cultural environments that affect the way people
do business. For example, in Bali among more traditional
community members, it is not considered polite to disclose
your assets as it is considered boasting. Therefore it is very
difficult to get a straight answer on questions regarding this
matter. Similarly, many small enterprises in Indonesia do
not do detailed bookkeeping and therefore financial
questions are difficult to answer.
Relevant local events occurred
during fieldwork:
Parliamentary and Presidential Elections; Idul Fitri
celebration, independence day, Christmas and End of Year.

15
Appendix B
Status Codes:
Response Outcomes:

16
Appendix C
Universe Estimates, Indonesia:

17
Appendix D
Strict Cell Weights Indonesia:

18
Collapsed Strict Cell Weights Indonesia:
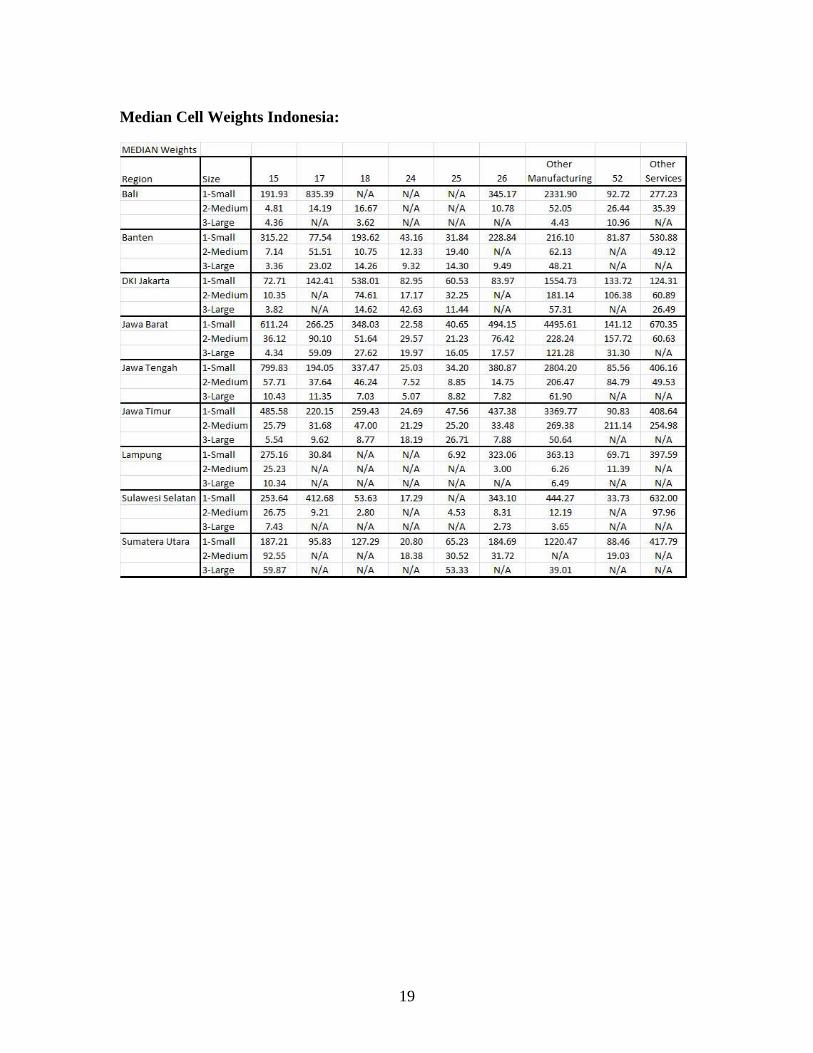
19
Median Cell Weights Indonesia:

20
Collapsed Median Cell Weights Indonesia:

21
Weak Cell Weights Indonesia:

22
Collapsed Weak Cell Weights Indonesia:
23
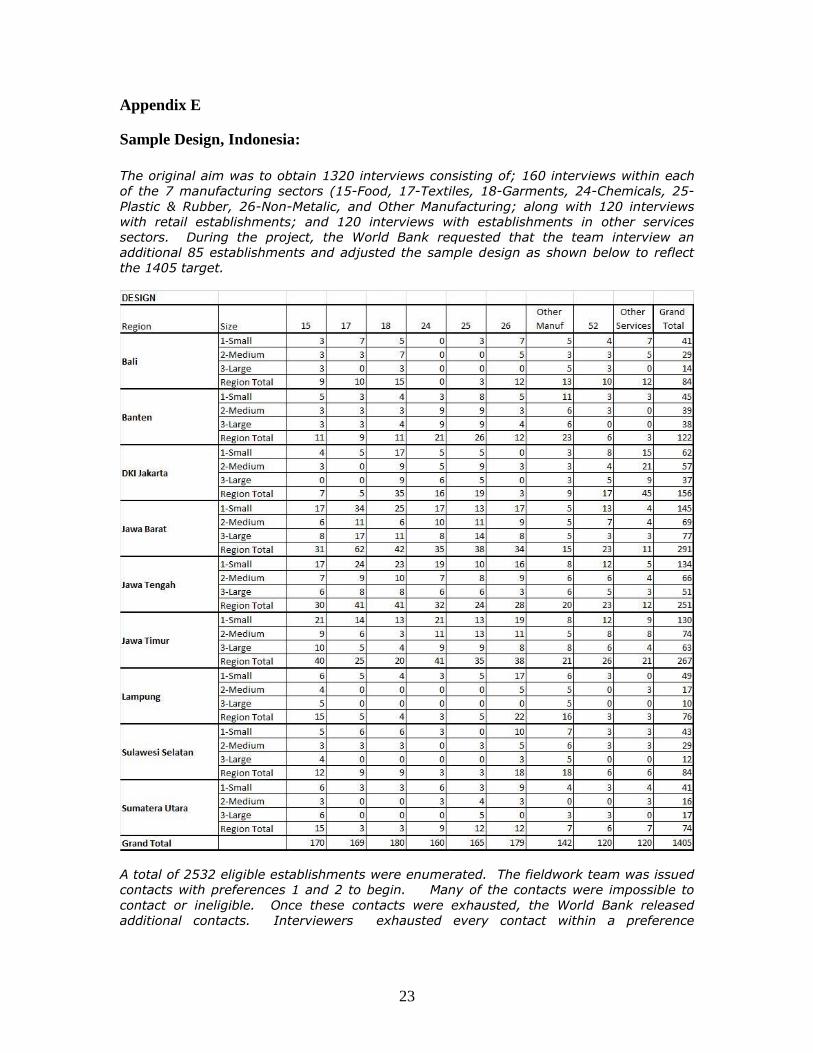
Appendix E
Sample Design, Indonesia:
The original aim was to obtain 1320 interviews consisting of; 160 interviews within each
of the 7 manufacturing sectors (15-Food, 17-Textiles, 18-Garments, 24-Chemicals, 25-
Plastic & Rubber, 26-Non-Metalic, and Other Manufacturing; along with 120 interviews
with retail establishments; and 120 interviews with establishments in other services
sectors. During the project, the World Bank requested that the team interview an
additional 85 establishments and adjusted the sample design as shown below to reflect
the 1405 target.
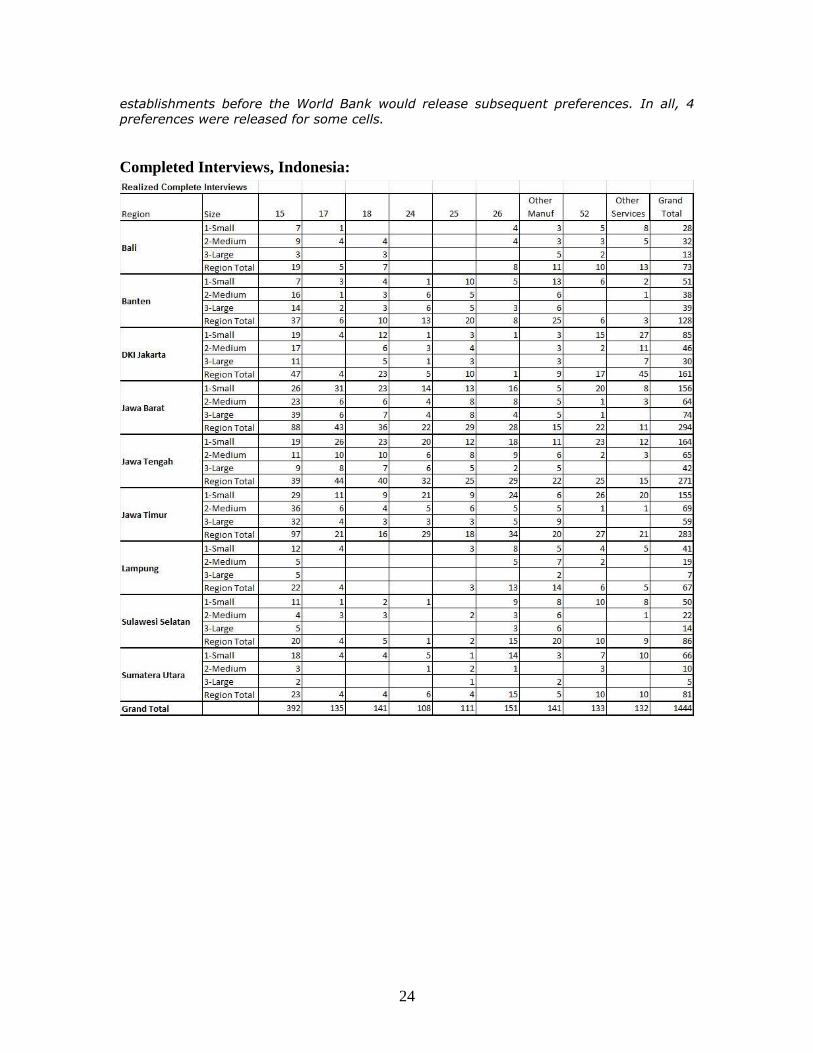
A total of 2532 eligible establishments were enumerated. The fieldwork team was issued
contacts with preferences 1 and 2 to begin. Many of the contacts were impossible to
contact or ineligible. Once these contacts were exhausted, the World Bank released additional contacts. Interviewers exhausted every contact within a preference
24
establishments before the World Bank would release subsequent preferences. In all, 4
preferences were released for some cells.
Completed Interviews, Indonesia: