Individual Household Method (IHM) Baseline Report Nwoya ...
27
Page 1 Individual Household Method (IHM) Baseline Report Nwoya District – Northern Uganda February 2013 Dorothy Naikesa, Self Help Africa
Transcript of Individual Household Method (IHM) Baseline Report Nwoya ...

Page 1
Individual Household Method
(IHM) Baseline Report
Nwoya District – Northern Uganda
February 2013
Dorothy Naikesa, Self Help Africa

Page 2
Table of Contents:
Table of Contents: ................................................................................................................
Acknowledgements: .............................................................................................................
Acronyms and Abbreviations: .............................................................................................
1.Executive Summary ...........................................................................................................
1.1 Introduction and Background ........................................................................................
1.2 Local Context ..................................................................................................................
1.3 Methodology-The IHM Approach ...................................................................................
1.3.1Study Findings: .............................................................................................................
2.0 Main Findings-Purongo sub county, Pawatomero west village (Lawora B & Pida A
sub- villages) .........................................................................................................................
3.0 Main Findings- Kochgoma Sub County Kal parish, Kal A1 village (Oteremu and
Labora sub - Villages) ...........................................................................................................
4.0 Main Conclusions and Implications: .............................................................................

Page 3
Acknowledgements:
Self Help Africa extends its appreciation to all national and district stakeholders who participated in this
Individual Household Method (IHM) livelihoods baseline assessment.
This assessment and report would not have been possible without the contribution of a number of
individuals and institutions.
The assessment and report was produced with the support of various stakeholders namely: Evidence
for Development who developed such an effective methodology for assessment, monitoring and
evaluation and impact measurement of food and livelihood projects ; the Community Connector(CC)
project; Gulu University (GU) and Mbarara University of Science and Technology (MUST) who offered us
highly skilled and diligent personnel to aid in the collection of data with the financial support of Irish Aid
(IPAF).
The report is based on results of livelihoods baseline analysis conducted in January 2013. Thanks for Evidence for Development for editorial input.
We would also like to thank all those who participated in the discussions and contributed towards the
improvement and completion of the report.
Special thanks to the men and women from Lawora B, Pida A, Oteremu and Labora sub - Villages, who
willingly participated in the assessment.
We hope this report will influence appropriate interventions for the rural communities in the study
villages within Oyam district-Northern Uganda.
This version has been edited by Evidence for Development

Page 4
Acronyms and Abbreviations:
EfD - Evidence for Development
CC - Community Connector
IHM - Individual Household Method
LZ - Livelihoods Zone
MUST- Mbarara University of Science and Technology
GU - Gulu University
MAZ- Mixed Agriculture Zone
SHA- Self Help Africa
NGO - Non Government Organisations
IDP - Internally displaced people
FGD - Focus Group Discussions

Page 5
Executive Summary Self Help Africa (SHA) is an international NGO based in United Kingdom (UK) and Ireland with a vision of a rural Africa free from Poverty and hunger. It runs food and livelihood programs in eight African countries. SHA – Uganda has had plans to expand into the Northern part of the country in its strategic plan of 2011-2015 and join other partners in the Northern Uganda Agricultural Livelihoods Recovery Programme. This programme seeks to assist in the rebuilding of livelihoods that were destroyed during the 20 year long social, economic and political conflict which forced people out of their home into internally displaced people’ (IDP) camps. In November, 2012 SHA signed a memorandum of understanding with the Nwoya district local government to aid in the restoration and strengthening livelihoods of 8,000 smallholder farmers through increased production and productivity, agribusiness initiatives and value chain development, natural resource management and nutrition integration. It is for this reason that a baseline was commissioned to collect data that will aid in designing interventions and monitoring impact of the project overtime. This baseline was carried out from the 14
th of January to the 03
rd of
February, 2013 in order to; i. Develop a detailed livelihoods baseline for purposes of intervention design and monitoring of SHA –
Uganda project impact ii. Develop a detailed baseline of implementing partners to avoid duplication of activities
iii. Develop capacity of SHA and its partners in data collection and analysis using the IHM
The baseline survey process utilized the individual household method (IHM) in combination with focus group discussions (FGD) for data collection and analysis. The Nwoya district IHM assessment commenced with a Livelihood zoning exercise carried out with key district stakeholders and confirmed that Nwoya lies in a mixed agriculture zone. The zone is relatively flat characterized by streams and forests with fertile sandy loam soils. Its vegetation is a savannah grassland with trees and thickets bordering the Murchison game park. There are five sub counties and one town council in Nwoya of which Alero, Anaka & Anaka town council already have partners implementing livelihood project so it was resolved by the stakeholders for SHA – Uganda to work in Purongo and Kochgoma which had been marginalized by most development partners given their long distance from the district headquarters and vulnerability derived from bordering the Murchison game park. Sub county stakeholders meetings were carried out and we looked for parishes characterized with a typical livelihood range of the Sub County and villages with a mixed range of wealth groups (see below for wealth group descriptions). Powatomero west village in Pawatomero parish, Purongo Sub County and Kal A1 village in Kal parish of Kochgoma subcounty were selected as host sites of the study. This was followed with the collection of contextual information which included a village mapping exercise. From this we realized that the selected villages hosted over 235 households each. It was therefore decided, due to limited time and financial resources, to interview two sub villages from each targeting 200 households in total in Lawora B & Pida A of Pawatomero west and Oteremu & Labora of Kal A1. Out of the 200 households targeted, 185 were interviewed. 6 were too old, living alone and surviving on cooked food from relatives. 15 households were not available given the culture in Acholi that during dry months/ off season of no farming activities, families move out to visit their relatives living elsewhere. Contextual information was collected which included;
i. Crops and livestock production ii. Wild foods
iii. Employment iv. Transfers/gifts v. Local units and measures
vi. Market prices vii. Seasonal calendar for all activities in the area
viii. And wealth breakdown Which data was used to modify tools and guide the data collection and analysis process that followed.

Page 6
Highlights of findings and conclusions Minimum food energy intake per adult equivalent based on 2100 kilo calories per day Overall findings of the assessment suggest that almost all households in the study were able to meet their basic food energy needs. Just 3 households in Purongo subcounty(Lawora B and Pida A sub-villages (around 3.45% ) fell below the ‘food poverty line’ and all the study households in Kochgoma sub county (Oteremu and Labora sub-villages) could meet minimum food requirements during the period March 2012 – February 2013. Disposable income below minimum standard of Living threshold Approximately 37% (31 households) in Purongo sub county (Lawora B and Pida A sub-villages) and 24.2% (23 households in and Kochgoma sub county ( Oteremu and Labora sub- villages) did not have enough cash income to meet the basic non-food items during the reference year March 2012 – Feb 2013, thus falling below the minimum standard of living. This is influenced by large household sizes and high numbers of school going-children. All other households in the sample (around 70% of the total from the two sub counties) could meet minimum non-food costs. Considering the poverty trend defined by the ability of the majority of households to access their minimum food energy needs and basic standard of living, this district is relatively food secure for a place that has recently undergone long term conflict. The sampled households do have good access to assets such as land for agriculture, agricultural hand tools and some tradable goods like phones, bicycles. Some better off households also have solar panels, generators and motorcycles. All the 179 sampled households have access to main markets (Pakwach and Gulu) on relatively good roads . Overall data collected suggests that most of the households earn most of their cash income from agricultural labour followed by own crop production and the greatest part of their food income from own crop production and wild foods. The findings also show that the major crops that contribute towards household food income include; cassava, sweet potato, beans, groundnuts and sesame while those that majorly contribute towards cash income are groundnuts, rice and to a less extent cassava, sesame and sweet potato. The findings of the study also suggest that much land lies idle due to low technology development: the hand hoe is commonly used during land clearing and land cultivation. It should also be noted that there are relatively good health care services provided by the government, significantly reducing the cost of a minimum standard of living. The major challenge in this population is on how to empower people to improve their incomes in a sustainable manner utilising resources around them to access food and better social services. In this manner the community’s resilience to external and internal shocks would be sustainably built on a firm livelihood base. The broad conclusions for policy and programing that can be drawn from the study are as follows;
Increase production and productivity through improved agricultural technologies i.e better access to improved seed varieties and animal traction.
Development of key value chains to enable farmer sell processed producer for better earnings on the market.
Support formation/strengthening of farmer organisations to handle bulk production, post-harvest handling and market research & linkages.
Support farmers in natural resources management in order to conserve and build the natural resources. Given the vulnerability of these sub counties bordering the Murchison national game park where the elephants come out every June – July of the year to feast on their produce while still in the garden, the following interventions should be integrated; • Kitchen gardening where chilly growing will be emphasized to be used for spraying of crops to keep off elephants and other vegetable encouraged for nutrition integration • Bee keeping to be practiced to keep off elephants as well as for income generation and nutrition benefits

Page 7
1.1 Introduction and Background In 2011 Self Help Africa launched its new strategic plan 2011 – 2015 in which with a vision to fight poverty and hunger. SHA – Uganda also launched its country strategic plan for the same period in which it declared an expansion to the Northern region and of the country as part of the livelihood recovery programme following the long term political, social and economic conflict that had completely destroyed the Northern Uganda Livelihood base when people were displaced from their homes into IDP camps for over 15 years. SHA – Uganda operates in parts of of Kayunga, Kumi, Kisoro, Kabale, Kanungu, Ibanda, Nebbi, Agago, Pader, and Oyam districts, with plans to expand into Kasese, Kamwenge, Masindi, Kiryandongo, Lira, Kole, Bulisa, Hoima, Adjumani and Nwoya district thus the reason for commissioning this IHM baseline assessment in the District of Nwoya. SHA is implementing an Agriculture and Livelihood programme with thematic areas in Agriculture, Natural resources management, Nutrition and value chain development. In all interventions delivered SHA seeks to better the quality of life of the small holder farmer through increased production and productivity, developed value chains and markets, conservation of the natural resource and better nutrition status. The IHM baseline assessment was carried out between 14th January - 3rd February, 2013 with contextual information collection and analysis conducted in the first week followed by data collection from individual households. This baseline was carried out by SHA programme staff together with partner staff from Gulu University(GU), MUST(Mbarara University of Science and Technology) and fhi360(community Connector pjt) The overall purpose of the IHM baseline assessment was to obtain reliable estimates of income from individual
households for purposes of guiding both policy and programming options for the SHA Nwoya livelihood
programme. The specific objectives of the assessment were to:
i. Develop a detailed livelihoods baseline for purposes of intervention design and monitoring of SHA – Uganda Nwoya Agriculture and livelihood project impact
ii. Develop a detailed baseline of implementing partners to avoid duplication of activities iii. Develop capacity of SHA and its partners in data collection and analysis using the IHM
1.2 Local context Nwoya District is one of the newest districts in Uganda. It was established by Act of Parliament and began functioning on 01 July 2010. Prior to that date, it was part of Amuru District. The district lies in the Acholi sub region. It is bordered by Amuru District to the north, Gulu District to the northeast, Oyam District to the east, Kiryandongo District, Masindi District and Buliisa District to the south. Nebbi District lies to the west of Nwoya District. Nwoya, the main political, administrative and commercial centre in the district, is located approximately 44 kilometres (27 mi), by road, southwest of the city of Gulu, the largest metropolitan area in the sub-region. This location is approximately 330 kilometres (210 mi), by road, north of the city of Kampala, Uganda's capital and largest metropolitan area. The coordinates of the district are: 02 38N, 32 00E. The district is predominantly rural. The 2002 national census estimated the population of the district at 41,010. The district population is growing at an estimated annual rate of 3.3%. Given those statistics, the projected population of the district in 2012 was approximately 60,548. Description of the livelihood zone Nwoya district has one livelihoods zone, the ‘Agriculture livelihood zone’ dominated by crop farming and less livestock farming. Its topography is relatively flat characterised with streams, swamps, rocks and game reserves. Its vegetation is savannah characterised by long grass, thickets and trees of albizia species with a bi-modal rainfall pattern. The main soil type in this district is the sandy loam with some areas having black cotton soils. The area has two agricultural seasons from March to June and August to November, the first rains of March to April characterise the main production season in the year. The main crops grown for food include; cassava, sweet potato, beans, groundnuts, sesame, sorghum and millet while those grown for cash include groundnuts, rice, maize, beans, sesame and to lesser extent cassava and millet.

Page 8
The main livestock products for home consumption in the livelihood zone are poultry and eggs, pork, meat, mutton and cow’s milk. The livestock and livestock products mainly sold for household cash income include poultry, pigs, goats, cow’s milk and beef. Local farmers within the livelihood zone mainly practice subsistence farming and majorly labour on rich people’ farms to meet their non-food needs. Poultry keeping is mainly associated with poorer households compared with piggery, goats, sheep and cattle which are a domain of the wealthier households. The Zone is sparsely populated except at trading centres, where it is densely settled. This district is not far from the main markets of Gulu and Pakwach with local markets running on weekly basis while other run on a day to day basis. There are very many middlemen who exploit the small holder farmer by offering low prices in their raw produce since they do not bulk for sale. The main constraints to development of livelihoods include poor feeder road conditions and limited access to markets including inadequate marketing infrastructure. Overall main hazards in the area include human and livestock diseases. Selected sub counties. Out of the five sub counties the following two were selected to be most vulnerable;
i. Purongo sub county being least served by development partners given its long distance away from the district centre thus no livelihood project was functional in the sub county.in this sub county Pawatomero west villages was chosen to host the assessment
ii. Kochgoma sub county basing on the fact that the current projects on livelihoods were winding up and the fact that it has a problem of elephants destroying crops every June-July of the year. In this subcounty Kal A 1 village was chosen to host the assessment.
1.3 Methodology-The IHM Approach The IHM is a method for measuring household income, developed by Evidence for Development (EfD).
1
In common with other household budget survey methods, the IHM involves the collection of household income data for the purpose of policy development and planning. However, the IHM differs from other approaches in (i) the method of data collection (a semi structured interview, rather than a standard questionnaire format is used) and (ii) the use of specialised software, which allows data checking and analysis to be carried out in the field. Together these reduce the risk of errors in data collection and allow errors to be identified and corrected. The steps in an IHM study are as follows. Having selected survey sites and determined the sample frame, a preliminary survey is conducted involving community leaders and other local key informants. This allows the team to explain in detail the purpose of the assessment, and to refine key research questions. It provides interviewers with basic information on the local economy and economic activities that subsequently allows them to identify inconsistencies in individual household interviews, and to cross question where appropriate. The preliminary survey also involves mapping the study area and drawing the sample. This is followed by individual household interviews. Household interviews are kept short (between 45 – 60 minutes) to avoid interviewer/ interviewee fatigue and where possible, appointments are made with households to arrange a time that does not interrupt normal working activities. On returning from the survey site, data is consolidated and entered into the IHM database. This allows for cross checking and identification of apparent anomalies in the data which can be discussed with the interviewer and followed up the next day. The Nwoya IHM Survey The Nwoya IHM studies ensured quality data through rigorous data checking in the field with call backs undertaken immediately to collect or clarify any missing information in the household interview forms.
1 See www.evidencefordevelopment.org

Page 9
This entailed crosschecking of food and income sources, while comparing with household size in order to quickly conclude whether the households could meet their food energy needs through own production and/or purchase. The conversion of local weights and measures into standard units was equally standardised to avoid over or under estimation of crop or wild food income. Finally constructive feedback was provided to teams who seemed to show some interviewing problems. The assessment was conducted over a two week period during which four sub villages were covered. These included Lawora B and Pida A in Pawatomero west village of Purongo sub county and Oteremu and Labora in Kal A1 village of Kochgoma sub county. The first week focused on livelihood zoning and contextual information collection which included the confirmation of the livelihood zone in which the district lies, development of village maps for purposes of sampling; seasonal activity and consumption calendars; local cost of living; employment; crops and livestock production information; standard units of conversion and market prices and trends. The remaining one week was dedicated to household data collection focusing on household demographics, assets, crop and livestock production, other cash income, wild foods, transfers & employment. The process entailed an initial briefing and discussion session with team members in Gulu town followed by a stakeholders’ meeting in which livelihood zoning and sampling occurred prior to the first team’s field work in Pawatomero west village, lawora B and Pida A sub villages and subsequently Kal A1 village, Oteremu and Labora. Household interviews A whole sub-village sample was carried out in Lawora B, Pida A, Oteremu and Labor. The plan was to interview 200 household out of which 185 households were interviewed. Six of these households were rejected in the analysis, as they were composed of one person, too old to work yet living alone and receiving food on a day to day basis from relatives and neighbours. 15 of the 200 households could not be interviewed as they had travelled away from the villages to distant relatives. Overall the mobilisation was highly effective. The IHM certification levels of survey members was as follows: one lHM level II/pending level III ; one pending level II having attended the software training and participated in one survey; 8 level I having attended the basic training and participated in one survey; and three who had never participated in IHM assessments. At each household data was gathered on household membership by age and sex; the educational attainment of household members; asset holdings; income by source including food and cash remittances from relatives and other avenues, employment, loans for the period March 2012 to Jan 2013. Each person conducted 2 - 3 household interviews each day. At the end of each day, data was entered into the Open-IHM software, checked and households requiring call backs were identified and team members notified on the need for appropriate action. A total of 47, 40, 45, 53 households were interviewed in Lawora B, Pida A, Oteremu and Labora sub-villages respectively. A total of18 call backs were also made across all four sub-villages over the one weeks field work period. The key issues were brought about by inadequate interview skills mixed will lack of enough knowledge about the importance of certain information and its relevance to the final analysis. Limitations of the samples
i. Some households were found to be locked and no resident was available for interviews which may introduce some bias in the sample.
ii. Many elderly people living alone and with a lot of assistance from close relatives like children introduces unreasonable income gaps
iii. Failure to reveal utilisation of game meat as livelihood source due to fear of the law introduces bias on how people survive all year round.

Page 10
1.3.1 Study Findings: Main definitions and the presentation of results The household is a group of people resident in the same house and cooking together within all sampled sub-villages during the reference year. The reference year in this particular survey was the period March 2012-February 2013. Household income is made up partly in food, and partly in money. In many cases some or all food income is not sold, so no price is available for that food. This means that total household income cannot be calculated in terms of money. Therefore a standardised presentation is used in terms of 'disposable income'/ adult equivalent. This is defined as: “the money income remaining to the household after it has met its food energy requirement at a standard rate, for each 'adult equivalent' in the household”. Disposable income is calculated from the household’s total food energy requirement, calculated from UN reference values (WHO 1985). This is based on the period individuals were actually resident in the household, so periods away from home e.g. at boarding school, doing migrant labour are excluded. The cost of the proportion of the household energy requirement not met from the household's income as food (Kcal income) is estimated using a set diet defined in discussion with poorer residents as being typical of the diets of poorer households. The disposable income is calculated by subtracting the cost of the minimum diet from the total household money income. The result is standardised by dividing the disposable income by the number of 'adult equivalents' in the household. The number of adult equivalents is calculated as the total household energy requirement/ the energy requirement of a young adult (2,600 Kcals/day). Most common staple foods, local Minimum Diet The most common and local minimum diet was derived through both focus group discussions and triangulation with some household interviews. Incidentally the minimum diet was also similar to labour payment with food in the sampled villages. Table 1: Minimum Diet
Purongo Sub County Kochgoma Sub County
Food type % of diet as food energy
Price in UGX per Kilogram
Food type % of diet as food energy
Price in UGX per Kilogram
Sweet Potatoes 40 125 Sweet Potatoes 40 125
Beans 20 1200 Beans 30 1200
Groundnuts dry 20 3000 Sesame 10 2400
Sorghum 20 800 Sorghum 20 800
The standard of living threshold is the cost of a basket of goods and services sufficient to achieve a minimum acceptable standard of living was established in discussion with residents and the results are as bellow in Table 2 Table 2: Goods and Services required for Minimum Standard of Living (minimum basket)
Expense type Unit of measurement
Quantity Frequency Cost per Unit - UGX
Cost per year
Household Items
Soap Star blue 1 52 2,500 130,000
Salt Packets(500g) 1 52 500 26,000
Paraffin Litres 1.071 12 2,700 34,700
Vaseline No of Tins 1 12 3,500 42,000
Lighters No of lighters 2 12 361.46 8675
Clothes adult female
pieces 1 Once 67,000 67,000
Clothes adult pieces 1 Once 45,000 45,000

Page 11
male
Clothes child female
pieces 1 Once 25,000 25,000
Clothes Child male
Item 1 Once 25,000 25,000
Social Services
School fees Per Child 1 Once 123,200 123,200
Health care Per visit 1 Twice 40,000 40,000
The cost of the minimum standard of living was initially established during collection of contextual information through focus group discussions on various issues such as crop and livestock production, local units of measurement and price information within the main markets. This was validated through some specific interviews with relatively poorer households in the sampled villages. Household Profiles- Main Asset: The main tradable assets owned by households in Purongo and Kochgoma sub counties include livestock such as cattle, goats, pigs and chicken; household items such as hand tools- hoes, pangas and axe; other equipment namely mobile phones, bicycles, radios, sewing machines, motorcycles, solar panels, bee hives, generators, plastic cheers and tents among others. Table 3: Shows household ownership and access to land among sampled study households in Purongo and Kochgoma Sub counties
Average land sizes No of households Percentage (%)
0-2 acres 37 20.67%
3-4 acres 47 26.26%
5 + acres 95 53.07%
Totals 179 100%
Table 3 shows ownership and access to land among all sampled households. The majority of households own about 5+ acres represented by 53.07% followed by 3-4 acres represented by about 26.26% and finally 0-2 acres represented by about 20.67% of the overall 179 sampled households. The findings show that ownership and access to land is not the cause of low agricultural production in the study area but rather an attribute to the high percentages of 97% and 100% in Purongo and Kochgoma sampled households respectively that were able to meet their minimum food energy requirement in the reference period March 2012 – February 2013. Table 4: Shows household ownership of cattle among sampled study households in Purongo and Kochgoma Sub counties
Average cattle owned No of households Percentage (%)
0-2 cattle 165 92.18%
3-4 cattle 6 3.35%
5 + cattle 8 4.47%
Totals 179 100%
Table 4 shows ownership of cattle among all sampled households. The majority of households own about 0-2 cattle (around 92%), followed by 5 + cattle (around 5%)and 3-4 cattle represented (about 3%).

Page 12
Table 5: Shows household ownership of goats among sampled study households in Purongo and Kochgoma Sub counties
Average goats owned No of households Percentage (%)
0-2 goats 111 62.01%
3-4 goats 28 15.64%
5 + goats 40 22.35%
Totals 179 100%
Table 4 shows ownership of goats among all sampled households. The majority of households own about 0-2 goats (62%), followed by 5 + goats around (22% )and 3-4 goats just under 16%. These findings show that there are few households with large numbers of cattle of small ruminants such as goats in the study area, and explains the limited contribution of livestock and livestock products towards household food and cash income during the reference period March 2012 – February 2013. This lack of diversity leaves the community with few alternative livelihood options in the case of shocks. Table 6: Shows household demographics- proportion of female, male and child headed households among sampled study households in Purongo and Kochgoma Sub counties
Category of Households Female headed Male headed Child headed
Total
No of households 44 135 0 179
Percentage of household’s 24.58% 75.42% 0%
100%
The table above shows the category of female, male and child headed households out of the 179 households analysed in Purongo and Kochgoma sub counties respectively. Overall there are more male headed households as compared with female and no child headed households among sampled households in the two sub counties. Figure 1: Shows household demographics- typical range of sampled household sizes in Purongo and Kochgoma sub counties of Nwoya district.
Graph 1 above shows that majority of sampled households in the four villages have an average household size of 5-8 people representing about 53.63% (96 households) of the sampled households, followed by 1-4 people representing about 25.14% ( 45 households)
0102030405060708090
100
1-4 People 5-8 People 9-12 People 13 + PeopleNu
mb
er
of
Ho
use
ho
lds
Typical Ranges of Houusehold Sizes
Sampled Household Size Analysis in Purongo and Kochgoma Sub Counties

Page 13
The remaining households in the sample lie within a household sizes of 9-12 and 13+ people representing about 19% (34 households) and 2.23% ( 4 households) respectively. Those households with a high dependency ratio a likely to face labour shortages.
2.0 Main Findings-Purongo sub county, Pawatomero west village (Lawora B & Pida A sub- villages) The following analysis was carried out using the open-ihm software (http://code.google.com/p/open-ihm/) A total of 87 households were included in site I analysis comprising of 47 households (54%) from Lawora B and 40 households (46%) from and Pida A sub-village. Disposable income in Purongo Sub County, Pawatomero West Village (Lawora B and Pida B sub- villages) Figure 2: Presents disposable income per adult equivalent i.e. the money remaining to the household after it has met its basic food energy requirement before the cost of minimum standard of living has been applied Fig. 2: Disposable Income/Adult Equivalent
Each bar in figure 2 above represents a household, and households below the X - axis are not able to meet their basic food energy needs. A total of 3.45% (3 households) of the interviewed households in Lawora B and Pida A were unable to meet their minimum food energy needs during the March 2012- February 2013 reference period. These households lie below the minimum food intake level due to insufficient income to meet the cost of minimum food energy needs as such do not have any disposable income. They are analysed in table 3 below. Table 7: Analysis of the 3 poor households
Household no.
Land (acres)
Household size
Food stocks Yes/no
Chicken Goats Sheep Bicycle Solar panel
20 1 7 3 - - - -
7 4 3 Yes 14 2 - - -
36 3 9 yes 11 7 6 1 1
-500000
0
500000
1000000
1500000
2000000
2500000
1 4 7 10 13 16 19 22 25 28 31 34 37 40 43 46 49 52 55 58 61 64 67 70 73 76 79 82 85
An
na
ul h
ou
seh
old
dis
po
sab
le in
com
e(U
GX
) p
er a
du
lt
equ
iva
len
t
Individual households displayed from left to right in order of disposable income (poorest - richest)
Household disposable income in Purongo subcounty
Page 14
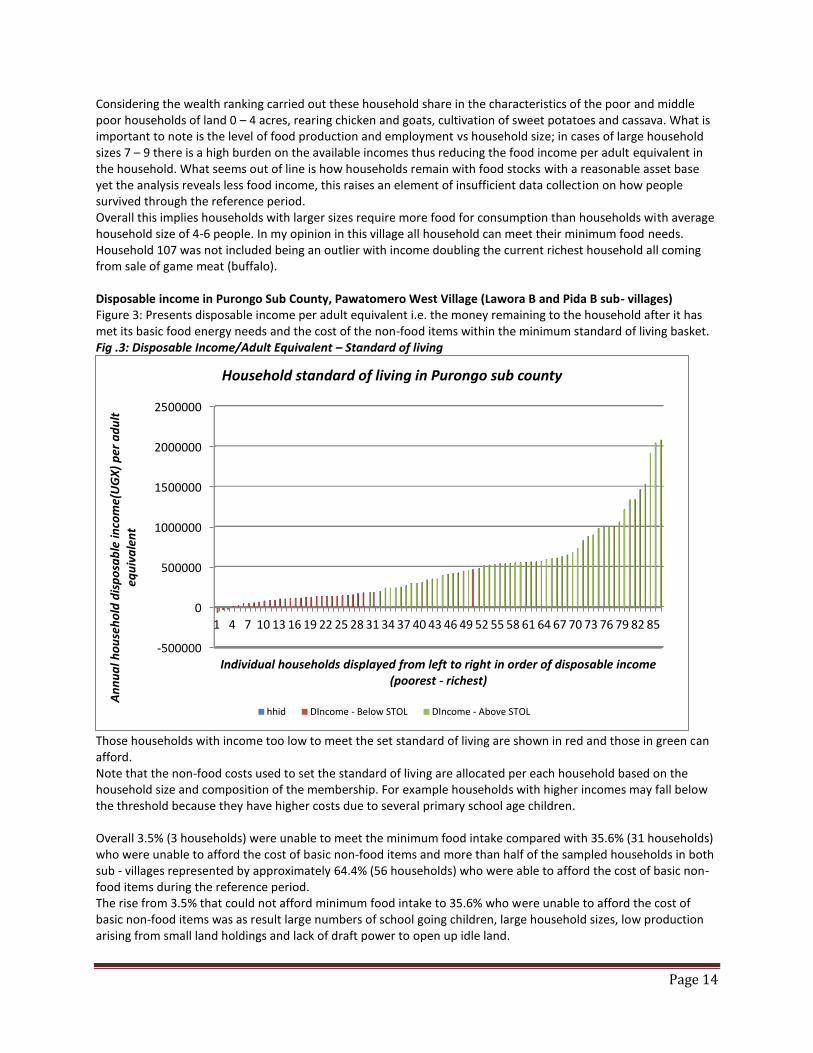
Considering the wealth ranking carried out these household share in the characteristics of the poor and middle poor households of land 0 – 4 acres, rearing chicken and goats, cultivation of sweet potatoes and cassava. What is important to note is the level of food production and employment vs household size; in cases of large household sizes 7 – 9 there is a high burden on the available incomes thus reducing the food income per adult equivalent in the household. What seems out of line is how households remain with food stocks with a reasonable asset base yet the analysis reveals less food income, this raises an element of insufficient data collection on how people survived through the reference period. Overall this implies households with larger sizes require more food for consumption than households with average household size of 4-6 people. In my opinion in this village all household can meet their minimum food needs. Household 107 was not included being an outlier with income doubling the current richest household all coming from sale of game meat (buffalo). Disposable income in Purongo Sub County, Pawatomero West Village (Lawora B and Pida B sub- villages) Figure 3: Presents disposable income per adult equivalent i.e. the money remaining to the household after it has met its basic food energy needs and the cost of the non-food items within the minimum standard of living basket. Fig .3: Disposable Income/Adult Equivalent – Standard of living
Those households with income too low to meet the set standard of living are shown in red and those in green can afford. Note that the non-food costs used to set the standard of living are allocated per each household based on the household size and composition of the membership. For example households with higher incomes may fall below the threshold because they have higher costs due to several primary school age children. Overall 3.5% (3 households) were unable to meet the minimum food intake compared with 35.6% (31 households) who were unable to afford the cost of basic non-food items and more than half of the sampled households in both sub - villages represented by approximately 64.4% (56 households) who were able to afford the cost of basic non-food items during the reference period. The rise from 3.5% that could not afford minimum food intake to 35.6% who were unable to afford the cost of basic non-food items was as result large numbers of school going children, large household sizes, low production arising from small land holdings and lack of draft power to open up idle land.
-500000
0
500000
1000000
1500000
2000000
2500000
1 4 7 10 13 16 19 22 25 28 31 34 37 40 43 46 49 52 55 58 61 64 67 70 73 76 79 82 85
An
nu
al h
ou
seh
old
dis
po
sab
le in
com
e(U
GX
) p
er a
du
lt
equ
iva
len
t
Individual households displayed from left to right in order of disposable income (poorest - richest)
Household standard of living in Purongo sub county
hhid DIncome - Below STOL DIncome - Above STOL

Page 15
Sources of Household Food Income in Purongo Sub County, Pawatomero West Village (Lawora B and Pida A sub- villages) Figure 4: Presents household income as food (Kilocalories) consumed by the household by source in Lawora B and Pida A sub- villages during the period March 2012-February 2013. Fig. 4: Sources of food income
The food income pattern in figure 4 shows that, the most predominant source of household food income in both Lawora B and Pida A sub - villages is own crop production, supplemented by wild foods. This suggests that interventions aimed at improving agricultural crop production may be critical to ensure household food and livelihood security in these rural villages. However it also shows limited agricultural diversification with high dependency on crop production as compared with livestock husbandry. There are very few households who derive significant quantities of food income from livestock products. This implies that, the introduction of alternative sources of livelihoods may be appropriate to promote diversification and overall reduction of risks associated with climate variability in the study villages. The possible alternative livelihoods suitable for the area may include support towards livestock production as a viable alternative to supplement crop production. Sources of Household Food Income in Purongo Sub County, Pawatomero West Village (Lawora B and Pida A sub- villages) Figure 5: Presents household income as food (Kilocalories) consumed by the household by source in Lawora B and Pida A sub- villages during the period March 2012-February 2013.
0
1000000
2000000
3000000
4000000
5000000
6000000
7000000
1 4 7 10 13 16 19 22 25 28 31 34 37 40 43 46 49 52 55 58 61 64 67 70 73 76 79 82 85
An
nu
al h
ou
seh
old
fo
od
inco
me
(U
GX
) p
er a
du
lt e
qu
iva
len
t
Individual household displayed from left to right in order of disposable income (poorest to richest)
Sources of food income in Purongo subcounty
hhid CropFoodIncome (KCals) EmploymentFoodIncome (KCals)
LivestockFoodIncome (KCals) TransferFoodIncome (KCals) WildFoodsIncome (KCals)

Page 16
Fig. 5: Sources of food income
The food income pattern in figure 4 shows that the predominant source of household food income in both Lawora B and Pida A sub - villages is own crop production, supplemented by wild foods. This suggests that interventions aimed at improving agricultural crop production may be critical to ensure household food and livelihood security in these rural villages. However it also shows limited agricultural diversification with high dependency on crop production as compared with livestock husbandry. There are very few households who derive significant quantities of food income from livestock products even when the climate, soils and land tenure system could favour such a practice. This implies that the introduction of alternative sources of livelihoods may be appropriate to promote diversification and overall reduction of risks associated with climate variability in the study villages given the fact that primarily rain fed agriculture is practiced. The possible alternatives include support for livestock production to supplement crop production and build resilience to hazards. Main sources of food Income in Purongo subcounty, Pawatomero West Village (Lawora B and Pida A sub – villages) Figure 6 shows the main crops that majorly contribute towards food income on daily basis in the households of Lawora B and Pida A sub – villages.
0
1000000
2000000
3000000
4000000
5000000
6000000
7000000
1 4 7 10 13 16 19 22 25 28 31 34 37 40 43 46 49 52 55 58 61 64 67 70 73 76 79 82 85
An
nu
al h
ou
seh
old
fo
od
inco
me
(U
GX
) p
er a
du
lt e
qu
iva
len
t
Individual household displayed from left to right in order of disposable income (poorest to richest)
Sources of food income in Purongo subcounty
hhid CropFoodIncome (KCals) EmploymentFoodIncome (KCals)
LivestockFoodIncome (KCals) TransferFoodIncome (KCals) WildFoodsIncome (KCals)

Page 17
Fig.6: Main sources of food income
It should be clearly noted that among the many crops grown in Lawora A and B cassava, sweet potatoes and ground nuts contribute most towards household food income and in case of any interventions to strengthen the food security base such crops should be considered. Never the less this area boarders with Murchison game park and many of the local population earn reasonable food income through hunting game meat but given the strict laws the households did not freely reveal such information. Information was got through engaging guides in private discussions of the possibility of tasting such meat and they revealed that most of the meat served as roasted in the food joints in the area was game in nature. Sources of Household Cash Income in Purongo Sub County, Pawatomero West Village (Lawora B and Pida A sub- villages) Figure7: Presents household income as cash (Ugandan Shillings) in Lawora and Pida sub - villages during the March 2012-Feb 2013 reference year. Fig. 7: Sources of household cash income
The cash income patterns shown in figure 7, indicates that own crops and employment are the predominant sources of household cash income in both Lawora B and Pida A villages. Overall most household cash incomes in Lawora B and Pida A are within the range of 100,000- 1,000,000 UGX per annum. The crops sold by the local people include rice, groundnuts dry, cassava fresh and sweet potatoes.
0
2000000
4000000
6000000
1 5 9 13 17 21 25 29 33 37 41 45 49 53 57 61 65 69 73 77 81 85
An
nu
al d
isp
osa
ble
fo
od
inco
me
(U
GX
) p
er a
du
lt e
qu
iva
len
t
Individual households displayed from left to right in order of disposable income (poorest to richest)
Main sources of food income in Purongo sub county
Beans(KCal) Cassava fresh(KCal) Groundnut, dry(KCal) Pigeon peas(KCal)
Potato sweet(KCal) Rice(KCal) Sorghum - whole(KCal)
0
500000
1000000
1500000
2000000
1 5 9 13 17 21 25 29 33 37 41 45 49 53 57 61 65 69 73 77 81 85
An
nu
al h
ou
seh
old
ca
sh in
com
e (U
GX
) p
er a
du
lt e
qu
iva
len
t
Individual households displayed from left to right in order of disposable income (poorest to richest)
Sources of household cash income in Prongo sub county
cropincome employmentcashincome livestockincome transferincome wildfoodsincome

Page 18
The household cash incomes are greatly supplemented through formal and informal employment opportunities. It should be noted that there are two big farms in Pawatomero west villages from which the local population seek employment alongside petty business and formal employment. Therefore an intervention on workers’ rights sensitisation through formation of workers’ union might be an interesting venture. Nevertheless this area boarders with Murchison game park and many of the local population earn significant cash income through the sale of game meat, but given the strict laws the households did not freely reveal such information apart from one household whose income was twice that of the second most well off, making it an outlier (data not shown on chart). The findings also validate the identification of the livelihood zone in which Lawora B and Pida A sub - villages are located. Although described as a mixed farming livelihoods zone, the findings on the sources of household cash income suggest that, this is a more crop producing area compared with livestock sector activities. Fig. 8: % contributions of all income sources towards household cash income
Fig 8 above clearly shows that employment income contributes more significantly towards household cash income than own crop sales. Main sources of crop cash Income in Purongo subcounty, Pawatomero West Village (Lawora B and Pida A sub – villages) Figure 9 shows the main crops that majorly contribute towards household cash income on daily basis in the households of Lawora B and Pida A sub – villages. Fig.9: Main crop sources of cash income
A pie chart showing % Contribution of all income sources towards household annual cash income
in Purongo sub county
cropincome employmentcashincome livestockincome
transferincome wildfoodsincome
0100000200000300000400000500000600000700000800000900000
100000011000001200000
1 5 9 13 17 21 25 29 33 37 41 45 49 53 57 61 65 69 73 77 81 85
An
nu
al d
isp
osa
ble
ca
sh in
com
e (U
GX
) p
er a
du
lt e
qu
iva
len
t
Individual holusehold displayed from left to right in order of disposable income (poorest to richest)
Main sources of cash income in Purongo subcounty
hhid Beans Cassava fresh Groundnut, dry Pigeon peas Potato sweet Rice Sorghum - whole
Page 19
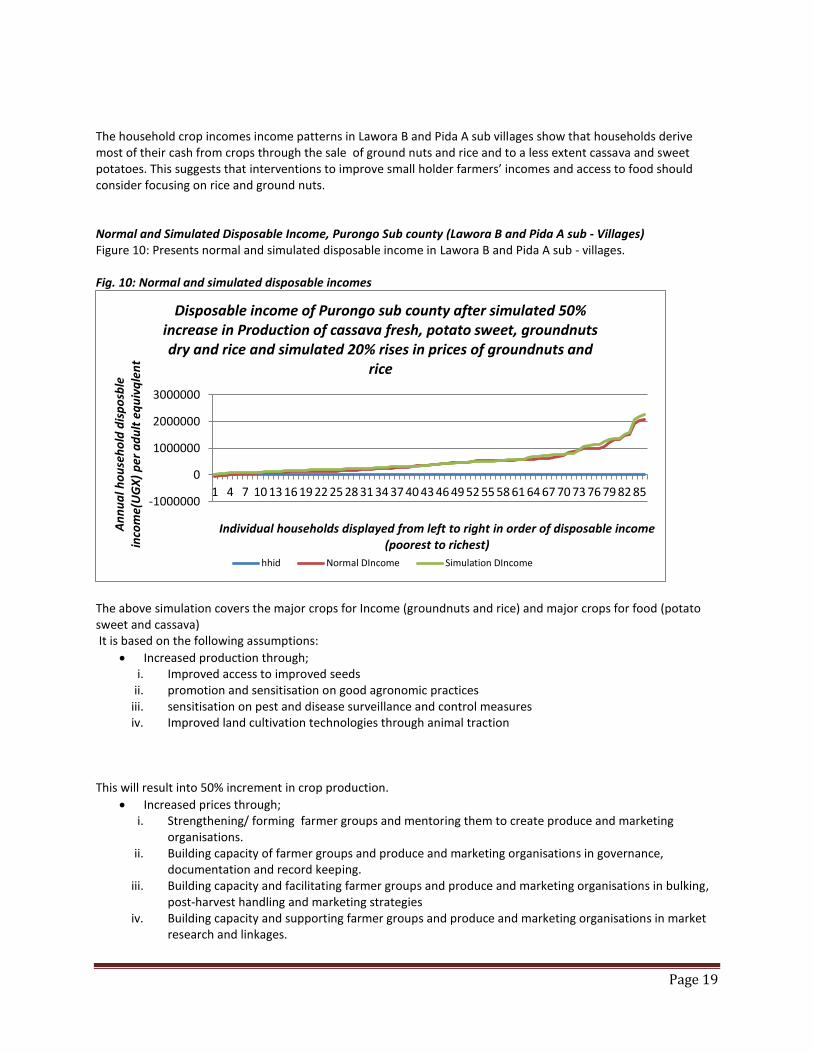
The household crop incomes income patterns in Lawora B and Pida A sub villages show that households derive most of their cash from crops through the sale of ground nuts and rice and to a less extent cassava and sweet potatoes. This suggests that interventions to improve small holder farmers’ incomes and access to food should consider focusing on rice and ground nuts. Normal and Simulated Disposable Income, Purongo Sub county (Lawora B and Pida A sub - Villages) Figure 10: Presents normal and simulated disposable income in Lawora B and Pida A sub - villages. Fig. 10: Normal and simulated disposable incomes
The above simulation covers the major crops for Income (groundnuts and rice) and major crops for food (potato sweet and cassava) It is based on the following assumptions:
Increased production through; i. Improved access to improved seeds
ii. promotion and sensitisation on good agronomic practices iii. sensitisation on pest and disease surveillance and control measures iv. Improved land cultivation technologies through animal traction
This will result into 50% increment in crop production.
Increased prices through; i. Strengthening/ forming farmer groups and mentoring them to create produce and marketing
organisations. ii. Building capacity of farmer groups and produce and marketing organisations in governance,
documentation and record keeping. iii. Building capacity and facilitating farmer groups and produce and marketing organisations in bulking,
post-harvest handling and marketing strategies iv. Building capacity and supporting farmer groups and produce and marketing organisations in market
research and linkages.
-1000000
0
1000000
2000000
3000000
1 4 7 10 13 16 19 22 25 28 31 34 37 40 43 46 49 52 55 58 61 64 67 70 73 76 79 82 85
An
nu
al h
ou
seh
old
dis
po
sble
in
com
e(U
GX
) p
er a
du
lt e
qu
ivq
len
t
Individual households displayed from left to right in order of disposable income (poorest to richest)
Disposable income of Purongo sub county after simulated 50% increase in Production of cassava fresh, potato sweet, groundnuts dry and rice and simulated 20% rises in prices of groundnuts and
rice
hhid Normal DIncome Simulation DIncome

Page 20
These measures are likely result in a 20% increment in market prices of the major cash crops identified in the simulation, through (a) improved quality of local produce and (b) collective bargaining through bulk marketing by local farmers. The overall simulated value suggests an average increase of 23.8% in disposable income of all households in Purongo sub county, Pawatomero west village (Lawora B and Pida A sub villages). This would cause poor households be in position to meet their minimum food energy intake and part/or all of the non-food items needed. However, organisations would need to ensure that poorer as well as better off farmers had access to interventions. Conclusion and Implications: Based on the analysis of household food and cash incomes it can be concluded that the population in this village is largely dependent on crop production, wild foods and farm agricultural labour for household food and livelihood security. Given the fact that poaching is illegal and SHA is not involved with existing farms that employ local labour, the Self Help Africa project must identify practical and innovative approaches to increase food production and the marketing of local produce in the area. 3.0 Main Findings- Kochgoma Sub County Kal parish, Kal A1 village (Oteremu and Labora sub - Villages) The second IHM study sites were Oteremu and Labora sub-villages in Kal A 1 village, Kal parish in Kochgoma sub county of Nwoya district. In these two sub villages a whole sub village approach was used and a total of 98 households were interviewed, 97 households were included in the analysis and one household was left out because it was composed of one very elderly person who was too old to work and survived on cooked food from relatives. Disposable income in Kochgoma Sub County Kal parish, Kal A1 village (Oteremu and Labora sub - Villages) Figure 11 shows disposable income per adult equivalent i.e. the money remaining to the household after it has met its basic food energy needs. However at this stage the cost of minimum standard of living has not yet being factored in the analysis. Fig. 11: Disposable Income /Adult Equivalent
0
500000
1000000
1500000
2000000
2500000
1 5 9 13 17 21 25 29 33 37 41 45 49 53 57 61 65 69 73 77 81 85 89 93
An
nu
al h
ou
seh
old
dis
po
sab
le
inco
me(
UG
X)
per
ad
ult
eq
uiv
ale
nt
Individual households displayed from left to right in order of disposable income (poorest to richest)
Households' disposable income in Kochgoma Sub County
Disposable Income
Page 21
Each bar in figure 11represents a household: all households in Oteremu and Labora sub – villages were able to meet their minimum food energy needs during the reference year of March 2012- February 2013. In order to use use a comparative scale for both sub counties, three households that had incomes almost twice the current richest household were not included in the above analysis. They are analysed as bellow, with additional information on area of land cultivated and household size. Table 8: Analysis of the 3 richest outlier households
Household no.
Land cultivated (acres)
Household size
Crops cultivated
Amount sold(kg)
Price
73 10 3 Cassava dry 600 900
Cassava fresh 850 300
67 11 3 Cassava fresh 20,000 300
97 6 5 Banana green 26,890 500
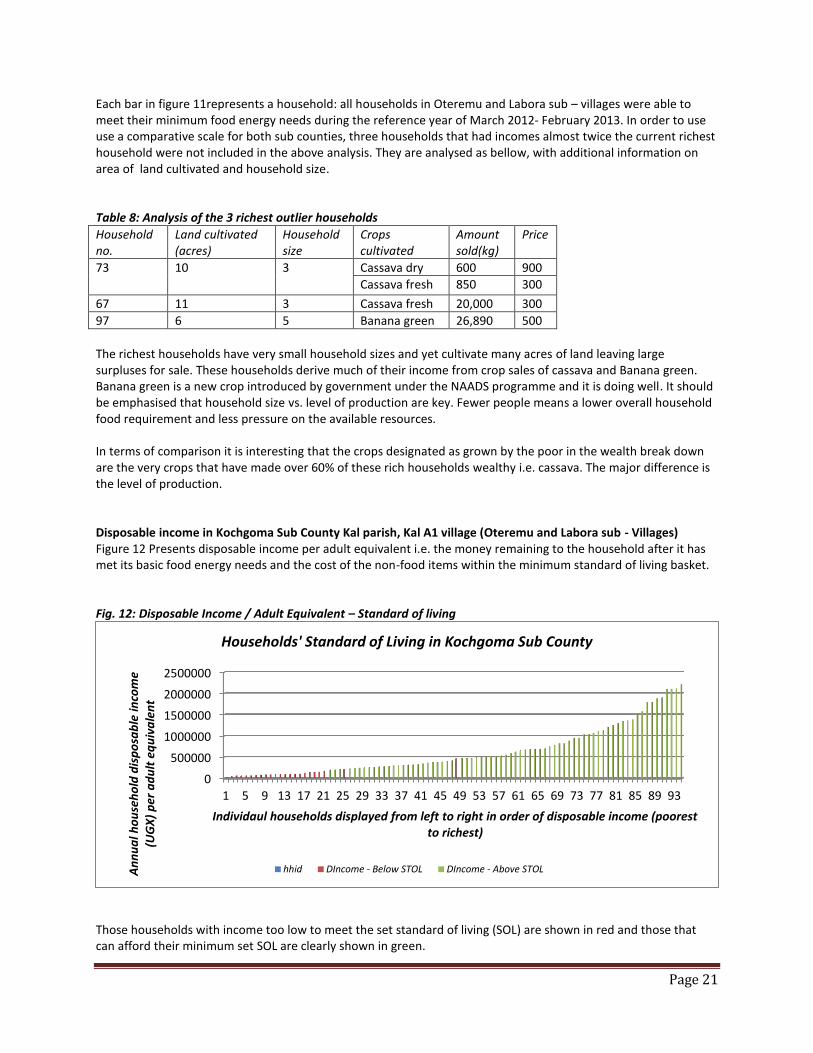
The richest households have very small household sizes and yet cultivate many acres of land leaving large surpluses for sale. These households derive much of their income from crop sales of cassava and Banana green. Banana green is a new crop introduced by government under the NAADS programme and it is doing well. It should be emphasised that household size vs. level of production are key. Fewer people means a lower overall household food requirement and less pressure on the available resources. In terms of comparison it is interesting that the crops designated as grown by the poor in the wealth break down are the very crops that have made over 60% of these rich households wealthy i.e. cassava. The major difference is the level of production. Disposable income in Kochgoma Sub County Kal parish, Kal A1 village (Oteremu and Labora sub - Villages) Figure 12 Presents disposable income per adult equivalent i.e. the money remaining to the household after it has met its basic food energy needs and the cost of the non-food items within the minimum standard of living basket. Fig. 12: Disposable Income / Adult Equivalent – Standard of living
Those households with income too low to meet the set standard of living (SOL) are shown in red and those that can afford their minimum set SOL are clearly shown in green.
0
500000
1000000
1500000
2000000
2500000
1 5 9 13 17 21 25 29 33 37 41 45 49 53 57 61 65 69 73 77 81 85 89 93
An
nu
al h
ou
seh
old
dis
po
sab
le in
com
e (U
GX
) p
er a
du
lt e
qu
iva
len
t
Individaul households displayed from left to right in order of disposable income (poorest to richest)
Households' Standard of Living in Kochgoma Sub County
hhid DIncome - Below STOL DIncome - Above STOL

Page 22
Note that the non-food costs used to set the standard of living are allocated per each household based on the household size and composition of its membership. Overall 23.71% (23 households) were unable to afford the cost of basic non-food items even when they could all meet their minimum food energy needs 76.29 (74 households) who were able to afford the cost of basic non-food items in Oteremu and Labora sub - villages. Comparison between Purongo and Kochgoma sub counties Table 9:
Variables Purongo Sub county Kochgoma Sub county
% of HHs below individual HH minimum food intake
3.45% 0%
% of HH below cost of minimum standard of living
35.60% 23.71%
From the simple comparison in Table 4 above there seems to be a clear indication that Households in Kochgoma sub county are better off than Purongo sub county. This reflects the 23 households out of 97hhs in Kochgoma sub county could not afford the cost of basic non- food items compared to 31 households out of 87 in Purongo sub county. Sources of Household Food Income in Kochgoma Sub County, Kal parish, Kal A1 Village (Oteremu and Labora sub- villages) Figure 13 Presents household income as food (Kilocalories) consumed by the household by source in Oteremu and Labora sub- villages during the period March 2012-February 2013. Fig. 13: Sources of food income
Simillar to Lawora B and Pida A sub-villages, the food income pattern in figure 11 shows that the most main source of household food income in both Oteremu and Labora sub - villages is from own crop production, supplemented by wild foods. Significant quantities of household food income was derived from the wild as the village shares a
0
1000000
2000000
3000000
4000000
1 5 9 13 17 21 25 29 33 37 41 45 49 53 57 61 65 69 73 77 81 85 89 93 97
An
nu
al h
ou
seh
old
fo
od
inco
me
(Kca
ls)
per
ad
ult
eq
uiv
ale
nt
Individual households displayed from left to right in order of disposable income (poorest to richest)
Sources of food income in Kochgoma Sub County
hhid CropFoodIncome (KCals) EmploymentFoodIncome (KCals)
LivestockFoodIncome (KCals) TransferFoodIncome (KCals) WildFoodsIncome (KCals)

Page 23
boundary with Murchison game park. However, this is a non - sustainable source in the face of strict laws and climatic changes that impact on how man and animals survive. For this reason, interventions aimed at improving agricultural crop production may be critical in ensuring future household food and livelihood security in these rural villages. However agricultural diversification is currently limited, with high dependency on rain fed crop production. Few households derived significant food income from livestock products although the climate, soils and land tenure system are favourable to animal husbandry. The possible alternative livelihoods suitable for the area include support towards livestock production to supplement crop production and build resilience to hazards. Main sources of food Income in Kochgoma Sub County, Kal parish, Kal A1 Village (Oteremu and Labora sub- villages) Figure 14shows the main crops that majorly contribute towards food income on daily basis in the households of Oteremu and Labora sub – villages. Fig. 14: Main crop sources of food income
Figure 14 above shows that among the many crops grown Oteremu and Labora cassava, sweet potatoes, ground nuts, beans and sesame contribute most towards household food income. These crops should be prioritised in any interventions to strengthen the food security. These areas boarder the Murchison game park and many of the local population earn additional food income through hunting game meat but given the strict laws in place and climatic changes affecting the way man and animals live, this is not sustainable.
0
200000
400000
600000
800000
1000000
1200000
1400000
1600000
1800000
2000000
2200000
2400000
2600000
2800000
3000000
3200000
3400000
1 4 7 10 13 16 19 22 25 28 31 34 37 40 43 46 49 52 55 58 61 64 67 70 73 76 79 82 85 88 91 94 97
An
nu
al h
ou
seh
old
fo
od
inco
me
(KC
als
) p
er a
du
lt e
qu
iva
len
t
Individual households displayed from left to right in order of disposable income (poorest to richest)
Main Crop Sources of Food Income in Kochgoma Sub County
hhid Beans(KCal) Cassava fresh(KCal) Groundnut, dry(KCal) Potato sweet(KCal) Sorghum - whole(KCal) sesame(KCal)

Page 24
Sources of Household Cash Income in Kochgoma Sub County, Kal parish, Kal A1 Village (Oteremu and Labora sub- villages) Figure 15: Presents household cash income as (Ugandan Shillings) in Oteremu and Labora sub- villages during the March 2012-February 2013 reference year. Fig. 15: sources of household cash income
From figure 15 above it can be seen that households in Kochgoma derive most of their cash income from own production and employment with traces of transfer earnings. Unlike in Purongo where most employment is on rich people’s farms, here employment income is dominated by agricultural labour on the gardens of the better off, charcoal burning and petty trade. The main crops sold include; groundnuts, cassava, simsim and beans. Most household cash income in Kochgoma is within the range of 100,000/= – 1,000,000/= per adult equivalent/ annum. The overall patterns show that, poorest households have fewer crops for sale compared with relatively better-off households. Fig. 16: % contribution of all income sources towards household cash income
As in Purongo sub county, figure 16 shows that employment income accounts for the highest proportion of overall household cash income in Kochgoma sub county, followed by income from the sale of crops. Since the dominant
0200000400000600000800000
10000001200000140000016000001800000200000022000002400000260000028000003000000320000034000003600000380000040000004200000
1 4 7 10 13 16 19 22 25 28 31 34 37 40 43 46 49 52 55 58 61 64 67 70 73 76 79 82 85 88 91 94 97An
nu
al h
ou
seh
old
ca
sh in
com
e (U
GX
) p
er a
du
lt
equ
iva
len
t
Individual households displayed from left to right in order of disposable income (poorest to richest)
Sources of cash income in Kochgoma sub county
hhid cropincome employmentcashincome livestockincome transferincome wildfoodsincome
Percentage contribution of all income sources towards total household annual cash income in
Kochgoma sub county
cropincome employmentcashincome livestockincome
transferincome wildfoodsincome

Page 25
employment types in this sub county include agriculture labour, petty trade and charcoal burning, if SHA promotes increased production and higher level associations comprehensively handling bulk production, marketing and loans, then (i) employment and crop income would be boosted and (ii) alternative income sources to charcoal burning would be available reducing the impact on forest resources and creating more favourable conditions for tree planting and soil and forest conservation Main sources of crop cash Income in Purongo subcounty, Pawatomero West Village (Oteremu and Labora sub – villages) Figure 17 shows the main crops that majorly contribute towards household cash income on daily basis in the households of Oteremu and Labora sub – villages in Kochgoma subcounty. Fig. 17: Main crop cash income sources
The household crop income patterns in Oteremu and Lawora B sub villages show that most households derive cash income from crops through the sale of ground nuts, cassava, sesame and beans. As households in this sub county are able to meet their minimum food energy intake from own production and agricultural labour, interventions should focus on organization and economic empowerment in order to improve smallholder farmers’ incomes and build their resilience to shocks. This could be done through increased production, establishing value chains and developing market information systems. Conclusion and Implications: Similar to Purongo sub county household food and cash income analysis the population in these sub villages is largely dependent on crop production, wild foods and farm agricultural labour for household food and livelihoods security. Given the fact that poaching is illegal and SHA can influence increased agricultural labour through increased production, establishment of value chains and developing marketing information systems through innovative approaches and practices. it should be noted that these sub villages are faced with a challenge of crop
0
100000
200000
300000
400000
500000
600000
700000
1 4 7 10 13 16 19 22 25 28 31 34 37 40 43 46 49 52 55 58 61 64 67 70 73 76 79 82 85 88 91 94An
nu
al h
ou
seh
old
ca
sh in
com
e (U
GX
) p
er a
du
lt
equ
iva
len
t
Individual households displayed from left to right in order of disposable income (poorest to richest)
Main Sources of Cash Income in Kochgoma Sub County
Beans Cassava fresh Groundnut, dry Pigeon peas Potato sweet Sorghum - whole sesame

Page 26
destruction by the elephant every June – July of the year given its proximity to the game park and the following interventions should be intergrated;
Kitchen gardening where chilly growing will be emphasized to be used for spraying of crops to keep off elephants
Bee keeping to be practiced to keep off elephants as well as as for income generation and nutrition benefits
Table 10- Profiles of the poorest households in the four villages: There are no single defining characteristics of the poorest households. A brief summary of the poorest households.
Village Description of the household
Lawora B and Pida A
Household 20 is a female headed household with seven people owning one acre of land, 3 chicken having less from own production and surviving mostly on agricultural labour and social transfers from relatives and friends. The household has only one person who is productive out of seven thus a dependency ratio of 1:7people. This household has less food income due to low food production.
Household seven is a young family of three owning 4 acres of land under-utilised, 14 chicken, 6 pigeons and two goats. They are less productive surviving on transfer from relatives and a loan acquired from the village saving and loan association. The household has very low food income due to low food production.
Oteremu and Labora
All households in these sub villages of Kochgoma sub county could afford their minimum food energy intake but the poorest two households had the following characteristics. Household 107 is a female headed household of four people with no land and no livestock renting a small land for own production and basically surviving on agricultural labour/casual labour for their minimum energy food intake.
Household 66 is a male headed household of 12 people with three acres of land, no livestock can produce what to eat with supplement from beer brewing and agricultural labour. It owns a solar panel for battery charging and brewing utensils that aid in production. This household cannot afford its minimum non-food items due to the large household size and high dependency ratio of 5:7 people.
4.0 Main Conclusions and Implications: This survey was carried out to develop a livelihoods baseline for the Self Help Africa project in Nwoya district, Uganda. The data analysis and evidence derived suggests the following possible recommendations for the purpose of improving the livelihoods of the local population. The majority of households are able to meet minimum food energy requirements and pay for basic non-food items, although a small number households still face difficulties in reaching meeting the minimum food needs and others are unable to afford the minimum standard of living based on social inclusion and human dignity while many are only a little better off and can barely afford food non-food costs. The broader implication is that a proportion of households in the study villages still live on the edge of possible hunger and extreme poverty. The patterns of poverty identified through this study and reasons for this include:
Underutilisation of available assets such as land due to a lack of improved agricultural technologies to open up large areas of land for agriculture
High dependency ratio in households with many members ( 7-9 and 10-12 people) and limited productive labour to produce adequate food
Low prices characterised by fluctuations of the raw commodity sold
Less developed value chains causing sale of produce in raw form thus uncompetitive market prices

Page 27
Possibly the slow recovery of some households from the impact of the previous 20 year conflict in Northern Uganda which basically wiped out the livelihood base of this district.
Given these circumstances, the implications are that households will continue to face serious difficulties in their quality of life unless some of the following suggestions are considered; 1) Enhanced access to ploughing services, improved crop seeds and agronomic practices through animal
traction, seed multiplication and sensitization on crop and animal pests and diseases respectively. 2) Formation/strengthening the effectiveness of existing community co-operatives to promote bulk
production and marketing of produce for better proceeds. 3) Development of value chains and marketing research and linkages
4) Bee keeping and kitchen gardening to diversify incomes and improve nutrition as well as fight off animals
from the game park
5) Tree planting in order to build and conserve forests against the high rate of charcoal burning in the area.