Indias Demographic Change- Opportunities and Challenges
6
DOI: 10.1126/science.1207969 , 576 (2011); 333 Science K. S. James India's Demographic Change: Opportunities and Challenges This copy is for your personal, non-commercial use only. clicking here. colleagues, clients, or customers by , you can order high-quality copies for your If you wish to distribute this article to others here. following the guidelines can be obtained by Permission to republish or repurpose articles or portions of articles ): October 28, 2013 www.sciencemag.org (this information is current as of The following resources related to this article are available online at http://www.sciencemag.org/content/333/6042/576.full.html version of this article at: including high-resolution figures, can be found in the online Updated information and services, http://www.sciencemag.org/content/333/6042/576.full.html#related-urls 1 articles hosted by HighWire Press; see: cited by This article has been http://www.sciencemag.org/cgi/collection/economics Economics subject collections: This article appears in the following registered trademark of AAAS. is a Science 2011 by the American Association for the Advancement of Science; all rights reserved. The title Copyright American Association for the Advancement of Science, 1200 New York Avenue NW, Washington, DC 20005. (print ISSN 0036-8075; online ISSN 1095-9203) is published weekly, except the last week in December, by the Science o n O c t o b e r 2 8 , 2 0 1 3 w w w . s c i e n c e m a g . o r g D o w n l o a d e d f r o m o n O c t o b e r 2 8 , 2 0 1 3 w w w . s c i e n c e m a g . o r g D o w n l o a d e d f r o m o n O c t o b e r 2 8 , 2 0 1 3 w w w . s c i e n c e m a g . o r g D o w n l o a d e d f r o m o n O c t o b e r 2 8 , 2 0 1 3 w w w . s c i e n c e m a g . o r g D o w n l o a d e d f r o m o n O c t o b e r 2 8 , 2 0 1 3 w w w . s c i e n c e m a g . o r g D o w n l o a d e d f r o m o n O c t o b e r 2 8 , 2 0 1 3 w w w . s c i e n c e m a g . o r g D o w n l o a d e d f r o m
Transcript of Indias Demographic Change- Opportunities and Challenges

8/13/2019 Indias Demographic Change- Opportunities and Challenges
http://slidepdf.com/reader/full/indias-demographic-change-opportunities-and-challenges 1/6
DOI: 10.1126/science.1207969, 576 (2011);333Science
K. S. JamesIndia's Demographic Change: Opportunities and Challenges
This copy is for your personal, non-commercial use only.
clicking here.colleagues, clients, or customers by, you can order high-quality copies for yourIf you wish to distribute this article to others
here.following the guidelines
can be obtained byPermission to republish or repurpose articles or portions of articles
): October 28, 2013 www.sciencemag.org (this information is current as of
The following resources related to this article are available online at
http://www.sciencemag.org/content/333/6042/576.full.htmlversion of this article at:
including high-resolution figures, can be found in the onlineUpdated information and services,
http://www.sciencemag.org/content/333/6042/576.full.html#related-urls1 articles hosted by HighWire Press; see:cited byThis article has been
http://www.sciencemag.org/cgi/collection/economicsEconomics
subject collections:This article appears in the following
registered trademark of AAAS.is aScience 2011 by the American Association for the Advancement of Science; all rights reserved. The title
CopyrighAmerican Association for the Advancement of Science, 1200 New York Avenue NW, Washington, DC 20005.(print ISSN 0036-8075; online ISSN 1095-9203) is published weekly, except the last week in December, by thScience

8/13/2019 Indias Demographic Change- Opportunities and Challenges
http://slidepdf.com/reader/full/indias-demographic-change-opportunities-and-challenges 2/6

8/13/2019 Indias Demographic Change- Opportunities and Challenges
http://slidepdf.com/reader/full/indias-demographic-change-opportunities-and-challenges 3/6
PFI-PRB projects that it will take place only a
decade later (5, 7 ). The life expectancy achieve-
ment, on the contrary, is more rapid according to
the PFI-PRB projection. The life expectancy of
70 years will be achieved by around 2025 accord-
ing to the PFI-PRB projection and a decade later
according to UNPD (5, 7 ). International migration
has not figured to a substantial extent in any of
these projections because the current incidence of international outmigration from India is too minor
to alter the projected final population totals.
The ultimate population size
in India will critically depend
on all the anticipated changes to
fertility, mortality, and migra-
tion.It is possible that the current
fertility transition and its future
trends may completely redefine
the ultimate size of India’s pop-
ulation. It may be remembered
that there is a high level of un-
certainty that is unavoidable in
any long-run population projec-tion. For instance, themathemat-
ical projection by Kingsley Davis
in 1951, which estimated a pop-
ulation of only 790 million for
India and Pakistan in 2001, was
obviously much off the mark (9).
Similarly, the projection by Coale
and Hoover estimated a popu-
lation of about 120million above
the 2001enumerated census pop-
ulation (10). Even with all the
uncertainty, it may be safely ar-
gued that India will overtake
China and become the most pop-ulous country in the world with-
in the next two decades. The population will
continue to grow at least until 2050, despite all the
expected changes.
India’s Demographic Transition
and Heterogeneity
It is now vividly evident that the demographic
character of India’s population is changing rap-
idly. India is now entering the final stages of
demographic transition, with the country nearing
replacement-level fertility. Of late, the demo-
graphic scenario in India has been viewed more
optimistically as compared with the widespread
anguish that was evident a few decades earlier,
with successive census figures providing hardly
any major change in the growth rate of population
(2, 3). The classical demographic transition that is
under way in India is reflected in Fig. 2, in which
the mortality rate falls while the birth rate remains
high, and later the birth rate falls as mortality
remains low. The death rate hassteadily declined in
the country since the 1920s. The country experi-
enced a negative population growth between 1911
and 1921 because of the recurrence of plague, chol-
era, and theinfluenza epidemic of 1918 – 1919 (9).
The influenza epidemic is estimated to have killed
almost 5% of the total population of the subcon-
tinent. However, thereafter except for some iso-
lated attacks of cholera in the 1920s and the Bengal
famine in the 1940s the country has been spared
serious calamities (11). There hasbeen acceleration
in the rate of decline in mortality since independence
in 1947. The crude death rate is as low as around
8 per 1000 population by 2010 – 2015 and is expectedto go up in the future because of age structure
changes. The life expectancy is expected to reach
64.4 years among males and 67.6 years among fe-
males by 2010 – 2015, up from 38.7 years for males
and 37.1 years for females in 1950 – 1955 (5).
At the same time, the infant mortality rate
(IMR) remains high in India at around 50 per
1000 live births as of 2009 (12). The rate far ex-
ceeds the IMR in China, which now stands around
22 per 1000 live births according to the United
Nations estimate (5). From an estimated level of
around 200 to 225 infant deaths per 1000 live
births at the time of India’s independence in
1947, IMR has declined to about 80 during 1990 –
1992, which is a decline of around 1.4% per year
(13). The rate of decline had been faster during
1992 – 2009 at around 3% per year. Perhaps
owing to relatively high levels of infant mortality,
the birth rate failed to respond to mortality de-
cline until about 1971. With the overall mortality
level at relatively low rates and infant mortality
remaining high, India’s disease profile shows a
double burden, with one third of the burden ac-
counted by communicable disease and the rest by
noncommunicable diseases (14).
The pace of decline in fertility has quickened
in the country in recent years. The TFR has de-
clined by roughly 1.5% per year from 6.0 in 19
to 3.6 in 1992 (13). The rate of decline quicken
further to 1.7% per year during 1992 – 2008, w
TFR reaching 2.6 births per woman by 2008 (1
It appears that with this rate of decline, India w
reach replacement-level fertility of 2.1 children
woman within a decade, which is far ahead of t
assumed year by the UNPD and PFI-PRB proj
tions (5, 7 ). TFR and net reproduction rate (NRand the corresponding IMRs for major states
India for the year2008 are shown in Fig. 3. It brin
up several important dimensio
of India’s fertility transition. Of
20 statesconsideredin theanaly
constituting nearly 98% of
population in thecountry, 11sta
with 46% of the total populat
achieved a NRR of 1.0, implyi
replacement-level fertility. Th
states with a population prop
tion of around 10% are also clo
to replacement level. India’s fer
ity transition has several speciities andis distinctly different fr
the experience of classical ferti
transition observed in many cou
tries (16 , 17 ). The decline in ferti
wasachievedprimarilythrough c
traceptive use almost solely throu
female sterilization. The avera
age at marriage, particularly of
males, remainslowat 18 years, a
more than 50% of women ma
before the legal age of 18 years
the country. Marriage is univer
andbirths takeplace primarily w
in marriage. The very low usetemporary methods of contrac
tion and early age at marriage result in wom
bearing children at very young ages and undergo
sterilization soon after. A study based on Andh
Pradesh, one of the states in India with the m
rapid decline in fertility, showed that a sizable p
portion of women in the state undergo sterilizat
before reaching 25 years of age (18).
Another strikingdemographic patternemerg
in India is its huge heterogeneity across regio
and states. The TFR in 2008 varied from as l
as 1.7 in Andhra Pradesh to 3.9 in Bihar, and
fant mortality varied from 12 per 1000 live bir
in Kerala to 70 in Uttar Pradesh (15). The fo
states in Fig. 3 to the far right, constituting 41
of India’s total population, are from the north c
tral region. These states continue to record ~2
annual growth rate of population, even during
2001 – 2011 census years. In contrast, the th
states in Fig. 3 to the far left show a TFR of 1.8
less. What is perhaps unclear is how far the f
tility level will fall in the country. The vario
projections assume that the TFR may ultimat
remain withina saferangeof 1.8 to 2.1 (5,7 ).At o
level, it is observed that even in states with ea
fertility transition there is no sign of drastic chang
-10.0
0.0
10.0
20.0
30.0
40.0
50.0
60.0
R a t e p e r 1 0 0 0 p o p u l a t i o n
Year
1 9 0 1 - 1 1
1 9 1 1 - 2 1
1 9 2 1 - 3 1
1 9 3 1 - 4 1
1 9 4 1 - 5 1
1 9 5 1 - 6 1
1 9 6 1 - 7 1
1 9 7 1 - 8 1
1 9 8 1 - 9 1
1 9 9 1 - 0 1
2 0 1 0 - 1 5
2 0 2 0 - 2 5
2 0 3 0 - 3 5
2 0 4 0 - 4 5
2 0 5 0 - 5 5
2 0 6 0 - 6 5
2 0 7 0 - 7 5
2 0 8 0 - 8 5
2 0 9 0 - 9 5
2 0 9 5 - 0 0
BR
DR
NI
Fig. 2. Birth rate (BR), death rate (DR), and natural increase (NI) (NI = BR – DR) inIndia for 1901–2100. The 1901–1971 data are census-based estimates published bythe Office of the Registrar General of India for various years. Data for 1971–2001are from Sample Registration System (SRS) Bulletins published by the Office of theRegistrar General of India. The latest data is available at (12), and 2010–2100 dataare projections according to United Nations Revision 2010 (5). The NI provides in-formation on the growth of a population in the absence of migration.
www.sciencemag.org SCIENCE VOL 333 29 JULY 2011
SPECIALSECTIO

8/13/2019 Indias Demographic Change- Opportunities and Challenges
http://slidepdf.com/reader/full/indias-demographic-change-opportunities-and-challenges 4/6
8/13/2019 Indias Demographic Change- Opportunities and Challenges
http://slidepdf.com/reader/full/indias-demographic-change-opportunities-and-challenges 5/6
The adult literacy rate is still quite
low. According to Census 2011 re-
sults, only 74% of the population
7 years and older are literate, with
a female literacy rate as low as 65%.
Because of the high illiteracy rate
and poor quality of education in the
past, a large majority of the adult
working age population are inade-quately prepared for the modern
economy. Scholars have argued that
the demographic changes are insuf-
ficient to provide an upward thrust
to the rate of economic growth be-
cause of the deficits in the area of
education and health, ultimately re-
sulting in a waste of demographic
advantage (29, 30). The employ-
ability of the vast majority of the
people with zero or negligible level
of education has been a matter of
concern, and therefore India’s demo-
graphic dividend would turn out to be a liability (30). At the same time,
studies also point out that the fer-
tility transition and the consequent
decline in dependency ratio have an
independent effect on economic
growth irrespective of the level of
education (28, 31). This is partly
because fertility transition augments
household savings and enhances the
household’s investment in quality
education for children. The evidence
in India has been highly positive with
regard to savings (31), particularly in
states with faster declines in fertility,and to some extent with the en-
hanced investment in education (23).
Third, there also exists consid-
erable unemployment and under-
employment in different parts of
the country. It is generally accepted
that if India is able to employ pro-
ductively the booming adult popula-
tion, India’s economic growth would
accelerate (27 ). Female unemploy-
ment in the state of Kerala with its
higher educational progress and de-
mographic changes has been startling
and has raised serious questions on
the ability of the nation to provide employm
opportunities to the huge adult population (3
According to the Census 2001 results, only 15
of the women in Kerala areengaged in product
work, which is one of the lowest among Ind
states. The concern has been whether India p
sesses the capacity to productively employ the
creasing adult population in order to take f
advantage of the demographic dividend.However, available statistical estimates on
impact of demographic changes on the econom
growth in India has clearly brought out that tho
states achieving fertility transition are also able
enhance their per-capita income growth subst
tially (28, 31, 34). Thus, there seems to be lack
concordance between statistical estimates a
general economic writings as far as India’s dem
graphic dividend is concerned. Perhaps, the di
dend that accelerates per-capita income grow
emanates primarily from the faster decline
fertility in the country, even with moderate edu
tional achievements. But once India is able
enhance its educational potential, improve policy environment, and provide female empl
ment, the demographic dividend opportunity c
be improved further. At the same time, it appe
that the state-level heterogeneity in demograp
dividend has large implications for the econom
inequality in the country. The available eviden
suggest an increasing trend in spatial inequal
since the 1990s (35).
Future Challenges
Not only does India’s fertility transition app
to be unconventional, it is also the result of
effective public delivery of a family planning p
gram. However, the sterilization-focused fam planning approach may not result in sudd
reversals or fluctuations in fertility because
method itself is nonreversible. However, th
may be several sociopsychological implicatio
given the fact that the age at sterilization is r
atively low and that most women remain u
employed. With the average age at marriage n
changing to any great extent, promotion of
versible methods of contraception will be
key to ensure spacing between births and healt
babies in India. Any further decline in infant m
tality depends heavily on improvements in bi
spacing. In addition, low levels of maternal n
trition and public health infrastructure lim
tions are other major reasons for higher lev
of infant mortality in the country (24, 36 ). D
from the recent survey show that across Ind
~ 43% of children under age 5 years are und
weight, and 36% of women in the age group
to 49 years had body mass index below norm
in 2005 – 2006 (24). Improvements in the rate
immunization and acceptance of maternal hea
services are also found to be slow in the last d
ade (24). At the same time, India is also exp
riencing an epidemiological transition alongs
a demographic transition. Noncommunica
0-4
10-14
20-24
30-34
40-44
50-54
60-64
70-74
80+
0-4
10-14
20-24
30-34
40-44
50-54
60-64
70-74
80+
0-4
10-14
20-24
30-34
40-44
50-54
60-64
70-74
80+
0-4
10-14
20-24
30-34
40-44
50-54
60-64
70-74
80+
Age group
Male Female
Male Female
Male Female
Male Female
A
B
C
D
Population in 000's
2000 20001000 10000 0
2000 20001000 10000 0
20000 2000010000 100000 0
15000 150005000 500010000 100000 0
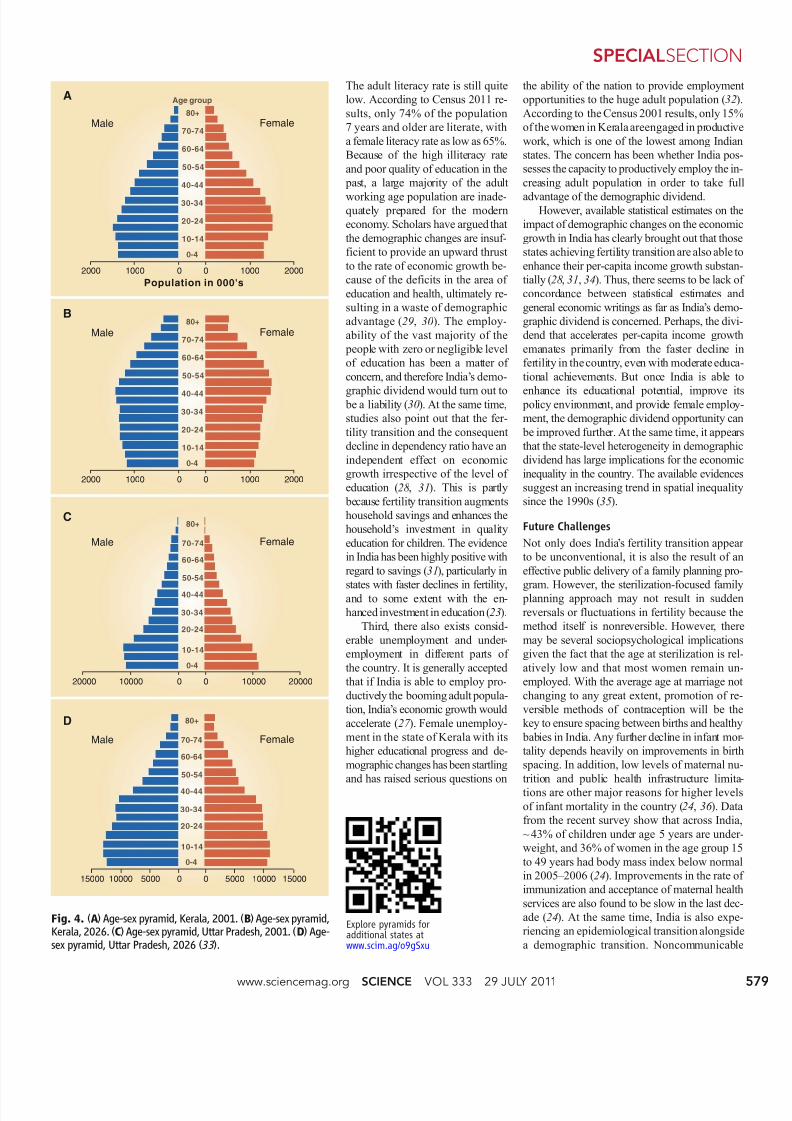
Fig. 4. (A) Age-sex pyramid, Kerala, 2001. (B) Age-sex pyramid,Kerala, 2026. (C) Age-sex pyramid, Uttar Pradesh, 2001. (D) Age-sex pyramid, Uttar Pradesh, 2026 ( 33).
Explore pyramids foradditional states atwww.scim.ag/o9gSxu
www.sciencemag.org SCIENCE VOL 333 29 JULY 2011
SPECIALSECTIO

8/13/2019 Indias Demographic Change- Opportunities and Challenges
http://slidepdf.com/reader/full/indias-demographic-change-opportunities-and-challenges 6/6