Indian telecom industry-economics
55
K J Somaiya Institute of Management Studies & Research 2012 Indian Telecom Industry Prepared By :- Ajit Kumar
-
Upload
ajit-kumar -
Category
Economy & Finance
-
view
187 -
download
1
Transcript of Indian telecom industry-economics
K J
So
mai
ya
Inst
itute
of
Man
agem
ent
Stu
die
s &
Res
earc
h
20
12
Ind
ian
Tel
ecom
In
du
stry
Prepared By :- Ajit Kumar

K J Somaiya Institute of Management Studies & Research
1
Contents
1 Historical Perspective ....................................................................................................... 3
1.1 Next Generation Network (NGN) ............................................................................ 3
1.2 Bharti- AIRTEL ......................................................................................................... 4
2 Indian Telecom Industry at Glance ................................................................................. 5
2.1 Global Position .......................................................................................................... 6
3 GOVERNMENT POLICY...................................................................................................7
To achieve these objectives seven Centre of Excellences in various field of Telecom have been set up
with the support of Government and the participation of private/public telecom operators as
sponsors, at the selected academic institutions of India. The details of COEs are enumerated below: -
..................................................................................................................................................................... 10
3.1 3G & Broadband Wireless Services (BWA) ............................................................ 11
3.2 Mobile Number Portability (MNP) ......................................................................... 11
3.3 Indian Telecom Sector: Recent Policies ................................................................. 11
3.4 Investment Policy Framework ................................................................................ 12
3.5 Competition Policy (World perspective) ................................................................ 14
Independent regulator- New Zealand experimented with non-sector specific
regulation relying on Competition Commission of the country. This led to protracted
itigations and disputes on interconnection and network access issues slowing down
the progress of the sector. Finally, New Zealand enacted ‘Telecommunication Act’ in
December 2000 and created a Telecommunication Commission within the
Competition Commission .................................................................................................. 15
3.6 Competition without privatization.......................................................................... 16
4 Components and factor responsible behind the growth of telecommunications
industry ................................................................................................................................... 17
5 Methodologies for determining telecom tariffs ............................................................ 20
5.1 INTERCONNECTION CHARGES ......................................................................... 23
Segmentation of the Indian Telecom Consumer Market ................................................... 24

K J Somaiya Institute of Management Studies & Research
2
7 Market Share of Telecom Operators in India ............................................................... 26
7.1 ARPU of Indian Telecom Operators ...................................................................... 28
8 Rival Behaviour in Indian Telecom Industry ............................................................... 30
9 Oligopoly Competition –Telecom Industry ................................................................... 31
9.1 Types of Market Structure ...................................................................................... 32
9.2 Features of Oligopoly in Indian Telecom Industry ............................................... 35
9.3 ECONOMIC INDICATORS .................................................................................... 36
10 FDI flow ....................................................................................................................... 39
10.1 Mergers & Acquisition ............................................................................................ 43
The aim behind such mergers is to attain competitive benefits in the elecommunications industry.
The mergers and acquisitions in Telecom Sector are regarded as horizontal mergers simply because
of the reason that the entities going for merger or acquisition are operating in the same industry that
is telecommunications industry. ............................................................................................................... 43
Mergers & Acquisition in Indian Telecom Industry (Last 5 years) ......................................................... 43
11 Bharti Zain Case Study ............................................................................................... 45
11.1 Airtel Before Zain Acquisition ............................................................................ 45
11.2 Zain Acquisition Details .......................................................................................... 45
11.3 Airtel’s Global Market Share Growth after Zain Acqusition ................................ 46
11.4 SWOT Analysis on Zain’s Acquisition ................................................................... 47
11.5 Change in African Market share with Airtel’s Entry ............................................ 48
11.6 Change in Zain’s Performance After Airtel’s Takeover ........................................ 49
11.7 Airtel’s Goal in Africa ............................................................................................... 51
12 Future Outlook of Indian Telecom Industry ........................................................... 52
13 References ................................................................................................................... 54
K J Somaiya Institute of Management Studies & Research
3
1 Historical Perspective
Indian Telephone Industries Limited is a state-owned manufacturer of
telecommunications equipment in India. It was founded in 1948, and today has six
manufacturing facilities which produce a range of switching, transmission, access and
subscriber premises equipment. It is headquartered at Bengalru ( Bengaluru ).
It produces GSM mobile equipment at its Mankapur and Rae Bareli Plants.These two
facilities supply more than nine million lines per annum to both domestic as well as
export markets. It also produces Information and Communication Technology (ICT)
equipment such as network management systems, encryption and networking solutions
for internet connectivity, and secure communications networks and equipment for
India's military.
In the year 1975 Department of Telecom (DoT) was responsible for telecom services in
entire country after separation from Indian Post & Telecommunication. Decade later
Mahanagar Telephone Nigam Limited (MTNL) was chipped out of DoT to run the
telecom services of Delhi and Mumbai.
In 1990s the telecom sector was opened up by the Government for private investment.
In1995 TRAI (Telecom Regulatory Authority of India) was setup. This reduced the
interference of Government in deciding tariffs and policy making. The Government of
India corporatized the operations wing of DoT in 2000 and renamed Department of
Telecom as Bharat Sanchar Nigam Limited (BSNL).
In last 10 years many private operator’s especially foreign investors successfully entered
the high potential Indian telecom market. Globally acclaimed operators like Telenor,
NTT Docomo, Vodafone, Sistema, SingTel, Maxis, Etisalat invested in India mobile
operators.
1.1 Next Generation Network (NGN)
Next Generation Networks, multiple access networks can connect customers to a core
network based on IP technology. These access networks include fiber optics or coaxial
cable networks connected to fixed locations or customers connected through Wi-Fi as
well as to 3G networks connected to mobile users.
As a result, in the future, it would be impossible to identify whether the next generation
network is a fixed or mobile network and the wireless access broadband would be used
both for fixed and mobile services. It would then be futile to differentiate between fixed

K J Somaiya Institute of Management Studies & Research
4
and mobile networks both fixed and mobile users will access services through a single
core network. Cloud based data services are expected to come.
1.2 Bharti- AIRTEL
Sunil Bharti Mittal founded the Bharti Group. In 1983, Mittal was in an agreement with
Germany's Siemens to manufacture push-button telephone models for the Indian
market. In 1986, Mittal incorporated Bharti Telecom Limited (BTL), and his company
became the first in India to offer push-button telephones, establishing the basis of
Bharti Enterprises. By the early 1990s, Sunil Mittal had also launched the country's first
fax machines and its first cordless telephones. In 1992, Mittal won a bid to build a
cellular phone network in Delhi. In 1995, Mittal incorporated the cellular operations as
Bharti Tele-Ventures and launched service in Delhi. In 1996, cellular service was
extended to Himachal Pradesh. In 1999, Bharti Enterprises acquired control of JT
Holdings, and extended cellular operations to Karnataka and Andhra Pradesh. In 2000,
Bharti acquired control of Skycell Communications, in Chennai. In 2001, the company
acquired control of Spice Cell in Calcutta. Bharti Enterprises went public in 2002, and
the company was listed on Bombay Stock Exchange and National Stock Exchange of
India. In 2003, the cellular phone operations were rebranded under the single Airtel
brand. In 2004, Bharti acquired control of Hexacom and entered Rajasthan. In 2005,
Bharti extended its network to Andaman and Nicobar. This expansion allowed it to offer
voice services all across India. In 2009, Airtel launched its first international mobile
network in Sri Lanka. In 2010, Airtel acquired the African operations of the Kuwait
based Zain Telecom.In March 2012,Airtel launched a mobile operation in Rwanda.
Today, Airtel is the largest cellular service provider in India and the third largest in the
world.
Zain Group is a mobile telecommunications company founded in 1983 in Kuwait as
MTC or Mobile Telecommunications Company, and was later rebranded to Zain in
2007. Zain has commercial presence in 8 countries across Africa and the Middle East
with about 37.6 million customers as of 31 March 2011. It employs 6000 people
From 2005 to 2010, Zain maintained a presence in a number of countries in Sub-
Saharan Africa, in addition to its core market in the MENA region.

K J Somaiya Institute of Management Studies & Research
5
2 Indian Telecom Industry at Glance
Where we stand today …
Total Telephone subscribers - 960.9 Million
Total number of GSM Subs as of August 2012 - 671.95 million
Teledensity 79.28%
Lowest call charge in the world i.e 1/2paise per second
3G launched and 4G deployment also started.
Telecommunication is one of the sectors in India which has witnessed the fundamental
and structural and institutional reforms since 1991. Consider the great potential for the
growth of telephone demand with the accelerated growth of economic activities, the
government of India announced the National telecom policy in 1999. It provided the
participation of private sector in this industry.
The entire sector is open to unrestricted competition in all. The opening of the sector
has not only led to rapid growth but also helped a great deal towards maximization of
consumer benefits. The tarrifs have been falling continuously across the board because
of healthy and unrestricted competition and India today has the lowest tariff in the
world.

K J Somaiya Institute of Management Studies & Research
6
2.1 Global Position
International Players Ranking based on Total Subscribers FY 2012
National Players Ranking based on Total Subscribers FY 2012
K J Somaiya Institute of Management Studies & Research
7
3 GOVERNMENT POLICY
Indian telecommunication sector has undergone a major process of transformation
through significant policy reforms, particularly beginning with the announcement of
NTP 1994 and was subsequently re-emphasized and carried forward under NTP 1999.
Driven by various policy initiatives, the Indian telecom sector witnessed a complete
transformation in the last decade. It has achieved a phenomenal growth during the last
few years and is poised to take a big leap in the future also.
The Indian Telecommunications network with 621 million connections (as on March
2010) is the third largest in the world. The sector is growing at a speed of 45% during
the recent years. This rapid growth is possible due to various proactive and positive
decisions of the Government and contribution of both by the public and the private
sectors
The rapid strides in the telecom sector have been facilitated by liberal policies of the
Government that provides easy market access for telecom equipment and a fair
regulatory framework for offering telecom services to the Indian consumers at
affordable prices
Liberalization
The process of liberalization in the country began in the right earnest with the
announcement of the New Economic Policy in July 1991. Telecom equipment
manufacturing was delicensed in 1991 and value added services were declared open to
the private sector in 1992, following which radio paging, cellular mobile and other value
added services were opened gradually to the private sector.
A major breakthrough was the clear enunciation of the governments intention of
liberalizing the telecom sector in the National Telecom Policy resolution of 13th May
1994
National Telecom Policy 1994
In 1994, the Government announced the National Telecom Policy which defined certain
important objectives, including availability of telephone on demand, provision of world
class services at reasonable prices, improving Indias competitiveness in global market
and promoting exports, attractive FDI and stimulating domestic investment, ensuring

K J Somaiya Institute of Management Studies & Research
8
Indias emergence as major manufacturing / export base of telecom equipment and
universal availability of basic telecom services to all villages. It also announced a series
of specific targets to be achieved by 1997.
New Telecom Policy 1999
The most important milestone and instrument of telecom reforms in India is the New
Telecom Policy 1999 (NTP 99). The New Telecom Policy, 1999 (NTP-99) was approved
on 26th March 1999, to become effective from 1st April 1999. NTP-99 laid down a clear
roadmap for future reforms, contemplating the opening up of all the segments of the
telecom sector for private sector participation
Key features of the NTP 99 include:
Strengthening of Regulator.
National long distance services opened to private operators.
International Long Distance Services opened to private sectors.
Private telecom operators licensed on a revenue sharing basis, plus a one-time entry
fee. Resolution of problems of existing operators envisaged.
Direct interconnectivity and sharing of network with other telecom operators within
the service area was permitted.
Department of Telecommunication Services (DTS) corporatised in 2000.
Spectrum Management made transparent and more efficient.
National Long Distance
National Long Distance opened for private participation. The Government announced
on 13.08.2000 the guidelines for entry of private sector in National Long Distance
Services without any restriction on the number of operators.
International Long Distance
In the field of international telephony, India had agreed under the GATS to review its
opening up in 2004. However, open competition in this sector was allowed with effect
K J Somaiya Institute of Management Studies & Research
9
from April 2002 itself. There is now no limit on the number of service providers in this
sector.
Universal Service Obligation Fund
Another major step was to set up the Universal Service Obligation Fund with effect from
April 1, 2002. An administrator was appointed for this purpose. Subsequently, the
Indian Telegraph (Amendment) Act, 2003 giving statutory status to the Universal
Service Obligation Fund (USOF) was passed by both Houses of Parliament in December
2003. The Fund is to be utilized exclusively for meeting the Universal Service
Obligation and the balance to the credit of the Fund will not lapse at the end of the
financial year. Credits to the Fund shall be through Parliamentary approvals. The Rules
for administration of the Fund known as Indian Telegraph (Amendment) Rules, 2004
were notified on 26.03.2004.
Internet Service Providers (ISPs)
Internet service was opened for private participation in 1998 with a view to encourage
growth of Internet and increase its penetration
Broadband Policy 2004
Recognizing the potential of ubiquitous Broadband service in growth of GDP and
enhancement in quality of life through societal applications including tele-education,
tele-medicine, e-governance, entertainment as well as employment generation by way of
high-speed access to information and web based communication; Government has
announced Broadband Policy in October 2004.
Tariff Changes
The Indian Telecom Sector has witnessed major changes in the tariff structure. The
Telecommunication Tariff Order (TTO) 1999, issued by regulator (TRAI), had begun the
process of tariff balancing with a view to bring them closer to the costs. This
supplemented by Calling Party Pay (CPP), reduction in ADC and the increased
competition, has resulted in a dramatic fall in the tariffs. ADC has been abolished for all
calls w.e.f. 1st October 2008.
Foreign Direct Investment (FDI)
In Basic, Cellular Mobile, Paging and Value Added Service, and Global Mobile Personal
Communications by Satellite, Composite FDI permitted is 74% (49% under automatic
route) subject to grant of license from Department of Telecommunications subject to

K J Somaiya Institute of Management Studies & Research
10
security and license conditions. (para 5.38.1 to 5.38.4 of consolidate FDI Policy circular
1/2010 of DIPP)
FDI upto 74% (49% under automatic route) is also permitted for the following: -
Radio Paging Service Internet Service Providers (ISP's)
FDI upto 100% permitted in respect of the following telecom services: -
Infrastructure Providers providing dark fibre (IP Category I); Electronic Mail; and
Voice Mail
To achieve these objectives seven Centre of Excellences in various field of Telecom have
been set up with the support of Government and the participation of private/public
telecom operators as sponsors, at the selected academic institutions of India. The details
of COEs are enumerated below: -
TCOEs Centres
Sr. No. Associate Institute
Sponsor Work Assigned
1 IIT Kharagpur Vodafone Essar &
Texas Instruments
Next Generation Network (NGN) & Network
Technology
2 IIT Delhi Bharti Airtel Telecom Technology &
Management
3
IISC (Indian
Institute of
Science), Bangalore
Aircel & Texas
instrument
Information Security &
Disaster Management of Infrastructure
4 IIT Kanpur BSNL & Alphion
Technology Integration,
Multimedia & Computational
Mathematics
5 IIT Chennai Reliance
Communication Telecom Infrastructure &
Energy
6 IIT Mumbai Tata Teleservices Rural Applications
7 IIM Ahmedabad Idea Cellular Policy, Regulation, Governance, Customer
care & Marketing

K J Somaiya Institute of Management Studies & Research
11
3.1 3G & Broadband Wireless Services (BWA)
The government has in a pioneering decision, decided to auction 3G &
BWA spectrum. The broad policy guidelines for 3G & BWA have already been
issued on 1stAugust 2008 and allotment of spectrum has been planned through
simultaneously ascending e-auction process by a specialized agency. New players
would also be able to bid thus leading to technology innovation, more
competition, faster roll out and ultimately greater choice for customers at
competitive tariffs. The 3G will allow telecom companies to offer additional value
added services such as high resolution video and multi media services in addition
to voice, fax and conventional data services with high data rate transmission
capabilities. BWA will become a predominant platform for broadband roll out
services. It is also an effective tool for undertaking social initiatives of the
Government such as e-education, telemedicine, e-health and e-Governance.
3.2 Mobile Number Portability (MNP)
Mobile Number Portability (MNP) allows subscribers to retain their existing telephone
number when they switch from one access service provider to another irrespective of
mobile technology or from one technology to another of the same or any other access
service provider. The Government has announced the guidelines for Mobile Number
Portability (MNP) Service Licence in the country on 1st August 2008 and has issued a
separate Licence for MNP service w.e.f. 20.03.2009. The Department of
Telecommunication (DoT) has already issued licences to two global companies (M/s
Syniverse Technologies Pvt. Ltd. and M/s MNP Interconnection Telecom Solutions
India Pvt. Ltd.) for implementing the service. MNP is to be implemented in whole
country in one go by 31.10.2010
3.3 Indian Telecom Sector: Recent Policies
1. All the villages shall be covered by telecom facility by the end of 2002. 2. The Communication Convergence Bill 2001introduced in the Parliament on
August 31, 2001 is presently before the Standing Committee of Parliament on Telecom and IT.
3. National Long Distance Service (NLD) is opened for unrestricted entry. 4. The International Long Distance Services (ILDS) have been opened to
competition. 5. The basic services are open to competition.

K J Somaiya Institute of Management Studies & Research
12
6. In addition to the existing three, fourth cellular operator, one each in four metros and thirteen circles, has been permitted. The cellular operators have been permitted to provide all types of mobile services including voice and non-voice messages, data services and PCOs utilizing any type of network equipment, including circuit and/or package switches that meet certain required standards.
7. Policies allowing private participation have been announced as per the New Telecom Policy (NTP), 1999 in several new services, which include Global Mobile Personal Communication by Satellite (GMPCS) Service, digital Public Mobile Radio Trunked Service (PMRTS), Voice Mail/ Audiotex/ Unified Messaging Service.
8. Wireless in Local Loop (WLL) has been introduced for providing telephone connections in urban, semi-urban and rural areas promptly.
9. Two telecom PSUs, VSNL and HTL have been disinvested. 10. Steps are being taken to fulfill Universal Service Obligation (USO), its funding
and administration. 11. A decision to permit Mobile Community Phone Service has been announced. 12. Multiple Fixed Service Providers (FSPs) licensing guidelines were announced. 13. Internet Service Providers (ISPs) have been allowed to set up International
Internet Gateways, both Satellite and Landing stations for submarine optical fiber cables.
14. Two categories of infrastructure providers have been allowed to provide end-to-end bandwidth and dark fiber, right of way, towers, duct space etc.
15. Guidelines have been issued by the Government to open up Internet telephony (IP).
3.4 Investment Policy Framework
1. Foreign Direct Investment of up to 100 percent permitted for the following:
Manufacturing of telecom equipment Internet service (not providing international gateways) Infrastructure providers (Category I) E-mail service Voice mail service Call Centers and IT enabled services
2. Foreign Direct Investment of up to 74 percent permitted for the following:
Internet service (providing international gateways) Infrastructure providers (Category II)

K J Somaiya Institute of Management Studies & Research
13
Radio paging services
3. Foreign Direct Investment of up to 49 percent permitted for the following:
National long distance service Basic telephone service Cellular mobile service Other value added service
4. Additional foreign investment through holding/investment company
5. Automatic approval for technology fee up to US$ 2 million, royalty up to 5 percent for
domestic sales and 8 percent for exports in telecom manufacturing (higher amount
through specific approvals)
6. Full repatriability of dividend income and capital invested in the telecom sector
7. Fiscal incentives and concessions for the telecom sector:
Amortization of license fee Tax holiday Rebate on subscription to shares/debentures Scope for tax exemption on financing through venture capital Import duty rates reduced for various telecom equipment

K J Somaiya Institute of Management Studies & Research
14
3.5 Competition Policy (World perspective)
Countries often differed in pattern of sequencing and the speed of liberalization.
Competition has been controlled within limit by state policy through licensing of limited
number of market players in certain segments granting thereby a period of exclusivity to
the operators. Heterogeneity of routes to sectoral reforms, as seen from the examples of
some of the Asian countries, classified into different combination of policies and
approaches to telecom reform, are presented below:
Competition in the fixed line segment with state owned incumbents: China, India and Korea.
Privatization of state owned incumbents but deferred competition through exclusivity granted to private investors: Hong Kong, Indonesia, Malaysia, Pakistan and Singapore.
Simultaneous introduction of privatization and competition: Japan and Sri Lanka.
Opening up of local market to competition first: Hong Kong, India and Singapore.
Opening up of competition in the international services first: Korea, Malaysia and the Philippines. Introduction of second domestic long distance carrier first: China
The sector ministry exercises regulatory functions: China, Indonesia, Japan, Korea, Malaysia, Taiwan and Thailand.
Separate regulator with the responsibility for interconnection lying with the
dominant operator while regulator is responsible for arbitration of disputes: Hong
Kong, Pakistan and Philippines.
In most countries, restricting the number of licensees or imposing geographic
limitations has limited competition.
In India, for instance, competition in cellular telephony was allowed in a duopoly
mode. This was gradually increased to licensing of four operators in each of the
four metros and thirteen circles. Basic service in India is still limited to one
private operator competing with state owned incumbents in the circles. Though
private sector has been licensed and they are laying infrastructure, metros are
still in the grip of public sector monopoly and it will take a while before private
competition takes place.

K J Somaiya Institute of Management Studies & Research
15
Differences in modes of privatization have been observed in other countries. In
Thailand, private entry was allowed through Build Operate and Transfer (BOT)
mode while the network was controlled by the state. In Vietnam, network was
publicly managed with foreign operators participating in provision of training,
equipment and supervision through Business Cooperation Contracts (BCCs).
China did not allow private entry in the telecom sector and limited competition
between state-owned entities of the ministries. Many countries in Asia restricted
foreign equity participation. For example, China, India, Indonesia, Korea,
Malaysia, the Philippines and Thailand limited foreign equity below fifty per cent
Independent regulator- New Zealand experimented with non-sector specific
regulation relying on Competition Commission of the country. This led to
protracted itigations and disputes on interconnection and network access issues
slowing down the progress of the sector. Finally, New Zealand enacted
‘Telecommunication Act’ in December 2000 and created a Telecommunication
Commission within the Competition Commission

K J Somaiya Institute of Management Studies & Research
16
3.6 Competition without privatization
Interestingly, there are other models of competition without privatization. China
Telecom, one of the world’s major Public Telecommunication Operators (PTOs) is still
fully state-owned. Both China and Vietnam followed similar policies of competition
without privatization. Competition has been allowed between ministries of the
governments. Participation of foreign investors has been allowed through joint ventures.
Both these countries have been very high achievers in terms of progress of telecom
sector. ‘The key underlying factor is the will of the state to invest in, and prioritize,
telecommunication development

K J Somaiya Institute of Management Studies & Research
17
4 Components and factor responsible behind the growth of
telecommunications industry
Two major factors responsible for the growth of telecommunications industry are use of
modern technology and market competition. One of the products of modern
technologies is optical fibers, which are being used as a medium of data transmission
instead of using coaxial or twisted pair cables. Optical fibers can carry a high volume of
data and are easier to maintain and install. Use of communication satellites make this
telecommunications industry a booming industry.
The use of mobile network has a crucial role behind the growth of an improved
telecommunications industry. Leading companies are showing their interest to invest in
this telecommunications industry.
Telecommunications industry is going to be a digitized one. Use of ISDN (Inter Services
Digital Network) makes this telecommunication industry a total digitalized system and
eventually enhanced the speed and quality of digital communication.
The introduction of these advanced technologies makes the telecommunications
industry a competitive one, where a number of multinational companies have shown
their interest to invest in this industry and consequently the prices are reduced, the
quality is also improved. During the period of 1990, the telecommunication industry
showed a speedy growth in terms of investment and eventually increased the
competition. The competition between the companies led to the decline of revenues.
Four key industry drivers - competition, customers, deregulation and technology advances - are forcing telecommunications companies to reorganise around customers, expand markets and upgrade infrastructure.
We recognise these challenges and focus on solutions for both service providers and equipment manufacturers.

K J Somaiya Institute of Management Studies & Research
18
Investment prospects
The mobile subscribers in India are growing at a pace of over 15 million every month. As
a result, the telecom sector is likely to witness huge investments of around US$ 112.6
billion in the 12th five year plan (2012-17), according to the Department of Telecom.
The 3rd Generation Partnership Project (3GPP) was formed in 1998 to foster
deployment of 3G networks that descended from GSM. 3GPP technologies evolved as
follows.
• General Packet Radio Service (GPRS) offered speeds up to 114 Kbps.
• Enhanced Data Rates for Global Evolution (EDGE) reached up to 384 Kbps.
• UMTS Wideband CDMA (WCDMA) offered downlink speeds up to 1.92 Mbps.
• High Speed Downlink Packet Access (HSDPA) boosted the downlink to 14Mbps.
• LTE Evolved UMTS Terrestrial Radio Access (E-UTRA) is aiming for 100 Mbps.
GPRS deployments began in 2000, followed by EDGE in 2003. While these technologies
are defined by IMT-2000, they are sometimes called "2.5G" because they did not offer
multi-megabit data rates. EDGE has now been superceded by HSDPA (and its uplink
partner HSUPA). According to the 3GPP, there were 166 HSDPA networks in 75
countries at the end of 2007. The next step for GSM operators: LTE E-UTRA, based on
specifications completed in late 2008.
A second organization, the 3rd Generation Partnership Project 2 (3GPP2) -- was formed
to help North American and Asian operators using CDMA2000 transition to 3G. 3GPP2
technologies evolved as follows.
• One Times Radio Transmission Technology (1xRTT) offered speeds up to 144 Kbps.
• Evolution Data Optimized (EV-DO) increased downlink speeds up to 2.4 Mbps.
• EV-DO Rev. A boosted downlink peak speed to 3.1 Mbps and reduced latency.
• EV-DO Rev. B can use 2 to 15 channels, with each downlink peaking at 4.9 Mbps.
• Ultra Mobile Broadband (UMB) was slated to reach 288 Mbps on the downlink.

K J Somaiya Institute of Management Studies & Research
19
1xRTT became available in 2002, followed by commercial EV-DO Rev. 0 in 2004. Here
again, 1xRTT is referred to as "2.5G" because it served as a transitional step to EV-DO.
EV-DO standards were extended twice – Revision A services emerged in 2006 and are
now being succeeded by products that use Revision B to increase data rates by
transmitting over multiple channels. The 3GPP2's next-generation technology, UMB,
may not catch on, as many CDMA operators are now planning to evolve to LTE instead.
In fact, LTE and UMB are often called 4G (fourth generation) technologies because they
increase downlink speeds an order of magnitude. This label is a bit premature because
what constitutes "4G" has not yet been standardized. The ITU is currently considering
candidate technologies for inclusion in the 4G IMT-Advanced standard, including LTE,
UMB, and WiMAX II. Goals for 4G include data rates of least 100 Mbps, use of OFDMA
transmission, and packet-switched delivery of IP-based voice, data, and streaming
multimedia.

K J Somaiya Institute of Management Studies & Research
20
5 Methodologies for determining telecom tariffs
Earlier, regulators focused on providing telecom operators with a specified rate of return which ensured financial viability while keeping the price low for consumers. Experience showed that this methodology requires considerable information and gives rise to perverse incentives, leading to inefficient operation and investment.
More recently, due mainly to increasing competition in the sector, the focus has been on prices which encourage dynamic elements such as efficiency, innovation and flexibility.
Prices can be based on costs or demand, and could be specified in terms of a particular level or with some flexibility for the operator to decide the price level. An increasing trend in certain countries has been to exclude services from price regulation if there is adequate competition in their markets. Enhanced competition has also led to tariff restructuring in several countries to alter the previously prevailing pattern of cross-subsidizing local calls and rentals through relatively high prices for long distance and international calls. This restructuring has basically meant that prices are getting more cost-oriented. Such cost-orientation of prices can arise either through the determination of a price level based on costs, or through a flexible process such as under a price cap methodology (see below).
a) Prices based on costs
Short run marginal (or variable) costs, long-run incremental costs (which include investment costs), and fully-allocated costs have been considered for specifying prices based on costs. All cost-based pricing requires considerable information and monitoring, and a number of conceptual and practical problems arise in properly measuring and assigning costs to the various telecom services.
Prices based on short-run marginal costs and long-run incremental costs promote efficient production. However, the revenue derived on the basis of these two cost-concepts does not cover total costs because they do not account for all the costs that are incurred by a telecom operator. In contrast, fully-allocated costs cover all costs. Despite this, there is increasing emphasis on using long-run incremental costs for cost-based pricing because they promote efficiency, while fully-allocated costs foster inefficiency. Long-run incremental costs cover a greater portion of total costs than marginal costs, and incorporate dynamic elements such as technical change and economies of scale.
Different variants of long-run incremental costs can be calculated depending on the level of output, time period and technologies used. A wide coverage is provided by total service long-run incremental costs (TSLRIC), which basically shows the cost the firm would avoid in the long run if it stopped providing a particular service.

K J Somaiya Institute of Management Studies & Research
21
b) Mark-up
A mark-up is required to cover the deficit that would arise if an efficient cost-based price were determined. Different methods for ascertaining the mark-up include: mark-up varying inversely with elasticity of demand of different users or services (Ramsey rule); applying a rule-of-thumb, such as a risk-adjusted reasonable commercial return; and applying different price slabs to different units of usage, or obtaining the requisite revenue through rentals. The rule-of-thumb is the most straight-forward of the mark-up methodologies. Since demand is not easy to estimate, Ramsey rule provides at best a rough guide on the nature of the mark-up.
c) Subsidized pricing
Subsidies to price are given normally for achieving social objectives such as promoting the provision of universal service in telecom or providing preferential telecom access to specific users such as hospitals or those living in remote areas. The subsidy could be given, for example, in terms of access charges, rentals or price of the calls made.
With greater competition and pressure for changing the prevailing pattern of cross-subsidization, there is a great need to improve the transparency of the extent and nature of the subsidies being provided. This requires greater transparency of costs and revenues, and an unbundling of the services being provided. With such information, the policy-maker would have a better basis to consider alternative policies to fund the subsidies.
d) Demand-based pricing
Under this methodology, prices reflect willingness to pay for the use of a product, or the value given to a particular product. These prices are shown by the demand curve. In assessing the social value from a demand-price, it would be necessary to specify the social value of consumption of the service by different customer groups. Demand-based prices are not easy to determine on account of the difficulty of determining the demand curve.
e) Flexibility
With increasing complexity of emerging telecom products, difficulty of monitoring and ascertaining costs of production, and the market providing price discipline as the level of competition increases, telecom regulators are increasingly relying on flexible pricing methodologies. This is done either by providing a range within which prices can be fixed by the operators, or by not extending price regulation to certain products (normally products with competitive markets or those that are not considered essential).
K J Somaiya Institute of Management Studies & Research
22
A flexible price range is usually provided under a price cap methodology, which imposes an upper limit on the average price increase for a basket of telecom services. This increase is specified under a formula which usually incorporates a need to decrease prices due to a rise in productivity. For certain specific services, sub-baskets are devised with conditions different from the overall basket. The price cap methodology provides considerable flexibility to take account of various policy objectives, including equity and efficiency of operation.
Price floors and ceilings have also been used for providing flexibility, and to limit an operator from abusing its dominant market position.
Price flexibility is also achieved through different price options provided for alternative combinations (or volume) of services that are purchased by customers. These include, for example, options providing combinations of a high rental and low usage charge or a low rental and a high usage charge, or volume discounts.
f) Conclusions from the discussion on pricing methodologies
To begin with, a regulator needs to determine which services should be subject to price control and which should be left outside the purview of such control. The next step is to consider what type of regulation should apply to the various telecom services subject to price regulation. For instance, should different types of control be used, with certain services (such as essential services) being subject to closer price scrutiny and control (including a specific price level being determined for them), and prices of other services being controlled only broadly through price floors and ceilings. Alternatively, should only a price cap mechanism be used for regulating prices, or should such a mechanism supplement the other forms of price control in order to infuse some simulated competitive pressure on prices.
Even for those services which are not subject to any price regulation, mechanisms are available to deal with situations of unfair competition. An effective functioning of these mechanisms requires unbundling of the various services. Furthermore, unbundling, together with better account-keeping, enhances the transparency of revenue and costs linked to different services. Detailed account-keeping is also an important requirement if prices based on costs were to be used.
Another benefit of more detailed account-keeping is to improve the transparency of subsidies given for social reasons, thus providing a better basis for policy-formulation in this regard.
There are a number of methods to fund the deficit that arises due to expenditures for meeting social objectives. These include increasing the telecom tariffs or rentals, creating a fund financed by the license fee obtained from the telecom sector, or by revenue obtained through a levy or a tax. If a levy were impose on the telecom operators

K J Somaiya Institute of Management Studies & Research
23
for financing this fund, then the price of certain telecom services might need to be increased to accommodate this "additional cost".
5.1 INTERCONNECTION CHARGES
Interconnection involves a linking up of one telecom operator to the infrastructure facilities of another. Interconnection charges include charges for collecting and delivering calls, for installing, maintaining and operating the points of interconnect, payment for supplementary services, and for ancillary and other facilities (such as space in the equipment room). In many instances, a charge is levied for funding the expenditure due to universal service obligations.
Basically interconnection charges are paid either through sharing of revenues among the interconnected operators, or on the basis of the cost of the interconnection service provided (plus a reasonable profit). The latter approach is more widely used.
Procedures Used for Setting Interconnection Charges
The procedures used to establish interconnection charges include,
the regulator determines the charges, together with other essential elements of interconnection, in advance;
the regulator sets the standard or guidelines which should be used for establishing the rates through (bilateral or multilateral) negotiations among the operators themselves;
the operators set the rates through commercial agreement, without the involvement of the regulators;
In the negotiations between the operators, the regulators stand-by as mediators/arbiters, settling the interconnection charges in case the parties involved fail to agree or if a dispute is brought to the regulator.
In most countries, regulators encourage the operators to settle interconnection rates through negotiations. To assist this process, the regulators normally establish guidelines or a framework which they consider desirable for determining interconnection charges.

K J Somaiya Institute of Management Studies & Research
24
Segmentation of the Indian Telecom Consumer Market
With the proliferation of mobile phone users, several micro segments have also emerged lately, each with their own specific needs. The Indian Mobile consumer market has been segmented as follows:. The different segments are explained as follows:
Youth Over the years, service providers have started giving greater attention to this segment, as it has emerged as one of the biggest users of mobile phones. For the youth, mobile phones are not just a necessity, but rather an indispensable accessory. This segment particularly values prepaid schemes with free SMS services. It is further differentiated into various micro-segments based on age and gender. For instance, youngsters in the age group of 19 to 23 years generally have a large circle of friends and more access to money. Companies thus focus on providing services like group talk and group SMS to these people. This segment is very dynamic as its needs keep changing very frequently, driven by the latest trends and fads. For instance, downloading new ring-tones is the latest fad among the youth today. This is a huge revenue source for service providers and so they need to keep up with the changing tastes of this segment.
Young Professionals People entering the workforce and thus moving out of the dependent bracket constitute this market segment. They generally prefer using post paid schemes with value added services like information about stock markets, news updates and so on.
Small and Medium Enterprise This segment mainly consists of people who are switching over from landlines to mobile phones, seeking a cost advantage. The focus here is on economy-packages rather than value added services.
Family Family as a segment consists of more number of dependents. These dependants are serviced by prepaid schemes. Geographically dispersed families tied by the same cellular service providers may get cost advantages in terms of lower pulse rates.
Special

K J Somaiya Institute of Management Studies & Research
25
The ‘Special’ category includes a small but growing segment which requires largely customized services sought by celebrities, politicians, CEOs and the super-rich. Tailor made schemes for each segment have been a great success so far. This customization, however, has reached such a stage that every service provider has numerous schemes being provided at the same time. Being short term schemes, they keep changing frequently and customers thus start switching from one service provider to another based on the attractiveness of the scheme. This has brought down customer loyalty and hence service providers are finding it difficult to retain existing customers. It is estimated that in the near future the plethora of schemes provided by the different service providers will stop being a differentiating factor.

K J Somaiya Institute of Management Studies & Research
26
7 Market Share of Telecom Operators in India

K J Somaiya Institute of Management Studies & Research
27
The Cellular Operators Association of India (COAI), in its figures for August 2012 for all of India, revealed that the total GSM subscriber base in the country now stands at 671.95 million. In its report, the COAI further notes that this total subscriber base figure had been arrived at as GSM operators in the country, including Bharti Airtel, Vodafone and Idea Cellular put together lost more than 7.10 million subscribers. Most GSM subscribers, i.e., 0.79 million were added in the review period by Aircel. Chennai saw most GSM subscriptions, i.e., 1,07,131 being added in the review period. Bharti Airtel, Vodafone and Idea Cellular, put together account for roughly 68 percent of the GSM market and in the review period, they lost over 5.10 million users. Bharti Airtel has a 27.82 percent market share, and in the review period, lost 1.90 million users making its subscriber base fall to 186.9 million. Going further, the report found that Idea Cellular and Vodafone, two other popular players in the market lost 1.64 million users and 1.55 million users, respectively. With this, Idea Cellular's subscriber base stood at 115.97 million, while that of Vodafone was at 153.35 million at the end of August 2012. As per the figures, Aircel and Loop Mobile emerged as the only operators to have witnessed growth in the review period. While Aircel added 793,717 new users, Loop Mobile added 79,842 new subscribers in August 2012. Uninor, on the other hand, as per the figures in the report saw the sharpest decline of 2.38 million users, and its subscriber base now stands at 42.11 million at the end of August 2012.

K J Somaiya Institute of Management Studies & Research
28
7.1 ARPU of Indian Telecom Operators
Average revenue per user (sometimes average revenue per unit) usually abbreviated to ARPU is a measure used primarily by consumer communications and networking companies, defined as the total revenue divided by the number of subscribers.
This term is used by companies that offer subscription services to clients for example, telephone carriers, Internet service providers, and hosts. It is a measure of the revenue generated by one customer phone,pager, etc., per unit time, typically per year or month. In mobile telephony, ARPU includes not only the revenues billed to the customer each month for usage, but also the revenue generated from incoming calls, payable within the regulatory interconnection regime.
This provides the company a granular view at a per user or unit basis and allows it to track revenue sources and growth.
There is a trend by telecommunications and Internet companies and their suppliers to sell extra services to users and a lot of the promotion that is used by these companies talks of increased ARPU for these operators. It typically manifests in the form of value-added services such as entertainment being sold to customers especially in markets where the primary service offered to the customer, such as the telephony or Internet service, is sold at a commodity rate.
Method of Calculation: To calculate the ARPU, a standard time period must be defined. Most telecommunications carriers operate by the month. The total revenue generated by all units (paying subscribers or communications devices) during that period is determined. Then that figure is divided by the number of units. Because the number of units can vary from day to day, the average number of units must be calculated or estimated for a given month to obtain the most accurate possible ARPU figure for that month.
Also related is ARPPU (Average Revenue Per Paying User) which is calculated by dividing up the revenue amongst the users who paid anything at all. This yields a figure that is significantly larger than ARPU. For example in the case of a subscription game (that has a free play version), the ARPPU, measured by accounts, is the subscription price, diluted slightly by free trials.

K J Somaiya Institute of Management Studies & Research
29

K J Somaiya Institute of Management Studies & Research
30
8 Rival Behaviour in Indian Telecom Industry
India as a country is divided into 23 cellular circles. In total there are around 9 telecom operators. In 2009 new telecom operators entered into the market which led to the price war in the telecom industry in India. This price war dropped the prices to minimum of 1 paise per second which made mobile tarrifs cheapest in the world.
There are various effects of the price war on the Indian telecom industry.
Revenue growth has got impacted significantly The break- even point for new operators has increased significantly. Supply constraints come into picture.
With decline in prices the consumer base has increased to unsustainable levels.

K J Somaiya Institute of Management Studies & Research
31
9 Oligopoly Competition –Telecom Industry

K J Somaiya Institute of Management Studies & Research
32
9.1 Types of Market Structure
Monopoly Oligopoly Monopolistic
Competition
Perfect
Competition
Number of Firms
Types of Products Many firms
Identical Products
Differentiated Products One Firm Few Firms

K J Somaiya Institute of Management Studies & Research
33
Oligopolistic Market Structure of Indian Telecom Industry
Indian Telecommunication industry, with about 929.37 million phone
connections (June 2012), is the third largest telecommunication network in the world
and the second largest in terms of number of wireless connections. For the past decade
or so, telecommunication activities have gained momentum in India. The Indian
Telecommunication Market has been dominated by few major players, and hence it is a
perfect case of Oligopoly
Oligopoly refers to a market structure where an industry is dominated by a small
number of large sellers. Because there are few participants in this type of market, each
oligopolistic is aware of the actions of the others. The decisions of one firm influence,
and are influenced by, the decisions of other firms.Oligopoly is a common market
form.As a quantitative description of oligopoly, four-firm concentration ratio is often
utilized. This measure expresses the market share of the four largest firm in an industry
as a percentage.Oligopolistic competition can give rise to a wide range of different
outcomes. In some situations the firms may employ restrictive trade practices(collusion,
market sharing etc)to raise prices and restrict production in much the same way as a

K J Somaiya Institute of Management Studies & Research
34
monopoly. Where there is a formal agreement for such collusion, this is known as a
cartel.
Main Assumptions of Oligopolistic Competition:
Profit maximization conditions: An oligopoly maximizes profit by producing
where marginal revenue equals marginal costs.
Ability to set price: Oligopolies are price setters rather than price takers.
Entry and exit: Barriers to entry are high.The most important barriers are
economies of scale, patents, access to expensive and complex technology, and
strategic actions by incumbent firms designed to discourage or destroy nascent
firms.
Number of firms: ”Few” –a handful of sellers. There are so few firms that the
actions of one firm can influence the actions of other firms.
Long run profits: Oligopolies can retain long run abnormal profits. High barriers
of entry prevent sideline firms from entering market to capture excess profits
Product differentiation: Product may be homogeneous or differentiated.
Perfect knowledge: Oligopolies have perfect knowledge of their own cost and
demand functions but their inter-firm information may be incomplete.
Interdependence: The distinctive feature of an oligopoly is interdependence.
Classification of Indian Oligopolistic Telecom Market
On the basis of product differentiation
Airtel- Main concentration on youth
Vodafone-Business people and youth
Reliance-target lower class people by providing cell phone in 500 Rs
On the basis of entry of firms

K J Somaiya Institute of Management Studies & Research
35
To enter into mobile service market in India you need to get license from
DOT there are lot of restrictions from TRAI(Telephone Regulatory
Authority of India)
On the basis of presence of or absence of price leadership
Absence of price leadership in mobile service providers in India
On the basis of deliberate agreement
There is no deliberate agreement between any companies. Plans &tariffs
are almost same of all companies but they are not into any deliberate
agreement.
9.2 Features of Oligopoly in Indian Telecom Industry
Competition among few
There are just few sellers under oligopoly. The number could be
more than one but not very many.
`
Interdependence among rivals firm
`Airtel life time free plan
Reliance incoming free plan
Possibility of collusion
But in case of mobile service provider in India they are not following any
uniform price so this feature is not applicable
Rigidity in pricing
`
Airtel government employee card 10 paisa per minute to attract
Government employee
Also Tata Docomos & others companies plans of pay per second
Barriers to entry
License from (DOT) & Rules & regulation from TRAI
K J Somaiya Institute of Management Studies & Research
36
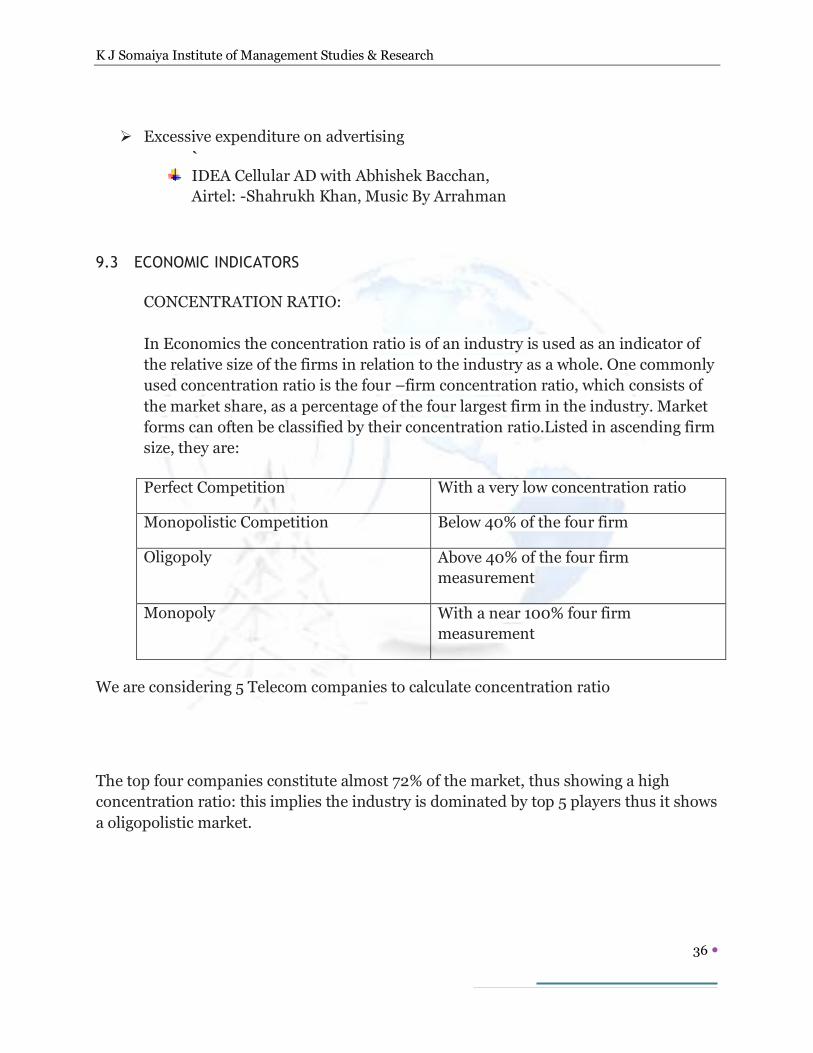
Excessive expenditure on advertising
`
IDEA Cellular AD with Abhishek Bacchan,
Airtel: -Shahrukh Khan, Music By Arrahman
9.3 ECONOMIC INDICATORS
CONCENTRATION RATIO:
In Economics the concentration ratio is of an industry is used as an indicator of
the relative size of the firms in relation to the industry as a whole. One commonly
used concentration ratio is the four –firm concentration ratio, which consists of
the market share, as a percentage of the four largest firm in the industry. Market
forms can often be classified by their concentration ratio.Listed in ascending firm
size, they are:
Perfect Competition With a very low concentration ratio
Monopolistic Competition Below 40% of the four firm
Oligopoly Above 40% of the four firm
measurement
Monopoly With a near 100% four firm
measurement
We are considering 5 Telecom companies to calculate concentration ratio
The top four companies constitute almost 72% of the market, thus showing a high
concentration ratio: this implies the industry is dominated by top 5 players thus it shows
a oligopolistic market.

K J Somaiya Institute of Management Studies & Research
37
Kinked Demand Curve Model introduced by Paul Sweezy in 1939 was an attempt to
explain the price rigidity in Oligopolistic Model.
If an Oligopolistic raised its price, it would lose most of its customers because
other firms in the industry would not follow by raising their prices.
If on the other hand an Oligopolistic cannot increase its market share by lowering
its prices because, competitors would quickly match price cuts.
Thus Oligopolistic face a demand curve that has a kink at the prevailing prices
The demand curve is highly elastic for price increases but less elastic for price
cuts.
Cournot
Model
Kinked
Demand Curve
Model
Cartel
Arrangements
Price Leadership
Model
Oligopoly Models

K J Somaiya Institute of Management Studies & Research
38
Conclusion
The presence of competition on the other hand, helps in preventing oligopoly
from market failure. Although the power to operate is only distributed to a few
oligopolists, the competition factor encourages them to produce quality goods
and services.
This also drives them to become innovative and customer-oriented.
In turn, the presence of both monopolistic and competitive features in oligopoly
creates a balanced system, making it an ideal market structure
K J Somaiya Institute of Management Studies & Research
39
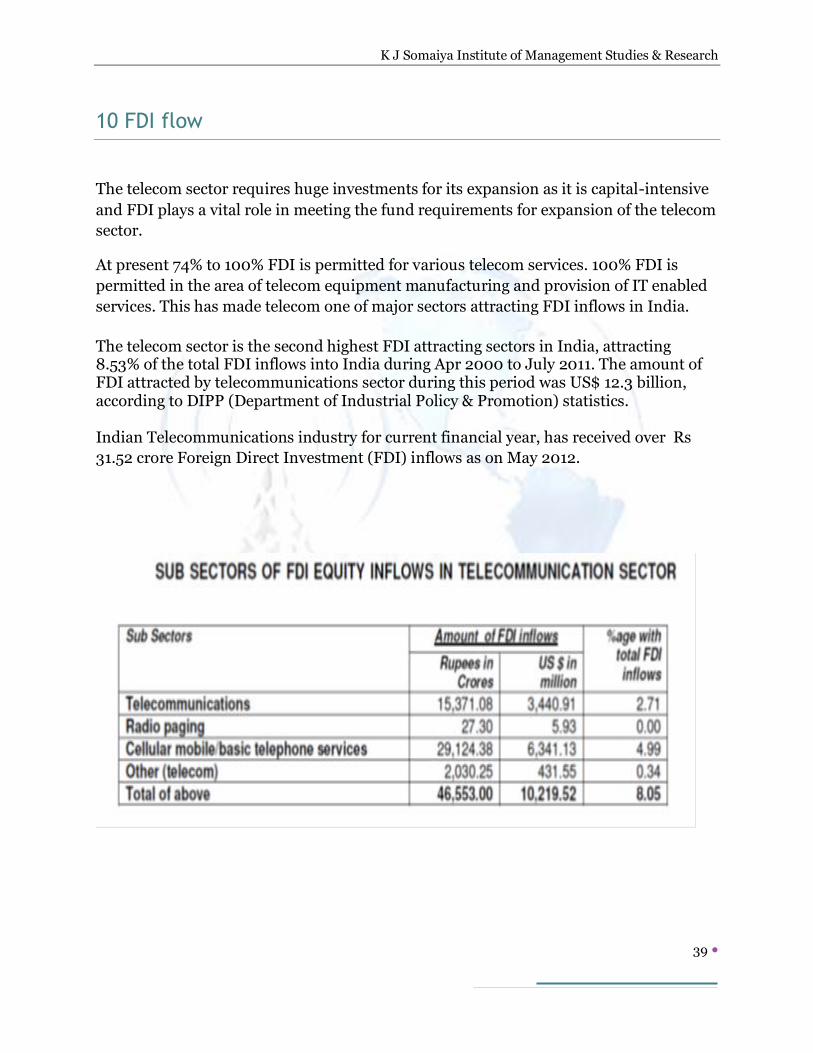
10 FDI flow
The telecom sector requires huge investments for its expansion as it is capital-intensive
and FDI plays a vital role in meeting the fund requirements for expansion of the telecom
sector.
At present 74% to 100% FDI is permitted for various telecom services. 100% FDI is
permitted in the area of telecom equipment manufacturing and provision of IT enabled
services. This has made telecom one of major sectors attracting FDI inflows in India.
The telecom sector is the second highest FDI attracting sectors in India, attracting 8.53% of the total FDI inflows into India during Apr 2000 to July 2011. The amount of FDI attracted by telecommunications sector during this period was US$ 12.3 billion, according to DIPP (Department of Industrial Policy & Promotion) statistics.
Indian Telecommunications industry for current financial year, has received over Rs
31.52 crore Foreign Direct Investment (FDI) inflows as on May 2012.

K J Somaiya Institute of Management Studies & Research
40

K J Somaiya Institute of Management Studies & Research
41

K J Somaiya Institute of Management Studies & Research
42
Details of Top 10 FDI inflows received in Telecommunication
sector:
FDI inflow year wise:
Sl No Year (Apr-Mar) in Rs. crore in US$ million
1 2000-01 784.16 177.69
2 2001-02 3,938.46 873.23
3 2002-03 907.73 191.6
4 2003-04 408.78 88.87
5 2004-05 569.54 124.53
6 2005-06 2,774.18 623.16
7 2006-07 2,155.08 477.74
8 2007-08 5,102.61 1,261.46
9 2008-09 11,726.87 2,558.39

K J Somaiya Institute of Management Studies & Research
43
10 2009-10 12,338.32 2,553.95
11 2010-11 (Apr-Aug) 4,789.22 1,054.39
10.1 Mergers & Acquisition
The aim behind such mergers is to attain competitive benefits in the elecommunications industry. The mergers and acquisitions in Telecom Sector are regarded as horizontal mergers simply because of the reason that the entities going for merger or acquisition are operating in the same industry that is telecommunications industry.
Mergers & Acquisition in Indian Telecom Industry (Last 5 years)
1. Bharti- Zain Merger India’s biggest telecom company by both revenues and subscribers, Bharti Airtel Ltd, on 30 march 2010 announced a deal with Kuwait-based Zain Group for the acquisition of the latter’s African operations.The total worth of the deal is $10.7 billion (Rs48,043 crore), Bharti will acquire Zain’s mobile services operations in 15 countries with a combined strength of 42 million customers. The deal includes a $9 billion cash component. This is the third attempt by Bharti Airtel to enter the African market, after two failed bids earlier to acquire MTN Group Ltd of South Africa. After this deal Bharti has entered into the league of the top five telecom operators in the world with more than 180 million subscriber base spread across 18 countries. 2.RCOM-GTL Merger-
In june 2010 The flagship company of the Anil Ambani group, Reliance Communications Ltd (RCom),combine its telecom towers business with GTL Infrastructure Ltd in a deal that will create a transmission network valued at Rs50,000 crore. 3.Reliance -Infotel Merger-
Reliance Industries has bought 95% stake in Infotel Broadband Services for Rs.4,800 Cr. Infotel will issue fresh equity shares to RIL.Recently Infotel Broadband Services has won pan India Broadband Wireless Access spectrum license for 22 circles for around Rs 12,848 crore ($2.7 billion).
4.Telenor -Unitech Merger

K J Somaiya Institute of Management Studies & Research
44
Telenor-Norwegian telecom operator completed the acquisition of 49% stake in Unitech Wireless Ltd, the telecom arm of the realty firm, Unitech Ltd, by infusing additional investment of Rs. 1,130 crore for an additional 15.5%. Telenor had earlier invested Rs. 1,250 crore in the telco for a 33.5%.
5.Swan Telecom - Etisalat Merger- Emirates Telecommunications Corporation (Etisalat), largest operator in the Arab world, on 23 sep 2008 announced it has signed a deal to acquire 45 per cent stake in recently-licensed Indian telecom firm Swan Telecom Private Limited (Swan Telecom) for $900 million. 6.Bahrain Telecom -S Tel Merger- Gulf-based Bahrain Telecommunications Co bought 49% stake in Indian mobile operator S Tel Ltd for $225 million. S Tel has licenses to operate in 6 Indian states - Bihar, Orissa, Jammu & Kashmir, Himachal Pradesh, North East and Assam. Maxis Communications and Aircel Merger- Maxis Communications acquired a 74-per cent stake in Aircel Cellular Ltd, One of the country’s leading GSM telecom player, which operates in 10 telecom circles in India,in a deal of US$ 1.08 billion. 7.Vodafone - Hutch Merger - In year 2007 Vodafone bought a controlling stake in Hutch-Essar from Hutchison Telecommunications International Limited (HTIL) for $10.9 billion.
8.Telekom Malasia - Spice Communication Merger - Telekom Malaysia acquired a 49-per cent stake in Spice Communications for US$ 179 million.
Following are the benefits provided by the mergers and acquisitions in the telecommunications industry:
Building of infrastructure in a more convenient way
Licensing options for mergers and acquisitions are often found to be easier
Mergers and acquisitions offer extensive networking advantages
Brand value
Bigger client base
Wide array of products and services

K J Somaiya Institute of Management Studies & Research
45
11 Bharti Zain Case Study
11.1 Airtel Before Zain Acquisition
• Bharti Airtel was India’s largest telecom company by subscriber base, which
stood around 150 million at the end of 2009, and total revenues, which
were Rs 373 billion.
• Globally, Bharti Airtel was the 3rd largest in-country mobile operator by
subscriber base, behind China Mobile and China Unicom. In India, the company
had a 24.6% share of the wireless services market, followed by 17.7% for Reliance
Communications and 17.4% for Vodafone Essar.
• Bharti Airtel was one of India's fastest growing companies, going from 7 million
customers in 2004 to 96.6 million customers in 2009.
11.2 Zain Acquisition Details
Acquirer Bharati Airtel
Seller Kuwait based Zain telecom
Acquiring area Africa 15 countries excluding Sudan and Morroco
Date of
acquisition
8th June 2010
Amount Paid $10.7 billion
Payment
details
$7.9 billion paid initially, balance paid after
completion of some formalities
Funding Bharati Airtel to borrow USD 7.5 billion
from consortium of banks led by Standard

K J Somaiya Institute of Management Studies & Research
46
Charted and Barclays.
Availing $1billion loan from state Bank of
India
11.3 Airtel’s Global Market Share Growth after Zain Acqusition
Rank No., of Subscribers
(million in FY 2010)
1.China mobile 594.2
2.Vodafone 338.9
3.America Movil 224.4
4.Telefonica 216.9
5.Bharati Airtel 199.2
Rank No. of subscribers
(million, FY 2012)

K J Somaiya Institute of Management Studies & Research
47
1. China mobile 667.20
2. Vodafone 439.60
3. Airtel 261.000
4. America Movil 236
5. Telephonica 231.87
11.4 SWOT Analysis on Zain’s Acquisition
STRENGHS:
Airtel became 5th largest service provider in world
Addition of 42 million subscribers and increase in total revenue
Less competition in Africa with more scope of development
Strategic alliance with Nokia, Singtel and Sony Ericson
WEAKNESS:
Bharati has paid a huge amount for the deal as high as 7 times the revenue of the Zain
then
Zain Africa has made a net loss of USD 112 million in the nine months to September
2009. Seven of Zain African units are loss-making, including its highest revenue earner,
the Nigerian arm, Zain Nigeria
Huge commercial risk
The loan would be a drag on Bharti Airtel's earnings with no immediate returns
expected from the loss-making target.
K J Somaiya Institute of Management Studies & Research
48
OPPORTUNITY:
High potential growth in terms of users and usage
Availability of more spectrum compared to India
Telecom penetration is only 40%
Simple regulatory environment.
Can experiment same model as in India
ARPU is higher compared to India
THREATS:
Complex geography
Under developed ecosystem
Low Level of Infrastructure
Protected economies
Work culture
Unstabilized Political condition
11.5 Change in African Market share with Airtel’s Entry

K J Somaiya Institute of Management Studies & Research
49
(millions
subscribers)
11.6 Change in Zain’s Performance After Airtel’s Takeover
Particulars Quarter ended June
12
June 11 Y-o-y growth
Total revenues 1066 979 9%
EBITA 275 246 12%
EBITA/total
revenue
25.8% 25.2%
EBIT 62 50 23%
Capex 119 420 -72%

K J Somaiya Institute of Management Studies & Research
50
Cumulative
investments
13041 13017 0%
The loss making Zain Africa unit which made a net loss of USD 112 million in the nine
months to September 2009, started seeing Y-o-Y growth of 23% in EBIT after Airtel’s
takeover.
Successful post acquisition strategies applied
E-recharge for retailers
Network outsourcing
Focus on 3g( now in 7 countries:Ghana, Kenya, Nigeria,Tanzania, Zambia, Congo B &
Sierra Leone.)
Bring in high volume/low cost model
Career development
Key Industry Developments
• Burkina Faso, DRC, GABON- 3G license
Expecting issuance of the final license soon
• Chad- Taxes & Fees
Introduction of a new tax per customer per day to finance Sports programs in the country.
• Kenya-LTE
Airtel has submitted its proposal for LTE license consortium and waiting for reply
• Malawi-Converged Licensing Framework
Final amendments have been published and all operators are now allowed to provide both fixed and mobile voice telephony
• Nigeria- Taxes & Fees, Mobile Number Portability
• Rwanda- Interconnect Rates

K J Somaiya Institute of Management Studies & Research
51
11.7 Airtel’s Goal in Africa
• To be the most lovable brand of Africa
• Increase revenue $5billion within 2015
• Increase in subscriber base to 100 million in Africa alone
• Productivity enhancement
• Cost control
• Increase more internet usage

K J Somaiya Institute of Management Studies & Research
52
12 Future Outlook of Indian Telecom Industry
Key factors, which will fuel the growth of the sector include increased access to services owing to launch of newer telecom technologies like 3G and BWA, changing consumer behavior and the emergence of cloud technologies. A majority of the investments will go into the capital expenditure for setting up newer networks like 3G and developing the backhaul, among other things. Subscriber Base
The mobile subscriber base in India is estimated rise by 9 per cent to 696 million connections this year, according to technology researcher Gartner. The mobile service penetration in the country is currently at 51 per cent and is expected to grow to 72 per cent by 2016. Mobile Value Added Services (MVAS)
India's current MVAS industry has an estimated size of US$ 2.7 billion. The industry derives its revenues majorly from the top five to six products such as game based applications, music downloads, etc, which continue to form close to 80 per cent of VAS revenues. The Indian MVAS industry estimated to grow to US$ 10.8 billion by 2015, with the next wave of growth in subscriptions expected to come from semi-urban and rural areas.
Mobile Number Portability (MNP) Mobile Number Portability requests increased from 41.88 million subscribers at the end of March 2012 to 45.89 million at the end of April 2012. In the month of April 2012 alone, 4.01 million requests have been made for MNP. Handsets
The mobile handset market's revenues in India will grow from US$ 5.7 billion in 2010 to US$ 7.8 billion in 2016, according to the study. India is the second largest mobile handset market in

K J Somaiya Institute of Management Studies & Research
53
the world and is set to become an even larger market with unit shipment of 208.4 million in 2016 at a CAGR of 11.8 per cent from 2010 to 2016. The Indian handset market witnessed a 14.1 per cent growth in 2011 to touch a total volume of 182 million handsets. The market continues to be dominated by Nokia with a share of 37.2 per cent, followed by Samsung with 14.9 per cent, G'Five with 7.5 per cent, and Micromax with 5.8 per cent. Domestic and Chinese handset makers such as Micromax, G'Five, Karbonn, Spice, Maxx and Lava, have garnered a strong presence in the Indian market due to their feature-rich, localised products and low price points.

K J Somaiya Institute of Management Studies & Research
54
13 References
www.trai.gov.in/
www.coai.com/
www.telecomtiger.com/
www.businessreviewindia.in
www.dot.gov.in