India Sustainable Cotton Initiative: From Farm to Yarn...
19
India Sustainable Cotton Initiative: From Farm to Yarn, the Better Cotton Way Murli Dhar, Parikshit Gautam WWF-India
Transcript of India Sustainable Cotton Initiative: From Farm to Yarn...
India Sustainable Cotton Initiative: From
Farm to Yarn, the Better Cotton Way
Murli Dhar, Parikshit Gautam
WWF-India

Statistics – Cotton in India
• Important economic crop in India
• largest in area under cotton (25% of total world cotton area)
• Stands second in production (14% of total world production)
• Cotton consumes 7000 -29000 liters of water to produce 1kg
cotton
• India ranks second in pesticide use
• Cotton consumes 55% of pesticides used in India

Conceptual Framework of Better Management Practices
Action Component : - AgronomyIntegrated Nutrient Management Integrated Water ManagementIntegrated Pest Management Clean Harvest & Post Harvest Management
Feasibility Component: - EconomicsGross Margins
Impact Component: - EnvironmentWater FootprintCarbon Footprint
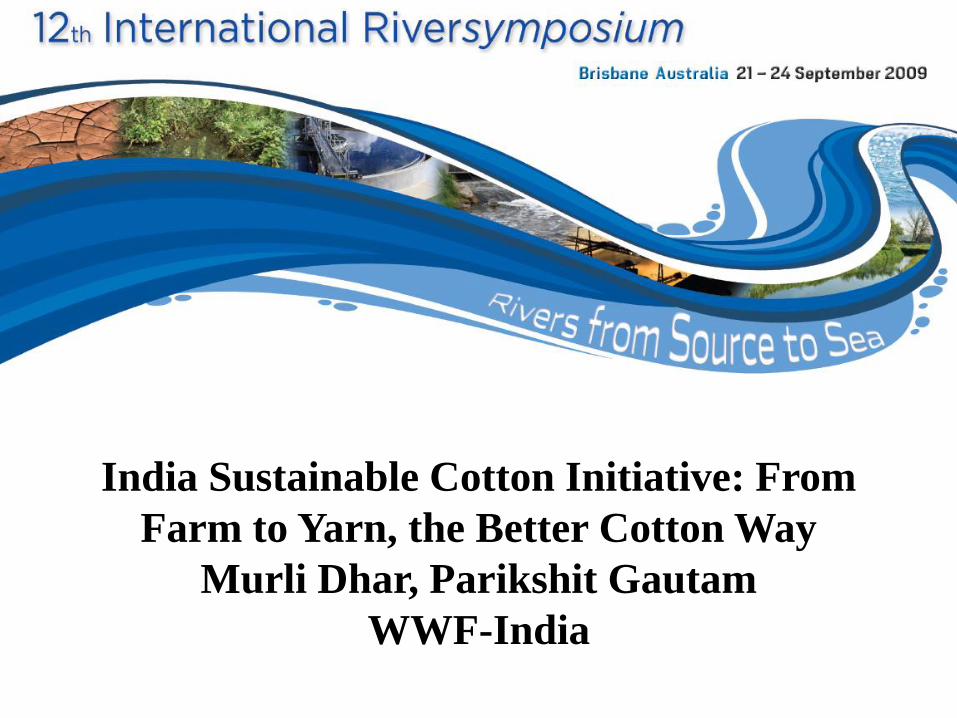
Specific Objectives for Cotton:
Use of Better Management Practices (BMPs) by 500 farmers by
2008
Awareness generated of BMPs amongst 5000 farmers in Warangal
district
Socio-economic and environmental benefits of BMPs are proven in
target project areas
Farmers experience sustainable livelihood benefit by working
collaboratively
Gain support of several companies to promote, source and use
BMP cotton

Project area/ Project at glance
18 villages of Shayampet Mandal, Warangal
314 farmers have joined in the project
3214 members have attended awareness
meetings

Project at glance
Initiated in 2006, in 4 villages with 41 farmers, expanded to 314 farmers in 15 villages
0
50
100
150
200
250
300
350
400
450
500
villages Farmers Acres
2006-07
2007-08
2008-09
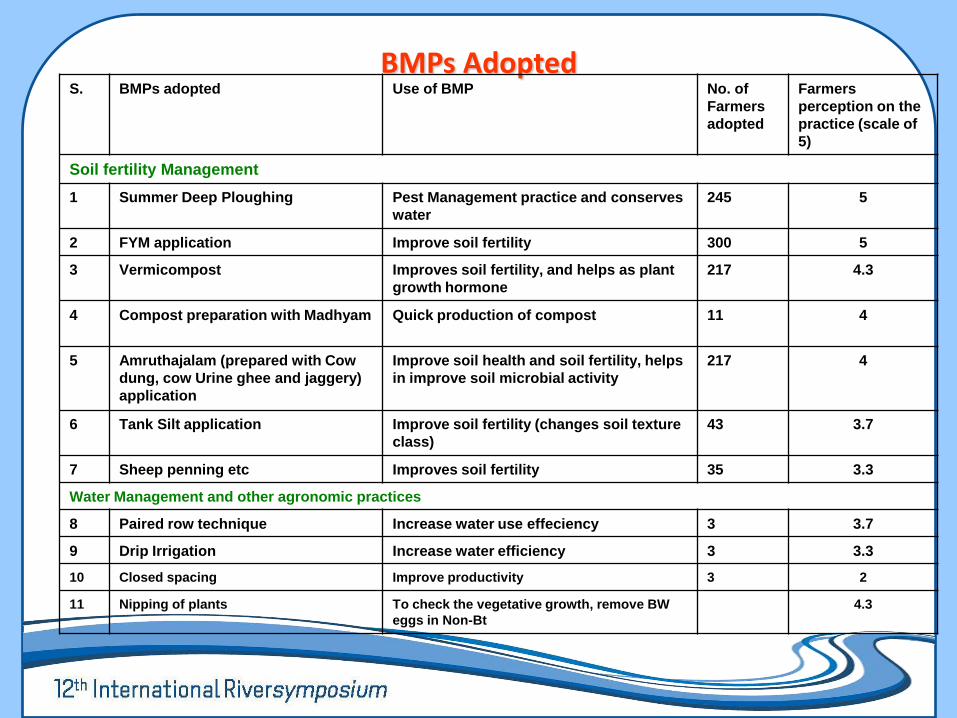
BMPs AdoptedS. BMPs adopted Use of BMP No. of
Farmers
adopted
Farmers
perception on the
practice (scale of
5)
Soil fertility Management
1 Summer Deep Ploughing Pest Management practice and conserves
water
245 5
2 FYM application Improve soil fertility 300 5
3 Vermicompost Improves soil fertility, and helps as plant
growth hormone
217 4.3
4 Compost preparation with Madhyam Quick production of compost 11 4
5 Amruthajalam (prepared with Cow
dung, cow Urine ghee and jaggery)
application
Improve soil health and soil fertility, helps
in improve soil microbial activity
217 4
6 Tank Silt application Improve soil fertility (changes soil texture
class)
43 3.7
7 Sheep penning etc Improves soil fertility 35 3.3
Water Management and other agronomic practices
8 Paired row technique Increase water use effeciency 3 3.7
9 Drip Irrigation Increase water efficiency 3 3.3
10 Closed spacing Improve productivity 3 2
11 Nipping of plants To check the vegetative growth, remove BW
eggs in Non-Bt
4.3

BMPs Adopted
S.No BMPs adopted Use of BMP No. of
Farmers
adopted
Farmers perception
on the practice
(scale of 5)
Pest Management
10 Pheromone traps Monitor pest incidence 208 5
11 Trap crops like Castor, Marigold Controls egg laying on cotton by Helicoverpa
and Spodoptera
244 4.3
12 Neem Oil spray Control sucking pests, mainly for Aphids 121 4
13 Bird perches Control Helicoverpa 179 4
14 Vitex (wild bush) decoction Control sucking pest 222 3.7
16 Neem Seed Kernal Extract Control bollworms at initial stage 148 3.7
17 Chilly and Garlic Mixture Control bollworms at initial stage 08 3.7
18 Biopesticde sprays Control Helicoverpa 04 3.7
19 Boarder crops like Maize, Jowar Control sucking pest incidence 146 3.7
20 Yellow sticky Boards Control Whitefly 114 3.3
21 Cow Dung and Urine spray Control bollworms at initial stage 22 3
22 Tobacco Decoction Control Helicoverpa, and Spodoptera 32 2

Research Design & Methodology
Data collection and analysis• Baseline data in new villages
• Operations log and costs for all farmers
– Farmers’ diary
– Checked during FFS by field organizer /
cluster coordinator
– Scrutinized and compiled by CRIDA SRF
periodically
• Pest data collection (population counts,
damage estimation, trap counts), Water
usage data and sprays count
– One Non-Bt FFS & one Bt FFS plot in a
village
FFS
Hybrid
FFS Bt
Control
Hybrid
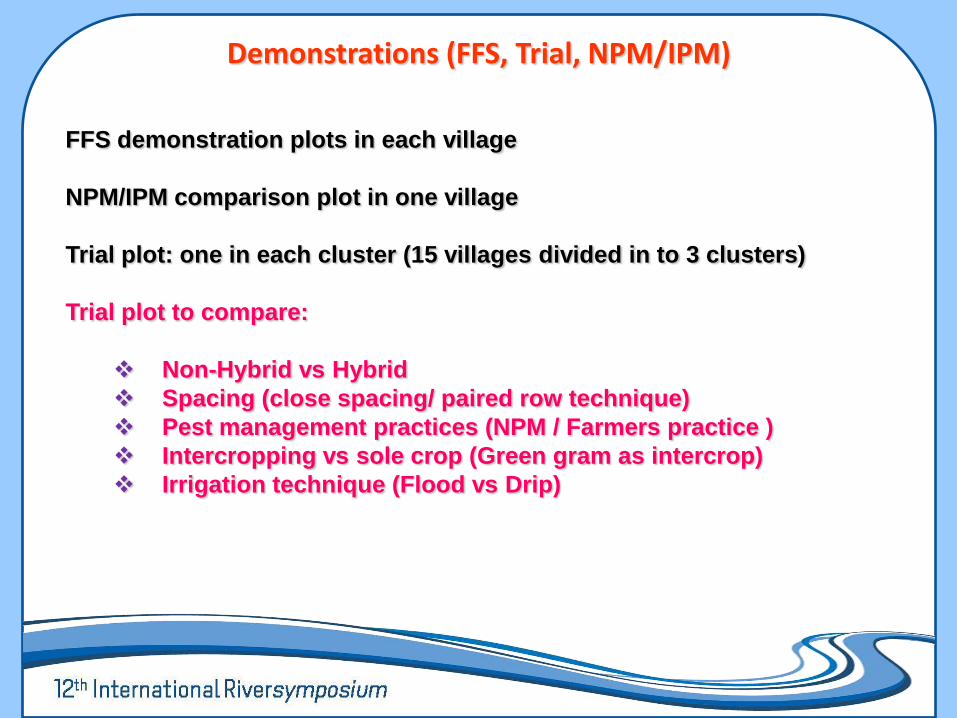
Demonstrations (FFS, Trial, NPM/IPM)
FFS demonstration plots in each village
NPM/IPM comparison plot in one village
Trial plot: one in each cluster (15 villages divided in to 3 clusters)
Trial plot to compare:
Non-Hybrid vs Hybrid
Spacing (close spacing/ paired row technique)
Pest management practices (NPM / Farmers practice )
Intercropping vs sole crop (Green gram as intercrop)
Irrigation technique (Flood vs Drip)

Water use in FFS Farmers plots
Irrigation
water
used in
mm
Yield in Kgs
Cumulativ
e water
Used in
mm
Water used in
Ltrs. to
produce 1 kg
seed cotton
FFS Hybrid 185.5 950 860.5 3623.2
FFS Non
Hybrid 197 910 872 3833.0
In general, the water requirement of cotton crop is 900 -1200 mm.
the irrigation requirement of cotton is 400 – 600 mm

Reduction in fertilizer use
0
5
10
15
20
25
30
FFS-NBt FFS-Bt 2nd year FFS NBt
2nd year FFS Bt
FFS Demo/ Facilitator
NBt
FFS Demo/ Facilitator Bt
Mean fertilizer
application
rate (Kg/acre)
FFS-farmers Non
Hybrid 234
FFS-farmers -Hybrid 209
2nd year FFS Non-
Hybrid 239
2nd year FFS Hybrid 202
FFS Demo Non
Hybrid 225
FFS Demo Hybrid 205
Control 298
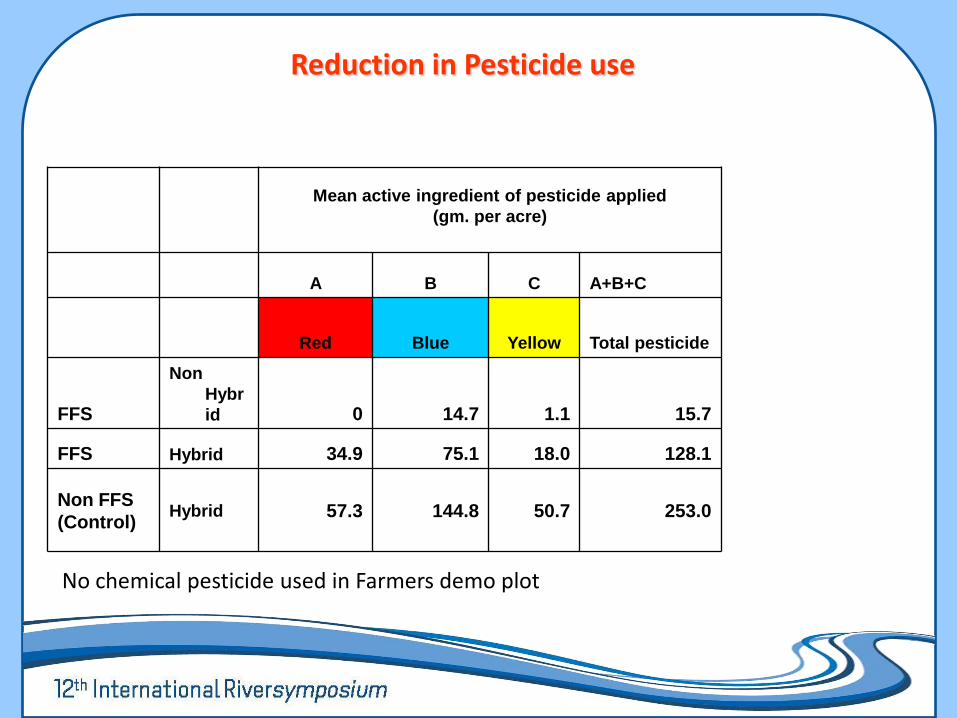
Mean active ingredient of pesticide applied
(gm. per acre)
A B C A+B+C
Red Blue Yellow Total pesticide
FFS
Non
Hybr
id 0 14.7 1.1 15.7
FFS Hybrid 34.9 75.1 18.0 128.1
Non FFS
(Control)Hybrid 57.3 144.8 50.7 253.0
No chemical pesticide used in Farmers demo plot
Reduction in Pesticide use

Results
Category Genotype Seed
cotton
Yield
(kg/ac)
Returns
@ 23 / kg
(Rs/ac)
Total
Variable
Cost
(Rs / ac)
Gross
margin
(Rs / ac)
FFS farmers
Non-
Hybrid 842 19336 7702 11664
FFS farmers Hybrid 926 21298 8282 13016
Non-FFS (Control) Hybrid 944 21712 9155 12557
2nd year FFS Non-Bt 935 21505 8183 13322
2nd year FFS Hybrid 904 20792 7554 13238
FFS Demo
Non-
Hybrid 900 20700 8330 12370
FFS Demo Hybrid 1000 23000 8910 14090
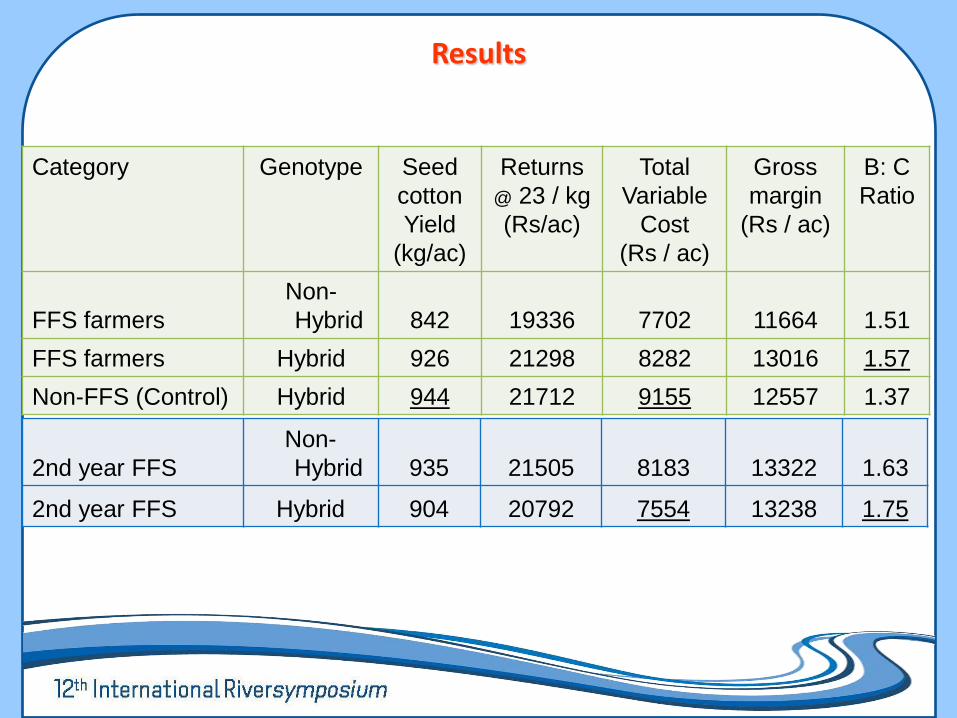
Results
Category Genotype Seed
cotton
Yield
(kg/ac)
Returns
@ 23 / kg
(Rs/ac)
Total
Variable
Cost
(Rs / ac)
Gross
margin
(Rs / ac)
B: C
Ratio
FFS farmers
Non-
Hybrid 842 19336 7702 11664 1.51
FFS farmers Hybrid 926 21298 8282 13016 1.57
Non-FFS (Control) Hybrid 944 21712 9155 12557 1.37
2nd year FFS
Non-
Hybrid 935 21505 8183 13322 1.63
2nd year FFS Hybrid 904 20792 7554 13238 1.75

IPM –NPM Comparison Plot
Yield (kg/ac)
Pesticide
costs
Total
variable
cost Sale price Returns Gross margins B:C Ratio
NPM – Non
Hybrid 1521 71 9621 2300 34981 25361 2.64
IPM- Non Hybrid 1590 328 10178 2300 36561 26383 2.59
NPM -Hybrid 1248 71 9621 2300 28705 19084 1.98
IPM -Hybrid 1435 328 10178 2300 32998 22820 2.24
0
0.5
1
1.5
2
2.5
3
B:C Ratio
NPM - Hy
IPM- Non Hy
NPM - Hy
IPM - Hy

Learnings and challenges
Technology:
BMPs were simplified and modified to local specific
Collection of alternative technologies, experiment them in the field/ trial
plot helped to innovate BMPs
Institutional Building:
Farmer organization and cooperative concept helped to mobilize the
farmers easily. It also help to sustain the project
Farmers cooperative can be used as a channel to reach the larger
farming community, for replication, scaling up, marketing of cotton etc.

Learnings and challenges
• Follow up activity in FFS, like meeting the absentees, recording the result of FFS demonstration is equal important, to conducting the FFS
• Cotton cultivation in warngal is a complex issue – It has Hy/ Non Hy; NPM, IPM; varietal differences, soil differences, climatic variations. Hence, it is a challenge to standardize/ recommend the BMPs – Adopted intensive monitoring of each practice– Demonstration of BMPs in different soils/ Hy, Non Hy– Intensive follow up of farmers, who experience complex problems – Ranking of BMPs – for efficiency and adoptability

Thank You