
India Research Banking -...
43
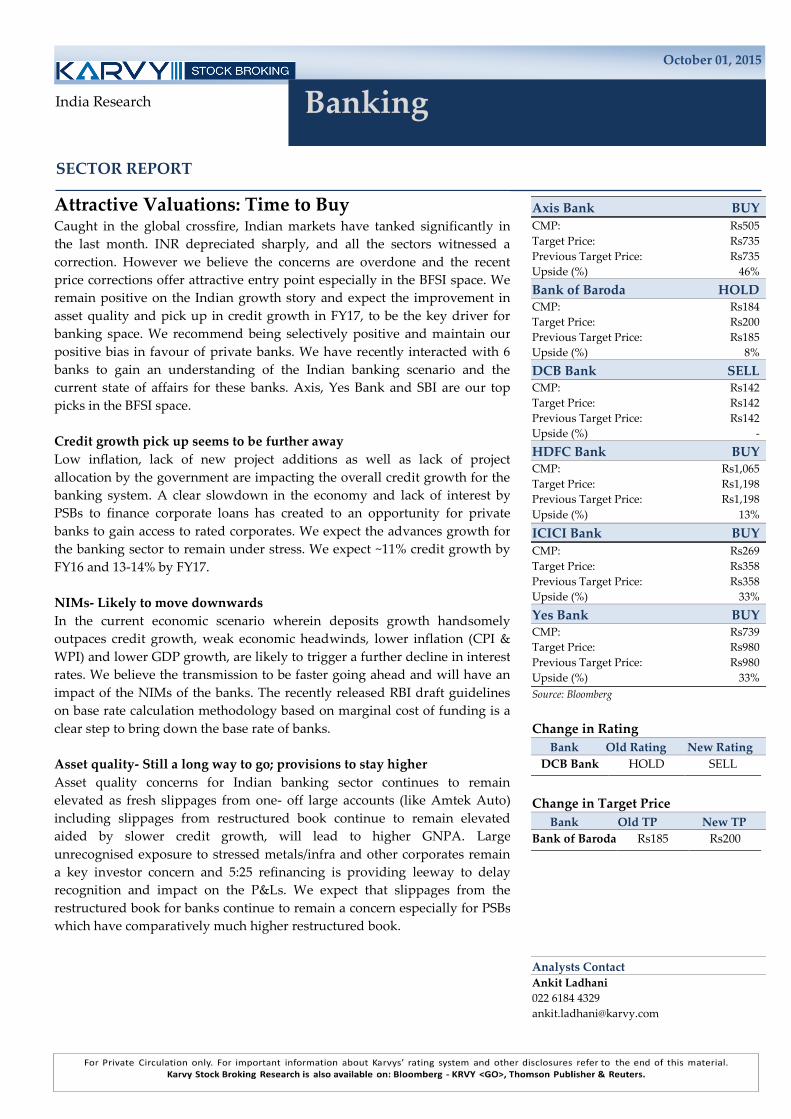
October 01, 2015 Banking India Research SECTOR REPORT Axis Bank BUY CMP: Rs505 Target Price: Rs735 Previous Target Price: Rs735 Upside (%) 46% Bank of Baroda HOLD CMP: Rs184 Target Price: Rs200 Previous Target Price: Rs185 Upside (%) 8% DCB Bank SELL CMP: Rs142 Target Price: Rs142 Previous Target Price: Rs142 Upside (%) - HDFC Bank BUY CMP: Rs1,065 Target Price: Rs1,198 Previous Target Price: Rs1,198 Upside (%) 13% ICICI Bank BUY CMP: Rs269 Target Price: Rs358 Previous Target Price: Rs358 Upside (%) 33% Yes Bank BUY CMP: Rs739 Target Price: Rs980 Previous Target Price: Rs980 Upside (%) 33% Source: Bloomberg Change in Rating Bank Old Rating New Rating DCB Bank HOLD SELL Change in Target Price Bank Old TP New TP Bank of Baroda Rs185 Rs200 Analysts Contact Ankit Ladhani 022 6184 4329 [email protected] Attractive Valuations: Time to Buy Caught in the global crossfire, Indian markets have tanked significantly in the last month. INR depreciated sharply, and all the sectors witnessed a correction. However we believe the concerns are overdone and the recent price corrections offer attractive entry point especially in the BFSI space. We remain positive on the Indian growth story and expect the improvement in asset quality and pick up in credit growth in FY17, to be the key driver for banking space. We recommend being selectively positive and maintain our positive bias in favour of private banks. We have recently interacted with 6 banks to gain an understanding of the Indian banking scenario and the current state of affairs for these banks. Axis, Yes Bank and SBI are our top picks in the BFSI space. Credit growth pick up seems to be further away Low inflation, lack of new project additions as well as lack of project allocation by the government are impacting the overall credit growth for the banking system. A clear slowdown in the economy and lack of interest by PSBs to finance corporate loans has created to an opportunity for private banks to gain access to rated corporates. We expect the advances growth for the banking sector to remain under stress. We expect ~11% credit growth by FY16 and 13-14% by FY17. NIMs- Likely to move downwards In the current economic scenario wherein deposits growth handsomely outpaces credit growth, weak economic headwinds, lower inflation (CPI & WPI) and lower GDP growth, are likely to trigger a further decline in interest rates. We believe the transmission to be faster going ahead and will have an impact of the NIMs of the banks. The recently released RBI draft guidelines on base rate calculation methodology based on marginal cost of funding is a clear step to bring down the base rate of banks. Asset quality- Still a long way to go; provisions to stay higher Asset quality concerns for Indian banking sector continues to remain elevated as fresh slippages from one- off large accounts (like Amtek Auto) including slippages from restructured book continue to remain elevated aided by slower credit growth, will lead to higher GNPA. Large unrecognised exposure to stressed metals/infra and other corporates remain a key investor concern and 5:25 refinancing is providing leeway to delay recognition and impact on the P&Ls. We expect that slippages from the restructured book for banks continue to remain a concern especially for PSBs which have comparatively much higher restructured book.
Transcript of India Research Banking -...
October 01, 2015
Banking
India Research
SECTOR REPORT
Axis Bank BUY
CMP: Rs505
Target Price: Rs735
Previous Target Price: Rs735
Upside (%) 46%
Bank of Baroda HOLD CMP: Rs184
Target Price: Rs200
Previous Target Price: Rs185
Upside (%) 8%
DCB Bank SELL CMP: Rs142
Target Price: Rs142
Previous Target Price: Rs142
Upside (%) -
HDFC Bank BUY CMP: Rs1,065
Target Price: Rs1,198
Previous Target Price: Rs1,198
Upside (%) 13%
ICICI Bank BUY
CMP: Rs269
Target Price: Rs358
Previous Target Price: Rs358
Upside (%) 33%
Yes Bank BUY CMP: Rs739
Target Price: Rs980
Previous Target Price: Rs980
Upside (%) 33%
Source: Bloomberg
Change in Rating
Bank Old Rating New Rating
DCB Bank HOLD SELL
Change in Target Price
Bank Old TP New TP
Bank of Baroda Rs185 Rs200
Analysts Contact
Ankit Ladhani
022 6184 4329
Attractive Valuations: Time to Buy Caught in the global crossfire, Indian markets have tanked significantly in
the last month. INR depreciated sharply, and all the sectors witnessed a
correction. However we believe the concerns are overdone and the recent
price corrections offer attractive entry point especially in the BFSI space. We
remain positive on the Indian growth story and expect the improvement in
asset quality and pick up in credit growth in FY17, to be the key driver for
banking space. We recommend being selectively positive and maintain our
positive bias in favour of private banks. We have recently interacted with 6
banks to gain an understanding of the Indian banking scenario and the
current state of affairs for these banks. Axis, Yes Bank and SBI are our top
picks in the BFSI space.
Credit growth pick up seems to be further away
Low inflation, lack of new project additions as well as lack of project
allocation by the government are impacting the overall credit growth for the
banking system. A clear slowdown in the economy and lack of interest by
PSBs to finance corporate loans has created to an opportunity for private
banks to gain access to rated corporates. We expect the advances growth for
the banking sector to remain under stress. We expect ~11% credit growth by
FY16 and 13-14% by FY17.
NIMs- Likely to move downwards
In the current economic scenario wherein deposits growth handsomely
outpaces credit growth, weak economic headwinds, lower inflation (CPI &
WPI) and lower GDP growth, are likely to trigger a further decline in interest
rates. We believe the transmission to be faster going ahead and will have an
impact of the NIMs of the banks. The recently released RBI draft guidelines
on base rate calculation methodology based on marginal cost of funding is a
clear step to bring down the base rate of banks.
Asset quality- Still a long way to go; provisions to stay higher
Asset quality concerns for Indian banking sector continues to remain
elevated as fresh slippages from one- off large accounts (like Amtek Auto)
including slippages from restructured book continue to remain elevated
aided by slower credit growth, will lead to higher GNPA. Large
unrecognised exposure to stressed metals/infra and other corporates remain
a key investor concern and 5:25 refinancing is providing leeway to delay
recognition and impact on the P&Ls. We expect that slippages from the
restructured book for banks continue to remain a concern especially for PSBs
which have comparatively much higher restructured book.
2
October 01, 2015
Banking
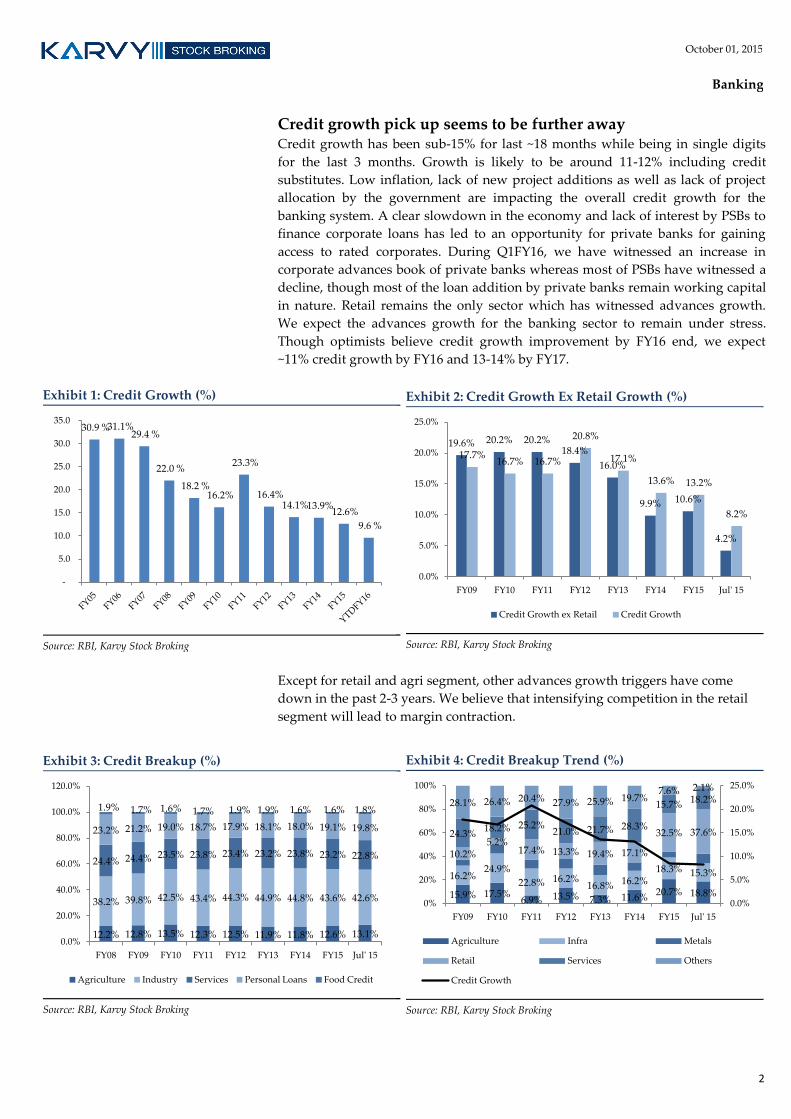
Credit growth pick up seems to be further away Credit growth has been sub-15% for last ~18 months while being in single digits
for the last 3 months. Growth is likely to be around 11-12% including credit
substitutes. Low inflation, lack of new project additions as well as lack of project
allocation by the government are impacting the overall credit growth for the
banking system. A clear slowdown in the economy and lack of interest by PSBs to
finance corporate loans has led to an opportunity for private banks for gaining
access to rated corporates. During Q1FY16, we have witnessed an increase in
corporate advances book of private banks whereas most of PSBs have witnessed a
decline, though most of the loan addition by private banks remain working capital
in nature. Retail remains the only sector which has witnessed advances growth.
We expect the advances growth for the banking sector to remain under stress.
Though optimists believe credit growth improvement by FY16 end, we expect
~11% credit growth by FY16 and 13-14% by FY17.
Exhibit 1: Credit Growth (%)
Source: RBI, Karvy Stock Broking
Exhibit 2: Credit Growth Ex Retail Growth (%)
Source: RBI, Karvy Stock Broking
Except for retail and agri segment, other advances growth triggers have come
down in the past 2-3 years. We believe that intensifying competition in the retail
segment will lead to margin contraction.
Exhibit 3: Credit Breakup (%)
Source: RBI, Karvy Stock Broking
Exhibit 4: Credit Breakup Trend (%)
Source: RBI, Karvy Stock Broking
30.9 % 31.1% 29.4 %
22.0 %
18.2 % 16.2%
23.3%
16.4% 14.1% 13.9%
12.6%
9.6 %
-
5.0
10.0
15.0
20.0
25.0
30.0
35.0
19.6% 20.2% 20.2% 18.4%
16.0%
9.9% 10.6%
4.2%
17.7% 16.7% 16.7%
20.8%
17.1%
13.6% 13.2%
8.2%
0.0%
5.0%
10.0%
15.0%
20.0%
25.0%
FY09 FY10 FY11 FY12 FY13 FY14 FY15 Jul' 15
Credit Growth ex Retail Credit Growth
12.2% 12.8% 13.5% 12.3% 12.5% 11.9% 11.8% 12.6% 13.1%
38.2% 39.8% 42.5% 43.4% 44.3% 44.9% 44.8% 43.6% 42.6%
24.4% 24.4% 23.5% 23.8% 23.4% 23.2% 23.8% 23.2% 22.8%
23.2% 21.2% 19.0% 18.7% 17.9% 18.1% 18.0% 19.1% 19.8%
1.9% 1.7% 1.6% 1.7% 1.9% 1.9% 1.6% 1.6% 1.8%
0.0%
20.0%
40.0%
60.0%
80.0%
100.0%
120.0%
FY08 FY09 FY10 FY11 FY12 FY13 FY14 FY15 Jul' 15
Agriculture Industry Services Personal Loans Food Credit
15.9% 17.5% 6.9% 13.5% 7.3% 11.6%
20.7% 18.8%
16.2% 24.9%
22.8% 16.2% 16.8% 16.2%
18.3% 15.3%
10.2% 5.2%
17.4% 13.3% 19.4% 17.1%
32.5% 37.6% 24.3% 18.2% 25.2%
21.0% 21.7% 28.3%
15.7% 18.2% 28.1% 26.4% 20.4% 27.9% 25.9% 19.7% 7.6% 2.1%
0.0%
5.0%
10.0%
15.0%
20.0%
25.0%
0%
20%
40%
60%
80%
100%
FY09 FY10 FY11 FY12 FY13 FY14 FY15 Jul' 15
Agriculture Infra Metals
Retail Services Others
Credit Growth
3
October 01, 2015
Banking
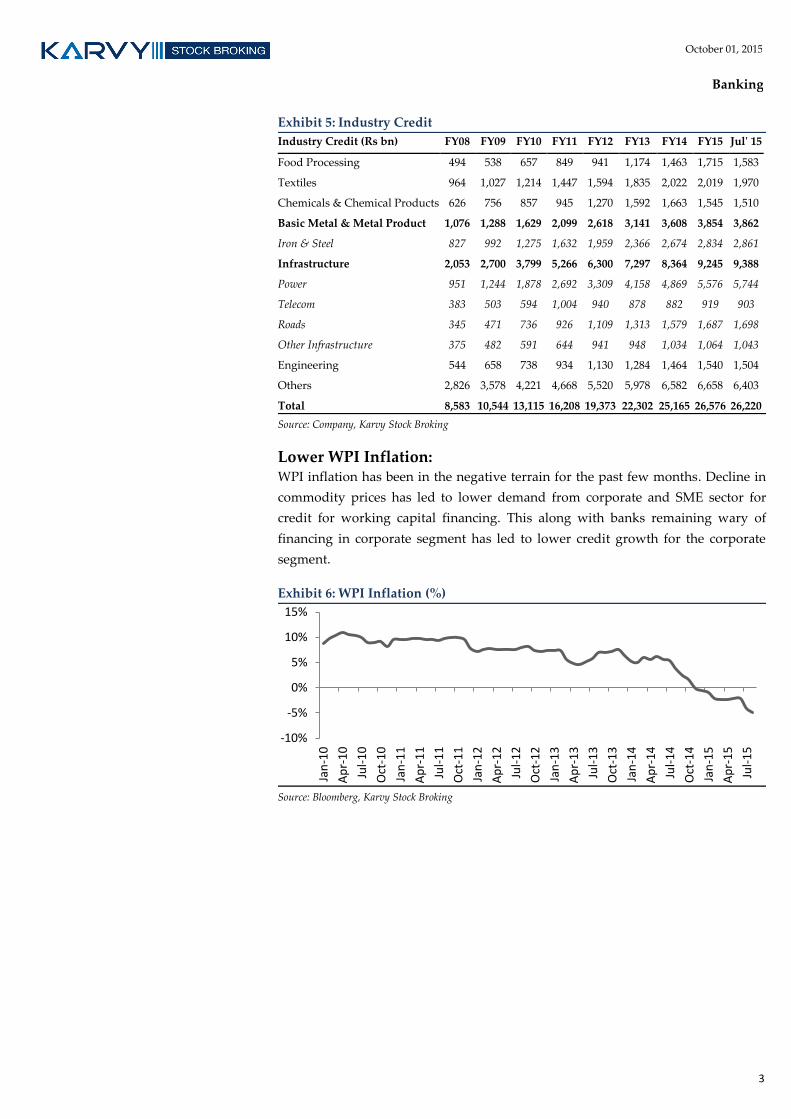
Exhibit 5: Industry Credit
Industry Credit (Rs bn) FY08 FY09 FY10 FY11 FY12 FY13 FY14 FY15 Jul' 15
Food Processing 494 538 657 849 941 1,174 1,463 1,715 1,583
Textiles 964 1,027 1,214 1,447 1,594 1,835 2,022 2,019 1,970
Chemicals & Chemical Products 626 756 857 945 1,270 1,592 1,663 1,545 1,510
Basic Metal & Metal Product 1,076 1,288 1,629 2,099 2,618 3,141 3,608 3,854 3,862
Iron & Steel 827 992 1,275 1,632 1,959 2,366 2,674 2,834 2,861
Infrastructure 2,053 2,700 3,799 5,266 6,300 7,297 8,364 9,245 9,388
Power 951 1,244 1,878 2,692 3,309 4,158 4,869 5,576 5,744
Telecom 383 503 594 1,004 940 878 882 919 903
Roads 345 471 736 926 1,109 1,313 1,579 1,687 1,698
Other Infrastructure 375 482 591 644 941 948 1,034 1,064 1,043
Engineering 544 658 738 934 1,130 1,284 1,464 1,540 1,504
Others 2,826 3,578 4,221 4,668 5,520 5,978 6,582 6,658 6,403
Total 8,583 10,544 13,115 16,208 19,373 22,302 25,165 26,576 26,220
Source: Company, Karvy Stock Broking
Lower WPI Inflation: WPI inflation has been in the negative terrain for the past few months. Decline in
commodity prices has led to lower demand from corporate and SME sector for
credit for working capital financing. This along with banks remaining wary of
financing in corporate segment has led to lower credit growth for the corporate
segment.
Exhibit 6: WPI Inflation (%)
Source: Bloomberg, Karvy Stock Broking
-10%
-5%
0%
5%
10%
15%
Jan
-10
Ap
r-1
0
Jul-
10
Oct
-10
Jan
-11
Ap
r-1
1
Jul-
11
Oct
-11
Jan
-12
Ap
r-1
2
Jul-
12
Oct
-12
Jan
-13
Ap
r-1
3
Jul-
13
Oct
-13
Jan
-14
Ap
r-1
4
Jul-
14
Oct
-14
Jan
-15
Ap
r-1
5
Jul-
15
4
October 01, 2015
Banking
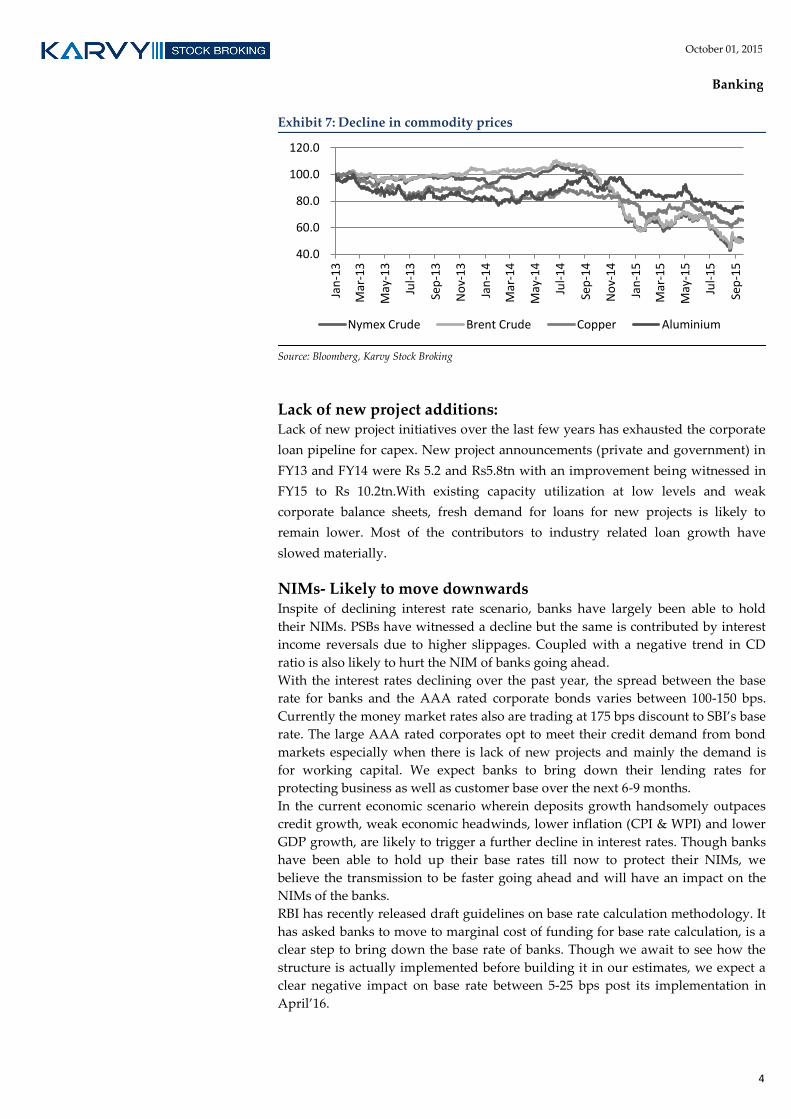
Exhibit 7: Decline in commodity prices
Source: Bloomberg, Karvy Stock Broking
Lack of new project additions: Lack of new project initiatives over the last few years has exhausted the corporate
loan pipeline for capex. New project announcements (private and government) in
FY13 and FY14 were Rs 5.2 and Rs5.8tn with an improvement being witnessed in
FY15 to Rs 10.2tn.With existing capacity utilization at low levels and weak
corporate balance sheets, fresh demand for loans for new projects is likely to
remain lower. Most of the contributors to industry related loan growth have
slowed materially.
NIMs- Likely to move downwards Inspite of declining interest rate scenario, banks have largely been able to hold
their NIMs. PSBs have witnessed a decline but the same is contributed by interest
income reversals due to higher slippages. Coupled with a negative trend in CD
ratio is also likely to hurt the NIM of banks going ahead.
With the interest rates declining over the past year, the spread between the base
rate for banks and the AAA rated corporate bonds varies between 100-150 bps.
Currently the money market rates also are trading at 175 bps discount to SBI’s base
rate. The large AAA rated corporates opt to meet their credit demand from bond
markets especially when there is lack of new projects and mainly the demand is
for working capital. We expect banks to bring down their lending rates for
protecting business as well as customer base over the next 6-9 months.
In the current economic scenario wherein deposits growth handsomely outpaces
credit growth, weak economic headwinds, lower inflation (CPI & WPI) and lower
GDP growth, are likely to trigger a further decline in interest rates. Though banks
have been able to hold up their base rates till now to protect their NIMs, we
believe the transmission to be faster going ahead and will have an impact on the
NIMs of the banks.
RBI has recently released draft guidelines on base rate calculation methodology. It
has asked banks to move to marginal cost of funding for base rate calculation, is a
clear step to bring down the base rate of banks. Though we await to see how the
structure is actually implemented before building it in our estimates, we expect a
clear negative impact on base rate between 5-25 bps post its implementation in
April’16.
40.0
60.0
80.0
100.0
120.0
Jan
-13
Mar
-13
May
-13
Jul-
13
Sep
-13
No
v-1
3
Jan
-14
Mar
-14
May
-14
Jul-
14
Sep
-14
No
v-1
4
Jan
-15
Mar
-15
May
-15
Jul-
15
Sep
-15
Nymex Crude Brent Crude Copper Aluminium
5
October 01, 2015
Banking
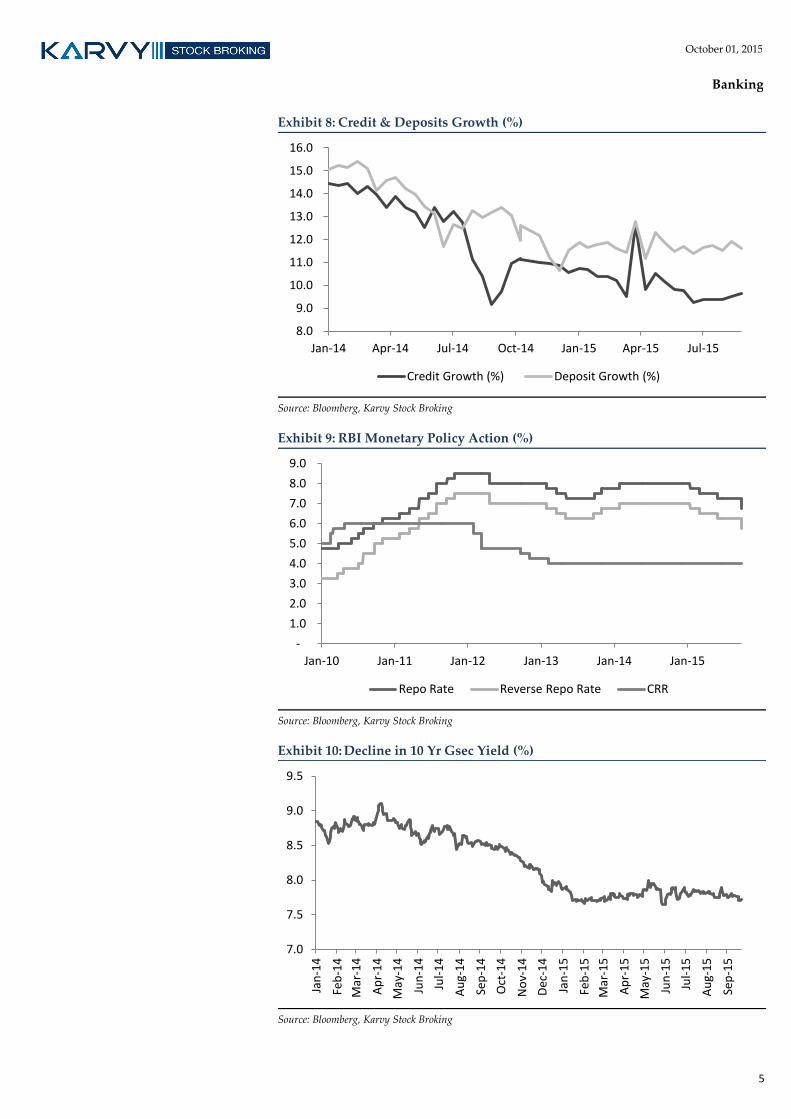
Exhibit 8: Credit & Deposits Growth (%)
Source: Bloomberg, Karvy Stock Broking
Exhibit 9: RBI Monetary Policy Action (%)
Source: Bloomberg, Karvy Stock Broking
Exhibit 10: Decline in 10 Yr Gsec Yield (%)
Source: Bloomberg, Karvy Stock Broking
8.0
9.0
10.0
11.0
12.0
13.0
14.0
15.0
16.0
Jan-14 Apr-14 Jul-14 Oct-14 Jan-15 Apr-15 Jul-15
Credit Growth (%) Deposit Growth (%)
-
1.0
2.0
3.0
4.0
5.0
6.0
7.0
8.0
9.0
Jan-10 Jan-11 Jan-12 Jan-13 Jan-14 Jan-15
Repo Rate Reverse Repo Rate CRR
7.0
7.5
8.0
8.5
9.0
9.5
Jan
-14
Feb
-14
Mar
-14
Ap
r-1
4
May
-14
Jun
-14
Jul-
14
Au
g-1
4
Sep
-14
Oct
-14
No
v-1
4
Dec
-14
Jan
-15
Feb
-15
Mar
-15
Ap
r-1
5
May
-15
Jun
-15
Jul-
15
Au
g-1
5
Sep
-15
6
October 01, 2015
Banking
Asset quality- Still a long way to go; provisions to stay higher
Asset quality concerns for Indian banking sector continues to remain elevated.
Fresh slippages from one- off large accounts (like Amtek Auto) including
slippages from restructured book continues to remain elevated aided by slower
credit growth, will lead to higher GNPA. Though fresh slippages for the banking
sector are expected to come down along with RBI’s 5-25 special refinancing
scheme, we expect that slippages from the restructured book for banks to continue
to remain a concern especially for PSBs which have comparatively much higher
restructured book.
Indian banking sector had witnessed a strong credit growth in FY05-10 during
which the advances grew by ~24% CAGR. During the period, Indian economy was
booming with GDP growth of average 8.7%. As expected in growth phase, banks
also took large exposures to risky as well as over leveraged groups and then paid
the price post FY2010.
Economic slowdown immediately post such rapid credit expansion has led to a
major growth in asset quality stress for the banks wherein GNPA grew by 42%
CAGR over FY10-14. Though we believe most of the stressed accounts should have
slipped till now, many of them had been given temporary lifeline in the name of
restructuring. Post the closure of restructuring window, RBI has now come out
with refinancing under the 5-25 scheme. The quantum of refinancing is likely to be
smaller as compared to restructuring as the refinancing is applicable only to on-
going standard projects.
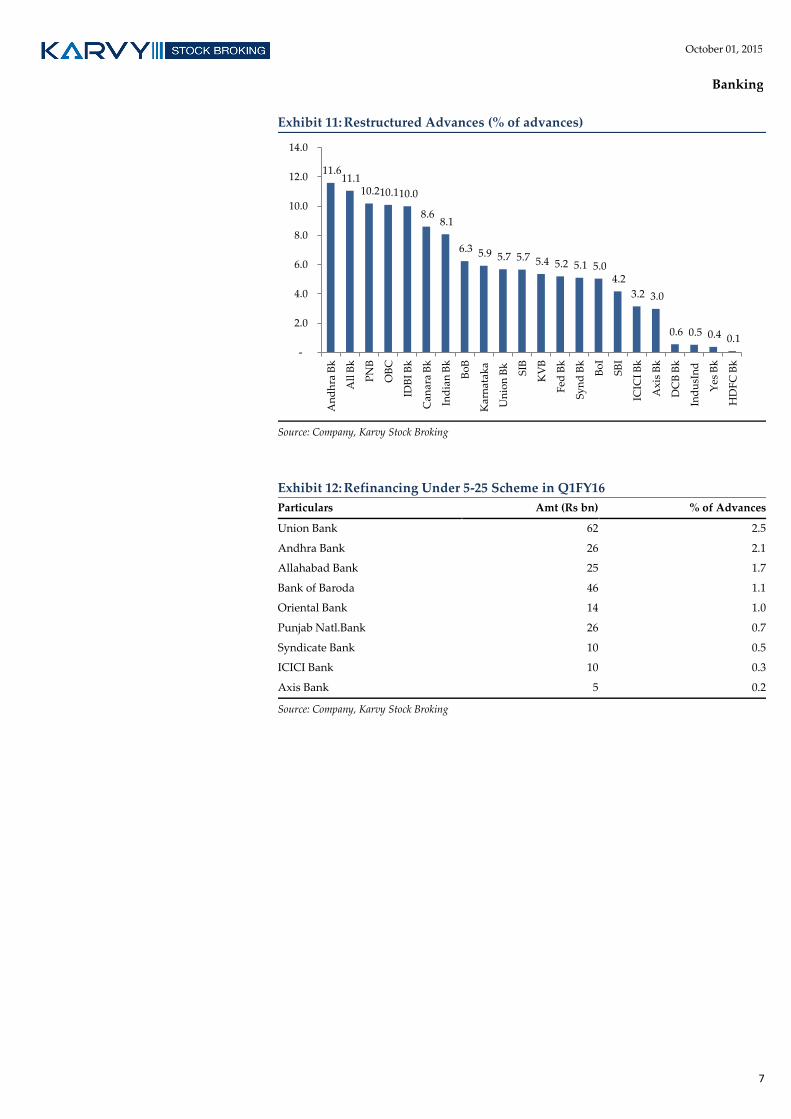
Cumulative slippages of banks from restructured book are already in the range of
20-25% of total restructuring (incl. loans currently under moratorium period). We
expect the slippages from restructured book to continue to remain elevated as
additional loans are expected to be coming out from the moratorium period in
FY16 and FY17.
In the past couple of years, with increasing GNPA, PCR of most of the banks (PSBs
and private) have declined. As the slippages from restructured book is expected to
remain elevated, provision cost is expected to remain higher. Given the already
lower PCR, we expect banks provision cost to remain higher in FY16 and FY17 for
higher slippages, but post that for increasing their PCR to prior levels.
Though fresh slippages are likely to decline, slippages from restructured accounts
will lead to higher slippages though the total stressed assets book (GNPA +
Restructured book) is unlikely to increase sharply. Restructured assets book for
private banks are much smaller as compared to PSBs and we expect slippages for
private banks to be lower than those compared to PSBs in FY16. We foresee some
respite coming in from the asset quality front in FY17 but FY16 will continue to be
a hangover especially for banks with higher restructured book (particularly PSBs).
7
October 01, 2015
Banking
Exhibit 11: Restructured Advances (% of advances)
Source: Company, Karvy Stock Broking
Exhibit 12: Refinancing Under 5-25 Scheme in Q1FY16
Particulars Amt (Rs bn) % of Advances
Union Bank 62 2.5
Andhra Bank 26 2.1
Allahabad Bank 25 1.7
Bank of Baroda 46 1.1
Oriental Bank 14 1.0
Punjab Natl.Bank 26 0.7
Syndicate Bank 10 0.5
ICICI Bank 10 0.3
Axis Bank 5 0.2
Source: Company, Karvy Stock Broking
11.6 11.1
10.2 10.1 10.0
8.6 8.1
6.3 5.9 5.7 5.7 5.4 5.2 5.1 5.0 4.2
3.2 3.0
0.6 0.5 0.4 0.1
-
2.0
4.0
6.0
8.0
10.0
12.0
14.0
An
dh
ra B
k
All
Bk
PN
B
OB
C
IDB
I B
k
Can
ara
Bk
Ind
ian
Bk
Bo
B
Kar
nat
ak
a
Un
ion
Bk
SIB
KV
B
Fed
Bk
Sy
nd
Bk
Bo
I
SB
I
ICIC
I B
k
Ax
is B
k
DC
B B
k
Ind
usI
nd
Yes
Bk
HD
FC
Bk
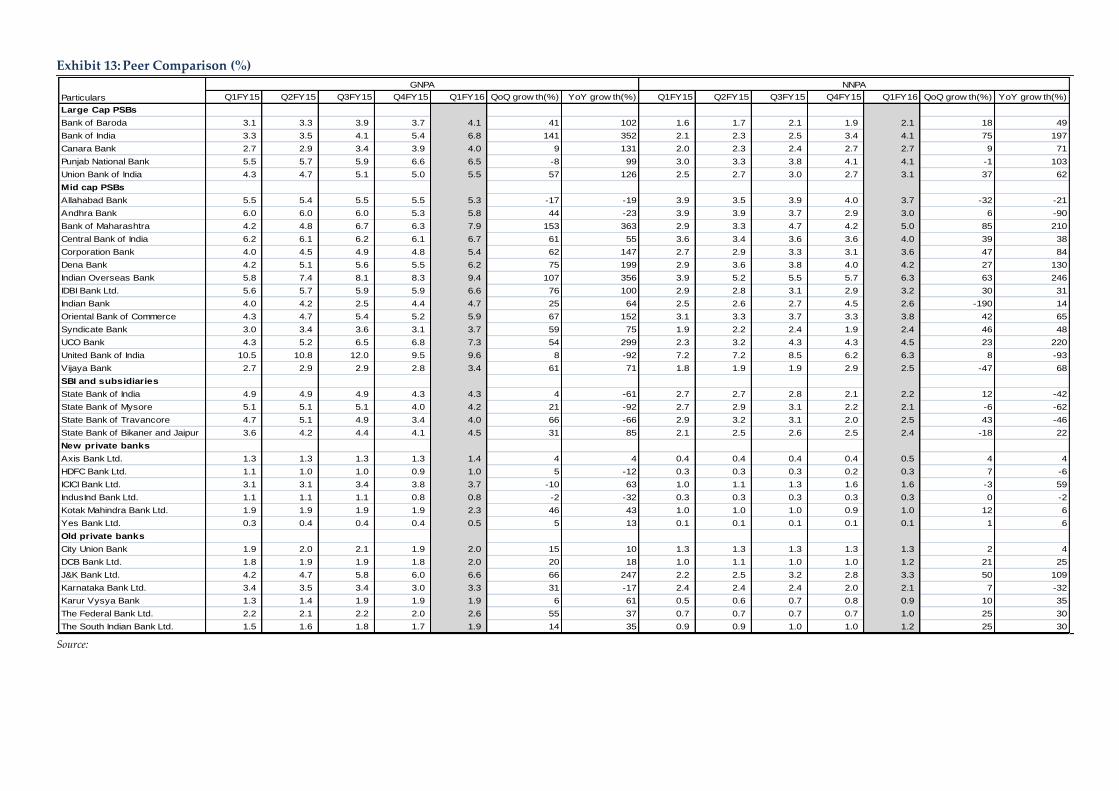
Exhibit 13: Peer Comparison (%)
Source:
Q1FY15 Q2FY15 Q3FY15 Q4FY15 Q1FY16 QoQ grow th(%) YoY grow th(%) Q1FY15 Q2FY15 Q3FY15 Q4FY15 Q1FY16 QoQ grow th(%) YoY grow th(%)
Large Cap PSBs
Bank of Baroda 3.1 3.3 3.9 3.7 4.1 41 102 1.6 1.7 2.1 1.9 2.1 18 49
Bank of India 3.3 3.5 4.1 5.4 6.8 141 352 2.1 2.3 2.5 3.4 4.1 75 197
Canara Bank 2.7 2.9 3.4 3.9 4.0 9 131 2.0 2.3 2.4 2.7 2.7 9 71
Punjab National Bank 5.5 5.7 5.9 6.6 6.5 -8 99 3.0 3.3 3.8 4.1 4.1 -1 103
Union Bank of India 4.3 4.7 5.1 5.0 5.5 57 126 2.5 2.7 3.0 2.7 3.1 37 62
Mid cap PSBs
Allahabad Bank 5.5 5.4 5.5 5.5 5.3 -17 -19 3.9 3.5 3.9 4.0 3.7 -32 -21
Andhra Bank 6.0 6.0 6.0 5.3 5.8 44 -23 3.9 3.9 3.7 2.9 3.0 6 -90
Bank of Maharashtra 4.2 4.8 6.7 6.3 7.9 153 363 2.9 3.3 4.7 4.2 5.0 85 210
Central Bank of India 6.2 6.1 6.2 6.1 6.7 61 55 3.6 3.4 3.6 3.6 4.0 39 38
Corporation Bank 4.0 4.5 4.9 4.8 5.4 62 147 2.7 2.9 3.3 3.1 3.6 47 84
Dena Bank 4.2 5.1 5.6 5.5 6.2 75 199 2.9 3.6 3.8 4.0 4.2 27 130
Indian Overseas Bank 5.8 7.4 8.1 8.3 9.4 107 356 3.9 5.2 5.5 5.7 6.3 63 246
IDBI Bank Ltd. 5.6 5.7 5.9 5.9 6.6 76 100 2.9 2.8 3.1 2.9 3.2 30 31
Indian Bank 4.0 4.2 2.5 4.4 4.7 25 64 2.5 2.6 2.7 4.5 2.6 -190 14
Oriental Bank of Commerce 4.3 4.7 5.4 5.2 5.9 67 152 3.1 3.3 3.7 3.3 3.8 42 65
Syndicate Bank 3.0 3.4 3.6 3.1 3.7 59 75 1.9 2.2 2.4 1.9 2.4 46 48
UCO Bank 4.3 5.2 6.5 6.8 7.3 54 299 2.3 3.2 4.3 4.3 4.5 23 220
United Bank of India 10.5 10.8 12.0 9.5 9.6 8 -92 7.2 7.2 8.5 6.2 6.3 8 -93
Vijaya Bank 2.7 2.9 2.9 2.8 3.4 61 71 1.8 1.9 1.9 2.9 2.5 -47 68
SBI and subsidiaries
State Bank of India 4.9 4.9 4.9 4.3 4.3 4 -61 2.7 2.7 2.8 2.1 2.2 12 -42
State Bank of Mysore 5.1 5.1 5.1 4.0 4.2 21 -92 2.7 2.9 3.1 2.2 2.1 -6 -62
State Bank of Travancore 4.7 5.1 4.9 3.4 4.0 66 -66 2.9 3.2 3.1 2.0 2.5 43 -46
State Bank of Bikaner and Jaipur 3.6 4.2 4.4 4.1 4.5 31 85 2.1 2.5 2.6 2.5 2.4 -18 22
New private banks
Axis Bank Ltd. 1.3 1.3 1.3 1.3 1.4 4 4 0.4 0.4 0.4 0.4 0.5 4 4
HDFC Bank Ltd. 1.1 1.0 1.0 0.9 1.0 5 -12 0.3 0.3 0.3 0.2 0.3 7 -6
ICICI Bank Ltd. 3.1 3.1 3.4 3.8 3.7 -10 63 1.0 1.1 1.3 1.6 1.6 -3 59
IndusInd Bank Ltd. 1.1 1.1 1.1 0.8 0.8 -2 -32 0.3 0.3 0.3 0.3 0.3 0 -2
Kotak Mahindra Bank Ltd. 1.9 1.9 1.9 1.9 2.3 46 43 1.0 1.0 1.0 0.9 1.0 12 6
Yes Bank Ltd. 0.3 0.4 0.4 0.4 0.5 5 13 0.1 0.1 0.1 0.1 0.1 1 6
Old private banks
City Union Bank 1.9 2.0 2.1 1.9 2.0 15 10 1.3 1.3 1.3 1.3 1.3 2 4
DCB Bank Ltd. 1.8 1.9 1.9 1.8 2.0 20 18 1.0 1.1 1.0 1.0 1.2 21 25
J&K Bank Ltd. 4.2 4.7 5.8 6.0 6.6 66 247 2.2 2.5 3.2 2.8 3.3 50 109
Karnataka Bank Ltd. 3.4 3.5 3.4 3.0 3.3 31 -17 2.4 2.4 2.4 2.0 2.1 7 -32
Karur Vysya Bank 1.3 1.4 1.9 1.9 1.9 6 61 0.5 0.6 0.7 0.8 0.9 10 35
The Federal Bank Ltd. 2.2 2.1 2.2 2.0 2.6 55 37 0.7 0.7 0.7 0.7 1.0 25 30
The South Indian Bank Ltd. 1.5 1.6 1.8 1.7 1.9 14 35 0.9 0.9 1.0 1.0 1.2 25 30
Particulars
GNPA NNPA
October 01, 2015
Banking
9
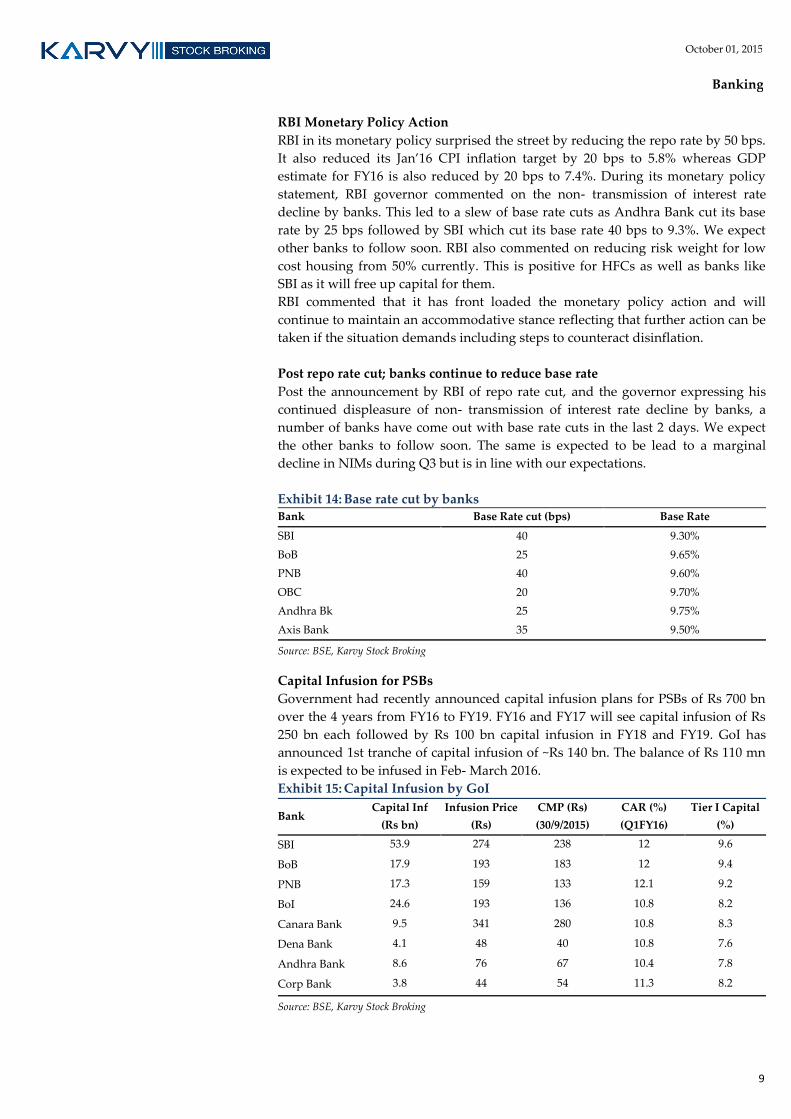
RBI Monetary Policy Action
RBI in its monetary policy surprised the street by reducing the repo rate by 50 bps.
It also reduced its Jan’16 CPI inflation target by 20 bps to 5.8% whereas GDP
estimate for FY16 is also reduced by 20 bps to 7.4%. During its monetary policy
statement, RBI governor commented on the non- transmission of interest rate
decline by banks. This led to a slew of base rate cuts as Andhra Bank cut its base
rate by 25 bps followed by SBI which cut its base rate 40 bps to 9.3%. We expect
other banks to follow soon. RBI also commented on reducing risk weight for low
cost housing from 50% currently. This is positive for HFCs as well as banks like
SBI as it will free up capital for them.
RBI commented that it has front loaded the monetary policy action and will
continue to maintain an accommodative stance reflecting that further action can be
taken if the situation demands including steps to counteract disinflation.
Post repo rate cut; banks continue to reduce base rate
Post the announcement by RBI of repo rate cut, and the governor expressing his
continued displeasure of non- transmission of interest rate decline by banks, a
number of banks have come out with base rate cuts in the last 2 days. We expect
the other banks to follow soon. The same is expected to be lead to a marginal
decline in NIMs during Q3 but is in line with our expectations.
Exhibit 14: Base rate cut by banks Bank Base Rate cut (bps) Base Rate
SBI 40 9.30%
BoB 25 9.65%
PNB 40 9.60%
OBC 20 9.70%
Andhra Bk 25 9.75%
Axis Bank 35 9.50%
Source: BSE, Karvy Stock Broking
Capital Infusion for PSBs
Government had recently announced capital infusion plans for PSBs of Rs 700 bn
over the 4 years from FY16 to FY19. FY16 and FY17 will see capital infusion of Rs
250 bn each followed by Rs 100 bn capital infusion in FY18 and FY19. GoI has
announced 1st tranche of capital infusion of ~Rs 140 bn. The balance of Rs 110 mn
is expected to be infused in Feb- March 2016.
Exhibit 15: Capital Infusion by GoI
Bank Capital Inf
(Rs bn)
Infusion Price
(Rs)
CMP (Rs)
(30/9/2015)
CAR (%)
(Q1FY16)
Tier I Capital
(%)
SBI 53.9 274 238 12 9.6
BoB 17.9 193 183 12 9.4
PNB 17.3 159 133 12.1 9.2
BoI 24.6 193 136 10.8 8.2
Canara Bank 9.5 341 280 10.8 8.3
Dena Bank 4.1 48 40 10.8 7.6
Andhra Bank 8.6 76 67 10.4 7.8
Corp Bank 3.8 44 54 11.3 8.2
Source: BSE, Karvy Stock Broking
October 01, 2015
Banking
10
Valuation and Outlook
We believe that the banking sector is set for another year of slowdown in FY16 but
FY17 looks promising. With a revival in economy along with interest rate
stabilization, we expect earnings of the banks to improve. However for FY16, the
outlook for credit growth remains weak, along with asset quality pressures likely
to negatively impact the earnings growth for the banks. We believe that private
banks are better placed, being well capitalized as well as lower GNPA and
restructured advances which are likely to drive the slippages in FY16. We have
recently interacted with the management of 6 banks in the PSU and private
banking space to understand the current banking scenario as well as the likely
impact of the recent RBI policies on the banking space.
Credit growth is likely to be under pressure along with easing of asset quality
pressures which still seems to be some time away. With NIMs likely to be
impacted by declining interest rates along with the recent RBI guidelines of
marginal cost of funds for base rate calculation, margins are likely to be marginally
lower for FY16 and FY17.
Axis Bank, Yes Bank and SBI are our top picks in the BFSI space.
Change in rating
DCB Bank: Bank has largely maintained its asset quality but we expect
deterioration going ahead. We have maintained our estimates for FY16 and FY17
and our target price. Due to price run-up, we downgrade the stock to Sell with a
target price of Rs142 (2.1x FY17E ABV).
Change in target price
Bank of Baroda: With the appointment of private sector professionals as Chairman
and MD & CEO, the operations are likely to improve, but will likely take some
time. We remain cautious on the PSBs but believe BoB is likely to be the key
beneficiary of economic revival. We upgrade the long term multiple of the stock
from 1x to 1.1x FY17E ABV but retain our Hold rating with a TP of Rs200.
October 01, 2015
Banking
11
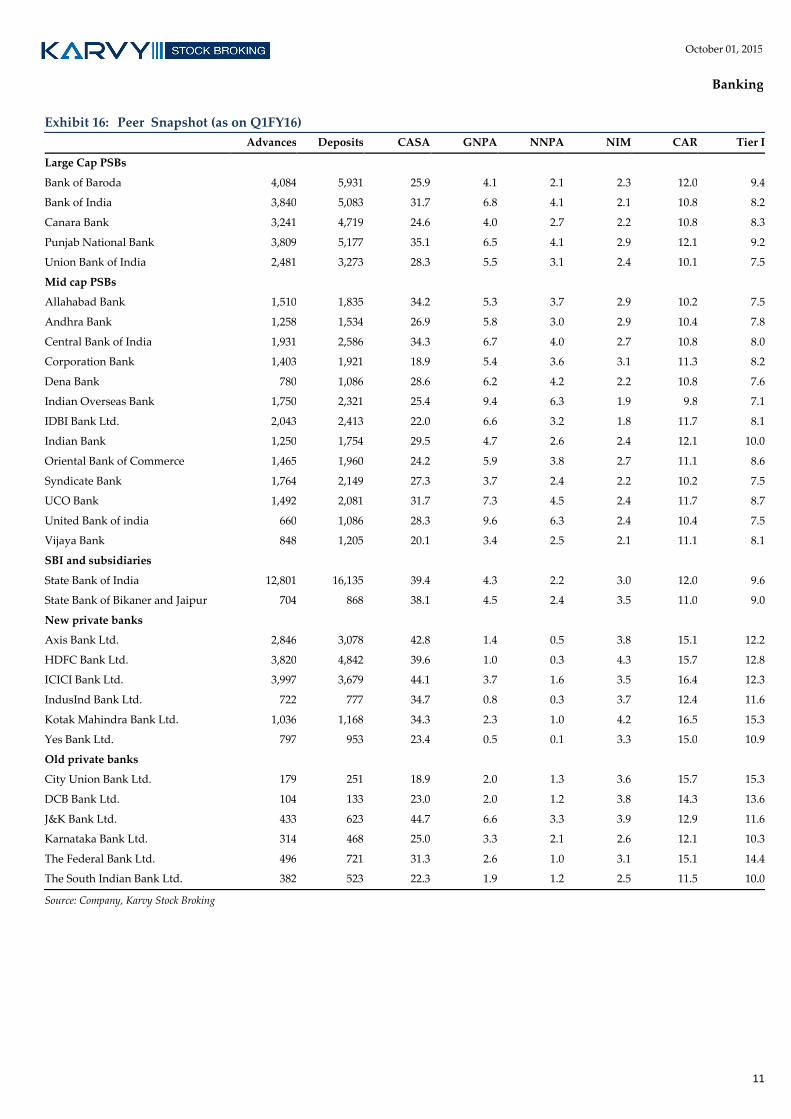
Exhibit 16: Peer Snapshot (as on Q1FY16)
Advances Deposits CASA GNPA NNPA NIM CAR Tier I
Large Cap PSBs
Bank of Baroda 4,084 5,931 25.9 4.1 2.1 2.3 12.0 9.4
Bank of India 3,840 5,083 31.7 6.8 4.1 2.1 10.8 8.2
Canara Bank 3,241 4,719 24.6 4.0 2.7 2.2 10.8 8.3
Punjab National Bank 3,809 5,177 35.1 6.5 4.1 2.9 12.1 9.2
Union Bank of India 2,481 3,273 28.3 5.5 3.1 2.4 10.1 7.5
Mid cap PSBs
Allahabad Bank 1,510 1,835 34.2 5.3 3.7 2.9 10.2 7.5
Andhra Bank 1,258 1,534 26.9 5.8 3.0 2.9 10.4 7.8
Central Bank of India 1,931 2,586 34.3 6.7 4.0 2.7 10.8 8.0
Corporation Bank 1,403 1,921 18.9 5.4 3.6 3.1 11.3 8.2
Dena Bank 780 1,086 28.6 6.2 4.2 2.2 10.8 7.6
Indian Overseas Bank 1,750 2,321 25.4 9.4 6.3 1.9 9.8 7.1
IDBI Bank Ltd. 2,043 2,413 22.0 6.6 3.2 1.8 11.7 8.1
Indian Bank 1,250 1,754 29.5 4.7 2.6 2.4 12.1 10.0
Oriental Bank of Commerce 1,465 1,960 24.2 5.9 3.8 2.7 11.1 8.6
Syndicate Bank 1,764 2,149 27.3 3.7 2.4 2.2 10.2 7.5
UCO Bank 1,492 2,081 31.7 7.3 4.5 2.4 11.7 8.7
United Bank of india 660 1,086 28.3 9.6 6.3 2.4 10.4 7.5
Vijaya Bank 848 1,205 20.1 3.4 2.5 2.1 11.1 8.1
SBI and subsidiaries
State Bank of India 12,801 16,135 39.4 4.3 2.2 3.0 12.0 9.6
State Bank of Bikaner and Jaipur 704 868 38.1 4.5 2.4 3.5 11.0 9.0
New private banks
Axis Bank Ltd. 2,846 3,078 42.8 1.4 0.5 3.8 15.1 12.2
HDFC Bank Ltd. 3,820 4,842 39.6 1.0 0.3 4.3 15.7 12.8
ICICI Bank Ltd. 3,997 3,679 44.1 3.7 1.6 3.5 16.4 12.3
IndusInd Bank Ltd. 722 777 34.7 0.8 0.3 3.7 12.4 11.6
Kotak Mahindra Bank Ltd. 1,036 1,168 34.3 2.3 1.0 4.2 16.5 15.3
Yes Bank Ltd. 797 953 23.4 0.5 0.1 3.3 15.0 10.9
Old private banks
City Union Bank Ltd. 179 251 18.9 2.0 1.3 3.6 15.7 15.3
DCB Bank Ltd. 104 133 23.0 2.0 1.2 3.8 14.3 13.6
J&K Bank Ltd. 433 623 44.7 6.6 3.3 3.9 12.9 11.6
Karnataka Bank Ltd. 314 468 25.0 3.3 2.1 2.6 12.1 10.3
The Federal Bank Ltd. 496 721 31.3 2.6 1.0 3.1 15.1 14.4
The South Indian Bank Ltd. 382 523 22.3 1.9 1.2 2.5 11.5 10.0
Source: Company, Karvy Stock Broking
Banking October 01, 2015
Axis Bank
Bloomberg: AXSB IN Reuters: AXBK.BO
BUY
India Research
VISIT NOTE
Recommendation
CMP: Rs496
Target Price: Rs735
Previous Target Price: Rs735
Upside (%) 48%
Stock Information Market Cap. (Rs bn / US$ mn) 1,208/18,258
52-week High/Low (Rs) 655/370
3m ADV (Rs mn /US$ mn) 3,984/60.2
Beta 1.4
Sensex/ Nifty 26,392/8,002
Share outstanding (mn) 2,377
Stock Performance (%) 1M 3M 12M YTD
Absolute (9.5) (11.6) 27.9 1.1
Rel. to Sensex (5.8) (7.8) 29.1 5.4
Performance
Source: Bloomberg
Analysts Contact Ankit Ladhani
+91 22 6184 4329
300
400
500
600
700
15,500
19,500
23,500
27,500
31,500
Sep
-14
Oct
-14
Dec
-14
Jan
-15
Feb
-15
Ap
r-1
5
May
-15
Jun
-15
Au
g-1
5
Sep
-15
Sensex (LHS) Axis Bank (RHS)
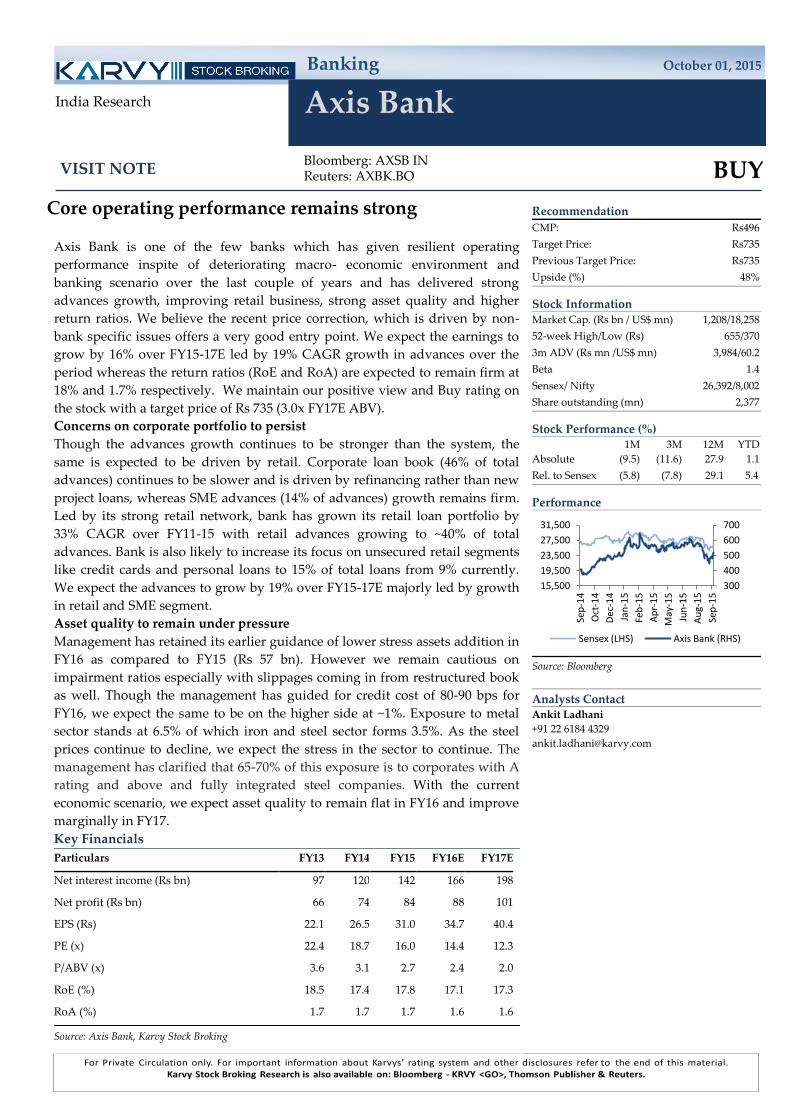
Core operating performance remains strong
Axis Bank is one of the few banks which has given resilient operating
performance inspite of deteriorating macro- economic environment and
banking scenario over the last couple of years and has delivered strong
advances growth, improving retail business, strong asset quality and higher
return ratios. We believe the recent price correction, which is driven by non-
bank specific issues offers a very good entry point. We expect the earnings to
grow by 16% over FY15-17E led by 19% CAGR growth in advances over the
period whereas the return ratios (RoE and RoA) are expected to remain firm at
18% and 1.7% respectively. We maintain our positive view and Buy rating on
the stock with a target price of Rs 735 (3.0x FY17E ABV).
Concerns on corporate portfolio to persist
Though the advances growth continues to be stronger than the system, the
same is expected to be driven by retail. Corporate loan book (46% of total
advances) continues to be slower and is driven by refinancing rather than new
project loans, whereas SME advances (14% of advances) growth remains firm.
Led by its strong retail network, bank has grown its retail loan portfolio by
33% CAGR over FY11-15 with retail advances growing to ~40% of total
advances. Bank is also likely to increase its focus on unsecured retail segments
like credit cards and personal loans to 15% of total loans from 9% currently.
We expect the advances to grow by 19% over FY15-17E majorly led by growth
in retail and SME segment.
Asset quality to remain under pressure
Management has retained its earlier guidance of lower stress assets addition in
FY16 as compared to FY15 (Rs 57 bn). However we remain cautious on
impairment ratios especially with slippages coming in from restructured book
as well. Though the management has guided for credit cost of 80-90 bps for
FY16, we expect the same to be on the higher side at ~1%. Exposure to metal
sector stands at 6.5% of which iron and steel sector forms 3.5%. As the steel
prices continue to decline, we expect the stress in the sector to continue. The
management has clarified that 65-70% of this exposure is to corporates with A
rating and above and fully integrated steel companies. With the current
economic scenario, we expect asset quality to remain flat in FY16 and improve
marginally in FY17.
Key Financials
Particulars FY13 FY14 FY15 FY16E FY17E
Net interest income (Rs bn) 97 120 142 166 198
Net profit (Rs bn) 66 74 84 88 101
EPS (Rs) 22.1 26.5 31.0 34.7 40.4
PE (x) 22.4 18.7 16.0 14.4 12.3
P/ABV (x) 3.6 3.1 2.7 2.4 2.0
RoE (%) 18.5 17.4 17.8 17.1 17.3
RoA (%) 1.7 1.7 1.7 1.6 1.6
Source: Axis Bank, Karvy Stock Broking

13
October 01, 2015
Axis Bank
Unsecured retail segment to drive retail advances
Bank is currently focusing on unsecured personal and credit card loans to drive
the retail advances growth. However housing loans (48% of retail advances) is
expected to report slower growth as will mainly be driven by tier II- IV cities
whereas LAP loan (8% of retail loans) growth is expected to remain strong.
CASA ratio improvement continues
Without the aid of differentiated savings rate, savings account deposits have
grown by 21% CAGR over FY11-15. Share of retail deposits as % of total deposits
increased from 59% in FY11 to 78.5% in Q1FY16. CASA share stands at 42.8% as at
the end of Jun-15. With increased competition expected to come in from the new
private banks, payment banks as well as small finance bank we expect growth in
savings accounts to be slower going ahead. Though Axis will maintain its current
CASA share, any rapid further expansion is likely to be difficult.
NIMs likely to remain stable
Though the bank is targeting growth in the high yielding unsecured retail segment
to support NIMs, led by growth from corporate advances at competitive rates, and
slower CASA growth, we expect the NIMs for the bank to remain largely stable.
Inspite of a decline in interest rates expected in the markets to continue, we expect
Axis to maintain its NIM at ~3.5% going ahead.
Valuation and Outlook
Axis Bank currently remains one of the few banks who have maintained its asset
quality along with advances growth inspite of economic slowdown. We believe
the recent price correction, which is driven by non-bank specific issues offers a
very good entry point. We expect the earnings to grow by 16% over FY15-17E led
by 19% CAGR growth in advances over the period whereas the return ratios (RoE
and RoA) are expected to remain firm at 18% and 1.7% respectively. We maintain
our positive view and Buy rating on the stock with a target price of Rs 735 (3.0X
FY17E ABV).
14
October 01, 2015
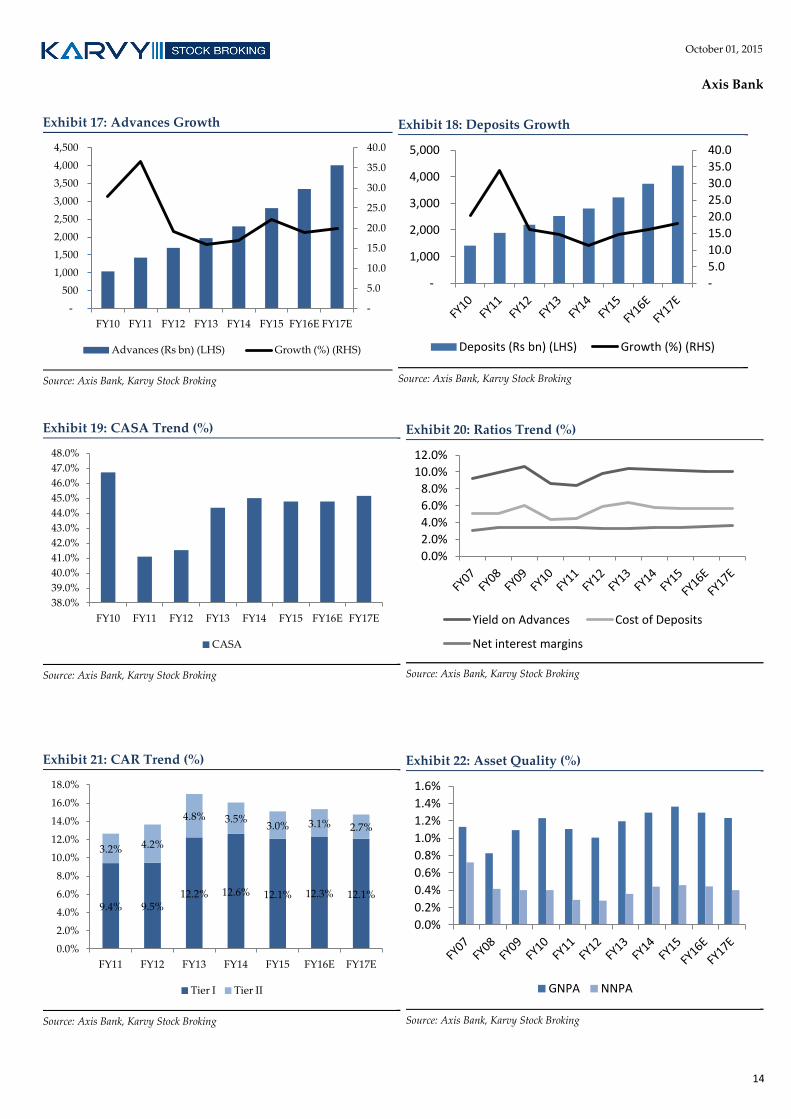
Axis Bank
Exhibit 17: Advances Growth
Source: Axis Bank, Karvy Stock Broking
Exhibit 18: Deposits Growth
Source: Axis Bank, Karvy Stock Broking
Exhibit 19: CASA Trend (%)
Source: Axis Bank, Karvy Stock Broking
Exhibit 20: Ratios Trend (%)
Source: Axis Bank, Karvy Stock Broking
Exhibit 21: CAR Trend (%)
Source: Axis Bank, Karvy Stock Broking
Exhibit 22: Asset Quality (%)
Source: Axis Bank, Karvy Stock Broking
-
5.0
10.0
15.0
20.0
25.0
30.0
35.0
40.0
-
500
1,000
1,500
2,000
2,500
3,000
3,500
4,000
4,500
FY10 FY11 FY12 FY13 FY14 FY15 FY16E FY17E
Advances (Rs bn) (LHS) Growth (%) (RHS)
-
5.0
10.0
15.0
20.0
25.0
30.0
35.0
40.0
-
1,000
2,000
3,000
4,000
5,000
Deposits (Rs bn) (LHS) Growth (%) (RHS)
38.0%
39.0%
40.0%
41.0%
42.0%
43.0%
44.0%
45.0%
46.0%
47.0%
48.0%
FY10 FY11 FY12 FY13 FY14 FY15 FY16E FY17E
CASA
0.0%
2.0%
4.0%
6.0%
8.0%
10.0%
12.0%
Yield on Advances Cost of Deposits
Net interest margins
9.4% 9.5% 12.2% 12.6% 12.1% 12.3% 12.1%
3.2% 4.2%
4.8% 3.5% 3.0% 3.1% 2.7%
0.0%
2.0%
4.0%
6.0%
8.0%
10.0%
12.0%
14.0%
16.0%
18.0%
FY11 FY12 FY13 FY14 FY15 FY16E FY17E
Tier I Tier II
0.0%
0.2%
0.4%
0.6%
0.8%
1.0%
1.2%
1.4%
1.6%
GNPA NNPA
15
October 01, 2015
Axis Bank
Exhibit 23: Profit and Loss Statement
P &L statement (Rs bn) FY13 FY14 FY15 FY16E FY17E
Interest income 272 306 355 418 494
Interest Expenses 175 187 213 252 296
Net interest income 97 120 142 166 198
Non-interest income 66 74 84 88 101
Fee Income 50 54 61 70 80
Net total income 162 194 226 254 299
Operating expenses 69 79 92 107 125
Employee Expenses 24 26 31 37 44
Pre-provisioning profit 93 115 134 148 173
Provision & Contingency 18 21 23 24 30
PBT 76 93 111 123 144
Tax 24 31 37 41 48
PAT 52 62 74 82 96
Source: Axis Bank, Karvy Stock Broking
Exhibit 24: Balance Sheet
Particulars (Rs bn) FY13 FY14 FY15 FY16E FY17E
Liabilities
Networth 331 382 447 514 593
Deposits 2,526 2,809 3,224 3,740 4,414
Current Deposits 483 487 561 651 775
Savings Deposits 638 778 883 1,024 1,219
Borrowings 440 503 798 1,048 1,216
Other liabilities & provisions 109 138 151 149 180
Total liabilities 3,406 3,832 4,619 5,451 6,403
Assets
Cash & balances with RBI 148 170 198 215 254
Balances with banks & money at call 56 112 163 112 132
Investments 1,137 1,135 1,323 1,511 1,739
Advances 1,970 2,301 2,811 3,345 4,014
Fixed assets 24 24 25 30 36
Other assets 71 90 99 238 228
Total assets 3,406 3,832 4,619 5,451 6,403
Source: Axis Bank, Karvy Stock Broking
16
October 01, 2015
Axis Bank
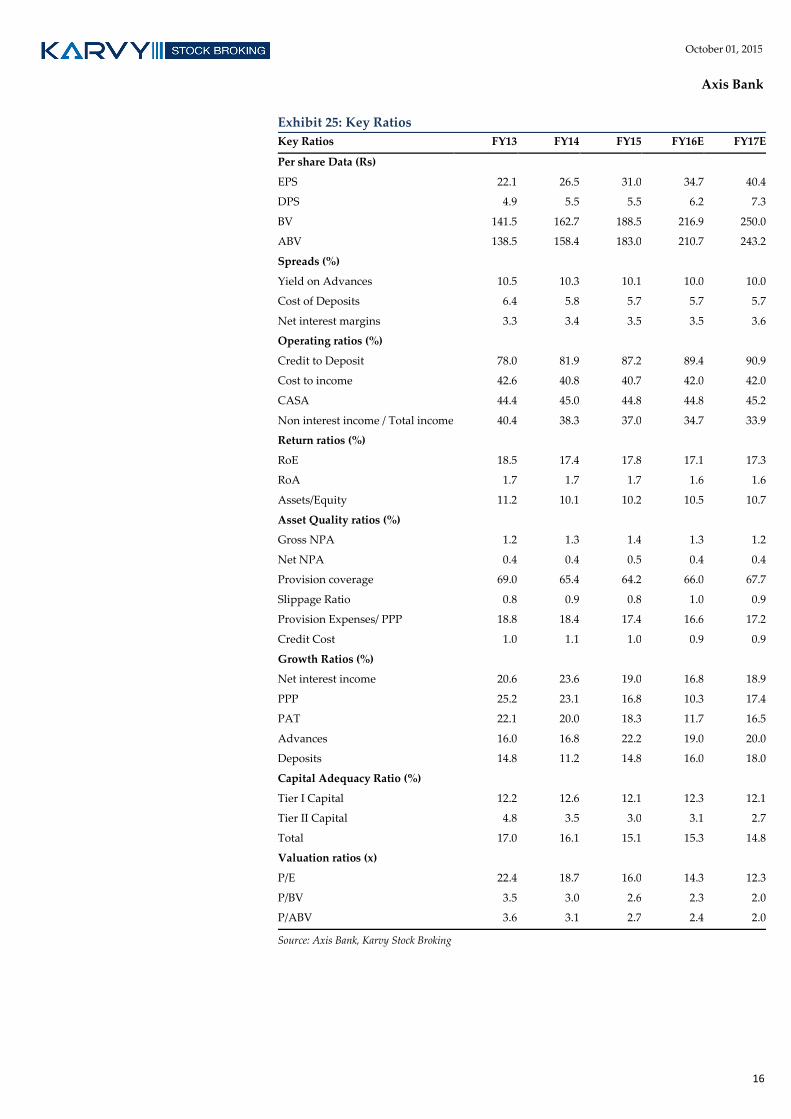
Exhibit 25: Key Ratios
Key Ratios FY13 FY14 FY15 FY16E FY17E
Per share Data (Rs)
EPS 22.1 26.5 31.0 34.7 40.4
DPS 4.9 5.5 5.5 6.2 7.3
BV 141.5 162.7 188.5 216.9 250.0
ABV 138.5 158.4 183.0 210.7 243.2
Spreads (%)
Yield on Advances 10.5 10.3 10.1 10.0 10.0
Cost of Deposits 6.4 5.8 5.7 5.7 5.7
Net interest margins 3.3 3.4 3.5 3.5 3.6
Operating ratios (%)
Credit to Deposit 78.0 81.9 87.2 89.4 90.9
Cost to income 42.6 40.8 40.7 42.0 42.0
CASA 44.4 45.0 44.8 44.8 45.2
Non interest income / Total income 40.4 38.3 37.0 34.7 33.9
Return ratios (%)
RoE 18.5 17.4 17.8 17.1 17.3
RoA 1.7 1.7 1.7 1.6 1.6
Assets/Equity 11.2 10.1 10.2 10.5 10.7
Asset Quality ratios (%)
Gross NPA 1.2 1.3 1.4 1.3 1.2
Net NPA 0.4 0.4 0.5 0.4 0.4
Provision coverage 69.0 65.4 64.2 66.0 67.7
Slippage Ratio 0.8 0.9 0.8 1.0 0.9
Provision Expenses/ PPP 18.8 18.4 17.4 16.6 17.2
Credit Cost 1.0 1.1 1.0 0.9 0.9
Growth Ratios (%)
Net interest income 20.6 23.6 19.0 16.8 18.9
PPP 25.2 23.1 16.8 10.3 17.4
PAT 22.1 20.0 18.3 11.7 16.5
Advances 16.0 16.8 22.2 19.0 20.0
Deposits 14.8 11.2 14.8 16.0 18.0
Capital Adequacy Ratio (%)
Tier I Capital 12.2 12.6 12.1 12.3 12.1
Tier II Capital 4.8 3.5 3.0 3.1 2.7
Total 17.0 16.1 15.1 15.3 14.8
Valuation ratios (x)
P/E 22.4 18.7 16.0 14.3 12.3
P/BV 3.5 3.0 2.6 2.3 2.0
P/ABV 3.6 3.1 2.7 2.4 2.0
Source: Axis Bank, Karvy Stock Broking
Banking October 01, 2015
Bank of Baroda
Bloomberg: BOB IN Reuters: BOB.BO
HOLD
India Research
VISIT NOTE
Recommendation
CMP: Rs183
Target Price: Rs200
Previous Target Price: Rs185
Upside (%) 9%
Stock Information Market Cap. (Rs bn / US$ mn) 396/5,954
52-week High/Low (Rs) 229/137
3m ADV (Rs mn /US$ mn) 1,580/23.8
Beta 1.4
Sensex/ Nifty 25,622/7,788
Share outstanding (mn) 2,211
Stock Performance (%) 1M 3M 12M YTD
Absolute (1.7) 17.0 (1.3) (17.5)
Rel. to Sensex 7.8 22.6 4.3 (11.4)
Performance
Source: Bloomberg
Analysts Contact Ankit Ladhani
+91 22 6184 4329
100
150
200
250
15,500
19,500
23,500
27,500
31,500
Oct
-14
No
v-1
4
Dec
-14
Feb
-15
Mar
-15
Ap
r-1
5
Jun
-15
Jul-
15
Au
g-1
5
Sensex (LHS) Bank of Baroda (RHS)
Not out of woods yet
Slower credit growth followed by deteriorating asset quality continues as a
hangover for the banking sector especially PSBs. Though the performance of BoB
has been much better as compared to other PSBs, macro headwinds continue to
impact the financials. Though with the appointment of private sector
professionals as Chairman and MD & CEO, the operations are likely to improve,
but will likely take some time. Advances growth is expected to slowdown to
high single digits along with likely pressure on NIMs and slippages from
restructured book. Earnings are expected to grow by 32% CAGR over FY15-17E
led by 11% growth in advances over the period. Though we remain cautious on
the PSBs we believe BoB is likely to be the key beneficiary of economic revival.
We upgrade the long term multiple of the stock from 1x to 1.1x but retain our
Hold rating with a TP of Rs200 (1.1x FY17E ABV).
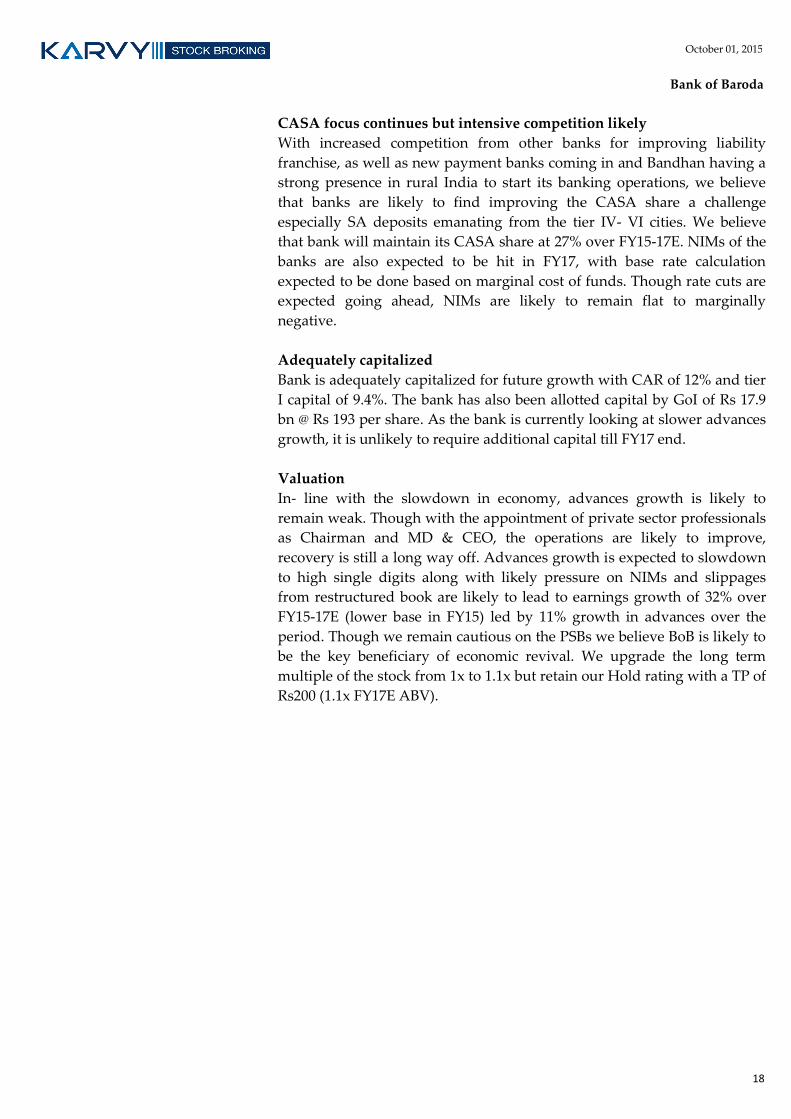
Advances growth to remain weak
After weak advances growth of 7.8% in FY15, growth is expected to be in the
high single digits led by declining corporate advances (24.6% of total advances)
due to lack of new project loans as well as competitive interest rates being
offered by private banks. Retail advances (12.7%) growth is expected to be
higher led by home loans whereas SME advances (15%) are expected to grow by
4-5%. Growth in international business (33%) is also expected to remain under
pressure however rupee depreciation is likely to support the same. Historically
advances have grown by 24.5% over FY08-14, however under the current
economic scenario we expect advances to grow by 11% over FY15-17E with
economic recovery still remaining evasive along with below average monsoons
which is likely to impact agri advances growth.
Asset quality to remain under pressure
With economic recovery being evasive, as well as issues for banking sector
continuing to elevate, we expect slippages to remain higher. Asset quality has
deteriorated sharply in the last few years as GNPA and NNPA increased from
1.5% and 0.5% in FY12 to 4.1% and 2.1% in Q1FY16. Slippages continue to
remain elevated with FY15 slippages at Rs 85 bn followed by Rs 19 bn slippages
in Q1FY16. MSME advances have the highest NPAs of 8.4% followed by
corporate advances at 7.7% and agri advances at 5.7%. For FY16 and FY17,
slippages from restructured book are expected to be higher. With deficit
monsoons, agri sector might report higher GNPA in FY16. With iron and steel
exposure of ~ Rs 300 bn, slippages in FY16 are expected to be ~ Rs 80 bn as well.
PCR of the bank has also deteriorated from 80% in FY12 to 65% in FY15. We
expect GNPA and NNPA at 3.9% and 1.9% for FY16.
Key Financials
Particulars FY13 FY14 FY15 FY16E FY17E
Net interest income 11,315 11,965 13,187 15,363 17,318
Net profit 4,481 4,541 3,398 5,054 5,939
EPS 21.2 21.1 15.3 21.8 25.5
PE (x) 8.6 8.7 12.0 8.4 7.2
P/ABV (x) 1.4 1.3 1.3 1.2 1.0
RoE (%) 15.1 13.4 9.0 11.8 12.4
RoA (%) 0.8 0.7 0.5 0.6 0.7
Source: Bank of Baroda, Karvy Stock Broking
18
October 01, 2015
Bank of Baroda
CASA focus continues but intensive competition likely
With increased competition from other banks for improving liability
franchise, as well as new payment banks coming in and Bandhan having a
strong presence in rural India to start its banking operations, we believe
that banks are likely to find improving the CASA share a challenge
especially SA deposits emanating from the tier IV- VI cities. We believe
that bank will maintain its CASA share at 27% over FY15-17E. NIMs of the
banks are also expected to be hit in FY17, with base rate calculation
expected to be done based on marginal cost of funds. Though rate cuts are
expected going ahead, NIMs are likely to remain flat to marginally
negative.
Adequately capitalized
Bank is adequately capitalized for future growth with CAR of 12% and tier
I capital of 9.4%. The bank has also been allotted capital by GoI of Rs 17.9
bn @ Rs 193 per share. As the bank is currently looking at slower advances
growth, it is unlikely to require additional capital till FY17 end.
Valuation
In- line with the slowdown in economy, advances growth is likely to
remain weak. Though with the appointment of private sector professionals
as Chairman and MD & CEO, the operations are likely to improve,
recovery is still a long way off. Advances growth is expected to slowdown
to high single digits along with likely pressure on NIMs and slippages
from restructured book are likely to lead to earnings growth of 32% over
FY15-17E (lower base in FY15) led by 11% growth in advances over the
period. Though we remain cautious on the PSBs we believe BoB is likely to
be the key beneficiary of economic revival. We upgrade the long term
multiple of the stock from 1x to 1.1x but retain our Hold rating with a TP of
Rs200 (1.1x FY17E ABV).
19
October 01, 2015
Bank of Baroda
Exhibit 26: Advances Growth
Source: Bank of Baroda, Karvy Stock Broking
Exhibit 27: Deposits Growth
Source: Bank of Baroda, Karvy Stock Broking
Exhibit 28: NIM Trend (%)
Source: Bank of Baroda, Karvy Stock Broking
Exhibit 29: Cost to Income Ratio Trend (%)
Source: Bank of Baroda, Karvy Stock Broking
Exhibit 30: CASA Trend (%)
Source: Bank of Baroda, Karvy Stock Broking
Exhibit 31: Asset Quality (%)
Source: Bank of Baroda, Karvy Stock Broking
-
5.0
10.0
15.0
20.0
25.0
30.0
35.0
40.0
45.0
-
1,000
2,000
3,000
4,000
5,000
6,000
FY
05
FY
06
FY
07
FY
08
FY
09
FY
10
FY
11
FY
12
FY
13
FY
14
FY
15
FY
16E
FY
17E
Advances (Rs bn) Growth (%)(LHS)
-
5.0
10.0
15.0
20.0
25.0
30.0
35.0
40.0
-
1,000
2,000
3,000
4,000
5,000
6,000
7,000
8,000
FY
05
FY
06
FY
07
FY
08
FY
09
FY
10
FY
11
FY
12
FY
13
FY
14
FY
15
FY
16E
FY
17E
Deposits (Rs bn) Growth (%)(RHS)
-
0.5
1.0
1.5
2.0
2.5
3.0
3.5
4.0
NIM
-
10.0
20.0
30.0
40.0
50.0
60.0
Cost to Income ratio
-
5.0
10.0
15.0
20.0
25.0
30.0
35.0
40.0
CASA
-
1.0
2.0
3.0
4.0
5.0
6.0
7.0
8.0
GNPA NNPA
20
October 01, 2015
Bank of Baroda
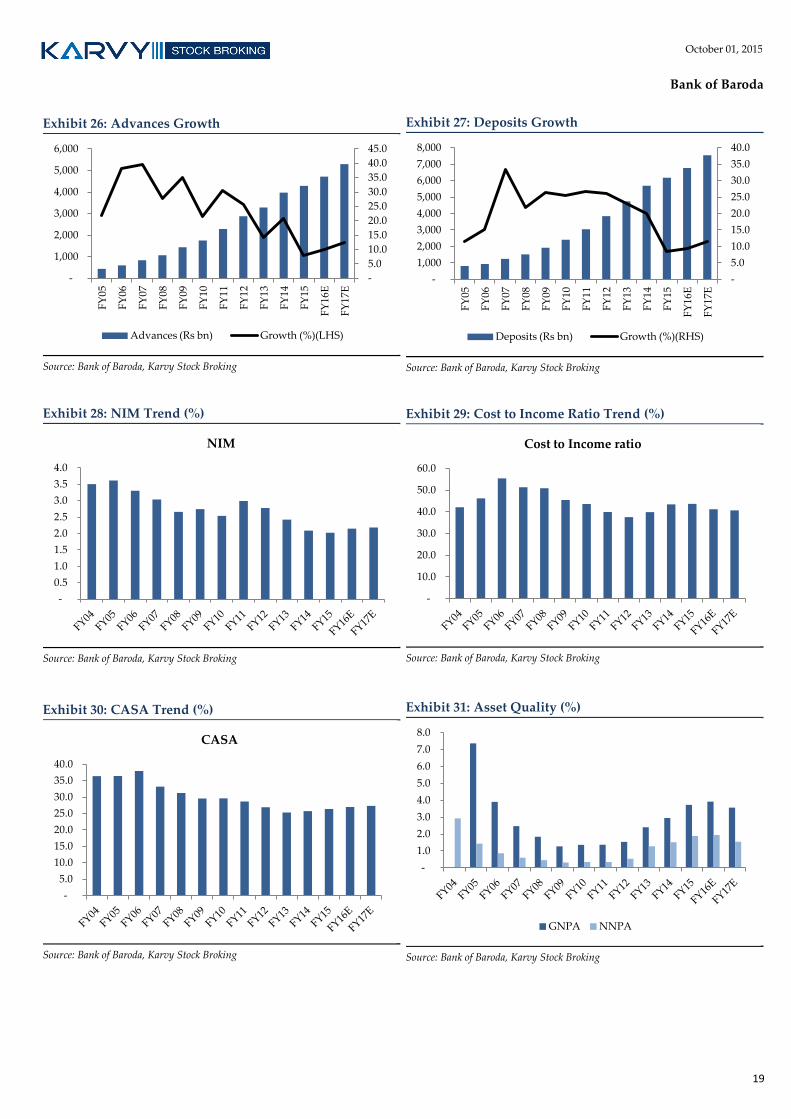
Exhibit 32: Profit and Loss Statement
P &L statement (Rs bn) FY13 FY14 FY15 FY16E FY17E
Interest Income 352 389 430 475 525
Interest Expense 239 270 298 321 352
Net interest income 113 120 132 154 173
Non-interest income 36 45 44 49 51
Fee Income 13 14 15 17 19
Net total income 149 164 176 203 224
Operating expenses 59 71 77 84 91
Employee Expenses 34 41 43 46 50
Pre-provisioning profit 90 93 99 119 133
Provision & Contingency 42 38 45 44 44
PBT 48 55 54 75 89
Tax 4 10 20 25 29
PAT 45 45 34 51 59
Source: Bank of Baroda, Karvy Stock Broking
Exhibit 33: Balance Sheet
Particulars (Rs bn) FY13 FY14 FY15 FY16E FY17E
Liabilities
Networth 320 360 398 457 504
Deposits 4,739 5,689 6,176 6,762 7,540
Current Deposits 357 501 528 591 668
Savings Deposits 843 964 1,102 1,234 1,394
Borrowings 266 368 353 336 339
Other liabilities & provisions 147 178 223 273 276
Total liabilities 5,471 6,595 7,150 7,829 8,659
Assets
Cash & balances with RBI 135 186 225 230 256
Balances with banks & money at call 719 1,122 1,259 1,296 1,335
Investments 1,214 1,161 1,223 1,531 1,682
Advances 3,282 3,970 4,281 4,709 5,297
Fixed assets 25 27 29 30 32
Other assets 97 128 134 32 56
Total assets 5,471 6,595 7,150 7,829 8,659
Source: Bank of Baroda, Karvy Stock Broking

21
October 01, 2015
Bank of Baroda
Exhibit 34: Key Ratios
Key Ratios FY13 FY14 FY15 FY16E FY17E
Per share Data (Rs)
EPS 21.2 21.1 15.3 21.8 25.5
DPS 5.0 5.0 3.8 3.7 4.3
BV 151.3 167.1 179.1 196.6 216.5
ABV 131.5 139.1 142.8 157.2 181.4
Spreads (%)
Yield on Advances 8.4 7.7 7.5 7.5 7.3
Cost of Deposits 5.2 4.8 4.7 4.6 4.6
Net interest margins 2.4 2.1 2.0 2.1 2.2
Operating ratios (%)
Credit to Deposit 69.3 69.8 69.3 69.6 70.3
Cost to income 39.8 43.4 43.6 41.2 40.6
CASA 25.3 25.7 26.4 27.0 27.4
Non interest income / Total income 24.3 27.2 25.0 24.3 22.7
Return ratios (%)
RoE 15.1 13.4 9.0 11.8 12.4
RoA 0.9 0.8 0.5 0.7 0.7
Assets/Equity 16.7 17.8 18.1 17.5 17.2
Asset Quality ratios (%)
Gross NPA 2.4 2.9 3.7 3.9 3.6
Net NPA 1.3 1.5 1.9 1.9 1.5
Provision coverage 47.5 49.2 50.4 51.5 57.8
Slippage Ratio 2.4 2.1 2.1 2.1 1.8
Provision Expenses/ PPP 46.3 40.8 45.3 36.8 33.4
Credit Cost 1.4 1.1 1.1 1.0 0.9
Growth Ratios (%)
Net interest income 9.7 5.7 10.2 16.5 12.7
PPP 4.9 3.2 6.7 20.4 11.5
PAT (10.5) 1.3 (25.2) 48.7 17.5
Advances 14.2 21.0 7.8 10.0 12.5
Deposits 23.1 20.0 8.6 9.5 11.5
Capital Adequacy Ratio (%)
Total Capital 13.3 12.3 12.6 13.1 12.9
Tier I 10.1 9.3 9.9 10.9 10.8
Tier II 3.2 3.0 2.7 2.2 2.1
Valuation ratios (x)
P/E 8.6 8.7 12.0 8.4 7.2
P/BV 1.2 1.1 1.0 0.9 0.8
P/ABV 1.4 1.3 1.3 1.2 1.0
Source: Bank of Baroda, Karvy Stock Broking
Banking October 01, 2015
DCB Bank
Bloomberg: DCBB IN Reuters: DCBA.BO
SELL
India Research
VISIT NOTE
Recommendation
CMP: Rs143
Target Price: Rs142
Previous Target Price: Rs142
Upside (%) 0%
Stock Information Market Cap. (Rs bn / US$ mn) 36/538
52-week High/Low (Rs) 151/79
3m ADV (Rs mn /US$ mn) 203/3.0
Beta 1.0
Sensex/ Nifty 25,964/7,899
Share outstanding (mn) 283
Stock Performance (%) 1M 3M 12M YTD
Absolute (8) (1.8) 47.6 4.2
Rel. to Sensex (0.6) 0.9 50.6 10.4
Performance
Source: Bloomberg
Analysts Contact Ankit Ladhani
+91 22 6184 4329
35 55 75 95 115 135 155
5,000 10,000 15,000 20,000 25,000 30,000 35,000
Oct
-14
No
v-1
4
Dec
-14
Jan
-15
Mar
-15
Ap
r-1
5
May
-15
Jul-
15
Au
g-1
5
Sep
-15
Sensex (LHS) DCB Bank (RHS)
Small player with large aspirations; positives priced in DCB Bank is one of the smallest listed private sector bank and is not linked to
any of the large corporate accounts. Though the bank continues to report
comparatively stable asset quality despite the slowdown in the economy, the
same is likely to deteriorate. Though mortgage loans will continue to drive
advances growth, NIMs are likely to reduce by 5-10 bps in FY16 with
additional stress expected due to new base rate calculation norms in FY17. We
expect the earnings of the bank to grow by 25% over FY15-17E led by 27.5%
growth in advances over the period. As the bank has become fully tax-paying,
it is expected to report lower RoE for FY16 and FY17. However we believe the
current market price factors in all positives. We expect asset quality to
deteriorate over the next 2-3 quarters. We have maintained our estimates for
FY16 and FY17 and our target price. Due to price run-up, we downgrade the
stock to Sell with a target price of Rs142 (2.1x FY17E ABV).
Strong advances growth to continue; mortgage book to drive growth
Bank has maintained its target to double its advances book in 3-4 years. Inspite
of the current economic slowdown, DCB continues to expand its advances
book by 26% YoY in Q1FY16. Historically advances for the bank have grown by
25% CAGR over FY10-15 driven by home loans which have reported a CAGR
growth of 61% over the period. Corporate (21% of total advances) and SME
advances (18%) growth is likely to remain muted in FY16 whereas home loans
(45%) are expected to drive the overall advances growth. LAP loan forms 75%
of the home loans portfolio which garner higher yields. Bank plans to maintain
its strong presence in the mortgage business. We expect the advances to grow
by 27.5% over FY15-17E.
Asset quality pressure likely
Asset quality of the bank which reported deterioration in Q1FY16, is expected
to witness further pressure as the economic slowdown continues to impact the
repayment capacities. With increasing stress in the economy, slippages are
expected to be higher for the bank. Though GNPA may remain stable in %
terms, due to strong advances growth, in absolute terms, GNPA are expected
grow strongly. Among GNPA, corporate advances report the highest GNPA
(4.6%) followed by SME advances of 2.3% whereas mortgage book GNPA
stands at 0.7% as on Q1FY16. Due to its smaller size, bank has no exposure to
SEBs and is not part of any of the large infra or other projects and hence does
not face refinancing pressure under 5-25 scheme and is not part of any JLFs.
Key Financials
Particulars FY13 FY14 FY15 FY16E FY17E
Net interest income (Rs mn) 2,844 3,684 5,082 6,353 8,014
Net profit (Rs mn) 1,021 1,514 1,912 2,099 2,988
EPS (Rs) 4.1 6.0 6.8 7.4 10.6
PE (x) 35.1 23.7 21.1 19.2 13.5
P/ABV (x) 4.0 3.5 2.8 2.5 2.1
RoE (%) 10.9 14.0 13.9 12.4 15.4
RoA (%) 0.9 1.2 1.2 1.0 1.2
Source: DCB Bank, Karvy Stock Broking
23
October 01, 2015
DCB Bank
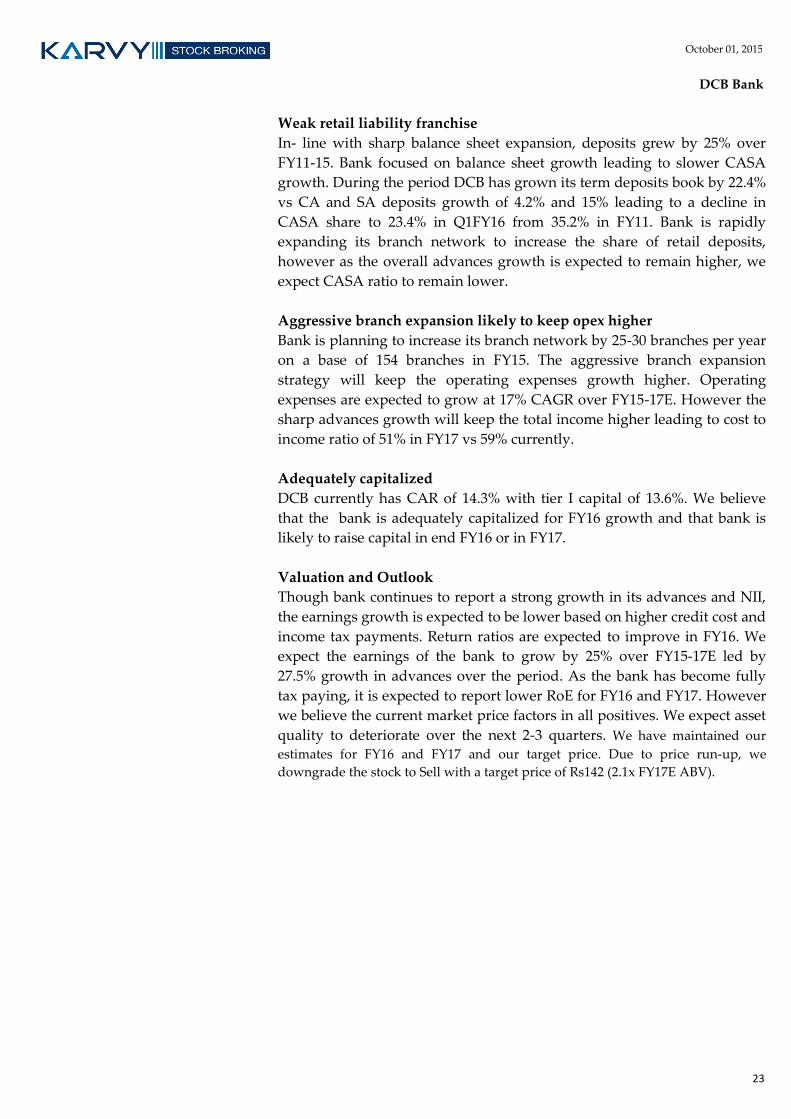
Weak retail liability franchise
In- line with sharp balance sheet expansion, deposits grew by 25% over
FY11-15. Bank focused on balance sheet growth leading to slower CASA
growth. During the period DCB has grown its term deposits book by 22.4%
vs CA and SA deposits growth of 4.2% and 15% leading to a decline in
CASA share to 23.4% in Q1FY16 from 35.2% in FY11. Bank is rapidly
expanding its branch network to increase the share of retail deposits,
however as the overall advances growth is expected to remain higher, we
expect CASA ratio to remain lower.
Aggressive branch expansion likely to keep opex higher
Bank is planning to increase its branch network by 25-30 branches per year
on a base of 154 branches in FY15. The aggressive branch expansion
strategy will keep the operating expenses growth higher. Operating
expenses are expected to grow at 17% CAGR over FY15-17E. However the
sharp advances growth will keep the total income higher leading to cost to
income ratio of 51% in FY17 vs 59% currently.
Adequately capitalized
DCB currently has CAR of 14.3% with tier I capital of 13.6%. We believe
that the bank is adequately capitalized for FY16 growth and that bank is
likely to raise capital in end FY16 or in FY17.
Valuation and Outlook
Though bank continues to report a strong growth in its advances and NII,
the earnings growth is expected to be lower based on higher credit cost and
income tax payments. Return ratios are expected to improve in FY16. We
expect the earnings of the bank to grow by 25% over FY15-17E led by
27.5% growth in advances over the period. As the bank has become fully
tax paying, it is expected to report lower RoE for FY16 and FY17. However
we believe the current market price factors in all positives. We expect asset
quality to deteriorate over the next 2-3 quarters. We have maintained our
estimates for FY16 and FY17 and our target price. Due to price run-up, we
downgrade the stock to Sell with a target price of Rs142 (2.1x FY17E ABV).
24
October 01, 2015
DCB Bank
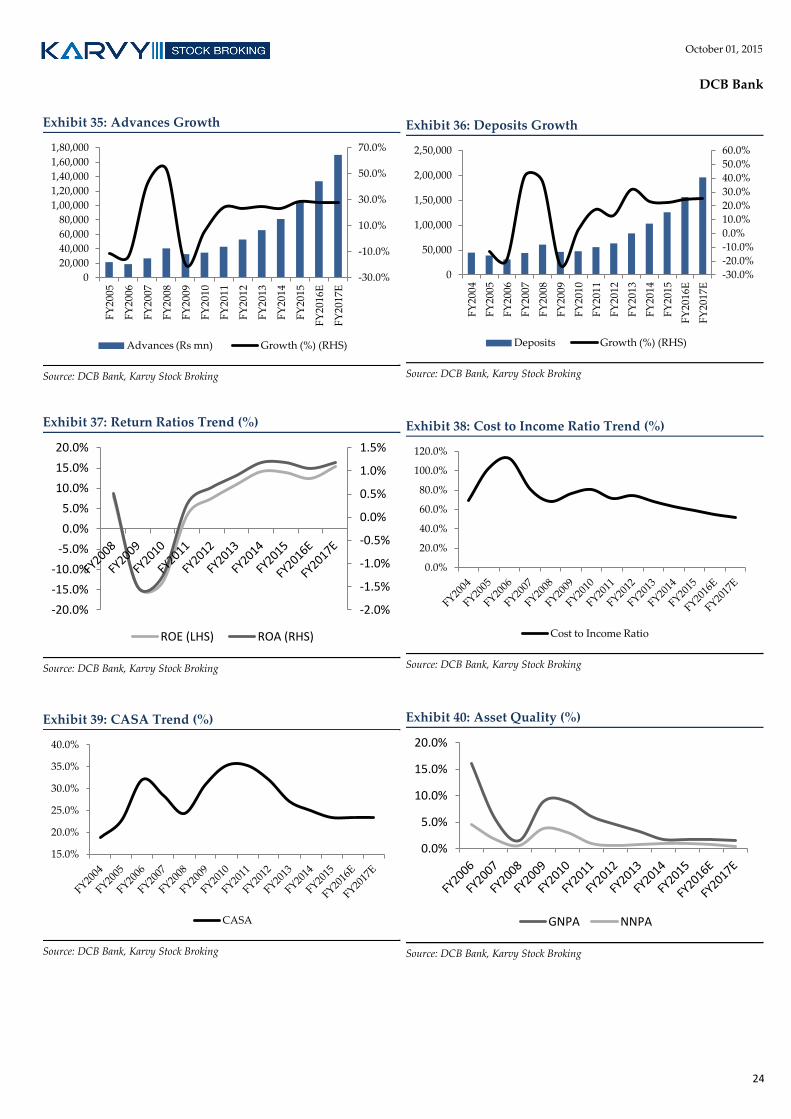
Exhibit 35: Advances Growth
Source: DCB Bank, Karvy Stock Broking
Exhibit 36: Deposits Growth
Source: DCB Bank, Karvy Stock Broking
Exhibit 37: Return Ratios Trend (%)
Source: DCB Bank, Karvy Stock Broking
Exhibit 38: Cost to Income Ratio Trend (%)
Source: DCB Bank, Karvy Stock Broking
Exhibit 39: CASA Trend (%)
Source: DCB Bank, Karvy Stock Broking
Exhibit 40: Asset Quality (%)
Source: DCB Bank, Karvy Stock Broking
-30.0%
-10.0%
10.0%
30.0%
50.0%
70.0%
0
20,000
40,000
60,000
80,000
1,00,000
1,20,000
1,40,000
1,60,000
1,80,000
FY
20
05
FY
20
06
FY
20
07
FY
20
08
FY
20
09
FY
20
10
FY
20
11
FY
20
12
FY
20
13
FY
20
14
FY
20
15
FY
2016
E
FY
2017
E
Advances (Rs mn) Growth (%) (RHS)
-30.0%
-20.0%
-10.0%
0.0%
10.0%
20.0%
30.0%
40.0%
50.0%
60.0%
0
50,000
1,00,000
1,50,000
2,00,000
2,50,000
FY
20
04
FY
20
05
FY
20
06
FY
20
07
FY
20
08
FY
20
09
FY
20
10
FY
20
11
FY
20
12
FY
20
13
FY
20
14
FY
20
15
FY
2016
E
FY
2017
E
Deposits Growth (%) (RHS)
-2.0%
-1.5%
-1.0%
-0.5%
0.0%
0.5%
1.0%
1.5%
-20.0%
-15.0%
-10.0%
-5.0%
0.0%
5.0%
10.0%
15.0%
20.0%
ROE (LHS) ROA (RHS)
0.0%
20.0%
40.0%
60.0%
80.0%
100.0%
120.0%
Cost to Income Ratio
15.0%
20.0%
25.0%
30.0%
35.0%
40.0%
CASA
0.0%
5.0%
10.0%
15.0%
20.0%
GNPA NNPA
25
October 01, 2015
DCB Bank
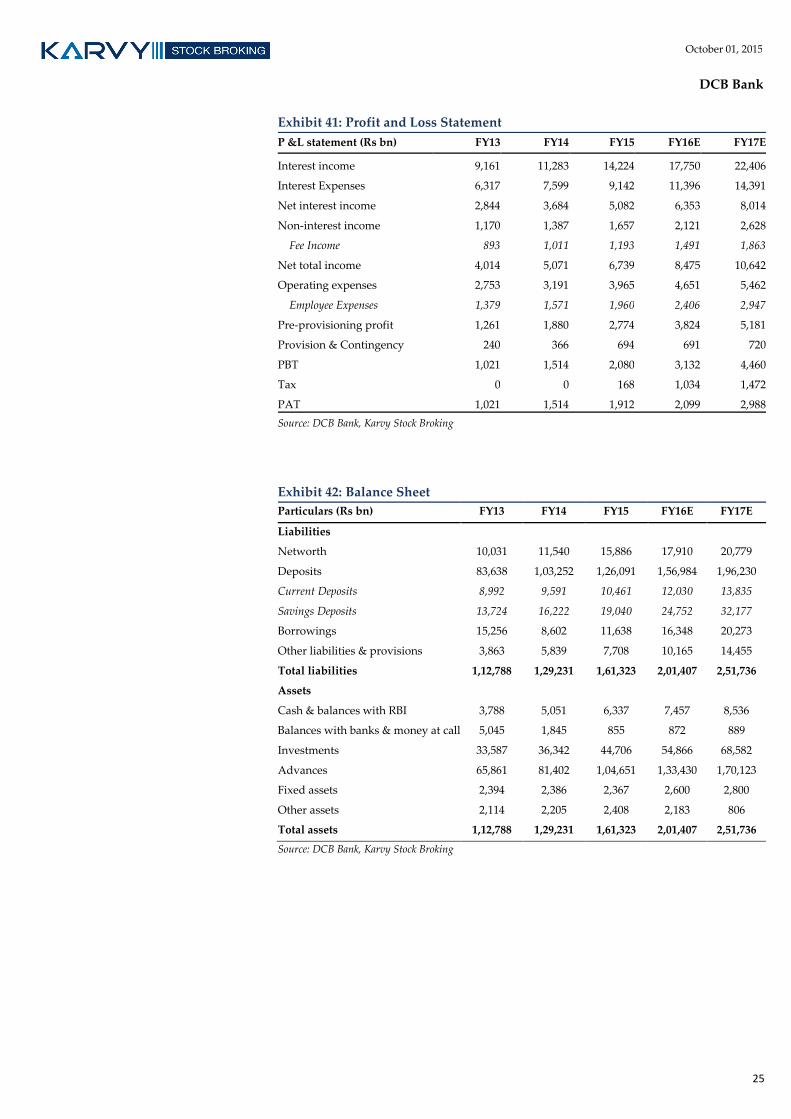
Exhibit 41: Profit and Loss Statement
P &L statement (Rs bn) FY13 FY14 FY15 FY16E FY17E
Interest income 9,161 11,283 14,224 17,750 22,406
Interest Expenses 6,317 7,599 9,142 11,396 14,391
Net interest income 2,844 3,684 5,082 6,353 8,014
Non-interest income 1,170 1,387 1,657 2,121 2,628
Fee Income 893 1,011 1,193 1,491 1,863
Net total income 4,014 5,071 6,739 8,475 10,642
Operating expenses 2,753 3,191 3,965 4,651 5,462
Employee Expenses 1,379 1,571 1,960 2,406 2,947
Pre-provisioning profit 1,261 1,880 2,774 3,824 5,181
Provision & Contingency 240 366 694 691 720
PBT 1,021 1,514 2,080 3,132 4,460
Tax 0 0 168 1,034 1,472
PAT 1,021 1,514 1,912 2,099 2,988
Source: DCB Bank, Karvy Stock Broking
Exhibit 42: Balance Sheet
Particulars (Rs bn) FY13 FY14 FY15 FY16E FY17E
Liabilities
Networth 10,031 11,540 15,886 17,910 20,779
Deposits 83,638 1,03,252 1,26,091 1,56,984 1,96,230
Current Deposits 8,992 9,591 10,461 12,030 13,835
Savings Deposits 13,724 16,222 19,040 24,752 32,177
Borrowings 15,256 8,602 11,638 16,348 20,273
Other liabilities & provisions 3,863 5,839 7,708 10,165 14,455
Total liabilities 1,12,788 1,29,231 1,61,323 2,01,407 2,51,736
Assets
Cash & balances with RBI 3,788 5,051 6,337 7,457 8,536
Balances with banks & money at call 5,045 1,845 855 872 889
Investments 33,587 36,342 44,706 54,866 68,582
Advances 65,861 81,402 1,04,651 1,33,430 1,70,123
Fixed assets 2,394 2,386 2,367 2,600 2,800
Other assets 2,114 2,205 2,408 2,183 806
Total assets 1,12,788 1,29,231 1,61,323 2,01,407 2,51,736
Source: DCB Bank, Karvy Stock Broking
26
October 01, 2015
DCB Bank
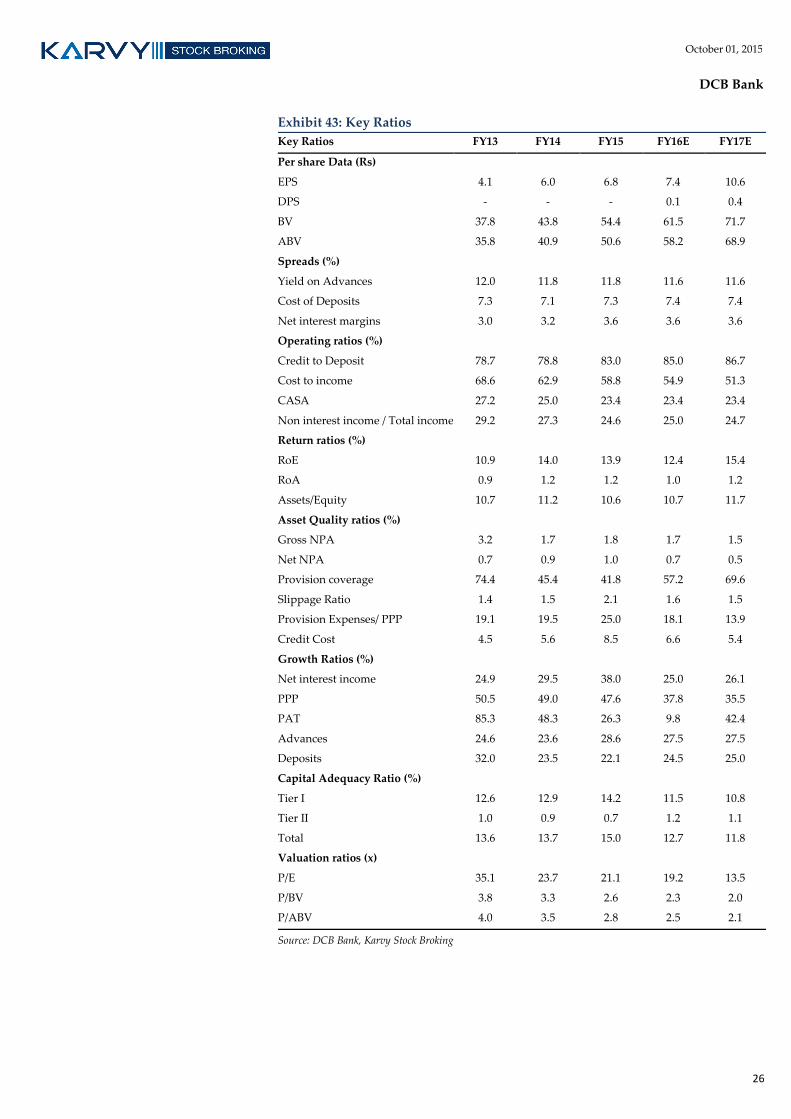
Exhibit 43: Key Ratios
Key Ratios FY13 FY14 FY15 FY16E FY17E
Per share Data (Rs)
EPS 4.1 6.0 6.8 7.4 10.6
DPS - - - 0.1 0.4
BV 37.8 43.8 54.4 61.5 71.7
ABV 35.8 40.9 50.6 58.2 68.9
Spreads (%)
Yield on Advances 12.0 11.8 11.8 11.6 11.6
Cost of Deposits 7.3 7.1 7.3 7.4 7.4
Net interest margins 3.0 3.2 3.6 3.6 3.6
Operating ratios (%)
Credit to Deposit 78.7 78.8 83.0 85.0 86.7
Cost to income 68.6 62.9 58.8 54.9 51.3
CASA 27.2 25.0 23.4 23.4 23.4
Non interest income / Total income 29.2 27.3 24.6 25.0 24.7
Return ratios (%)
RoE 10.9 14.0 13.9 12.4 15.4
RoA 0.9 1.2 1.2 1.0 1.2
Assets/Equity 10.7 11.2 10.6 10.7 11.7
Asset Quality ratios (%)
Gross NPA 3.2 1.7 1.8 1.7 1.5
Net NPA 0.7 0.9 1.0 0.7 0.5
Provision coverage 74.4 45.4 41.8 57.2 69.6
Slippage Ratio 1.4 1.5 2.1 1.6 1.5
Provision Expenses/ PPP 19.1 19.5 25.0 18.1 13.9
Credit Cost 4.5 5.6 8.5 6.6 5.4
Growth Ratios (%)
Net interest income 24.9 29.5 38.0 25.0 26.1
PPP 50.5 49.0 47.6 37.8 35.5
PAT 85.3 48.3 26.3 9.8 42.4
Advances 24.6 23.6 28.6 27.5 27.5
Deposits 32.0 23.5 22.1 24.5 25.0
Capital Adequacy Ratio (%)
Tier I 12.6 12.9 14.2 11.5 10.8
Tier II 1.0 0.9 0.7 1.2 1.1
Total 13.6 13.7 15.0 12.7 11.8
Valuation ratios (x)
P/E 35.1 23.7 21.1 19.2 13.5
P/BV 3.8 3.3 2.6 2.3 2.0
P/ABV 4.0 3.5 2.8 2.5 2.1
Source: DCB Bank, Karvy Stock Broking
Banking October 01, 2015
HDFC Bank
Bloomberg: HDFCB IN Reuters: HDBK.BO
BUY
India Research
VISIT NOTE
Recommendation
CMP: Rs1,069
Target Price: Rs1,198
Previous Target Price: Rs1,198
Upside (%) 12%
Stock Information Market Cap. (Rs bn / US$ mn) 2,545/38,283
52-week High/Low (Rs) 1,128/842
3m ADV (Rs mn /US$ mn) 1,729/26.0
Beta 0.9
Sensex/ Nifty 25,622/7,788
Share outstanding (mn) 2,517
Stock Performance (%) 1M 3M 12M YTD
Absolute (7.6) (0.5) 17.9 6.2
Rel. to Sensex 1.3 4.3 24.5 14.0
Performance
Source: Bloomberg
Analysts Contact Ankit Ladhani
+91 22 6184 4329
550 650 750 850 950 1,050 1,150
15,500
19,500
23,500
27,500
31,500
Oct
-14
No
v-1
4
Dec
-14
Feb
-15
Mar
-15
Ap
r-1
5
Jun
-15
Jul-
15
Au
g-1
5
Sensex (LHS) HDFC Bank (RHS)
Core operations remain intact; upgrade to Buy HDFC Bank, the 2nd largest bank in the private Indian banking space and has
reported consistent and strong operating performance over the past several
years. Inspite of the economic slowdown in the recent years, HDFC Bank has
reported strong advances growth, consistent NIMs and stable asset quality.
Strong liability franchise coupled with healthy retail advances portfolio and
strong fee income growth has driven the earnings CAGR growth of 28% over
FY10-15 led by 23% advances growth over the period. We expect earnings to
grow by 24% CAGR over FY15-17E led by 22% growth in advances over the
period. We maintain our positive bias on the stock and upgrade the bank to Buy
post the recent price correction and maintain our price target of Rs1198 (3.6x
FY17E ABV).
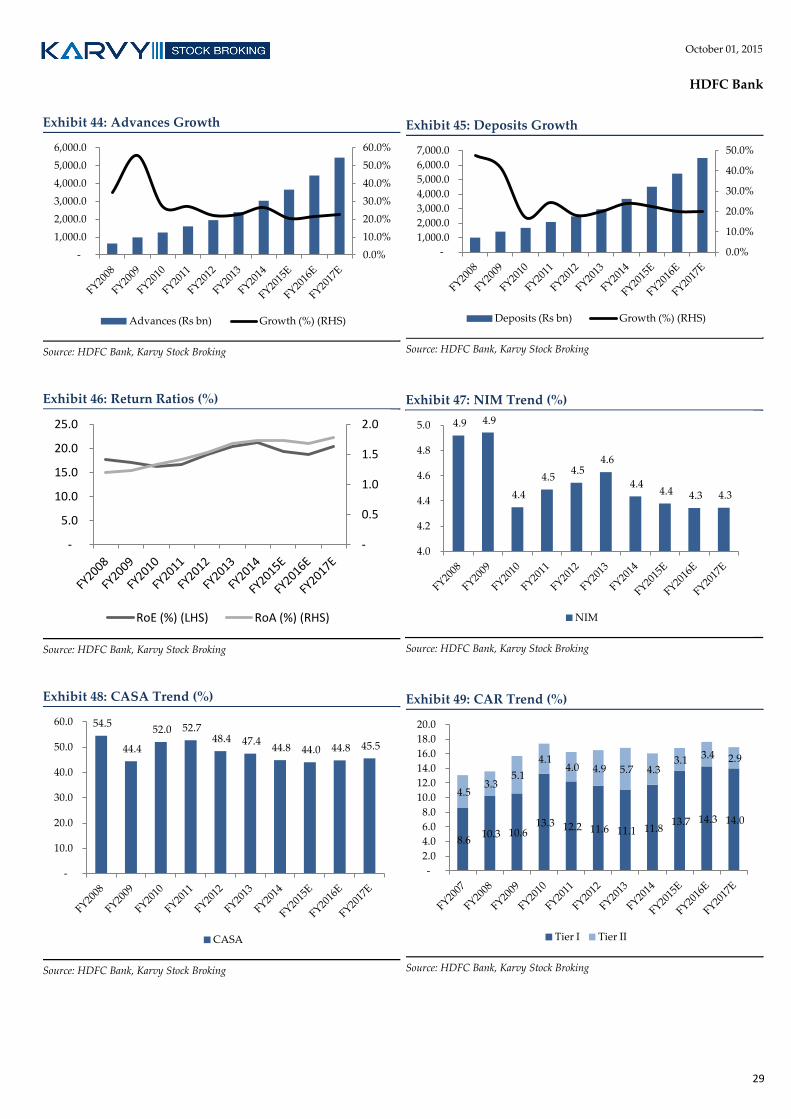
Advances growth to remain healthy
Bank has historically been reporting much higher growth as compared to the
industry as it grew by 23% over FY10-15 and continues to remain focused on
both corporate (47% of domestic loans) and retail advances (53%). In the current
economic scenario, with absence of new project by companies, bank focuses on
working capital loans. Amongst retail advances, bank has been growing strongly
in the credit card, personal loan and mortgage loan segment which have grown
by 33.2%/ 24.2%/ 22.6% CAGR over FY10-15. Auto and CV loans have grown by
~17% over the period. Overseas advances (8% of total advances) have also
reported a strong growth in the past couple of years and have grown from 4% in
FY13. Bank expects the advances growth to be higher than industry and
continues to focus on quality advances rather than targeting growth from a
specific sector. We expect the advances to grow by ~22% over FY15-17E.
Asset quality remains impeccable
Inspite of the current economic scenario, asset quality of HDFC Bank remains
intact. With GNPA of 1% and restructured assets book of 0.1%, asset quality
remains stable and best in class. GNPA for the bank have been around 1% for
the past several years. With some of the best credit appraisal and monitoring
policies we believe that HDFC Bank will be able to maintain its asset quality
going ahead. Though the bank continues to expand in the unsecured personal
loans and credit card segment, the same has helped the bank in maintaining its
higher NIMs and given the bank’s track record, we believe the risk reward is
quite conducive.
Key Financials
Particulars FY13 FY14 FY15 FY16E FY17E
Net interest income (Rs bn) 158 185 224 268 324
Net profit (Rs bn) 67 85 102 125 158
EPS (Rs) 28.3 35.3 40.8 49.9 63.0
PE (x) 37.8 30.2 26.2 21.4 17.0
P/ABV (x) 7.1 6.0 4.4 3.8 3.3
RoE (%) 20.3 21.3 19.4 18.7 20.3
RoA (%) 1.7 1.7 1.7 1.7 1.8
Source: HDFC Bank, Karvy Stock Broking
28
October 01, 2015
HDFC Bank
CASA ratio to improve to 42-43% by FY16
Strong liability is one of the key contributors to the strong NIMs that the bank has
been able to maintain. Bank has been able to maintain its CASA ratio in the range
of 40-44%. CA deposits have grown by 15% over FY10-15 whereas SA deposits
have grown by 20%. However for Q1FY16, CASA ratio has gone below 40% for the
first time in many years led by 38% YoY and 16% QoQ growth in term deposits
whereas CA and SA deposits grew by 23% and 18%. We expect the CASA ratio of
the bank to bounce back as the bank has already reduced its deposits rate along
with Rs 200 bn of FCNR deposits which are to mature in the next 15 – 18 months.
NIM likely to remain stable inspite of base rate cut
HDFC Bank surprised the street with a base rate cut of 35 bps in August end to
9.35%. Inspite of varying interest rate cycles over the years, HDFC Bank has been
able to maintain its strong NIMs in excess of 4.4% post FY07. Bank is already
calculating its base rate using marginal cost of funds and does not expect any
significant competition from payment banks. Though we expect a marginal dip in
NIM in Q2 due to the base rate cut, bank only has ~25% of advances based on
floating rate products. We expect the NIMs for FY16 to be stable at 4.3%.
CAR remains healthy
CAR of the bank remains healthy at 15.7% with tier I capital of 12.8%. With the
phased implementation of the Basel III norms, we expect bank to remain
comfortable.
Healthy return ratios
HDFC Bank continues to maintain healthy return ratios with RoE and RoA of
19.4% and 1.7% in FY15 which continue to remain amongst the highest in the
industry. With strong return ratios, healthy advances book growth, stable NIMs
and impeccable asset quality we expect the return ratios of the bank to remain
stable going ahead as well.
Valuation and Outlook
Strong advances growth, consistent NIMs, strong core fee income growth and
stable asset quality are the key highlights for HDFC Bank. We expect earnings to
grow by 24% CAGR over FY15-17E led by 22% growth in advances over the
period. We maintain our positive bias on the stock and upgrade the stock to Buy
post the recent price correction and maintain our price target of Rs1198 (3.6x
FY17E ABV).
29
October 01, 2015
HDFC Bank
Exhibit 44: Advances Growth
Source: HDFC Bank, Karvy Stock Broking
Exhibit 45: Deposits Growth
Source: HDFC Bank, Karvy Stock Broking
Exhibit 46: Return Ratios (%)
Source: HDFC Bank, Karvy Stock Broking
Exhibit 47: NIM Trend (%)
Source: HDFC Bank, Karvy Stock Broking
Exhibit 48: CASA Trend (%)
Source: HDFC Bank, Karvy Stock Broking
Exhibit 49: CAR Trend (%)
Source: HDFC Bank, Karvy Stock Broking
0.0%
10.0%
20.0%
30.0%
40.0%
50.0%
60.0%
-
1,000.0
2,000.0
3,000.0
4,000.0
5,000.0
6,000.0
Advances (Rs bn) Growth (%) (RHS)
0.0%
10.0%
20.0%
30.0%
40.0%
50.0%
-
1,000.0
2,000.0
3,000.0
4,000.0
5,000.0
6,000.0
7,000.0
Deposits (Rs bn) Growth (%) (RHS)
-
0.5
1.0
1.5
2.0
-
5.0
10.0
15.0
20.0
25.0
RoE (%) (LHS) RoA (%) (RHS)
4.9 4.9
4.4
4.5 4.5
4.6
4.4 4.4 4.3 4.3
4.0
4.2
4.4
4.6
4.8
5.0
NIM
54.5
44.4
52.0 52.7 48.4 47.4
44.8 44.0 44.8 45.5
-
10.0
20.0
30.0
40.0
50.0
60.0
CASA
8.6 10.3 10.6
13.3 12.2 11.6 11.1 11.8 13.7 14.3 14.0
4.5 3.3
5.1
4.1 4.0 4.9 5.7 4.3
3.1 3.4 2.9
-
2.0
4.0
6.0
8.0
10.0
12.0
14.0
16.0
18.0
20.0
Tier I Tier II
30
October 01, 2015
HDFC Bank
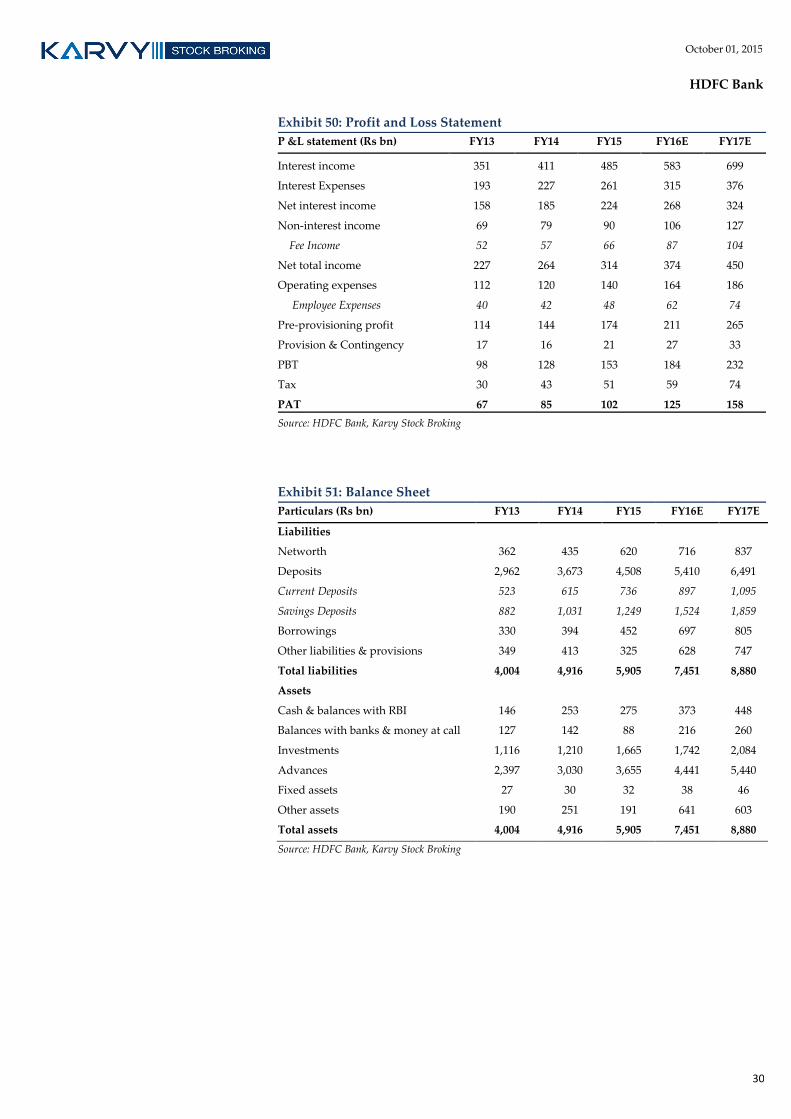
Exhibit 50: Profit and Loss Statement
P &L statement (Rs bn) FY13 FY14 FY15 FY16E FY17E
Interest income 351 411 485 583 699
Interest Expenses 193 227 261 315 376
Net interest income 158 185 224 268 324
Non-interest income 69 79 90 106 127
Fee Income 52 57 66 87 104
Net total income 227 264 314 374 450
Operating expenses 112 120 140 164 186
Employee Expenses 40 42 48 62 74
Pre-provisioning profit 114 144 174 211 265
Provision & Contingency 17 16 21 27 33
PBT 98 128 153 184 232
Tax 30 43 51 59 74
PAT 67 85 102 125 158
Source: HDFC Bank, Karvy Stock Broking
Exhibit 51: Balance Sheet
Particulars (Rs bn) FY13 FY14 FY15 FY16E FY17E
Liabilities
Networth 362 435 620 716 837
Deposits 2,962 3,673 4,508 5,410 6,491
Current Deposits 523 615 736 897 1,095
Savings Deposits 882 1,031 1,249 1,524 1,859
Borrowings 330 394 452 697 805
Other liabilities & provisions 349 413 325 628 747
Total liabilities 4,004 4,916 5,905 7,451 8,880
Assets
Cash & balances with RBI 146 253 275 373 448
Balances with banks & money at call 127 142 88 216 260
Investments 1,116 1,210 1,665 1,742 2,084
Advances 2,397 3,030 3,655 4,441 5,440
Fixed assets 27 30 32 38 46
Other assets 190 251 191 641 603
Total assets 4,004 4,916 5,905 7,451 8,880
Source: HDFC Bank, Karvy Stock Broking
31
October 01, 2015
HDFC Bank
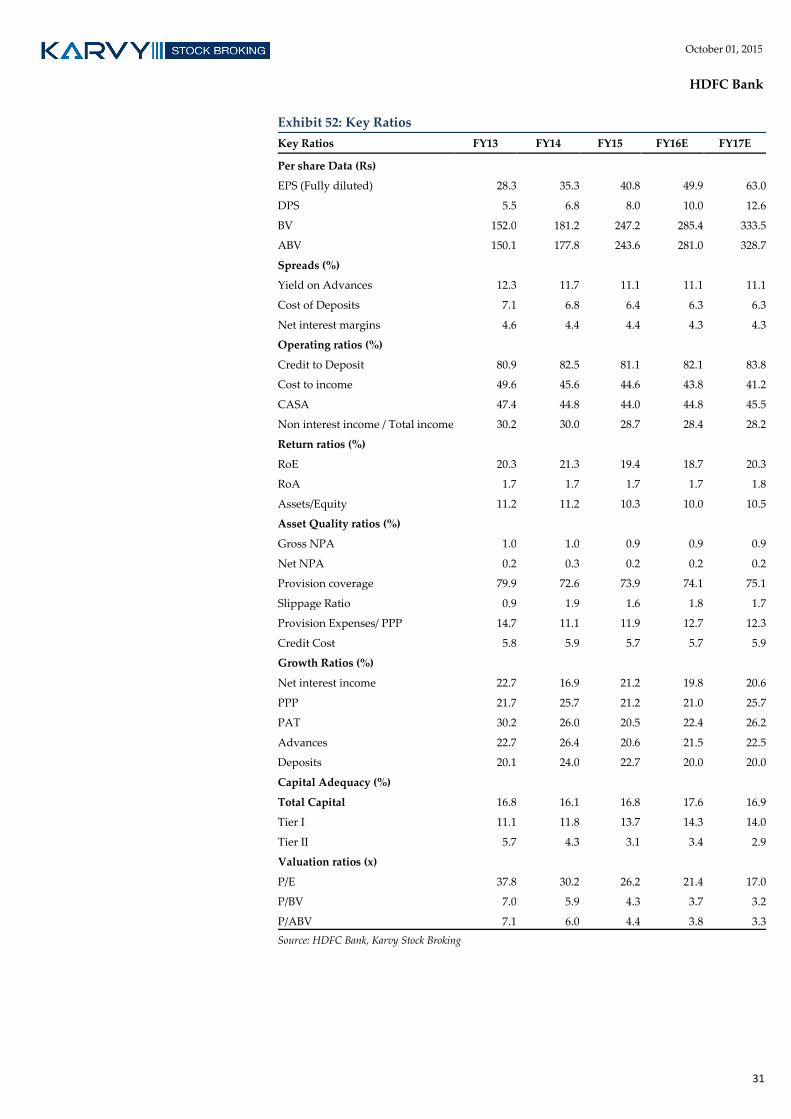
Exhibit 52: Key Ratios
Key Ratios FY13 FY14 FY15 FY16E FY17E
Per share Data (Rs)
EPS (Fully diluted) 28.3 35.3 40.8 49.9 63.0
DPS 5.5 6.8 8.0 10.0 12.6
BV 152.0 181.2 247.2 285.4 333.5
ABV 150.1 177.8 243.6 281.0 328.7
Spreads (%)
Yield on Advances 12.3 11.7 11.1 11.1 11.1
Cost of Deposits 7.1 6.8 6.4 6.3 6.3
Net interest margins 4.6 4.4 4.4 4.3 4.3
Operating ratios (%)
Credit to Deposit 80.9 82.5 81.1 82.1 83.8
Cost to income 49.6 45.6 44.6 43.8 41.2
CASA 47.4 44.8 44.0 44.8 45.5
Non interest income / Total income 30.2 30.0 28.7 28.4 28.2
Return ratios (%)
RoE 20.3 21.3 19.4 18.7 20.3
RoA 1.7 1.7 1.7 1.7 1.8
Assets/Equity 11.2 11.2 10.3 10.0 10.5
Asset Quality ratios (%)
Gross NPA 1.0 1.0 0.9 0.9 0.9
Net NPA 0.2 0.3 0.2 0.2 0.2
Provision coverage 79.9 72.6 73.9 74.1 75.1
Slippage Ratio 0.9 1.9 1.6 1.8 1.7
Provision Expenses/ PPP 14.7 11.1 11.9 12.7 12.3
Credit Cost 5.8 5.9 5.7 5.7 5.9
Growth Ratios (%)
Net interest income 22.7 16.9 21.2 19.8 20.6
PPP 21.7 25.7 21.2 21.0 25.7
PAT 30.2 26.0 20.5 22.4 26.2
Advances 22.7 26.4 20.6 21.5 22.5
Deposits 20.1 24.0 22.7 20.0 20.0
Capital Adequacy (%)
Total Capital 16.8 16.1 16.8 17.6 16.9
Tier I 11.1 11.8 13.7 14.3 14.0
Tier II 5.7 4.3 3.1 3.4 2.9
Valuation ratios (x)
P/E 37.8 30.2 26.2 21.4 17.0
P/BV 7.0 5.9 4.3 3.7 3.2
P/ABV 7.1 6.0 4.4 3.8 3.3
Source: HDFC Bank, Karvy Stock Broking
Banking October 01, 2015
ICICI Bank
Bloomberg: ICICIBC IN Reuters: ICBK.BO
BUY
India Research
VISIT NOTE
Recommendation
CMP: Rs270
Target Price: Rs358
Previous Target Price: Rs358
Upside (%) 33%
Stock Information Market Cap. (Rs bn / US$ mn) 1,647/24,901
52-week High/Low (Rs) 393/267
3m ADV (Rs mn /US$ mn) 4,414/66.7
Beta 1.4
Sensex/ Nifty 26,392/8,002
Share outstanding (mn) 5,806
Stock Performance (%) 1M 3M 12M YTD
Absolute (0.5) (9.8) (8.9) (19.7)
Rel. to Sensex 3.6 (6) (8) (16.3)
Performance
Source: Bloomberg
Analysts Contact Ankit Ladhani
+91 22 6184 4329
200
250
300
350
400
15,500
19,500
23,500
27,500
31,500
Oct
-14
No
v-1
4
Dec
-14
Feb
-15
Mar
-15
Ap
r-1
5
Jun
-15
Jul-
15
Au
g-1
5
Sensex (LHS) ICICI Bank (RHS)
Attractive price; concerns overdone ICICI Bank continues to be under the scanner for the large corporate exposure.
However we believe ICICI Bank is likely to be a key beneficiary of the
economic improvement and expect its strong balance sheet as well as its other
businesses like life insurance likely to support the earnings growth of the bank.
We have reduced our advances growth target as well as increase our slippage
ratio to factor in the current negative trends. However we believe that the
recent price correction factors in all the above and we maintain our positive
bias and Buy rating on the stock with a SOTP based target price of Rs 358 (2.3x
FY17E ABV).
Advances growth to remain higher than industry
Driven by retail and SME segments (42.8% and 4% of total advances),
advances growth is expected to remain above industry levels. Bank is focusing
on home loans and other secured loans products along with a sharp growth in
the personal loan segment to increase its retail lending portfolio. Auto loans
are expected to grow at a slower pace. Though corporate loan growth is
expected to pick up as well, the contribution is expected to remain on the
lower side due to lack of new project loans. Corporate loans are expected to be
driven majorly by working capital advances. Post its consolidation in FY12,
ICICI has grown its loan book by 15% CAGR over FY12-15. We believe that
bank will maintain its advances growth rate. We marginally reduce the loan
growth target for FY16 and FY17 and expect a CAGR growth of 16% over
FY15-17E.
Asset quality to remain under pressure
Management has guided for an improvement in asset quality in FY16.
However we remain cautious on impairment ratios especially with slippages
coming in from restructured book as well. Bank has refinanced upto Rs 10 bn
of loans under the 5-25 scheme in Q1FY16, but expects the refinancing under
this scheme not to grow significantly. In light of the current economic scenario,
we have factored in marginally higher slippages for FY16 and FY17, though
we expect PCR to improve in FY17 led by stronger recoveries. With the current
economic scenario, we expect asset quality to remain largely flat in FY16 and
improve marginally in FY17.
Key Financials
Particulars FY13 FY14 FY15 FY16E FY17E
Net interest income (Rs bn) 139 165 190 216 254
Net profit (Rs bn) 83 98 112 121 144
EPS (Rs) 14.4 17.0 19.3 20.8 24.9
PE (x) 18.7 15.9 14.0 13.0 10.9
P/ABV (x) 3.1 2.8 2.6 2.3 2.0
ROE (%) 13.1 14.0 14.5 14.4 15.6
ROA (%) 1.6 1.6 1.7 1.7 1.7
Source: ICICI Bank, Karvy Stock Broking
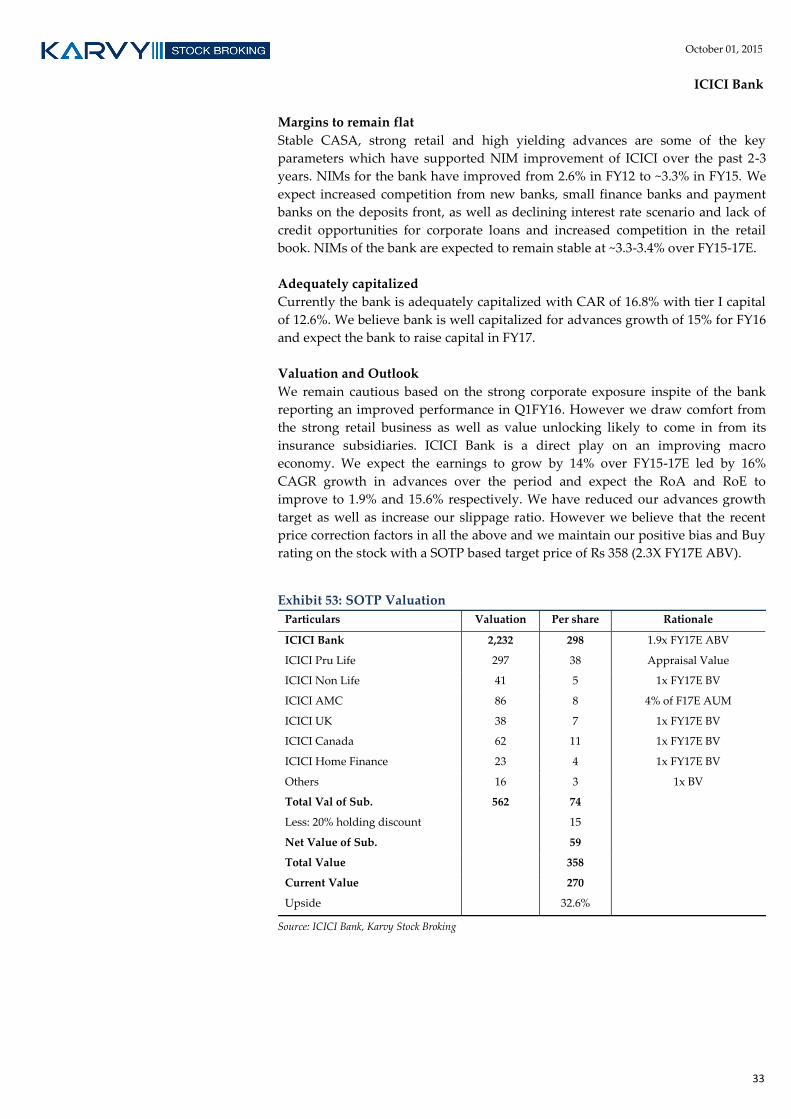
33
October 01, 2015
ICICI Bank
Margins to remain flat
Stable CASA, strong retail and high yielding advances are some of the key
parameters which have supported NIM improvement of ICICI over the past 2-3
years. NIMs for the bank have improved from 2.6% in FY12 to ~3.3% in FY15. We
expect increased competition from new banks, small finance banks and payment
banks on the deposits front, as well as declining interest rate scenario and lack of
credit opportunities for corporate loans and increased competition in the retail
book. NIMs of the bank are expected to remain stable at ~3.3-3.4% over FY15-17E.
Adequately capitalized
Currently the bank is adequately capitalized with CAR of 16.8% with tier I capital
of 12.6%. We believe bank is well capitalized for advances growth of 15% for FY16
and expect the bank to raise capital in FY17.
Valuation and Outlook
We remain cautious based on the strong corporate exposure inspite of the bank
reporting an improved performance in Q1FY16. However we draw comfort from
the strong retail business as well as value unlocking likely to come in from its
insurance subsidiaries. ICICI Bank is a direct play on an improving macro
economy. We expect the earnings to grow by 14% over FY15-17E led by 16%
CAGR growth in advances over the period and expect the RoA and RoE to
improve to 1.9% and 15.6% respectively. We have reduced our advances growth
target as well as increase our slippage ratio. However we believe that the recent
price correction factors in all the above and we maintain our positive bias and Buy
rating on the stock with a SOTP based target price of Rs 358 (2.3X FY17E ABV).
Exhibit 53: SOTP Valuation
Particulars Valuation Per share Rationale
ICICI Bank 2,232 298 1.9x FY17E ABV
ICICI Pru Life 297 38 Appraisal Value
ICICI Non Life 41 5 1x FY17E BV
ICICI AMC 86 8 4% of F17E AUM
ICICI UK 38 7 1x FY17E BV
ICICI Canada 62 11 1x FY17E BV
ICICI Home Finance 23 4 1x FY17E BV
Others 16 3 1x BV
Total Val of Sub. 562 74
Less: 20% holding discount 15
Net Value of Sub. 59
Total Value 358
Current Value 270
Upside 32.6%
Source: ICICI Bank, Karvy Stock Broking
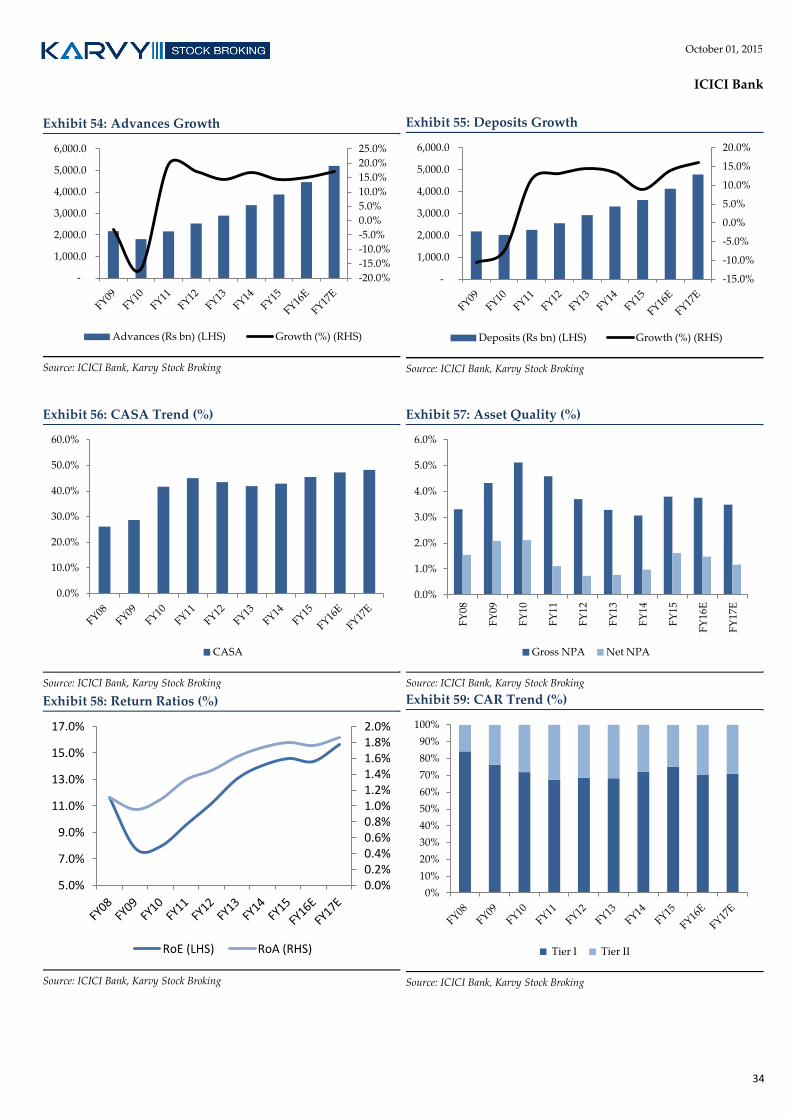
34
October 01, 2015
ICICI Bank
Exhibit 54: Advances Growth
Source: ICICI Bank, Karvy Stock Broking
Exhibit 55: Deposits Growth
Source: ICICI Bank, Karvy Stock Broking
Exhibit 56: CASA Trend (%)
Source: ICICI Bank, Karvy Stock Broking
Exhibit 57: Asset Quality (%)
Source: ICICI Bank, Karvy Stock Broking
Exhibit 58: Return Ratios (%)
Source: ICICI Bank, Karvy Stock Broking
Exhibit 59: CAR Trend (%)
Source: ICICI Bank, Karvy Stock Broking
-20.0%
-15.0%
-10.0%
-5.0%
0.0%
5.0%
10.0%
15.0%
20.0%
25.0%
-
1,000.0
2,000.0
3,000.0
4,000.0
5,000.0
6,000.0
Advances (Rs bn) (LHS) Growth (%) (RHS)
-15.0%
-10.0%
-5.0%
0.0%
5.0%
10.0%
15.0%
20.0%
-
1,000.0
2,000.0
3,000.0
4,000.0
5,000.0
6,000.0
Deposits (Rs bn) (LHS) Growth (%) (RHS)
0.0%
10.0%
20.0%
30.0%
40.0%
50.0%
60.0%
CASA
0.0%
1.0%
2.0%
3.0%
4.0%
5.0%
6.0%
FY
08
FY
09
FY
10
FY
11
FY
12
FY
13
FY
14
FY
15
FY
16E
FY
17E
Gross NPA Net NPA
0.0% 0.2% 0.4% 0.6% 0.8% 1.0% 1.2% 1.4% 1.6% 1.8% 2.0%
5.0%
7.0%
9.0%
11.0%
13.0%
15.0%
17.0%
RoE (LHS) RoA (RHS)
0%
10%
20%
30%
40%
50%
60%
70%
80%
90%
100%
Tier I Tier II
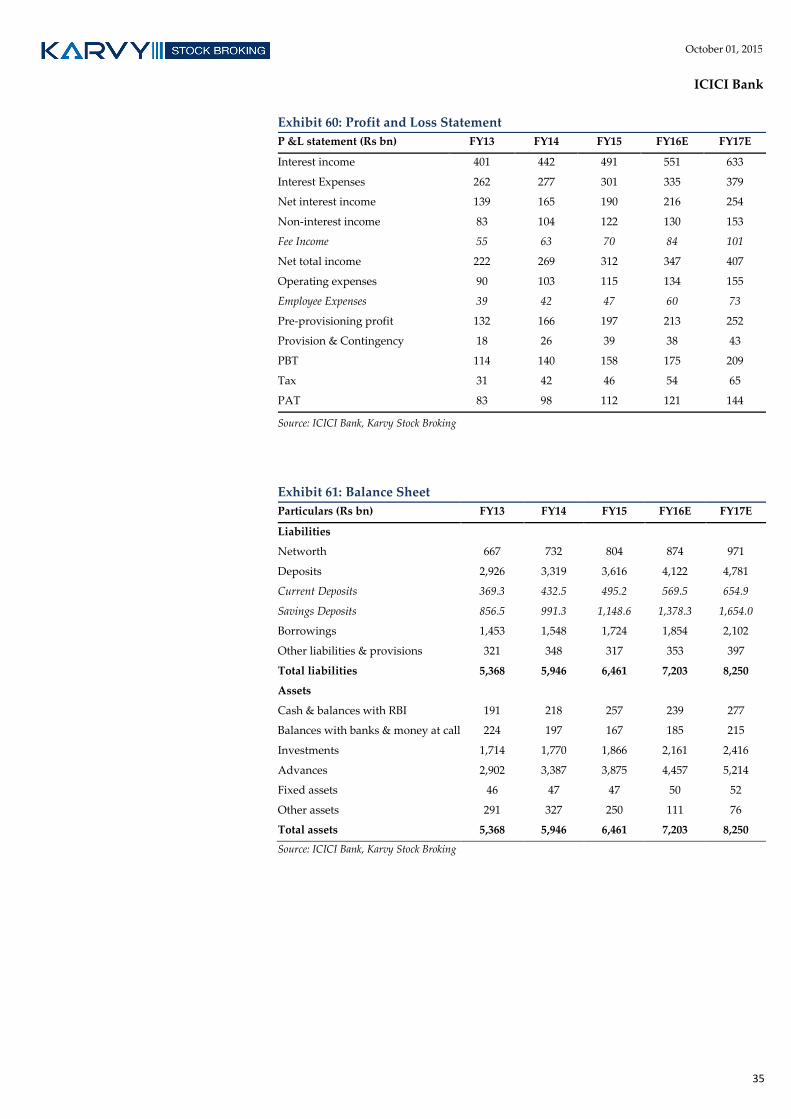
35
October 01, 2015
ICICI Bank
Exhibit 60: Profit and Loss Statement
P &L statement (Rs bn) FY13 FY14 FY15 FY16E FY17E
Interest income 401 442 491 551 633
Interest Expenses 262 277 301 335 379
Net interest income 139 165 190 216 254
Non-interest income 83 104 122 130 153
Fee Income 55 63 70 84 101
Net total income 222 269 312 347 407
Operating expenses 90 103 115 134 155
Employee Expenses 39 42 47 60 73
Pre-provisioning profit 132 166 197 213 252
Provision & Contingency 18 26 39 38 43
PBT 114 140 158 175 209
Tax 31 42 46 54 65
PAT 83 98 112 121 144
Source: ICICI Bank, Karvy Stock Broking
Exhibit 61: Balance Sheet
Particulars (Rs bn) FY13 FY14 FY15 FY16E FY17E
Liabilities
Networth 667 732 804 874 971
Deposits 2,926 3,319 3,616 4,122 4,781
Current Deposits 369.3 432.5 495.2 569.5 654.9
Savings Deposits 856.5 991.3 1,148.6 1,378.3 1,654.0
Borrowings 1,453 1,548 1,724 1,854 2,102
Other liabilities & provisions 321 348 317 353 397
Total liabilities 5,368 5,946 6,461 7,203 8,250
Assets
Cash & balances with RBI 191 218 257 239 277
Balances with banks & money at call 224 197 167 185 215
Investments 1,714 1,770 1,866 2,161 2,416
Advances 2,902 3,387 3,875 4,457 5,214
Fixed assets 46 47 47 50 52
Other assets 291 327 250 111 76
Total assets 5,368 5,946 6,461 7,203 8,250
Source: ICICI Bank, Karvy Stock Broking
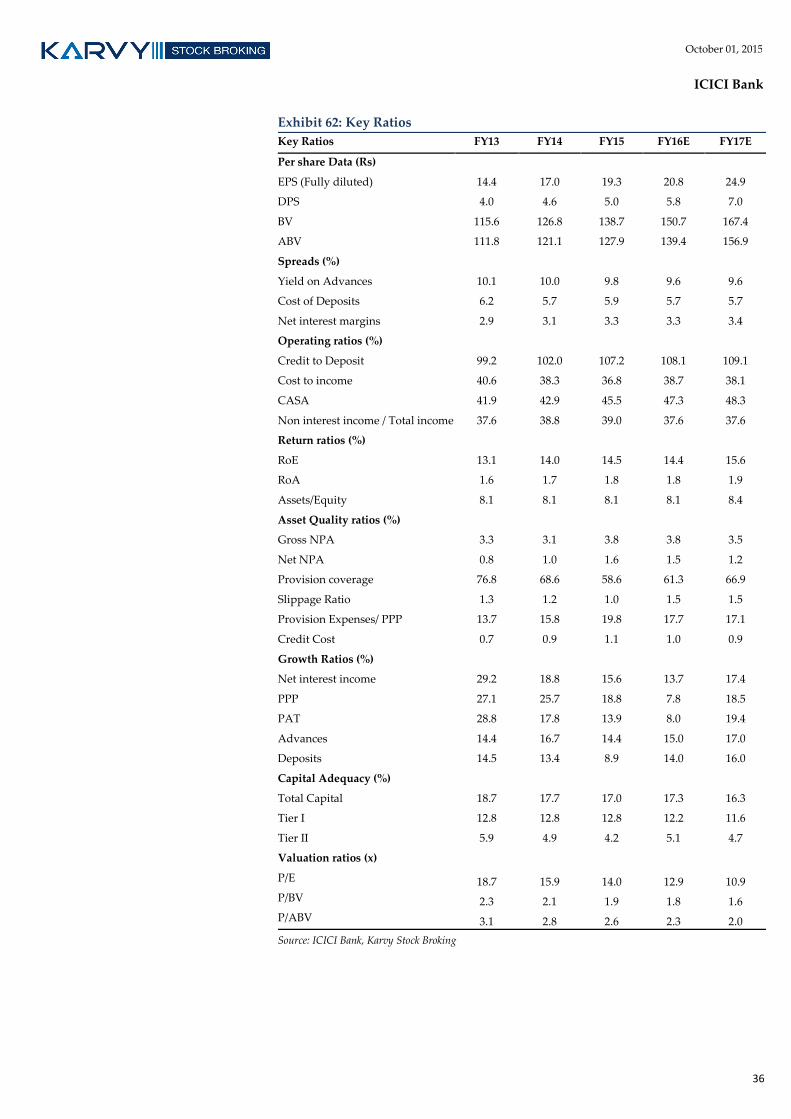
36
October 01, 2015
ICICI Bank
Exhibit 62: Key Ratios
Key Ratios FY13 FY14 FY15 FY16E FY17E
Per share Data (Rs)
EPS (Fully diluted) 14.4 17.0 19.3 20.8 24.9
DPS 4.0 4.6 5.0 5.8 7.0
BV 115.6 126.8 138.7 150.7 167.4
ABV 111.8 121.1 127.9 139.4 156.9
Spreads (%)
Yield on Advances 10.1 10.0 9.8 9.6 9.6
Cost of Deposits 6.2 5.7 5.9 5.7 5.7
Net interest margins 2.9 3.1 3.3 3.3 3.4
Operating ratios (%)
Credit to Deposit 99.2 102.0 107.2 108.1 109.1
Cost to income 40.6 38.3 36.8 38.7 38.1
CASA 41.9 42.9 45.5 47.3 48.3
Non interest income / Total income 37.6 38.8 39.0 37.6 37.6
Return ratios (%)
RoE 13.1 14.0 14.5 14.4 15.6
RoA 1.6 1.7 1.8 1.8 1.9
Assets/Equity 8.1 8.1 8.1 8.1 8.4
Asset Quality ratios (%)
Gross NPA 3.3 3.1 3.8 3.8 3.5
Net NPA 0.8 1.0 1.6 1.5 1.2
Provision coverage 76.8 68.6 58.6 61.3 66.9
Slippage Ratio 1.3 1.2 1.0 1.5 1.5
Provision Expenses/ PPP 13.7 15.8 19.8 17.7 17.1
Credit Cost 0.7 0.9 1.1 1.0 0.9
Growth Ratios (%)
Net interest income 29.2 18.8 15.6 13.7 17.4
PPP 27.1 25.7 18.8 7.8 18.5
PAT 28.8 17.8 13.9 8.0 19.4
Advances 14.4 16.7 14.4 15.0 17.0
Deposits 14.5 13.4 8.9 14.0 16.0
Capital Adequacy (%)
Total Capital 18.7 17.7 17.0 17.3 16.3
Tier I 12.8 12.8 12.8 12.2 11.6
Tier II 5.9 4.9 4.2 5.1 4.7
Valuation ratios (x)
P/E 18.7 15.9 14.0 12.9 10.9
P/BV 2.3 2.1 1.9 1.8 1.6
P/ABV 3.1 2.8 2.6 2.3 2.0
Source: ICICI Bank, Karvy Stock Broking
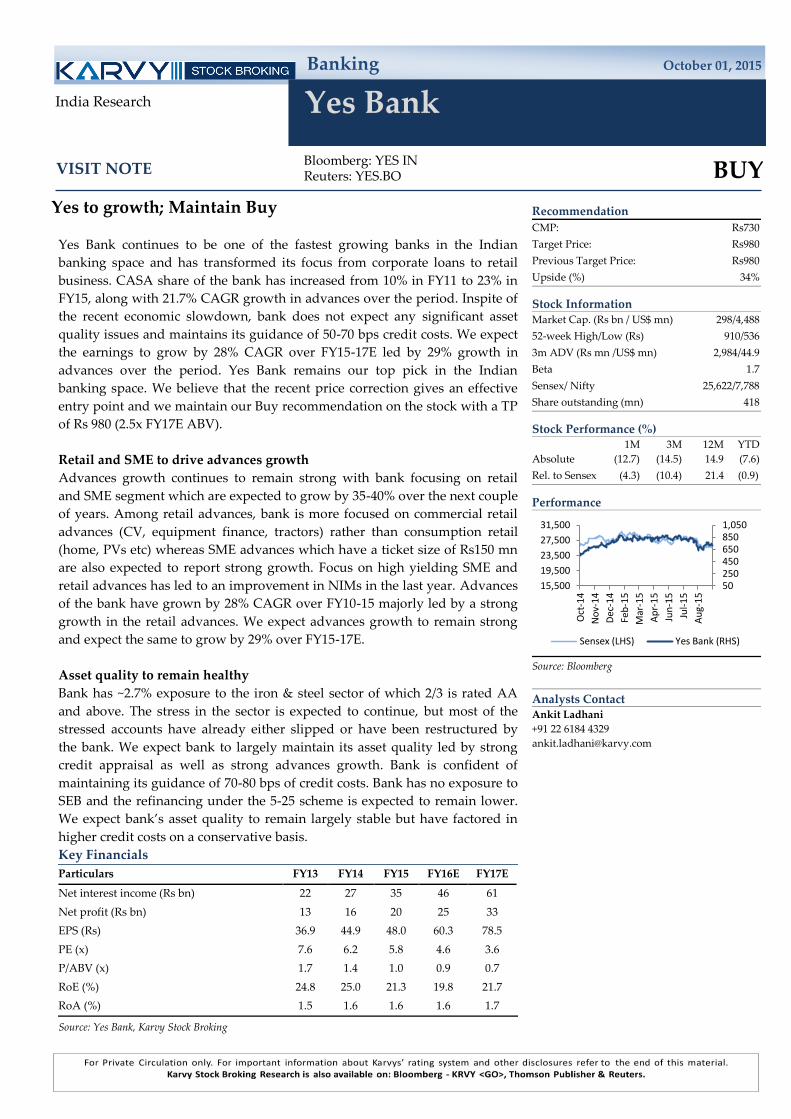
Banking October 01, 2015
Yes Bank
Bloomberg: YES IN Reuters: YES.BO
BUY
India Research
VISIT NOTE
Recommendation
CMP: Rs730
Target Price: Rs980
Previous Target Price: Rs980
Upside (%) 34%
Stock Information Market Cap. (Rs bn / US$ mn) 298/4,488
52-week High/Low (Rs) 910/536
3m ADV (Rs mn /US$ mn) 2,984/44.9
Beta 1.7
Sensex/ Nifty 25,622/7,788
Share outstanding (mn) 418
Stock Performance (%) 1M 3M 12M YTD
Absolute (12.7) (14.5) 14.9 (7.6)
Rel. to Sensex (4.3) (10.4) 21.4 (0.9)
Performance
Source: Bloomberg
Analysts Contact Ankit Ladhani
+91 22 6184 4329
50 250 450 650 850 1,050
15,500
19,500
23,500
27,500
31,500
Oct
-14
No
v-1
4
Dec
-14
Feb
-15
Mar
-15
Ap
r-1
5
Jun
-15
Jul-
15
Au
g-1
5
Sensex (LHS) Yes Bank (RHS)
Yes to growth; Maintain Buy
Yes Bank continues to be one of the fastest growing banks in the Indian
banking space and has transformed its focus from corporate loans to retail
business. CASA share of the bank has increased from 10% in FY11 to 23% in
FY15, along with 21.7% CAGR growth in advances over the period. Inspite of
the recent economic slowdown, bank does not expect any significant asset
quality issues and maintains its guidance of 50-70 bps credit costs. We expect
the earnings to grow by 28% CAGR over FY15-17E led by 29% growth in
advances over the period. Yes Bank remains our top pick in the Indian
banking space. We believe that the recent price correction gives an effective
entry point and we maintain our Buy recommendation on the stock with a TP
of Rs 980 (2.5x FY17E ABV).
Retail and SME to drive advances growth
Advances growth continues to remain strong with bank focusing on retail
and SME segment which are expected to grow by 35-40% over the next couple
of years. Among retail advances, bank is more focused on commercial retail
advances (CV, equipment finance, tractors) rather than consumption retail
(home, PVs etc) whereas SME advances which have a ticket size of Rs150 mn
are also expected to report strong growth. Focus on high yielding SME and
retail advances has led to an improvement in NIMs in the last year. Advances
of the bank have grown by 28% CAGR over FY10-15 majorly led by a strong
growth in the retail advances. We expect advances growth to remain strong
and expect the same to grow by 29% over FY15-17E.
Asset quality to remain healthy
Bank has ~2.7% exposure to the iron & steel sector of which 2/3 is rated AA
and above. The stress in the sector is expected to continue, but most of the
stressed accounts have already either slipped or have been restructured by
the bank. We expect bank to largely maintain its asset quality led by strong
credit appraisal as well as strong advances growth. Bank is confident of
maintaining its guidance of 70-80 bps of credit costs. Bank has no exposure to
SEB and the refinancing under the 5-25 scheme is expected to remain lower.
We expect bank’s asset quality to remain largely stable but have factored in
higher credit costs on a conservative basis.
Key Financials
Particulars FY13 FY14 FY15 FY16E FY17E
Net interest income (Rs bn) 22 27 35 46 61
Net profit (Rs bn) 13 16 20 25 33
EPS (Rs) 36.9 44.9 48.0 60.3 78.5
PE (x) 7.6 6.2 5.8 4.6 3.6
P/ABV (x) 1.7 1.4 1.0 0.9 0.7
RoE (%) 24.8 25.0 21.3 19.8 21.7
RoA (%) 1.5 1.6 1.6 1.6 1.7
Source: Yes Bank, Karvy Stock Broking
38
October 01, 2015
Yes Bank
NIMs likely to improve
Led by improvement in CASA, reduction in interest rates for SA deposits along
with declining share of credit substitutes in the investment portfolio, bank expects
NIMs to improve going ahead. Focus on high yielding retail and SME advances is
likely to support the NIMs for the bank. We expect NIM to improve by 20 bps to
3.2% over FY15-17E.
Improving liability profile
Bank has reported a strong improvement in its liability profile over the past few
years with CASA ratio improving from 10% in FY11 to 23% in FY15. Led by
differentiated interest rate being offered by savings deposits, they have grown by
98% over the period whereas CA deposits have grown by 21%. Retail deposits
continue to be a major focus for the bank and the bank is aggressively expanding
its branch network for the same.
Capital raising likely
Bank has a CAR of 15% with a tier I capital of 10.9%. Bank has already received
shareholders approval to raise equity capital of $ 1 bn. To maintain its strong
growth rate, we expect the bank to raise capital in FY16.
Valuation and Outlook
Yes Bank continues to deliver a strong set of numbers with impeccable asset
quality, strong advances growth and healthy return ratios. We expect the earnings
to grow by 28% CAGR over FY15-17E led by 29% growth in advances over the
period. Yes Bank remains our top pick in the Indian banking space. We believe
that the recent price correction gives an effective entry point and we maintain our
Buy recommendation on the stock with a TP of Rs 980 (2.5x FY17E ABV).
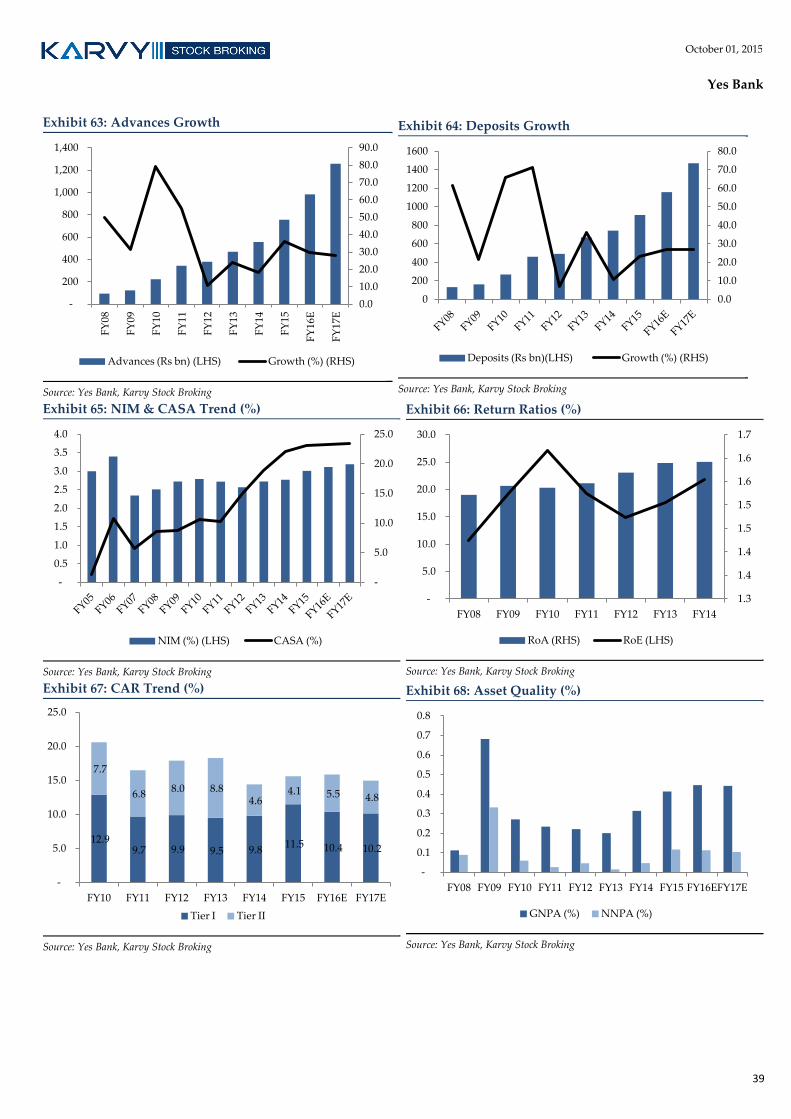
39
October 01, 2015
Yes Bank
Exhibit 63: Advances Growth
Source: Yes Bank, Karvy Stock Broking
Exhibit 64: Deposits Growth
Source: Yes Bank, Karvy Stock Broking
Exhibit 65: NIM & CASA Trend (%)
Source: Yes Bank, Karvy Stock Broking
Exhibit 66: Return Ratios (%)
Source: Yes Bank, Karvy Stock Broking
Exhibit 67: CAR Trend (%)
Source: Yes Bank, Karvy Stock Broking
Exhibit 68: Asset Quality (%)
Source: Yes Bank, Karvy Stock Broking
0.0
10.0
20.0
30.0
40.0
50.0
60.0
70.0
80.0
90.0
-
200
400
600
800
1,000
1,200
1,400
FY
08
FY
09
FY
10
FY
11
FY
12
FY
13
FY
14
FY
15
FY
16E
FY
17E
Advances (Rs bn) (LHS) Growth (%) (RHS)
0.0
10.0
20.0
30.0
40.0
50.0
60.0
70.0
80.0
0
200
400
600
800
1000
1200
1400
1600
Deposits (Rs bn)(LHS) Growth (%) (RHS)
-
5.0
10.0
15.0
20.0
25.0
-
0.5
1.0
1.5
2.0
2.5
3.0
3.5
4.0
NIM (%) (LHS) CASA (%)
1.3
1.4
1.4
1.5
1.5
1.6
1.6
1.7
-
5.0
10.0
15.0
20.0
25.0
30.0
FY08 FY09 FY10 FY11 FY12 FY13 FY14
RoA (RHS) RoE (LHS)
12.9 9.7 9.9 9.5 9.8
11.5 10.4 10.2
7.7
6.8 8.0 8.8
4.6 4.1 5.5 4.8
-
5.0
10.0
15.0
20.0
25.0
FY10 FY11 FY12 FY13 FY14 FY15 FY16E FY17E
Tier I Tier II
-
0.1
0.2
0.3
0.4
0.5
0.6
0.7
0.8
FY08 FY09 FY10 FY11 FY12 FY13 FY14 FY15 FY16E FY17E
GNPA (%) NNPA (%)
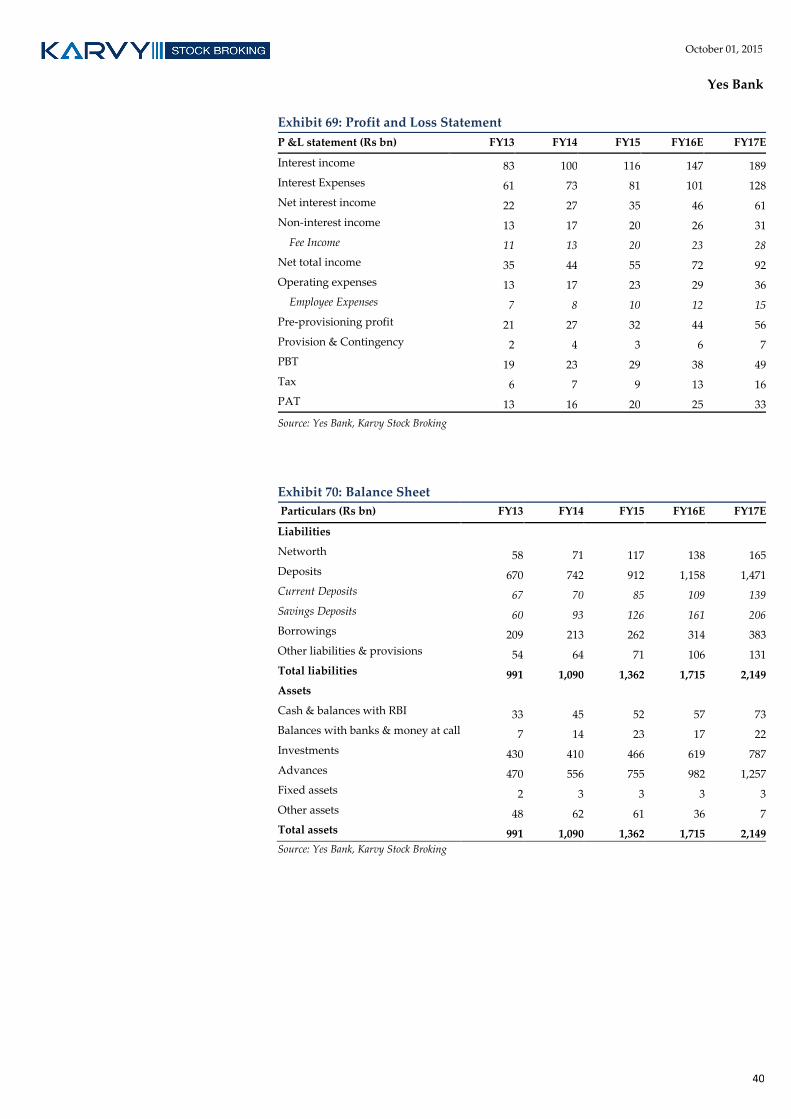
40
October 01, 2015
Yes Bank
Exhibit 69: Profit and Loss Statement
P &L statement (Rs bn) FY13 FY14 FY15 FY16E FY17E
Interest income 83 100 116 147 189
Interest Expenses 61 73 81 101 128
Net interest income 22 27 35 46 61
Non-interest income 13 17 20 26 31
Fee Income 11 13 20 23 28
Net total income 35 44 55 72 92
Operating expenses 13 17 23 29 36
Employee Expenses 7 8 10 12 15
Pre-provisioning profit 21 27 32 44 56
Provision & Contingency 2 4 3 6 7
PBT 19 23 29 38 49
Tax 6 7 9 13 16
PAT 13 16 20 25 33
Source: Yes Bank, Karvy Stock Broking
Exhibit 70: Balance Sheet
Particulars (Rs bn) FY13 FY14 FY15 FY16E FY17E
Liabilities
Networth 58 71 117 138 165
Deposits 670 742 912 1,158 1,471
Current Deposits 67 70 85 109 139
Savings Deposits 60 93 126 161 206
Borrowings 209 213 262 314 383
Other liabilities & provisions 54 64 71 106 131
Total liabilities 991 1,090 1,362 1,715 2,149
Assets
Cash & balances with RBI 33 45 52 57 73
Balances with banks & money at call 7 14 23 17 22
Investments 430 410 466 619 787
Advances 470 556 755 982 1,257
Fixed assets 2 3 3 3 3
Other assets 48 62 61 36 7
Total assets 991 1,090 1,362 1,715 2,149
Source: Yes Bank, Karvy Stock Broking

41
October 01, 2015
Yes Bank
Exhibit 71: Key Ratios
Key Ratios FY13 FY14 FY15 FY16E FY17E
Per share Data (Rs)
EPS (Fully diluted) 36.9 44.9 48.0 60.3 78.5
DPS 6.1 8.0 9.0 9.0 11.8
BV 164.1 197.2 279.1 328.8 393.4
ABV 163.9 196.5 277.0 326.1 390.3
Spreads (%)
Yield on Advances 12.7 12.7 12.2 12.2 12.2
Cost of Deposits 7.9 8.0 7.9 7.9 7.9
Net interest margins 2.7 2.8 3.0 3.1 3.2
Operating ratios (%)
Credit to Deposit 70.2 75.0 82.9 84.8 85.5
Cost to income 38.4 39.4 41.3 39.7 38.8
CASA 18.9 22.0 23.1 23.3 23.5
Non interest income / Total income 36.2 38.8 37.0 36.0 33.8
Return ratios (%)
RoE 24.8 25.0 21.3 19.8 21.7
RoA 1.5 1.6 1.6 1.6 1.7
Assets/Equity 16.5 16.1 13.0 12.1 12.8
Asset Quality ratios (%)
Gross NPA 0.2 0.3 0.4 0.4 0.4
Net NPA 0.0 0.0 0.1 0.1 0.1
Provision coverage 92.6 85.1 72.0 74.8 76.5
Slippage Ratio 0.6 0.8 0.7 0.5 0.4
Provision Expenses/ PPP 10.1 13.5 10.4 13.3 12.6
Credit Cost 0.6 0.8 0.6 0.8 0.7
Growth Ratios (%)
Net interest income 37.3 22.4 28.4 32.4 31.4
PPP 39.1 25.5 20.9 33.9 29.1
PAT 33.1 24.4 24.0 25.7 30.1
Advances 23.7 18.4 35.8 30.0 28.0
Deposits 36.2 10.8 22.9 27.0 27.0
Capital Adequacy Ratio (%)
Tier I 9.5 9.8 11.5 10.4 10.2
Tier II 8.8 4.6 4.1 5.5 4.8
Total 18.3 14.4 15.6 15.9 15.0
Valuation ratios (x)
P/E 7.6 6.2 5.8 4.6 3.6
P/BV 1.7 1.4 1.0 0.9 0.7
P/ABV 1.7 1.4 1.0 0.9 0.7
Source: Yes Bank, Karvy Stock Broking
42
October 01, 2015
Yes Bank
For further enquiries please contact:
Tel: +91-22-6184 4300
Disclosures Appendix
Analyst certification
The following analyst(s), who is (are) primarily responsible for this report and whose name(s) is/ are mentioned
therein, certify (ies) that the views expressed herein accurately reflect his (their) personal view(s) about the subject
security (ies) and issuer(s) and that no part of his (their) compensation was, is or will be directly or indirectly related
to the specific recommendation(s) or views contained in this research report.
Disclaimer
Karvy Stock Broking Limited [KSBL] is a SEBI registered Stock Broker, Depository Participant, Portfolio Manager and
also distributes financial products. The subsidiaries and group companies including associates of KSBL provide
services as Registrars and Share Transfer Agents, Commodity Broker, Currency and forex broker, merchant banker
and underwriter, Investment Advisory services, insurance repository services, financial consultancy and advisory
services, realty services, data management, data analytics, market research, solar power, film distribution and
production profiling and related services. Therefore associates of KSBL are likely to have business relations with
most of the companies whose securities are traded on the exchange platform. The information and views presented
in this report are prepared by Karvy Stock Broking Limited and are subject to change without any notice. This report
is based on information obtained from public sources , the respective corporate under coverage and sources believed
to be reliable, but no independent verification has been made nor is its accuracy or completeness guaranteed. The
report and information contained herein is strictly confidential and meant solely for the selected recipient and may
not be altered in any way, transmitted to, copied or distributed, in part or in whole, to any other person or to the
media or reproduced in any form, without prior written consent of KSBL. While we would endeavor to update the
information herein on a reasonable basis, KSBL is under no obligation to update or keep the information current.
Also, there may be regulatory, compliance or other reasons that may prevent KSBL from doing so. The value and
return on investment may vary because of changes in interest rates, foreign exchange rates or any other reason. This
report and information herein is solely for informational purpose and shall not be used or considered as an offer
document or solicitation of offer to buy or sell or subscribe for securities or other financial instruments. Though
disseminated to all the customers simultaneously, not all customers may receive this report at the same time. KSBL
will not treat recipients as customers by virtue of their receiving this report. Nothing in this report constitutes
investment, legal, accounting and tax advice or a representation that any investment or strategy is suitable or
appropriate to your specific circumstances. This material is for personal information and we are not responsible for
any loss incurred based upon it. The investments discussed or recommended in this report may not be suitable for all
investors. Investors must make their own investment decisions based on their specific investment objectives and
financial position and using such independent advice, as they believe necessary. While acting upon any information
or analysis mentioned in this report, investors may please note that neither KSBL nor any associate companies of
KSBL accepts any liability arising from the use of information and views mentioned in this report. Investors are
advised to see Risk Disclosure Document to understand the risks associated before investing in the securities
markets. Past performance is not necessarily a guide to future performance. Forward-looking statements are not
predictions and may be subject to change without notice. Actual results may differ materially from those set forth in
projections
Stock Ratings Absolute Returns Buy : > 15% Hold : 5 - 15% Sell : < 5%
43
October 01, 2015
Yes Bank
Associates of KSBL might have managed or co-managed public offering of securities for the subject
company or might have been mandated by the subject company for any other assignment in the past twelve
months.
Associates of KSBL might have received compensation from the subject company mentioned in the report
during the period preceding twelve months from the date of this report for investment banking or merchant
banking or brokerage services from the subject company in the past twelve months or for services rendered
as Registrar and Share Transfer Agent, Commodity Broker, Currency and forex broker, merchant banker
and underwriter, Investment Advisory services, insurance repository services, consultancy and advisory
services, realty services, data processing, profiling and related services or in any other capacity.
KSBL encourages independence in research report preparation and strives to minimize conflict in
preparation of research report.
Compensation of KSBL’s Research Analysts is not based on any specific merchant banking, investment
banking or brokerage service transactions.
KSBL generally prohibits its analysts, persons reporting to analysts and their relatives from maintaining a
financial interest in the securities or derivatives of any companies that the analysts cover.
KSBL or its associates collectively or Research Analysts do not own 1% or more of the equity securities of
the Company mentioned in the report as of the last day of the month preceding the publication of the
research report.
KSBL or its analysts did not receive any compensation or other benefits from the companies mentioned in
the report or third party in connection with preparation of the research report and have no financial interest
in the subject company mentioned in this report.
Accordingly, neither KSBL nor Research Analysts have any material conflict of interest at the time of
publication of this report.
It is confirmed that KSBL and Research Analysts primarily responsible for this report and whose name(s) is/
are mentioned therein of this report have not received any compensation from the subject company
mentioned in the report in the preceding twelve months.
It is confirmed that Ankit Ladhani, Research Analyst did not serve as an officer, director or employee of the
companies mentioned in the report.
KSBL may have issued other reports that are inconsistent with and reach different conclusion from the
information presented in this report.
Neither the Research Analysts nor KSBL have been engaged in market making activity for the companies
mentioned in the report.
We submit that no material disciplinary action has been taken on KSBL by any Regulatory Authority
impacting Equity Research Analyst activities.
Karvy Stock Broking Limited Office No. 701, 7thFloor, Hallmark Business Plaza, Opp.-Gurunanak Hospital, Mumbai 400 051
RegdOff : 46, Road No 4, Street No 1, Banjara Hills, Hyderabad – 500 034. Karvy Stock Broking Research is also available on: Bloomberg - KRVY <GO>, Thomson Publisher & Reuters.