INDEPENDENCE GROUP NL - igo.com.au
17
25 October 2017 Nova Delivers Solid Results To Underpin Strong Start To FY18 INDEPENDENCE GROUP NL 1Q18 Quarterly Results Presentation
Transcript of INDEPENDENCE GROUP NL - igo.com.au
25 October 2017
Nova Delivers Solid Results To Underpin Strong Start To FY18
INDEPENDENCE GROUP NL1Q18 Quarterly Results Presentation

Cautionary statements & disclaimer
2
• This presentation has been prepared by Independence Group NL (“IGO”) (ABN 46 092 786 304). It should not be considered as an offer or invitation to subscribe for or purchase any securities in IGO or as aninducement to make an offer or invitation with respect to those securities in any jurisdiction.
• This presentation contains general summary information about IGO. The information, opinions or conclusions expressed in the course of this presentation should be read in conjunction with IGO’s other periodic andcontinuous disclosure announcements lodged with the ASX, which are available on the IGO website. No representation or warranty, express or implied, is made in relation to the fairness, accuracy or completenessof the information, opinions and conclusions expressed in this presentation.
• This presentation includes forward looking information regarding future events, conditions, circumstances and the future financial performance of IGO. Often, but not always, forward looking statements can beidentified by the use of forward looking words such as "may", "will", "expect", "intend", "plan", "estimate", "anticipate", "continue" and "guidance", or other similar words and may include statements regarding plans,strategies and objectives of management, anticipated production or construction commencement dates and expected costs or production outputs. Such forecasts, projections and information are not a guarantee offuture performance and involve unknown risks and uncertainties, many of which are beyond IGO’s control, which may cause actual results and developments to differ materially from those expressed or implied.Further details of these risks are set out below. All references to future production and production guidance made in relation to IGO are subject to the completion of all necessary feasibility studies, permit applicationsand approvals, construction, financing arrangements and access to the necessary infrastructure. Where such a reference is made, it should be read subject to this paragraph and in conjunction with furtherinformation about the Mineral Resources and Ore Reserves, as well as any Competent Persons' Statements included in periodic and continuous disclosure announcements lodged with the ASX. Forward lookingstatements in this presentation only apply at the date of issue. Subject to any continuing obligations under applicable law or any relevant stock exchange listing rules, in providing this information IGO does notundertake any obligation to publicly update or revise any of the forward looking statements or to advise of any change in events, conditions or circumstances on which any such statement is based.
• There are a number of risks specific to IGO and of a general nature which may affect the future operating and financial performance of IGO and the value of an investment in IGO including and not limited toeconomic conditions, stock market fluctuations, commodity demand and price movements, access to infrastructure, timing of environmental approvals, regulatory risks, operational risks, reliance on key personnel,reserve and resource estimations, native title and title risks, foreign currency fluctuations and mining development, construction and commissioning risk. The production guidance in this presentation is subject to risksspecific to IGO and of a general nature which may affect the future operating and financial performance of IGO.
• Any references to IGO Mineral Resource and Ore Reserve estimates should be read in conjunction with IGO’s 2017 Mineral Resource and Ore Reserve announcement dated 23 October 2017 and lodged with theASX, which is available on the IGO website.
• All currency amounts in Australian Dollars unless otherwise noted.• Cash Costs are reported inclusive of Royalties and after by-product credits on per unit of payable metal basis, unless otherwise stated.• IGO reports All-in Sustaining Costs (AISC) per ounce of gold for its 30% interest in the Tropicana Gold Mine using the World Gold Council guidelines for AISC. The World Gold Council guidelines publication was
released via press release on 27 June 2013 and is available from the World Gold Council’s website.• Underlying EBITDA is a non-IFRS measure and comprises net profit or loss after tax, adjusted to exclude tax expense, finance costs, interest income, asset impairments, redundancy and restructuring costs,
depreciation and amortisation, and once-off transaction costs.• Underlying NPAT comprises net profit (loss) after tax adjusted for; post tax effect of acquisition and integration costs, and impairments.• Free Cash Flow comprises Net Cash Flow from Operating Activities and Net Cash Flow from Investing Activities. Underlying adjustments exclude acquisition costs, proceeds from investment sales and payments for
investments.
1Q18 Highlights
3
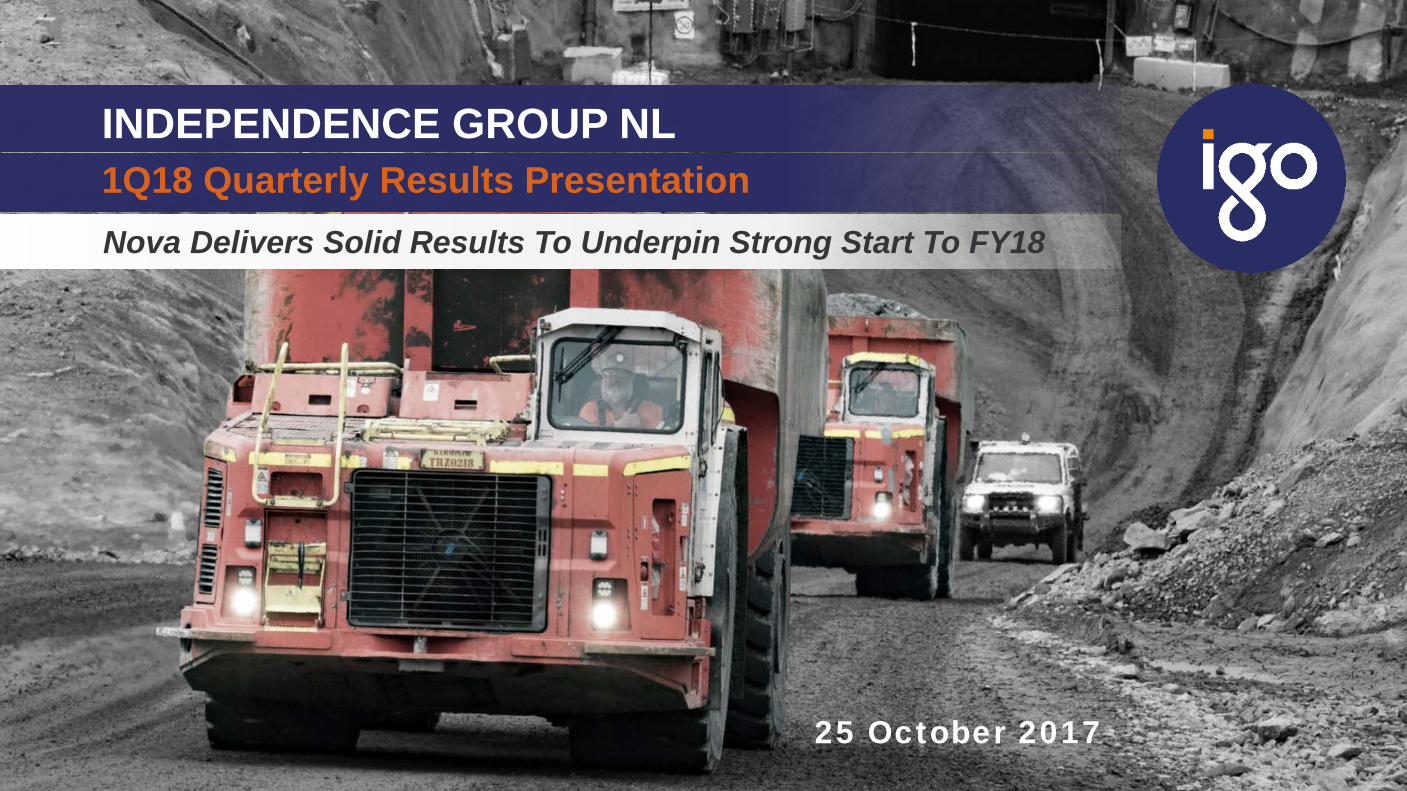
Nova Delivers Solid Results To Underpin Strong Start To FY18
• Successful maiden quarter of commercial production from Nova with nickel production and cash costs within guidance
• Nova activities now at steady state level and 2Q18 expected to be at nameplate 1.5Mtpa rate
• Primary metal production and cash costs from Tropicana, Jaguar and Long all broadly within guidance
• Unaudited underlying EBITDA and cash flow from operating activities both higher quarter on quarter at A$69M and A$61M respectively
• First term debt repayment of A$29M made and net debt now at A$142M
• FY17 final dividend A$5.9M paid in 1Q18
• Chief Operating Officer transition planned for early CY18
Transitioned to cash generation phase
Sustainability
4
Focused on better outcomes for our people
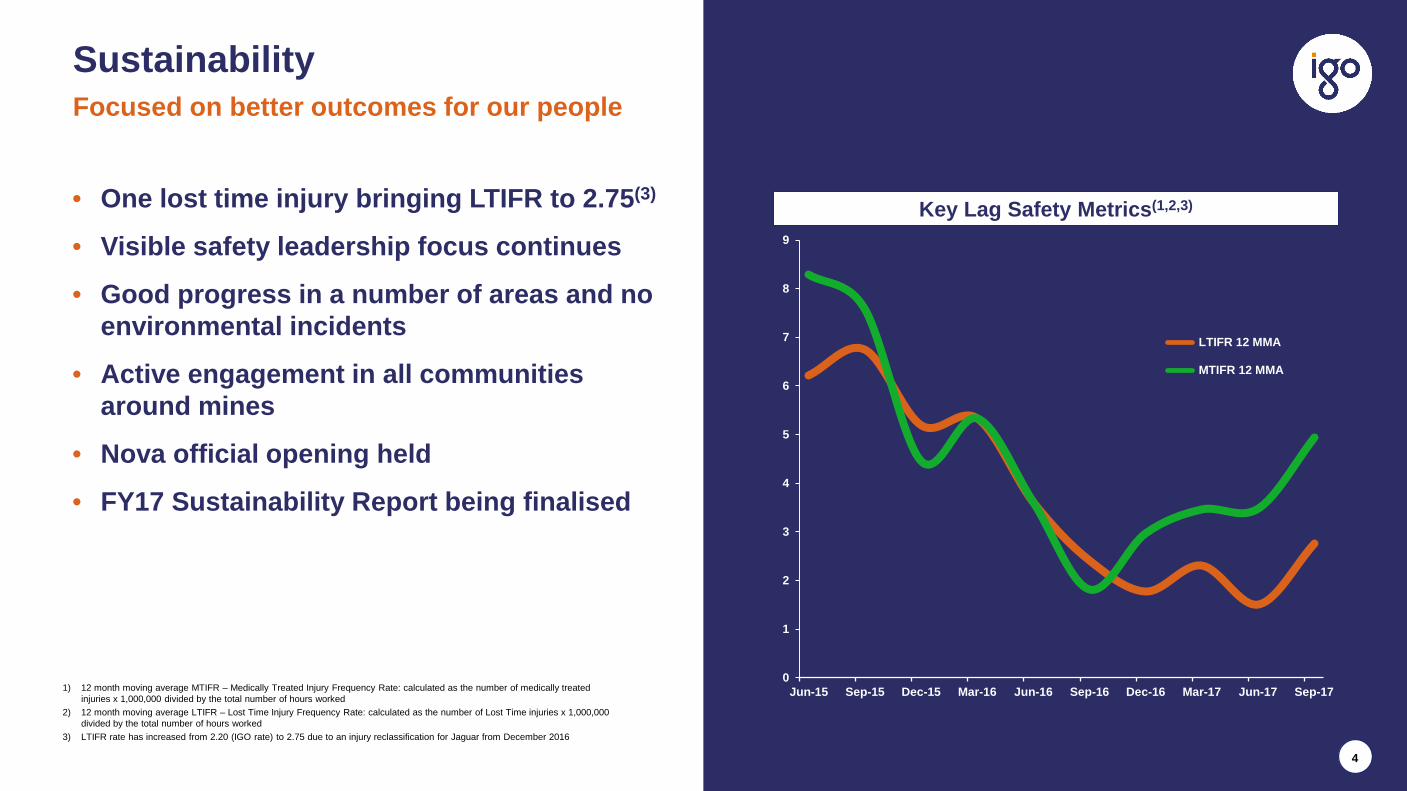
1) 12 month moving average MTIFR – Medically Treated Injury Frequency Rate: calculated as the number of medically treated injuries x 1,000,000 divided by the total number of hours worked
2) 12 month moving average LTIFR – Lost Time Injury Frequency Rate: calculated as the number of Lost Time injuries x 1,000,000 divided by the total number of hours worked
3) LTIFR rate has increased from 2.20 (IGO rate) to 2.75 due to an injury reclassification for Jaguar from December 2016
Key Lag Safety Metrics(1,2,3)• One lost time injury bringing LTIFR to 2.75(3)
• Visible safety leadership focus continues
• Good progress in a number of areas and no environmental incidents
• Active engagement in all communities around mines
• Nova official opening held
• FY17 Sustainability Report being finalised
0
1
2
3
4
5
6
7
8
9
Jun-15 Sep-15 Dec-15 Mar-16 Jun-16 Sep-16 Dec-16 Mar-17 Jun-17 Sep-17
LTIFR 12 MMA
MTIFR 12 MMA
Strengthening Financial Results
5
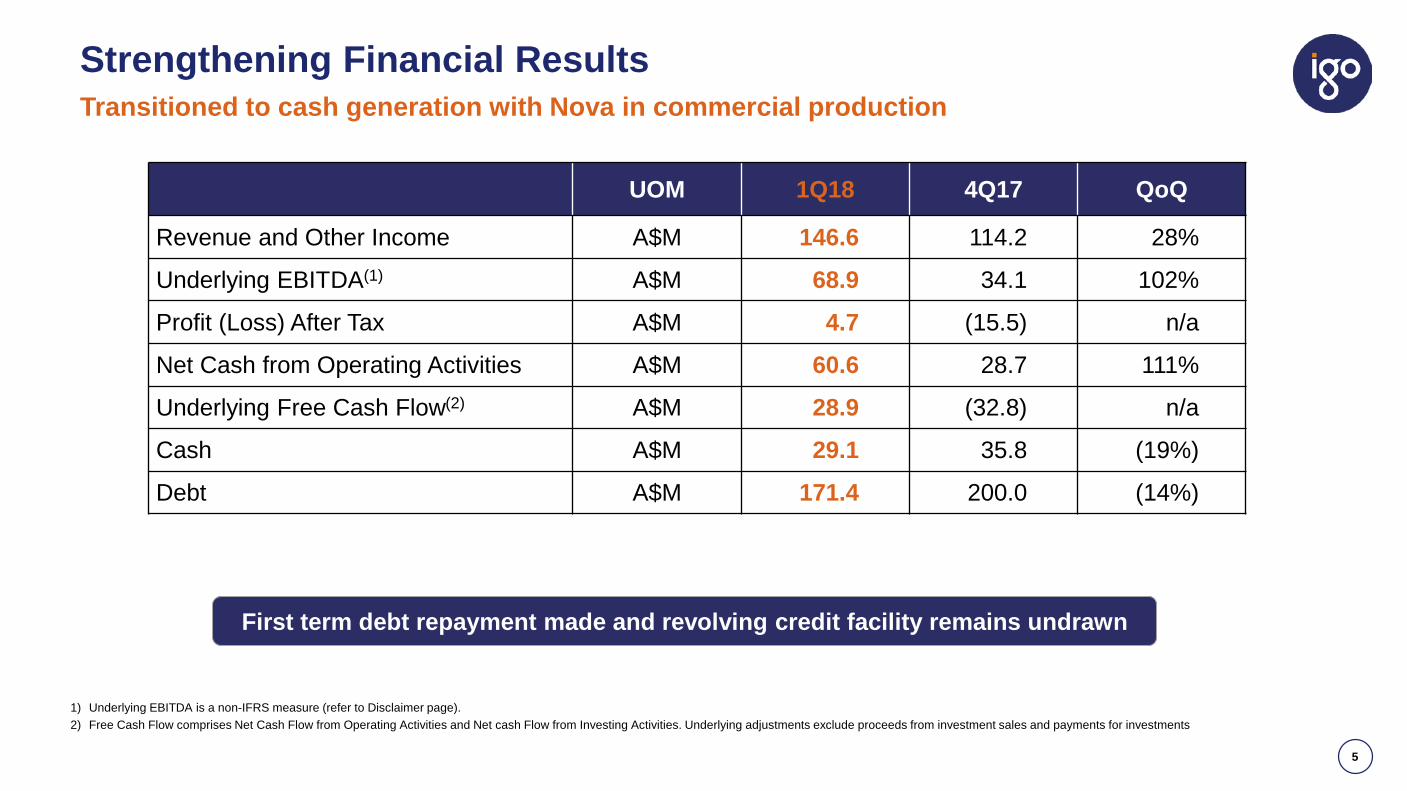
Transitioned to cash generation with Nova in commercial production
1) Underlying EBITDA is a non-IFRS measure (refer to Disclaimer page). 2) Free Cash Flow comprises Net Cash Flow from Operating Activities and Net cash Flow from Investing Activities. Underlying adjustments exclude proceeds from investment sales and payments for investments
UOM 1Q18 4Q17 QoQ
Revenue and Other Income A$M 146.6 114.2 28%
Underlying EBITDA(1) A$M 68.9 34.1 102%
Profit (Loss) After Tax A$M 4.7 (15.5) n/a
Net Cash from Operating Activities A$M 60.6 28.7 111%
Underlying Free Cash Flow(2) A$M 28.9 (32.8) n/a
Cash A$M 29.1 35.8 (19%)
Debt A$M 171.4 200.0 (14%)
First term debt repayment made and revolving credit facility remains undrawn

1Q18 Cash Flow Reconciliation
6
Net debt reduced from A$164M to A$142M
36
16
11
10
10 10
52
29
6
29
-
10
20
30
40
50
60
70
80
90
TropicanaFCF
Jaguar FCF
NovaFCF
LongFCF
Exploration & BD
Corporate costs & WC
Finance Costs Borrowings Dividend
Cash at 30June 2017
Operations Cash at 30September
2017
A$M

Nova
7
Nickel production at top end of guidance in maiden quarter of commercial production
1) Cash costs expressed per pound of payable metal and are inclusive of royalties and by-product credits2) Implied quarterly guidance (First Half FY18 guidance divided by two)
Metric Units Guidance(2) 1Q18 4Q17Nickel in concentrate t 3,750 - 4,500 4,500 2,477
Copper in concentrate t 2,000 - 2,250 1,844 1,329
Cobalt in concentrate t 125 - 175 142 79
Cash cost (payable)(1) A$/Ib Ni 3.70 - 4.50 3.98 n/a
Development Capex A$M 15.0 – 16.0 14.7 n/a
Build Capex A$M 0.0 – 1.0 1.1 37.8
Sustaining Capex A$M 1.5 - 2. 5 0.1 n/a
Exploration expenditure A$M 2.5 - 3.0 1.6 2.4
1Q18 Drivers & Outlook• All mining from Nova with limited operational flexibility• Bollinger development is “on track” for mining in 3Q18 - will improve operational flexibility• Grade generally conforming to new resource model but with localised variability• Recovery lower than life of mine target but in line with expectation for feed grade
processed during 1Q18• Grade control drilling is ongoing ~98% complete at Nova and ~50% complete at Bollinger
518 507
2,477
4,500
407 370
1,329 1,844
0500
1,0001,5002,0002,5003,0003,5004,0004,5005,000
2Q17 3Q17 4Q17 1Q18
Tonnes Nova Production
Nickel in concentrate Copper in concentrate
31.1 26.7
6.8
20.7 18.2
(5)
-
5
10
15
20
25
30
35
UnderlyingEBITDA
Inventories TradeReceivables
OtherWorking
Capital adj
OperatingCash Flow
A$M Nova Cash Flow Reconciliation

Nova Grade Control(1)
8
Early de-risking of mineral resource
1) Refer to ASX release dated 26 Jul 2017: Nova Mineral Resource Estimate and Exploration Update
• Grade control drilling well progressed
• Priorities to shift in 2Q18
- Drill inferred mineralisation
- Drill potential extensions
- Bollinger grade control to continue into 3Q18
• Update Ore Reserve with benefit of additional information in 2H18
Plan view of Nova-Bollinger grade control drilling
Section view of Bollinger extensional drilling(1)
Nova Mine Lease Exploration
9
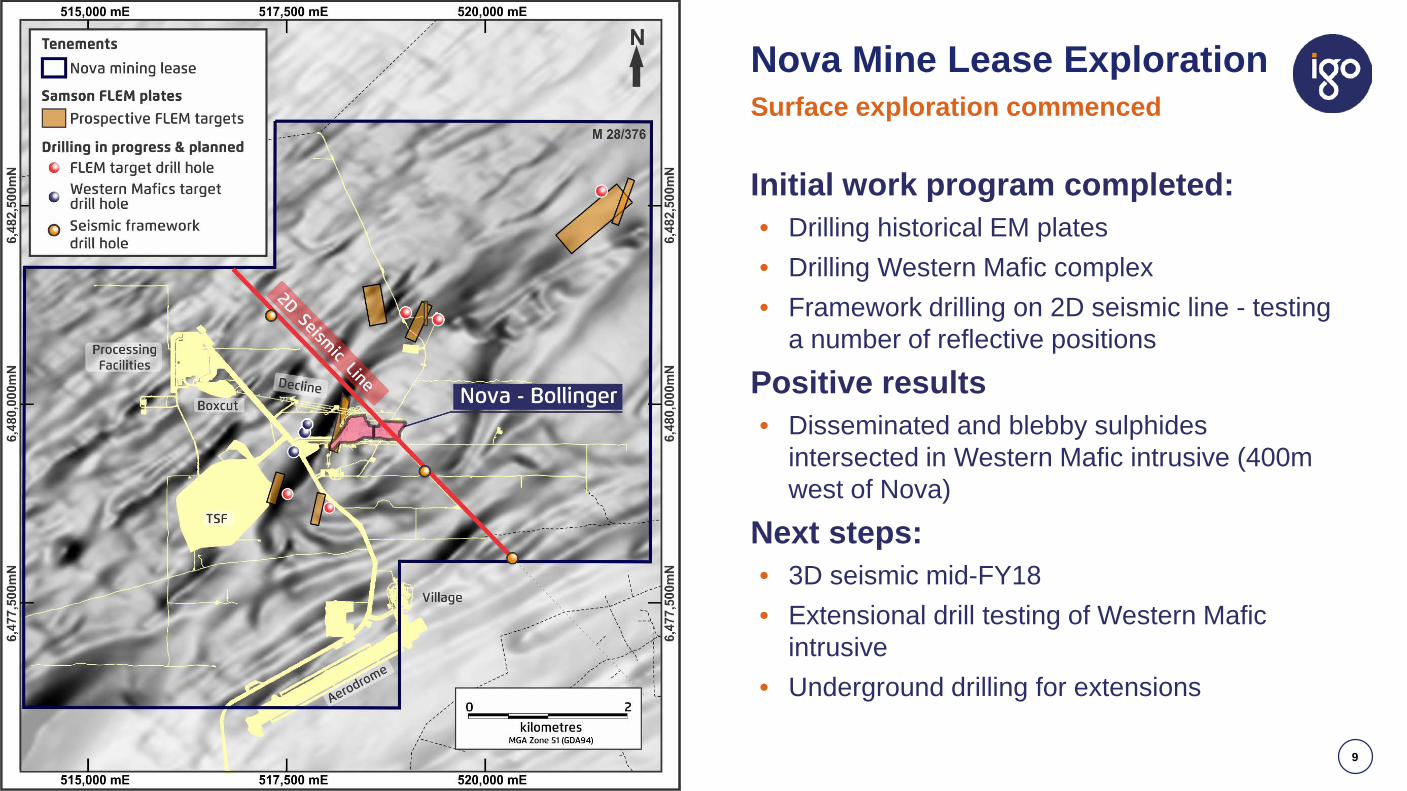
Surface exploration commenced
Initial work program completed:• Drilling historical EM plates• Drilling Western Mafic complex • Framework drilling on 2D seismic line - testing
a number of reflective positionsPositive results• Disseminated and blebby sulphides
intersected in Western Mafic intrusive (400m west of Nova)
Next steps:• 3D seismic mid-FY18• Extensional drill testing of Western Mafic
intrusive• Underground drilling for extensions

Tropicana
10
Consistent performance with all metrics within guidance
1) AISC is All-in Sustaining Costs 2) Implied quarterly guidance (FY18 guidance divided by four)
Metric Units Guidance(2) 1Q18 4Q17Gold produced (100%) koz 110.0 – 122.5 114.1 110.5
Gold Sold (IGO 30%) koz 33.0 – 36.7 33.0 32.4
Cash cost A$/oz 680 - 750 737 815
AISC(1) A$/oz 1,060 – 1,170 1,167 1,286
Sustaining/improve capex A$M 2.2 – 3.0 2.4 2.1
Capitalised waste stripping A$M 11.0 – 13.7 12.9 14.4
Exploration expenditure A$M 1.0 – 1.2 1.1 1.2
1Q18 Drivers & Outlook• Accelerated mining rates implemented in late 2016 to access ore at the bottom of Tropicana
and Havana pits was sustained during the Quarter• Stronger 1Q18 result driven by higher throughput (7.8Mtpa) and grade• Recovery lower than design due to high processing rate – capex project to install additional
milling capacity to improve grind and recovery being developed for CY18 implementation• 2Q18 expected to be significantly stronger followed by softer 3Q18 and 4Q18• Long Island on track for completion in 2Q18• Drilling program to test underground mining targets under Boston Shaker pit underway
1,051
1,2291,286
1,167
0
200
400
600
800
1,000
1,200
1,400
0
20,000
40,000
60,000
80,000
100,000
120,000
140,000
2Q17 3Q17 4Q17 1Q18
A$/ozoz TropicanaProduction (100%) and AISC
Ounces Produced (100%) All in Sustaining Costs AUD $/oz
32.1
1.7 0.3 0.9
31.6
-
5
10
15
20
25
30
35
40
UnderlyingEBITDA
Inventories TradeReceivables
OtherWorking
Capital adj
OperatingCash Flow
A$MTropicana Cash Flow Reconciliation

Jaguar
11
Solid contribution from Jaguar
1) Cash costs expressed per pound of payable metal and are inclusive of royalties and by-product credits2) Implied quarterly guidance (FY18 guidance divided by four)
Metric Units Guidance(2) 1Q18 4Q17Zinc in concentrate t 7,250 – 8,250 8,105 7,399
Copper in concentrate t 650 – 750 530 1,121
Cash cost (payable)(1) A$/lb Zn 0.85 – 1.05 1.03 0.66
Sustaining capex A$M 2.0 – 2.2 3.2 1.7
Development capex A$M 2.5 – 2.7 2.7 3.8
Exploration expenditure A$M 0.7 – 1.2 0.6 1.1
1Q18 Drivers & Outlook• Higher zinc grades than planned offset by lower copper grades. Copper grades are
expected to improve in 2Q18• Sustaining capex program front ended in FY18 – no change to full year guidance• Drilling continued at Bentayga (Bentley Deeps)• External approvals for Triumph development and Process Plant optimisation project to
produce a third concentrate were obtained. Further drilling at Triumph and project risk assessment in 2Q18 prior to development decision
• Regional work program continuing
8,331
6,5997,399
8,105
869 6881,121
530
01,0002,0003,0004,0005,0006,0007,0008,0009,000
2Q17 3Q17 4Q17 1Q18
Tonnes Jaguar Production
Zinc in concentrate Copper in concentrate
13.1
6.5 9.0
1.2
16.8
- 2 4 6 8
10 12 14 16 18
UnderlyingEBITDA
Inventories TradeReceivables
OtherWorking
Capital adj
OperatingCash Flow
A$M Jaguar Cash Flow Reconciliation

Long
12
Lower than expected grade offset by higher tonnes mined
1) Cash costs expressed per pound of payable metal and are inclusive of royalties and by-product credits2) Implied quarterly guidance (FY18 guidance divided by four)
Metric Units Guidance(2) 1Q18 4Q17Contained nickel produced t 1,350 – 1,500 1,572 2,069
Cash cost (payable)(1) A$/lb Ni 4.40 – 4.90 4.80 3.47
Sustaining capex A$M 0.1 – 0.3 0.1 0.0
Development capex A$M 0.1 – 0.3 0.0 0.0
Exploration expenditure A$M 0.3 – 0.5 0.0 0.0
1Q18 Drivers & Outlook• Planning for cessation of mining and commencement of care and maintenance from 4Q18
is underway• Current mining is from multiple mining areas• Grade negatively impacted by lower grades from material mined outside ore reserve in
the Quarter but offset by higher tonnes mined• EM survey at Long North to test concept that mineralisation continues is schedule for late
in 2Q18
2,063 2,136 2,069
1,572
144 151 147 1170
500
1,000
1,500
2,000
2,500
2Q17 3Q17 4Q17 1Q18
Tonnes Long Production
Nickel Produced (contained) Copper Produced (contained)
4.5
4.4
0.9
9.7
-
2
4
6
8
10
12
UnderlyingEBITDA
TradeReceivables
Other WorkingCapital adj
Operating CashFlow
A$M Long Cash Flow Reconciliation
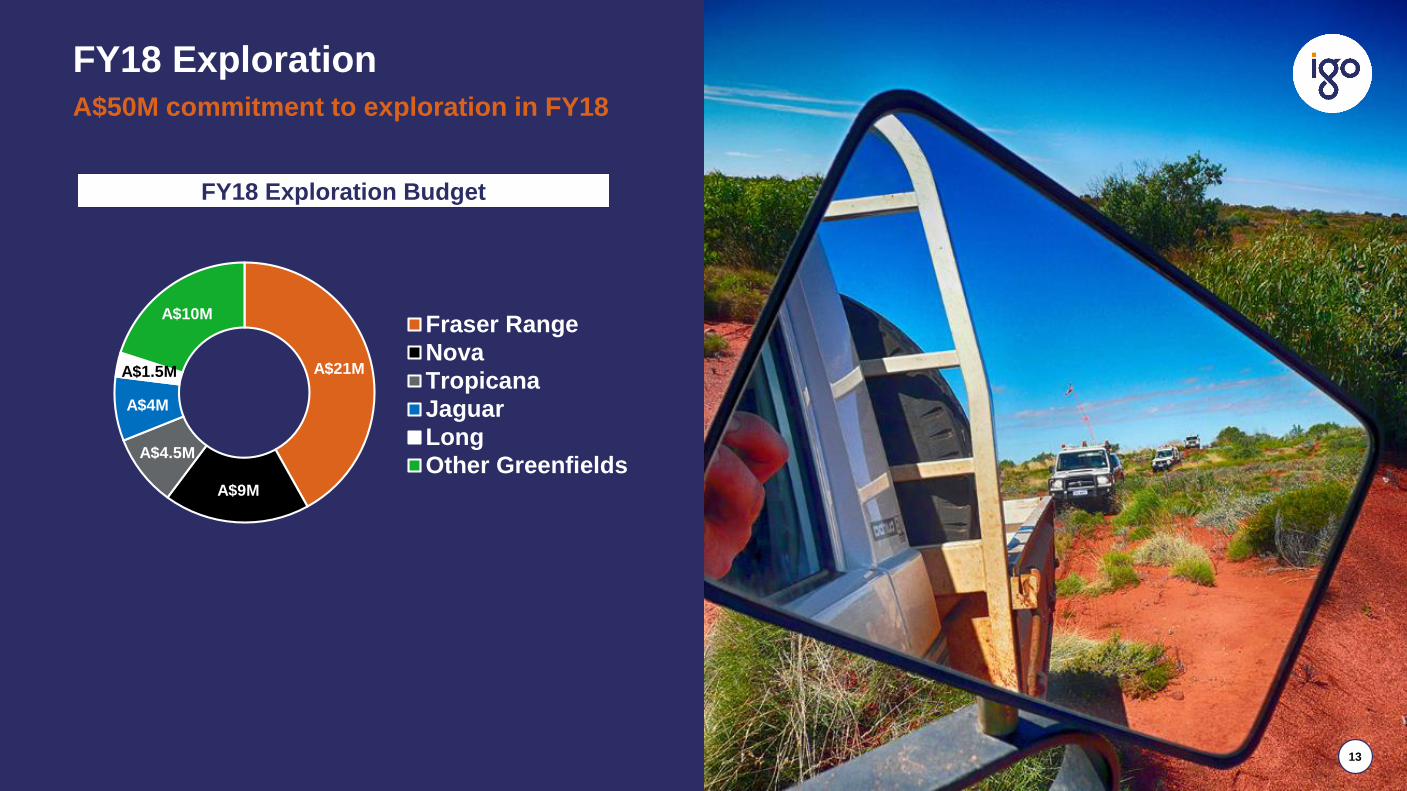
FY18 Exploration A$50M commitment to exploration in FY18
FY18 Exploration Budget
A$21M
A$9M
A$4.5M
A$4M
A$1.5M
A$10M Fraser RangeNovaTropicanaJaguarLongOther Greenfields
13

Fraser Range Exploration
14
12,000km2 of tenure consolidated
Systematic exploration continued in 1Q18:• EM surveys identified conductors that warrant follow up
• Ongoing gravity survey and mapping of mafic/ultramafic intrusives
• Aircore program with 57,724m drilled to Quarter end
• Spectrem airborne survey to commence 2Q18
• RC/Diamond program scheduled for mid-FY18 at
─ Mai Tai
─ Woolly
─ Pygmy
─ Zanthus
14

Lake Mackay Exploration
15
Belt scale greenfields project
Access to tenure progressed in 1Q18• Exploration deeds signed with CLC
• Licences over expanded tenure granted
First diamond drilling at Grapple(1)
• Six holes completed for 2,917m
• Multiple narrow sulphide intervals in all holes
• Hole 1 returned two mineralised intersections:
─ 11.4m @ 7.9g/t Au, 20.7g/t Ag, 0.8% Cu, 1.1% Zn, 0.5% Pb and 0.1% Co from 285m
─ 14.4m @ 1.8g/t Au, 6.0g/t Ag, 1.1% Cu, 0.3% Zn and 0.1% Pb from 348m
• Assays pending on other holes - EM targets down plunge
1) Refer to ASX release dated 18 Sep 2017: Lake Mackay JV – Grapple Prospect Drilling UpdateGrapple drilling long section(1)

16
• Nova in commercial production with solid 1Q18 delivered
• Nova expected to be at 1.5Mtpa run rate for 2Q18
• Solid contributions from Tropicana, Jaguar and Long
• All financial metrics stronger in 1Q18 and net debt reduced from A$164M to A$142M
• COO transition in early CY18
Transitioned to cash generation phase
Concluding Comments