
Increasing Working Capital Efficiencypublications.lib.chalmers.se/records/fulltext/180019/... ·...
86
Increasing Working Capital Efficiency Accelerating Cash Flows by Identifying and Reducing Excess Tied-Up Capital in Finished Goods Inventories Master of Science Thesis in the Master Degree Program Supply Chain Management MARTIN JOHANSSON JACOB MALMQVIST Department of Technology Management and Economics Division of Logistics and Transportation CHALMERS UNIVERSITY OF TECHNOLOGY Gothenburg, Sweden, 2013 Report No. E2013:046
Transcript of Increasing Working Capital Efficiencypublications.lib.chalmers.se/records/fulltext/180019/... ·...

Increasing Working Capital Efficiency Accelerating Cash Flows by Identifying and Reducing Excess
Tied-Up Capital in Finished Goods Inventories
Master of Science Thesis in the Master Degree Program Supply Chain
Management
MARTIN JOHANSSON
JACOB MALMQVIST
Department of Technology Management and Economics
Division of Logistics and Transportation
CHALMERS UNIVERSITY OF TECHNOLOGY
Gothenburg, Sweden, 2013
Report No. E2013:046

REPORT NO. E2013:046
Increasing Working Capital Efficiency
Accelerating Cash Flows by Identifying and Reducing Excess Tied-Up Capital
in Finished Goods Inventories
Master of Science Thesis
MARTIN JOHANSSON
JACOB MALMQVIST
Department of Technology Management and Economics
Division of Logistics and Transportation
CHALMERS UNIVERSITY OF TECHNOLOGY
Gothenburg, Sweden, 2013

Increasing Working Capital Efficiency: Accelerating Cash Flows by
Identifying and Reducing Excess Tied-Up Capital in Finished Goods
Inventories
MARTIN JOHANSSON
JACOB MALMQVIST
© MARTIN JOHANSSON & JACOB MALMQVIST, 2013
Report No. E2013:046
Department of Technology Management and Economics
CHALMERS UNIVERSITY OF TECHNOLOGY
SE–412 96 Göteborg
Sweden
Telephone +46(0)31-772 1000
Chalmers Reproservice
Gothenburg, Sweden, 2013

ACKNOWLEDGEMENTS This master thesis was carried out at the Global Logistics & Manufacturing department at the
Case Company’s headquarters in Gothenburg between September 2012 and February 2013.
The thesis is written within the area of the authors’ master program Supply Chain
Management at Chalmers University of Technology. The thesis is the last thing we do at
Chalmers in order to become engineers ready to start our careers and face new challenges.
Writing the thesis for a company has therefore been a great opportunity to achieve valuable
experience from the business world, in addition to the academic learnings.
First of all, we would like to thank our supervisor Paulina Myrelid at the Division of Logistics
and Transportation at Chalmers. She has supported us throughout the writing of the thesis and
shown a genuine interest for what we have done. She has also come up with valuable ideas
and apprehensive input that has contributed to the quality of the thesis.
We would also like to thank our supervisor at the Case Company, Daniel Mattsson, for giving
us the opportunity to write this thesis. He has provided us with support and encouragement
throughout the thesis. In addition, we would like to thank Anna Jerrelind for the time she
spent helping us with retrieving quantitative data.
Finally, we would like to thank all people that we have interviewed at different departments at
the Case Company, for their time and valuable contribution to the thesis. We are also grateful
for the warm and welcoming atmosphere that we experienced during the time we spent at the
Global Logistics & Manufacturing department.
Gothenburg, February 2013
Martin Johansson Jacob Malmqvist

ABSTRACT
Efficient working capital is an important aspect of a firm’s financial strength in terms of
ability to finance its daily operations and growth. By releasing tied-up capital and increasing
inventory turnover, a firm’s working capital can become more efficient. Based on this, the
purpose of the thesis is to investigate which business processes that cause excess tied-up
capital in finished goods and create a set of actions for speeding up inventory turnover
without decreasing the current service levels. In order to reach the purpose a case study based
on a combination of qualitative and quantitative methodology was carried out. A first phase of
qualitative data collection through interviews was performed. In the next phase extensive
amounts of quantitative data was collected from the case company’s ERP-system. The
quantitative data was then analyzed and complemented by another phase of qualitative data
collection. The analysis is built around a framework developed by the researchers, which
categorizes finished goods inventory in relation to how these inventories were created and
how they are governed. Each category is then analyzed and the results suggest that lack of
appropriate information sharing and transparency along with conflicting KPI’s and
prioritizations between various functions and actors in the order to delivery process result in
excess tied-up capital in finished goods. Furthermore, the fact that the company on which this
case study is based, offers a flexible product mix, but lacks an efficient system for matching
configured engines with new customer orders tend to slow down inventory turnover.
Suggestions for improvement include the adaption of a more holistic view across processes,
functions and actors through better communication and information sharing as well as an
improved search and allocation functionality for configured engines.
Key Words
Working capital, cash conversion cycle, inventory turnover, finished goods inventory, order-
to-delivery process, order scheduling

TABLE OF CONTENTS
1. Introduction ....................................................................................................................... 1
1.1 Theoretical Background ................................................................................................... 1
1.2 Case Company Background ............................................................................................. 2
1.3 Purpose ............................................................................................................................. 3
1.4 Problem analysis ............................................................................................................... 3
1.5 Research Questions ........................................................................................................... 4
1.6 Disposition of the Thesis .................................................................................................. 4
2. Theoretical Framework .................................................................................................... 6
2.1 Costs for Carrying Inventory ............................................................................................ 6
2.2 International Trade and the Effects on Inventory Turnover ............................................. 7
2.3 Customer Payment Methods ............................................................................................. 8
2.4 Shifting Production Strategies and Finished Goods Inventories .................................... 10
2.5 Reasons for Holding Finished Goods Inventory ............................................................ 11
2.6 Excess Inventory as an Outcome of Processes ............................................................... 12
2.7 Order to Delivery Process ............................................................................................... 12
2.8 Summary of the Theoretical Framework ........................................................................ 15
3. Methodology .................................................................................................................... 18
3.1 Choice of Research Method ........................................................................................... 18
3.2 Data Collection ............................................................................................................... 19
3.3 Data Analysis .................................................................................................................. 23
3.4 Reliability and Validity .................................................................................................. 23
4. Empirical Findings .......................................................................................................... 26
4.1 The Case Company ......................................................................................................... 26
4.2 The Logistics Organization ............................................................................................ 26
4.3 The Sales Organization ................................................................................................... 27
4.4 The Global Distribution Organization ............................................................................ 28
4.5 Engine Types and Planning Environment ...................................................................... 29
4.6 The Production Environment at the Case Company ...................................................... 30
4.7 Carrying Cost of Inventory ............................................................................................. 31
4.8 The Order to delivery Process ........................................................................................ 32
4.9 Waiting for Shipment ..................................................................................................... 40
4.10 International Trade Risks and Tied-Up Capital ............................................................ 42
4.11 Customer Payment Conditions ..................................................................................... 42
5. Analysis ............................................................................................................................ 45
5.1 How should finished goods be categorized in order to describe important causes of
excess tied-up capital in the order to delivery cycle? ........................................................... 45
5.2 Why is excess capital tied-up in finished goods inventory? ........................................... 47
5.3 How can excess tied-up capital in finished goods inventory be reduced without reducing
the service Level? ................................................................................................................. 62
6. Discussion and Recommendations ................................................................................. 68
6.1 How the Thesis Contributes to the Case Company ........................................................ 68
6.2 How the Thesis Contributes to Firms in General ........................................................... 71
6.3 How the Thesis Contributes to the Academia ................................................................ 72
7. Conclusions ...................................................................................................................... 73
8. Further Research ............................................................................................................ 74
Bibliography ........................................................................................................................... 75
List of Interviewees ................................................................................................................ 77
LIST OF ACRONYMS ASE Authorized Stock Engine
CCC Cash Conversion Cycle
DIO Days Inventory Outstanding
DPO Days Payable Outstanding
DSO Days Sales Outstanding
ERP Enterprise Resource Planning
FG Finished Goods
MTO Make to Order
MTS Make to Stock
KPI Key Performance Indicator
OTD Order to Delivery
RM Raw Material
WFS Waiting for Shipment
WIP Work in Progress
1
1. INTRODUCTION This introduction provides the reader with a theoretical as well as a case company
background of the thesis, which leads to the purpose. Furthermore, a problem analysis is
carried out, resulting in three research questions that will be answered later on in the thesis
in order to reach the purpose.
1.1 THEORETICAL BACKGROUND
In the global markets of today, firms are continuously facing new challenges and fierce
competition. Efficient working capital is therefore necessary as it is an important aspect of a
firm’s financial strength and ability to finance growth. Working capital is a measurement used
to describe the differential between current assets and current liabilities, in other words assets
that are expected to turn into cash in the near future versus liabilities that require prompt cash
payment. The quality of working capital is determined by the nature of the assets and the
length of time required turning those assets into cash. Positive working capital is necessary for
a firm in order to be able to continue its daily operations in terms of sufficient funds to satisfy
short-term debts and upcoming operational expenses (Williams et al., 2008).
The amount of working capital a firm should carry depends on its sales volume, its need for
gross circulating capital relative to its sales volume and the stability of its operations. A firm’s
rate of profit can be increased by economizing on the use of working capital. However, this
will result in increased risks for the firm in terms of short-term financial risks (Guerard et al.,
2007). According to Guerard et al. (2007), firms with stable and predictable cash receipts,
current assets that are marketable, stable in value or short-term and liquid, or have low
amounts of long-term debt can minimize its working capital requirements. On the contrary,
firms with irregular and unpredictable cash flows and cash receipts, slow-moving inventories,
fluctuating market prices, or firms that by the nature of their business are exposed to high
credit risks have higher working capital needs (Guerard et al., 2007). The cash conversion
cycle (CCC) is a key performance indicator that can be used to measure how well firms
perform regarding cash flow and working capital efficiency (Jose et al., 1996).
According to Casey (1997), it is no longer sufficient to only manage hard costs, but timing of
production, speed of production and payments will also be crucial to manage. What Casey is
referring to could be described as focusing improvements on speeding up cash flows and
utilize working capital more efficiently. In line with Casey’s (1997) statement, Jose et al.
(1996) conclude that there is significant statistical evidence for an inverse relationship
between return on assets, in other words profitability, and aggressive liquidity management
corresponding to a fast CCC for manufacturing companies. Hence, a faster cash flow was
proven to be related to higher profitability. This statement is supported by Hutchison et al.
(2007), who highlight the importance of improving the CCC to raise profitability. Srivastava
et al. (1998) and Christopher (2011) put further light on the importance of accelerating cash
flows, as well as increasing cash flow levels by reducing costs and increasing revenues.
The CCC is the net number of days from payment of raw materials to receiving payment from
the customer. Consequently, CCC can be used to measure the length of time capital is tied-up
in the production and sales process before the resource inputs are converted into cash flows
2
when customers pay for the ordered products. This means the amount of time needed to sell
inventory of finished goods, the amount of time needed to collect receivables and the firm’s
conditions of payment in terms of the length of time it is afforded to pay its bills (Jose, 1996).
The CCC days are divided into three main categories: Days Inventory Outstanding (DIO),
Days Payable Outstanding (DPO) and Days Sales Outstanding (DSO). The DIO expresses the
time it takes to sell the entire inventory. The DPO expresses the time a company may have
debts to suppliers without incurring any penalties. The DSO expresses the time customers are
in debt to the company.
Grosse-Ruyken et al. (2011) agree with Hutchison et al. (2007) and Jose et al. (1996) that
there is a distinct relationship between profitability and CCC but put further emphasis on
avoiding sub optimization and improved CCC for one firm on the behalf of other value chain
members. They stress that CCC should be determined strategically from a supply chain
perspective. They further believe that squeezing suppliers and buyers on better payment terms
for the focal company only yields short term returns. In a long term profit perspective this
moves focus from DSO and DPO to DIO.
1.2 CASE COMPANY BACKGROUND
The thesis was conducted as a case study at a company that has chosen to be anonymous due
to confidentiality reasons. The case study company is therefore called “Case Company”
throughout this report. In a global market the Case Company is facing new challenges and
pressure to stay competitive. Consequently, there is a need for changes in order to reach
expected profitability levels. Top management has therefore stressed the importance of
developing a “World Class Supply Chain” that should care for efficient working capital and
inventory management. By securing working capital efficiency, the Case Company wishes to
finance company growth and balance accounts receivables and inventory with accounts
payables and advance payments from customers. For the logistics department, hereafter called
“Global Logistics”, at the Case Company, this translates into sustaining a high service level to
the customers and at the same time keeping a high level of inventory turnover.
At the Case Company an important measurement of working capital efficiency is the CCC. As
of today the company is more content with its level of DPO and DSO compared to DIO. This
leaves DIO as the main improvement area to speed up the entire CCC. DIO expresses the time
it takes to sell the entire inventory and is therefore another way of measuring inventory
turnover.
Global Logistics area of interest is DIO in finished goods since this is where the critical mass
of aggregate inventory value is held. However, the Global Logistics department has expressed
that decreasing DIO is a challenge that they cannot face alone. There is a need to involve the
sales department in how to govern its global finished goods inventories more effectively and
achieve the strategic objective to have a strong positive cash-flow contribution that provides
self-funding for future growth. However, previous discussions with sales have not worked out
the way that Global Logistics would have wished as prioritizations have been differing
between the departments. Thus the Global Logistics department has requested the creation of
a mutual understanding among the departments concerning how to manage tied-up capital in
3
finished goods and its impact on working capital and profits. The department has emphasized
the need to visualize the cost of inventory as well as the improvement potential to aid the
department in getting more attention and cooperation from the sales departments. Global
Logistics is aware that in order to significantly decrease DIO by reducing excess inventories
the company needs to improve its business processes.
1.3 PURPOSE
The purpose of the thesis is to investigate processes causing excess tied up capital in finished
goods and create a set of actions for speeding up inventory turnover without decreasing
present service levels.
1.4 PROBLEM ANALYSIS
An underlying problem has been that finished engines have not been shipped and thus not
invoiced on time due to what Global Logistics refer to as commercial reasons that are
influenced by the interaction between the sales department and the customers or distributors.
This has created frustration at Global Logistics, which wish to solve this issue but also look
for other areas of improving inventory turnover. Reinforced inventory rules have been
suggested but not yet implemented by the Global Logistics department. However, new tough
targets of DIO will only be realistic to reach if the Case Company improves its business
processes. Creating a stricter inventory policy would be a way to force process improvement
on the sales departments and their interaction with customers, but not initially solve any of the
root causes. With this in mind the intention of this thesis will be to look further into what is
causing excess inventory in finished goods with focus on understanding the causes. The
order-to-delivery (OTD) business process at the Case Company is important when
determining the length of time finished goods spend in inventory for all products on orders.
Since the Case Company finalizes a large proportion of its products based on customer orders,
the OTD process will be significantly important in this study. This is in line with trends in
manufacturing strategies, which are shifting towards more make-to-order production
according to Donovan (2013).
The present data on inventory turnover at the Case Company only contains figures at an
aggregated level that are insufficient to pinpoint where problems are located. New
quantitative data collection of bottlenecks in the OTD process will be needed to be able to
reach higher levels of detail in the data in order to draw conclusions on what activities are
causing the excess inventories. There is a need to describe current and past inventory in
finished goods at the Case Company. To enable further analysis in order to understand what is
driving the levels of tied up capital in finished goods inventory a framework needs to be
developed. This framework will have to be able to trace the related processes that generate
tied-up capital, thus the framework will need to classify finished goods inventories into
different categories with regards to commonality in traits. It is assumed that commonality in
traits of the categories will correspond to a common set of processes that generate the levels
of tied-up capital for each category. The production strategy along with the characteristics of
the products will have to be described to better understand the causes of unwanted levels of
finished goods inventories at the Case Company. The OTD process, sub-processes and
included activities at the Case Company will need to be investigated to pinpoint causes.

4
Standard process descriptions need to be put in contrast and compared to interviews with
operative staff who are the ones actually working in the processes. To look for further areas
with improvement potential it will be necessary to understand how the inventory works today.
1.5 RESEARCH QUESTIONS
In order to reach the purpose of the thesis, the problem has been broken down into three
research questions (RQ) based on the problem analysis. The three research questions are:
1. How should finished goods be categorized in order to describe important causes of
excess tied up capital?
2. Why is excess capital tied up in finished goods inventory?
3. How can excess tied-up capital in finished goods inventory be reduced without
decreasing service level?
1.6 DISPOSITION OF THE THESIS
As a baseline for this research a theoretical foundation on working capital efficiency and the
cash conversion cycle was provided in the introduction, granting an understanding for the
importance of acceleration of cash flows. With the scope set on finished goods inventories it
will be essential to appreciate the importance of inventory costs which govern the level of
cash flows. The inventory carrying costs will be further examined in the first section of the
theoretical framework, Cost for Carrying Inventory.
In order to support answers to the research questions it is important to understand a few
influential contextual factors with regards to finished goods inventories. An understanding of
the international trade environment that a global manufacturer of today operates in is required
to catch challenges in global distribution. Moreover, basic notions regarding payment terms
will have to be understood since these will have a direct effect on when products leave
finished goods inventories and become accounts receivables. Basic production strategies will
be described to define the context of finished goods. These contextual factors have a
meaningful impact on the level of finished goods that a company has. These aspects will be
brought up in the following three sections: International Trade and Inventory Turnover,
Customer Payment Methods and Inventory Turnover and Shifting Production Strategies and
Finished Goods Inventories.
To go deeper into the RQ1 and construct a framework for analyzing excess inventories as well
as uncover underlying causes (RQ2) and countering them (RQ3), it is necessary to understand
the reasons for holding finished goods inventories as well as what is causing unwanted levels
of inventory. This will be discussed in the sections Rationales for Holding Inventory and
Excess Inventories as an Outcome of Processes.
As stated in the problem analysis, an important business process affecting finished goods
inventories at the Case Company is the OTD process. This is the fact due to the realization of
the contextual factor of shifting production strategies. Since this main business process has
been identified to include important causes to excess inventories, such as engines not shipped

5
or invoiced on time, as was mentioned in the problem analysis, a special light will be shed on
this process. The sections Order to Delivery Process and Improving the Order to Delivery
Process to Lower Inventories, will further look into the OTD process and highlight causes to
excess inventories (RQ2) as well as improvement potential in the OTD process (RQ3). The
overview will support RQ1 and the categorization of finished goods inventories based on
commonality in processes. Finally, the theoretical framework will stress the importance of
common objectives in processes that span several activities at various functions of the
company. Lack of common objectives for the organization as a whole can prove to be a cause
of excess inventories (RQ2), while having it can increase performance and reduce excess
inventories (RQ3). This will be brought up in The Need for Common Goals in the Order to
Delivery Process.
Summary of the Theoretical Framework concludes important findings from the theory and
conducts a first attempt to construct the baseline of a framework that categorizes finished
goods inventories in line with RQ1.
After the theoretical framework has been presented the methodology of this thesis will be
presented. The chapter will put forward what type of data that was collected and how it was
analyzed and managed.
The methodology will be followed by the empirical findings, starting off with an introduction
of the Case Company and then focusing on issues in the OTD process as well as other areas
that impact the levels of finished goods inventories at the Case Company.
The research questions will then be answered in the analysis by the use of the empirical
findings and the theoretical framework. In the analysis a framework for categorizing finished
goods inventories and their relation to CCC will be further developed in line with RQ1.
Moreover, the causes of excess inventories will be described as answer to RQ2 and the
chapter will be concluded by investigation of countermeasures answering RQ3.
The analysis will be followed by a discussion contrasting the findings in the analysis with the
purpose of the thesis as well as giving suggestions for generalizations and highlight how it
may contribute to other companies or researchers. After the discussion, the findings will be
summarized in Conclusions, which will be followed by suggestions for further research in
Further Research.

6
2. THEORETICAL FRAMEWORK In order to answer the research questions and reach the purpose of the thesis it is necessary
to understand a firm’s activities and processes affecting inventory turnover of finished goods.
The theoretical framework therefore provides a foundation of concepts and theories that will
support the analysis. First there is an overview of basic concepts relating to inventory
turnover such as inventory carrying costs, fundamentals of international trade, customer
payment methods, production strategies as well as rationales for holding inventory.
Furthermore the chapter will look into the OTD process and highlight process improvements
that may reduce excess inventories and speed up inventory turnover.
2.1 COSTS FOR CARRYING INVENTORY
Inventory carrying costs are made up of several different cost components and, according to
Lambert & La Londe (1977), Ellram et al. (1998), Bardin et al. (2003), and Christopher
(2011), constitute a significant share of a firm’s total logistics costs. The inventory carrying
costs is commonly described as a percentage of the value of the inventory that the company
holds. Figure 1 illustrates a framework suggested by Ellram et al. (1998), describing the
components that make up total inventory carrying costs.
The capital cost relates to the amount of capital a firm has invested in inventory and how
much money it costs the firm (Ellram et al., 1998). Funds could be generated either internally,
or externally through bank loans and shareholders. The capital invested in inventory could be
used for other types of corporate investment. Consequently, the funds invested in inventory
forego the rate of return that could be obtained through such investments. The company’s
opportunity cost of capital should therefore be applied to the capital cost, in addition to
interest rates for generating funds (Lambert & La Londe, 1977). Inventory service costs are
the costs that arise regarding insurance of the inventory as well as certain taxes. Storage space
costs are simply the costs for different types of storage areas. The inventory risk costs include
various costs that may occur when goods are held in inventory such as costs for obsolescence,
damage, pilferage and relocation costs. (Ellram et al., 1998).
Figure 1. Inventory carrying costs (Ellram et al., 1998)

7
Callioni et al. (2005) highlight that the key to financial health is not revenue growth but rather
sound asset management. He concludes that by lowering inventory driven costs such as
presented above, the company can not only decrease total costs but also lower working capital
requirements by reducing DIO.
A survey carried out by the Inventory Management Report (2005) concludes that 54.3% of the
respondents use inventory carrying cost when making inventory management decisions. Of
those who have stated that they use an inventory carrying cost factor a third of them do not
know how it was determined, another third have calculated it from internal data, a quarter
states that is was passed on from the finance department, and the rest have used an external
source. The Inventory Management Report (2005) further concludes that the only factor that
was included by all respondents to determine the inventory carrying cost was the cost of
capital (100%), followed by obsolescence/scrap (57.6%), see Figure 2.
Figure 2. Factors included in the inventory carrying cost (The Inventory Management Report, 2005).
The Inventory Management Report (2005) states that the respondents including more factors
in their inventory carrying cost, as suspected, had higher inventory carrying cost ratios. The
inventory carrying cost ratios varied widely, but 10–14% being the most common interval.
According to several sources such as Lord (2005) and Christopher (2011), inventory carrying
costs should be around 25% of the average inventory investment but very few companies
know what their inventory carrying cost actually is.
2.2 INTERNATIONAL TRADE AND THE EFFECTS ON INVENTORY TURNOVER
International trade allows increased competition among firms offering similar products or
services, and hence a more competitive pricing on the market. For individual firms
international trade could also be a way of reaching new customers on new markets in foreign
countries. However, it does also come along with a new, higher, risk profile to the firms. The
main reason for this is that there are seldom common laws that can support the trade
transaction, as would be the case if it took place domestically (Grath, 2012). The role of banks
in financing international trade is more extensive than domestic commercial transactions due
0%10%20%30%40%50%60%70%80%90%100%
8
to additional complications involved. First the exporter (supplier) may question the importers
ability to make payment. Secondly, even if the importer (buyer) is creditworthy, the
government of the importer may impose controls that prevent payment to the exporter.
Thirdly, the importer might on the other hand not trust the exporter to ship the ordered goods.
Fourth, even if the exporter has shipped the goods, time lags in international transports and
various trade barriers may delay the delivery date (Madura, 2010). Furthermore, according to
Turnbull (2008) inventory turnover is often overlooked as companies establish themselves
overseas.
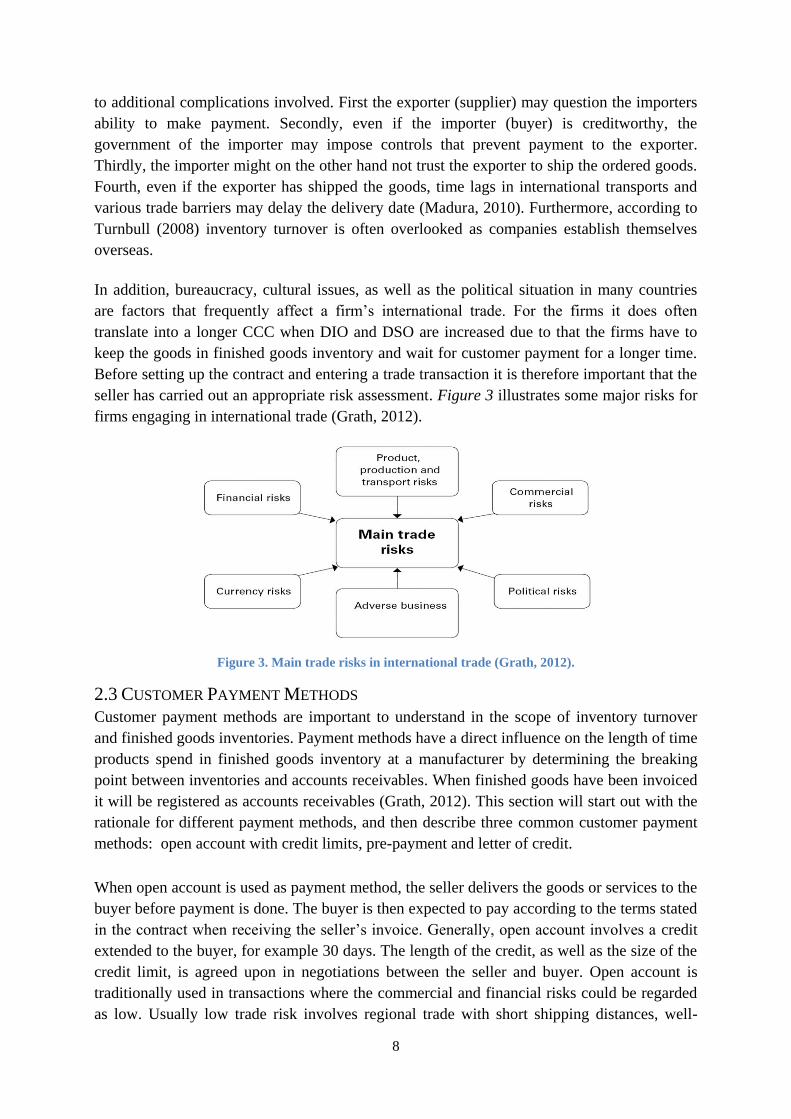
In addition, bureaucracy, cultural issues, as well as the political situation in many countries
are factors that frequently affect a firm’s international trade. For the firms it does often
translate into a longer CCC when DIO and DSO are increased due to that the firms have to
keep the goods in finished goods inventory and wait for customer payment for a longer time.
Before setting up the contract and entering a trade transaction it is therefore important that the
seller has carried out an appropriate risk assessment. Figure 3 illustrates some major risks for
firms engaging in international trade (Grath, 2012).
Figure 3. Main trade risks in international trade (Grath, 2012).
2.3 CUSTOMER PAYMENT METHODS
Customer payment methods are important to understand in the scope of inventory turnover
and finished goods inventories. Payment methods have a direct influence on the length of time
products spend in finished goods inventory at a manufacturer by determining the breaking
point between inventories and accounts receivables. When finished goods have been invoiced
it will be registered as accounts receivables (Grath, 2012). This section will start out with the
rationale for different payment methods, and then describe three common customer payment
methods: open account with credit limits, pre-payment and letter of credit.
When open account is used as payment method, the seller delivers the goods or services to the
buyer before payment is done. The buyer is then expected to pay according to the terms stated
in the contract when receiving the seller’s invoice. Generally, open account involves a credit
extended to the buyer, for example 30 days. The length of the credit, as well as the size of the
credit limit, is agreed upon in negotiations between the seller and buyer. Open account is
traditionally used in transactions where the commercial and financial risks could be regarded
as low. Usually low trade risk involves regional trade with short shipping distances, well-

9
known companies with close business relationships or companies that can be considered as
safe from a risk assessment point of view. However, even though the risk of payment default
may be considered as high among certain customers, open account may be used as payment
method anyway due to competition from other sellers. The seller may then use export credit
insurance to cover the risk. Furthermore, the possibility of speeding up payments often lies
within the structure of a firm’s internal processes. Consequently, it is important that firms
have strict but sensitive credit controls to ensure that payment terms are honored and that the
sales department has clear rules and guidelines to follow. (Grath, 2012).
Payment in advance, or pre-payment, is a desirable payment method from the seller’s
perspective. It is good for the cash flow and lowers the commercial and financial risks. It
simply means that the buyer pays for the goods or services before or in direct connection with
the actual shipment (Grath, 2012). This method grants the supplier with the greatest degree of
protection and is often used for first time buyers with unknown creditworthiness or whose
countries have financial difficulty (Madura, 2010). Consequently, pre-payment is preferable
to use when there is high commercial and financial risk connected with a trade transaction.
However, it might put the seller in an uncompetitive situation compared to its competitors if
they offer more favorable payment terms from the buyer’s perspective. (Grath, 2012).
The use of letter of credit (L/C) as payment method could be considered as trading with
documents. An L/C is issued by a bank on the behalf of the importer (buyer) and promises the
exporter (seller) that payment will be transmitted when the exporter presents shipping
documents complying with specified terms in the L/C. The exporter is assured that payment
will be carried out by the issuing bank as the issuing bank will have to fulfill payment
regardless of the buyer’s ability to pay. At the same time the buyer does not have to fulfill
payment unless the shipment has been made and all agreed documents have been presented.
The key document is known as the bill of lading (B/L). The B/L is a receipt for shipment and
holds a summary of freight charges. The carrier, transporter of the goods, sends the B/L to the
exporter. The exporter then presents the B/L to the bank that issues the L/C along with other
required documentation. The B/L conveys the ownership or title of the goods (Madura, 2010).
A major advantage for the seller when using L/C is that payment is guaranteed. For the buyer,
the use of L/C serve an assurance that documents will not be paid unless the terms of the L/C
are fulfilled. However, drawbacks include bank fees and the fact that it could be a time
consuming process. Table 1 summarizes the previously discussed payment methods (Grath,
2012).

10
Table 1. Summary of payment methods (Grath, 2012).
Method Usual time of
payment
Goods available
to buyers Risk to exporter Risk to importer
Prepayment Before shipment After payment None
Relies completely
on exporter to
ship goods as
ordered
Letter of credit When shipment is
made After payment
Very little or none
depending on
credit terms
Assured shipment
made, but relies
on exporter to
ship goods
described in
documents
Open account As agreed Before payment
Relies completely
on buyer to pay
account as agreed
None
2.4 SHIFTING PRODUCTION STRATEGIES AND FINISHED GOODS INVENTORIES
In order to understand the rationales for holding inventory it is necessary to get a basic
overview of the most common production strategies. Depending on what type of production
strategy a company uses, different types of inventories will occur in relation to size and
turnover. The two most common production strategies, ranging from a high to a low level of
customization, are make-to-order (MTO) and make-to-stock (MTS). The characteristics of the
different strategies are summarized in Table 2. (Jonsson & Mattsson, 2009).
MTO implies that the products are engineered before a customer order is received. However,
the products are not built until a customer order has been received and confirmed. A large part
of the manufacturing of parts and semi-finished goods are carried out independently of
specific customer orders, but certain fabrication is customized. (Jonsson & Mattsson, 2009).
MTS is a manufacturing strategy in which products are manufactured ahead of potential
incoming customer orders. Products are standardized and kept in stock until a customer order
is received and confirmed. The production plans are usually based on forecasts in
combination with historical demand, and delivery takes place directly from stock. (Jonsson &
Mattsson, 2009).

11
Table 2. Characteristics of MTO and MTS (Jonsson & Mattsson, 2009).
Characteristic Make to order Make to stock
Delivery time Average Very short
Manufactured volumes Small Large
Product variation High Low
Base for planning Forecast/customer order Forecast
Integration with customer Average No
Number of customer orders Few Average
Donovan (2013) states that a shift, away from the traditional MTS production environment,
has taken place. The customer of today expresses that he want the products to be configured
according to his needs and to be delivered within a very short lead time. This development has
contributed to the adoption of production strategies like MTO, and as a consequence top
management have been revising their strategies. While forecasting processes would have
affected finished goods stock levels in the MTS environment, Donovan (2013) put forward
that a reduced OTD cycle will have an important role to decrease requirements for working
capital as well as operating expenses as companies are shifting to MTO production strategies.
He states that today’s customers demand cycle time reductions, and that long OTD cycle
times stem from various processes, both internal and external, with regards to manufacturing.
(Donovan, 2013).
2.5 REASONS FOR HOLDING FINISHED GOODS INVENTORY
Carrying inventory could be expensive for firms as there are many costs associated with a
firm’s inventory. However, as inventory impacts the cost of sales, it also supports order
fulfillment. Depending on what type of production strategy a company uses, different types of
inventories will occur with regard to size and turnover (Bardi et al., 2003). There are several
reasons for why firms are carrying inventory in finished goods. First of all, it enables
companies to enjoy the benefits of economies of scale in transportation or manufacturing in
terms of larger volumes and shipments requiring storage for a significant period of time. It
applies to both production strategies introduced above. Secondly, inventory balances supply
and demand due to fluctuations on the market or seasonal variation. This one applies mainly
to MTS. Finally, finished goods inventory occurs in critical interfaces such as between
production-marketing, marketing-distribution, distribution-intermediary and intermediary-
consumer. However, it is important to notice that unless it regards MTS products, the finished
products should spend minimal amount of time in finished goods inventory and ultimately be
shipped to the customer in immediate connection with its completion. (Ellram et al., 1998).
12
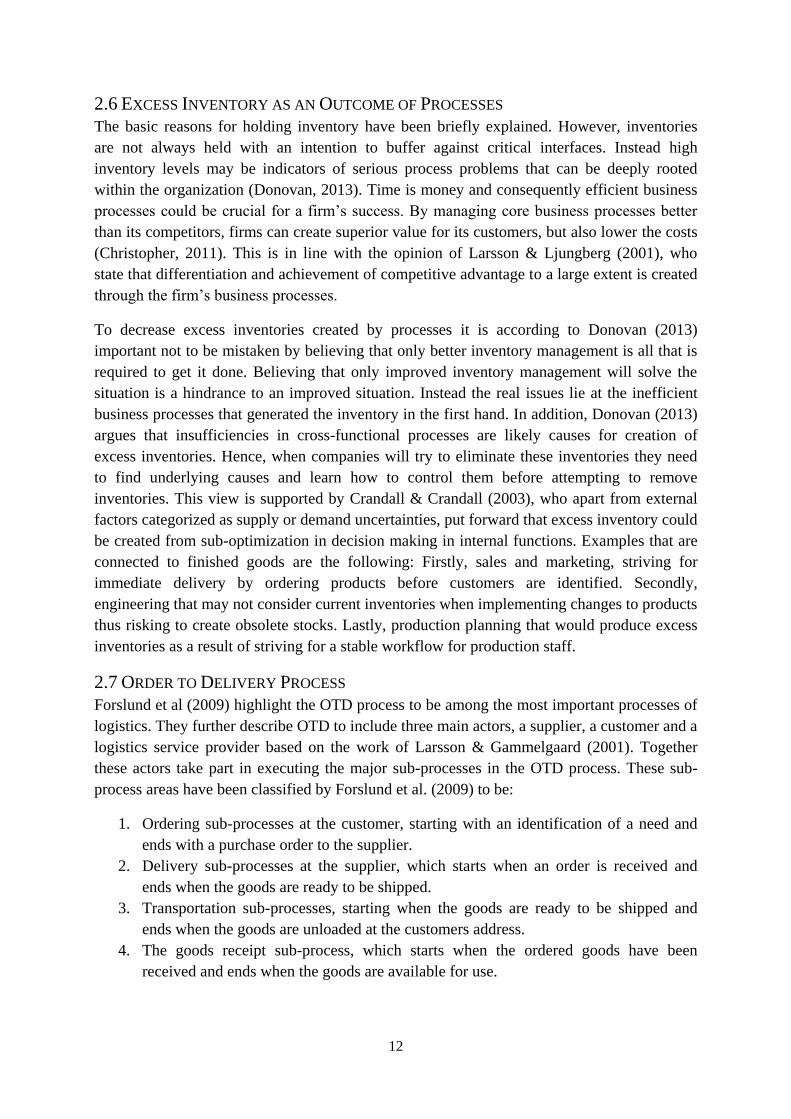
2.6 EXCESS INVENTORY AS AN OUTCOME OF PROCESSES
The basic reasons for holding inventory have been briefly explained. However, inventories
are not always held with an intention to buffer against critical interfaces. Instead high
inventory levels may be indicators of serious process problems that can be deeply rooted
within the organization (Donovan, 2013). Time is money and consequently efficient business
processes could be crucial for a firm’s success. By managing core business processes better
than its competitors, firms can create superior value for its customers, but also lower the costs
(Christopher, 2011). This is in line with the opinion of Larsson & Ljungberg (2001), who
state that differentiation and achievement of competitive advantage to a large extent is created
through the firm’s business processes.
To decrease excess inventories created by processes it is according to Donovan (2013)
important not to be mistaken by believing that only better inventory management is all that is
required to get it done. Believing that only improved inventory management will solve the
situation is a hindrance to an improved situation. Instead the real issues lie at the inefficient
business processes that generated the inventory in the first hand. In addition, Donovan (2013)
argues that insufficiencies in cross-functional processes are likely causes for creation of
excess inventories. Hence, when companies will try to eliminate these inventories they need
to find underlying causes and learn how to control them before attempting to remove
inventories. This view is supported by Crandall & Crandall (2003), who apart from external
factors categorized as supply or demand uncertainties, put forward that excess inventory could
be created from sub-optimization in decision making in internal functions. Examples that are
connected to finished goods are the following: Firstly, sales and marketing, striving for
immediate delivery by ordering products before customers are identified. Secondly,
engineering that may not consider current inventories when implementing changes to products
thus risking to create obsolete stocks. Lastly, production planning that would produce excess
inventories as a result of striving for a stable workflow for production staff.
2.7 ORDER TO DELIVERY PROCESS
Forslund et al (2009) highlight the OTD process to be among the most important processes of
logistics. They further describe OTD to include three main actors, a supplier, a customer and a
logistics service provider based on the work of Larsson & Gammelgaard (2001). Together
these actors take part in executing the major sub-processes in the OTD process. These sub-
process areas have been classified by Forslund et al. (2009) to be:
1. Ordering sub-processes at the customer, starting with an identification of a need and
ends with a purchase order to the supplier.
2. Delivery sub-processes at the supplier, which starts when an order is received and
ends when the goods are ready to be shipped.
3. Transportation sub-processes, starting when the goods are ready to be shipped and
ends when the goods are unloaded at the customers address.
4. The goods receipt sub-process, which starts when the ordered goods have been
received and ends when the goods are available for use.
13
In a study of the OTD process carried out by Forslund et al. (2009), it was found that
improper administrative systems such as ERP systems, or improper use of these systems, were
major obstacles for receiving a high OTD process performance. In addition they found that
dyadic communication, in other words communication with only two of the main parties
involved, were a cause for OTD inefficiencies. In their study of the OTD process they further
found mismatches between what was important to measure and what was measured. Lifting
up the issue that what was easy to measure got measured but not always what was significant.
Forslund et al. (2009) mainly bring up the information and material flows that are generated
in the OTD process. For this thesis the monetary flow will be equally important since the time
in finished goods with regards to DIO is governed by the invoicing of the customer. Therefore
monetary flows and invoicing will need to be kept in mind when reading through the
conclusive parts of this report. From a finished goods inventory perspective, the cycle time
reduction of the delivery sub-processes will be of most importance when analyzing excess
inventories in the OTD based on the definition suggested by Forslund et al. (2009).
Petrie (2008), states that employees rarely has a full understanding for the processes within
the organization as a whole. Instead, they are focused on the activities they carry out within
their function. Consequently, process improvement is often initiated within a certain function,
with the risk of sub-optimization for the organization as a whole. Larsson & Ljungberg
(2001), exemplify this by mentioning that employees within functions who do not have direct
contact with customers find it hard to see how their work affects customer satisfaction. It is
therefore important that companies continuously map its processes to facilitate understanding
of the entirety, but also how activities within a process are interrelated.
2.7.1 IMPROVING THE ORDER TO DELIVERY PROCESS TO LOWER INVENTORIES
A management concept that has been proven to counter waste and improve performance is
cycle time reduction. According to Horning (2003), cycle time reduction takes the focus
towards improving a company’s OTD cycle, spanning the areas of order entry, scheduling,
inventory management and shipping. The notion is to critically investigate these processes to
look for possible improvement opportunities. Horning (2003) states that in a common OTD
cycle the actual product is worked on just 5% of the time while the other 95% consists of
waiting between order entry and shipment. Donovan (2013) describes that the OTD system is
characterized by two flows; material flows and information flows, and that the OTD cycle
time is directly proportionate to the speed of these flows. Andersen (1999) suggests that the
cycle time of main a business process can be shortened by combining the following four
factors:
1. Parallel activities rather than serial, a totally serial business process will result in a
cycle time equal to the sum of all the activities, while increasing the use of parallel
activities can decrease the cycle time significantly compared to a totally serial process.
2. Changes in the sequence of activities, improvements could be made by reconfiguring
the order in which activities are performed, often documents are sent back and forth
between departments with unnecessary waiting in between.

14
3. Reduced interruptions, any issue that causes long delays in a critical business
process is labeled an interruption; such an issue could be an order stop. It could also be
a phone call to a key staff member supposing to perform an important activity.
4. Improved timing of activities, many business processes are performed with a
relatively large time span between its activities.
Horning (2003) put emphasis on reducing finished goods inventories. He mentions that for
many manufacturers finished goods inventory can be a buffer against inefficient planning,
poor product quality, and lack of ability to deliver on time. Baptiste et al (2008), states that to
reach an ideal outbound logistics system with less inventories and shorter lead times, the
production planning and the transport planning must be perfectly integrated. However, the
integration of production planning and transport planning is a complex problem. The reasons
for this are the many resources that require coordination as well as the number planners and
decision makers that are involved (Persson & Davidsson, 2005). Furthermore, Persson &
Davidsson (2005) state that the issue consists of a combination of problems in the areas of
production scheduling, fleet management and inventory management.
2.7.2 THE NEED FOR COMMON GOALS IN THE ORDER TO DELIVERY PROCESS
Larsson & Ljungberg (2001) highlight the importance of a holistic approach and transparency
when it comes to processes. A main process, such as the OTD process, spans many different
functions within the organization. These functions carry out activities that are necessary for
the process as a whole to fulfill a customer need, internal as well as external. Nonetheless, a
common issue in many organizations is the conflicting interest between the logistics function
and the marketing function. Logistics’ main focus is generally cost-driven while marketing’s
focus generally is more customer-driven. Logistics wishes to minimize inventory carrying
costs, lot quantity costs, transportation costs, warehousing costs and order processing and
information costs. Marketing is instead more concerned with allocating resources to the
marketing mix in order to increase sales volumes (Bardi et al., 2003).
In order to align the objectives of logistics and marketing, Jüttner et al. (2005) argues that
logistics needs to be involved in marketing planning at an early stage as well as taking an
active role in potential customer priority decisions. In addition, the logistics function should
have the right to reject marketing decisions that are not financially sound. Consequently, the
marketing function also needs to be more cost driven and reject sales that are not profitable
for the firm as a whole (Jüttner et al., 2005).
Figure 4 is a framework suggested by Jüttner et al. (2005), illustrating the conflicting
objectives and KPI’s of logistics and marketing. It implies that lack of information is a major
source behind the barriers between logistics and marketing. Marketing must communicate
customer and product opportunities, promotions, customer segments and provide honest
feedback on problems in deliveries. Conversely, the supply chain managers must continuously
communicate lead-time, capacity and costs for inventory carrying, warehousing and
transportation (Jüttner et al., 2005).

15
Figure 4. Working relationship between supply chain management and marketing (Jüttner et al., 2005).
An increased level of transparency between the two functions is likely to bring about a more
open attitude and mutual trust so that, for example, marketing does not exaggerate its
forecasts in order to make sure they will have enough products to sell, leading to high
inventory levels. On the contrary, without accurate information logistics may produce less
than what is actually required in order to lower the costs and avoid high inventory levels
(Ellram et al., 1998).
However, improved transparency is not enough. Conflicting KPI’s between logistics and
marketing are also barriers for better cooperation between the functions. The traditional view
that the marketing function is mainly revenue focused while the logistics function is mainly
cost focused needs to be overlooked and KPI’s should be aligned throughout the organization,
making it possible for all business functions to have common objectives and work towards the
same goals on a corporate level (Jüttner et al., 2005). Petrie (2008) suggests that one way of
aligning key objectives and creating transparency could be to put in place a cross-functional
steering committee. The holistic aspect derives from the interaction of the members from
different functions, their updates of what is going on within their field and how it affects other
activities and main process objectives.
2.8 SUMMARY OF THE THEORETICAL FRAMEWORK
By speeding up inventory turnover and releasing tied-up capital, the working capital
efficiency can be improved. In order to understand the purpose of the thesis, the theoretical
framework therefore provides basic concepts such as the costs for carrying inventory, the
fundamentals of different production strategies, risks with international trade and different
payment methods as well as the rationales for why firms hold inventory in finished goods.
Several authors and researchers consider that bad business processes could be a main root
cause behind excess capital tied up in finished goods. In order to being able to answer the
research questions, a process approach is therefore taken. An important main business process
is the OTD process. It is a process that spans several functions in a company. The OTD

16
process could further be divided into sub-processes. Regarding the purpose of this thesis,
there are mainly two sub-process that are interesting to go deeper into:
Delivery sub processes at the supplier, which starts when an order is received and ends
when the goods are ready to be shipped.
Transportation sub processes, starting when the goods are ready to be shipped and
ends when the goods are unloaded at the customers address.
Furthermore, by improving the OTD process it is possible to lower inventory levels. A
management concept that has been proven to counter waste and improve performance is cycle
time reduction. The theoretical framework presents four factors that may be combined in
order to achieve a reduced cycle time: parallel activities rather than sequential, changed
sequence of activities, reduced interruptions and improved timing of activities. In addition,
common objectives of the functions involved in a process are important in order to avoid sub-
optimization.
In order to utilize the benefits of a process approach it is necessary to understand which
activities in the business processes that cause excess inventories. Figure 5 constitutes a
starting point of a framework that are used when carrying out this analysis. The intention of
this thesis is to find reasons for excess inventories causing slower DIO in order to come up
with suggestions for counter actions. The CCC constitutes the upper part of the framework
and is broken down into its three components DIO, DPO and DSO. Inventory is commonly
categorized in raw material, work in progress and finished goods. This thesis is limited to
investigate excess inventories in finished goods and its impact on inventory turnover in
finished goods.
Figure 5. Framework for identifying categories of excess inventories in finished goods based on
commonality in processes.
Furthermore, with the concepts of the OTD and the different production strategies discussed
in the theoretical framework, inventory in finished goods could be divided into two additional
categories. The notion is to distinguish the excess inventories into categories that have
common processes as causes for the excess inventory. Finished goods that are in the OTD
CCC
DPO DIO
RM WIP FG
Committed (Within OTD)
Uncommitted (Outside
OTD)
DSO

17
process are committed to an order, while finished goods that are not in the OTD process are
uncommitted to an order. The committed and uncommitted categories will further be
developed specifically for the Case Company by the use of collected empirical data, with the
goal of creating a deeper understanding of the causes behind excess inventories in finished
goods.

18
3. METHODOLOGY This section aims at providing the reader with understanding of how the study was designed,
the underlying factors behind the choice of research method, how data was collected and
analyzed, critics of the chosen method as well as a discussion regarding reliability and
validity.
3.1 CHOICE OF RESEARCH METHOD
The thesis was conducted at the Global Logistics department at the Case Company’s
headquarters in Gothenburg, Sweden. The Case Company was subject for a case study in
order to answer the research questions. Yin (2009) distinguishes between different types of
research methods. The most important condition for using an appropriate research method is
to classify the type of research question(s) being asked. Common research methods include
experiments, surveys, archival analysis, history, and case studies. Typically, case studies are
appropriate when “how” and “why” questions are being asked about a contemporary set of
events over which the investigator has no or little control. This could include studies of
processes and change (Yin, 2009). Consequently, a case study is a suitable research method
for this thesis as it will allow more extensive investigation of the current processes at the case
company. In addition, it will be possible to investigate how they can be changed in order to
attain increased working capital efficiency.
It could be challenging to define what a case study really is and different authors provide
different definitions. Gillham (2010) defines a case study as “a unit of human activity
embedded in the real world; which can only be studied or understood in context; which exist
here and now; that merges in with its context so that precise boundaries are difficult to draw”
(Gillham, 2010, p. 1). Yin (2009) takes a bit different approach and presents a twofold
definition. The first part of the definition defines the scope of a case study: “a case study is an
empirical inquiry that investigates a contemporary phenomenon in depth and within its real-
life context, especially when the boundaries between phenomenon and context are not clearly
evident” (Yin, 2009, p. 18). The second part of the definition focuses on the technical
characteristics of a case study: “the case study enquiry copes with the technically distinctive
situation in which there will be many more variables of interest than data points and as one
result relies on multiple sources of evidence, with data needing to converge in a triangulating
fashion, and as another result benefits from the prior development of theoretical proposition to
guide data collection and analysis” (Yin, 2009, p. 18).
Many authors, including Stake (1995) and Yin (2009) distinguish between different kinds of
case studies. For example, Stake (1995) distinguishes between three different types of case
studies. Intrinsic case studies should be undertaken in order to gain insight into the features of
a particular situation rather than other cases or generic issues. Instrumental case studies take a
wider approach towards the surroundings as the case is used as a means of achieving
understanding of a broader issue or allowing generalizations to be challenged. A final type of
case study according to Stake (1995) is to explore a general phenomenon through the analysis
of multiple and collective cases undertaken jointly. However, even though several different
19
types of case studies exist, Stake (2005) suggests that the boundaries often are blurred. This is
also true in this report where the intrinsic case study approach is used along with an
instrumental case study. It is necessary to achieve understanding of the specific issues of the
case company, but also the more generic issues associated with the case (Stake, 2005).
Although the case study as a research method comes along with many benefits, it raises some
concerns as well. Common disadvantages that are discussed by many authors, for example
Wallén (2008) and Yin (2009), include the fact that case studies are time consuming and
provide little basis for scientific generalization. Case studies also risk taking too long time and
result in large amounts of unreadable data and documents. This was something the authors of
this thesis experienced. A massive amount of data was gathered and structuring this data was
time consuming and challenging. Consequently it is important to have clear delimitations and
a reasonable time plan.
Furthermore, the fact that company environments are complex and that many processes are
unique makes generalization hard even though multiple cases were to be carried out on
several different companies. However, although firms are complex, the general findings and
conclusions from this study should be possible to apply on other manufacturing firms with the
ambition to decrease excess finished goods inventories in order to speed up cash flows.
3.2 DATA COLLECTION
This master thesis takes the shape of a mixture of both quantitative and qualitative research
strategy and uses both primary and secondary data. In short, the quantitative research strategy
emphasizes measurement and quantification in the collection and analysis of data. By
contrast, the qualitative research strategy emphasizes “softness” and the use of words rather
than quantification in the collection and analysis of data (Bell & Bryman, 2011). Case studies
may include substantial amounts of collected quantitative data, which is to be analyzed along
with qualitative data. The quantitative data may cover the behavior or event that a case study
is trying to explain. It could also be related to an embedded unit of analysis within the broader
case study. However, the main case study question may be at a higher level and in order to
explore and explain events at this higher level it could be critical to collect and use qualitative
data as well. Using both qualitative and quantitative data in a case study is a strong analytical
strategy that could yield significant benefits (Yin, 2009). Various measurements regarding
finished goods inventories and other financial metrics will constitute the quantitative data. At
the same time it is necessary to also collect qualitative data in order to facilitate analysis and
interpretation of the quantitative data in line with the purpose of the thesis.
3.2.1 QUALITATIVE DATA COLLECTION
The qualitative collection of empirical data is essentially made up of unstructured interviews
that have been carried out throughout the study. However, even though interviews were
carried out throughout the study, the main focus on qualitative data collection took place in
the early and later phases of the work process. In the beginning of the study the researchers
needed to achieve a basic understanding of the Case Company as a firm, its organization and
basic processes and concepts. Furthermore, the early interviews allowed the researchers to
20
identify what type of quantitative data it would be necessary to collect from the Case
Company’s ERP system in the next phase of the study. The early interviewees consisted of
employees at Global Logistics as well as the Finance Department. Altogether, approximately
15 unstructured interviews were carried out during this early phase.
Quantitative data collection was carried out between the early and late phase of the qualitative
data collection and allowed the researchers to carry out various analyses of where in the
processes capital is tied-up in finished goods. However, even though the quantitative data
collection along with analyses gave the researchers an understanding of where problems occur
and where the potential for improvements is greatest regarding tied-up capital, it was
necessary to get qualitative input on why the collected quantitative data looked like it did and
how current processes can be improved. Another 20 interviews were therefore carried out in
the second phase of the qualitative data collection and consisted of employees on various
positions at the Finance, Global Logistics and Sales departments. During these interviews we
also shared the findings from the quantitative data collection with the interviewees in order to
open up discussions.
Criticisms of qualitative research include the issue of subjectivity, the difficulty to replicate
the study, problems of generalization and lack of transparency. Critics mean that qualitative
findings risk relying too much on the researcher’s own views about what is significant and
important as well as personal relationships with the people involved in the study (Bell &
Bryman, 2011 and Gillham, 2010). Qualitative research could also be difficult to replicate for
a number of reasons. For example, the responses of people being observed in a study are
likely to be affected by the characteristics of the researcher in terms of personality and the
interpretation of the observed people. Problems of generalization relates to the fact that the
scope of the finding in qualitative research often is restricted to a relatively small number of
participants due to limitations in time and resources. Finally, compared to quantitative
research, it is sometimes difficult to establish what the researcher behind a qualitative study
actually did and how he or she reached the study’s conclusions (Bell & Bryman, 2011).
3.2.2 QUANTITATIVE DATA COLLECTION
Focus of the quantitative data collection was set on engines committed to orders, in other
words finished goods in the OTD process. For engines uncommitted to order data was
collected from Global Logistics by the researchers. However, the data collection was more
straightforward as uncommitted engines were already compiled in lists by Global Logistics.
The drawbacks were that these lists did not provide the researchers with sufficient parameters
to conduct the same extensive analysis as for engines committed to order.
The quantitative data used to analyze the engines committed to order in finished goods have
been collected by taking continuous measurements of inventory levels in this category
throughout the project but the main source has been historical data. Historical data has been
more challenging to collect since the data required is stored in a database and sorted in
different tables and fields. Data extraction demanded aid from experienced business analysts
to be able to collect the requested data. Moreover, the initial step before requesting the data

21
was to determine what data to extract from the database. Figure 6 provides an overview of the
data collection process that the researchers used in order to build a dataset which had
sufficiently detailed information required to make a reliable analysis.
The first step in the data collection process was to investigate the different attributes of an
order and determine whether these attributes would benefit the analysis or not. This
investigation was conducted in dialogue with the supply chain planners and the logistics
market coordinators at Global Logistics. Secondly, a long list of parameters where selected,
including price and cost data, mode of transport, incoterms, production site of engine, market
region of customer, customer address and many more. This long list was then presented to a
business analyst regarding the feasibility of extracting this data from the ERP database. The
business analyst suggested some changes to the initial list of parameters and together with the
researchers made a final decision on which parameters to extract. The data was then extracted
by the business analyst and due to the great sample size selected, the extraction itself required
two days of work.
Preliminar decision on
requested parameters
Discussion with
Business Analyst
on feasability
Table 1 Table 2 Table N
Orderbook
Master
Data
Investigation of
order attributes
required for
analysis
Final decision on
requested parameters
ERP order data
Manual filtering and
creation of calculated
columns
ERP
supplementary
order data
Manual filtering and
creation of calculated
columns
Assumptions Assumptions
Figure 6. Overview of the quantitative data collection process.
The extracted data were found in several different tables in the ERP order database. The
business analyst selected the required column from each of these tables and merged them into
a set of Order Book Master Data sheets, depending on the order type, for example one file for
Sales Orders, one file for Stock Transfer orders etcetera.
The researchers had to adjust these data sheets by lookup functions to reorganize the Order
Book Master Data. These adjustments could have been avoided by better specification on the
22
queries put to the database during the earlier extraction. The researchers were faced with
having to perform some operations that could have been easier to execute using database
queries more or less manually in Excel. Caution was taken as manual operations in Excel are
a known source of errors in datasets.
Moreover, the data specified in the list of required parameters did not cover everything that
the researchers required. Several additionally required parameters were found as the
researchers started their analysis on the datasets. As a solution the project team extracted these
individual parameters directly from the ERP system. The data collected in this fashion had to
be manually sorted, filtered and transferred to the Order Book Master Data set, which was the
basis for the analysis. The supplementary order data was managed based on assumptions that
were made in dialogue with the logistics market coordinators at Global Logistics.
The Order Book Master Data was then also filtered, sorted and new columns expressing
different relationships in datasets were created, for instance a column expressing the time
difference between invoicing and shipping of an order. The filtering, sorting and creation of
new columns with data in the Order Book Master Data set were based on assumptions made
in dialogue with logistics market coordinators, supply chain planners, the manager of the
supply chain planning group and representatives from the Finance Department.
Bell & Bryman (2011) and Gillham (2010) highlight that the quantitative research method fail
to distinguish humans and social institutions from the natural order, in other words people
have feelings and thoughts that quantitative research cannot capture. However, in this thesis
the quantitative data collection has been complemented with qualitative input as well.
3.2.3 PRIMARY AND SECONDARY DATA COLLECTION
Data that is collected for research purposes could be either primary or secondary. Primary
data is collected by the researcher directly, while secondary data is has been collected by
others (Bell & Bryman, 2011). The primary data in this thesis is mainly coming from
interviews and E-mail conversations with employees at various departments at the Case
Company. However, raw data extracted from the Case Company’s ERP system could be
considered as primary data as well. The secondary data that has been collected for this thesis
is coming from flow charts, process descriptions and other internal Case Company material.
The secondary data also includes reference literature, scientific articles and electronic articles
available on the Internet.
Regarding primary data, the researcher has the advantage of controlling the collection process
and can secure that the data is actually coming from the right source, is state of the art and is
relevant for the study. The main drawback with primary data is that it is time consuming to
collect. Vice versa can be said to be true when using secondary data. It is less time
consuming, but on the other hand the researcher loses control over the main source of the data
and its reliability (Bell & Bryman, 2011).
23
3.3 DATA ANALYSIS
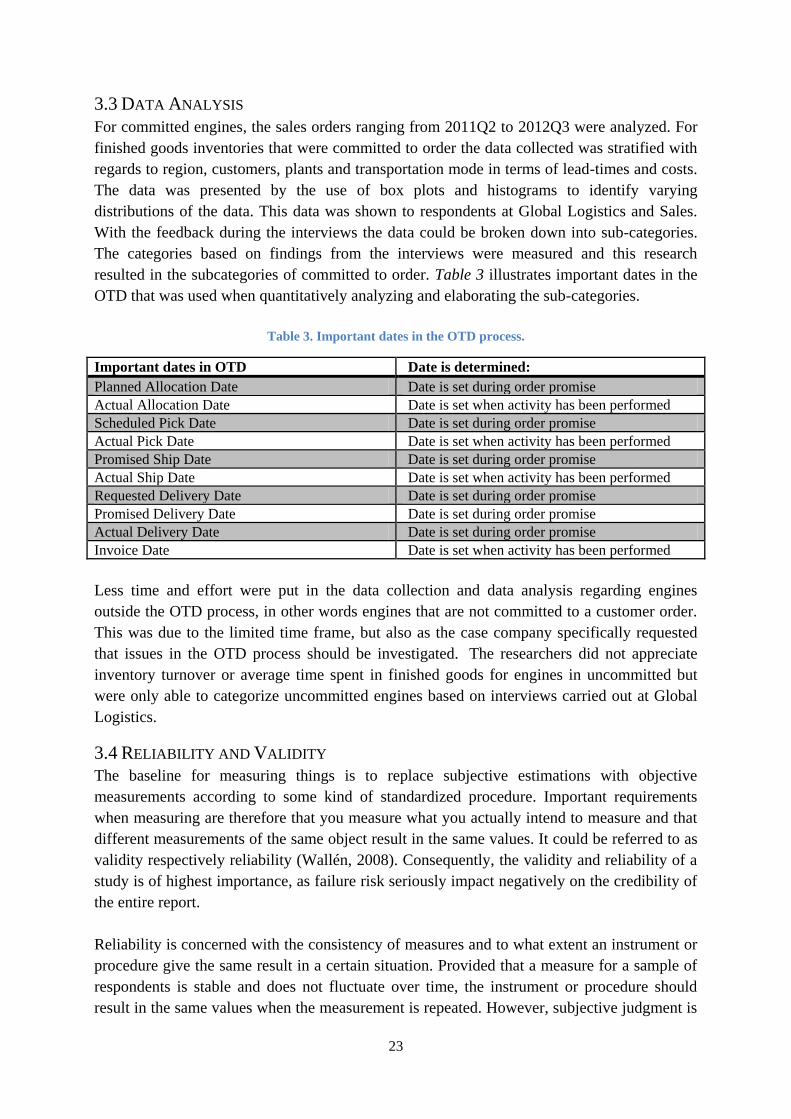
For committed engines, the sales orders ranging from 2011Q2 to 2012Q3 were analyzed. For
finished goods inventories that were committed to order the data collected was stratified with
regards to region, customers, plants and transportation mode in terms of lead-times and costs.
The data was presented by the use of box plots and histograms to identify varying
distributions of the data. This data was shown to respondents at Global Logistics and Sales.
With the feedback during the interviews the data could be broken down into sub-categories.
The categories based on findings from the interviews were measured and this research
resulted in the subcategories of committed to order. Table 3 illustrates important dates in the
OTD that was used when quantitatively analyzing and elaborating the sub-categories.
Table 3. Important dates in the OTD process.
Important dates in OTD Date is determined:
Planned Allocation Date Date is set during order promise
Actual Allocation Date Date is set when activity has been performed
Scheduled Pick Date Date is set during order promise
Actual Pick Date Date is set when activity has been performed
Promised Ship Date Date is set during order promise
Actual Ship Date Date is set when activity has been performed
Requested Delivery Date Date is set during order promise
Promised Delivery Date Date is set during order promise
Actual Delivery Date Date is set during order promise
Invoice Date Date is set when activity has been performed
Less time and effort were put in the data collection and data analysis regarding engines
outside the OTD process, in other words engines that are not committed to a customer order.
This was due to the limited time frame, but also as the case company specifically requested
that issues in the OTD process should be investigated. The researchers did not appreciate
inventory turnover or average time spent in finished goods for engines in uncommitted but
were only able to categorize uncommitted engines based on interviews carried out at Global
Logistics.
3.4 RELIABILITY AND VALIDITY
The baseline for measuring things is to replace subjective estimations with objective
measurements according to some kind of standardized procedure. Important requirements
when measuring are therefore that you measure what you actually intend to measure and that
different measurements of the same object result in the same values. It could be referred to as
validity respectively reliability (Wallén, 2008). Consequently, the validity and reliability of a
study is of highest importance, as failure risk seriously impact negatively on the credibility of
the entire report.
Reliability is concerned with the consistency of measures and to what extent an instrument or
procedure give the same result in a certain situation. Provided that a measure for a sample of
respondents is stable and does not fluctuate over time, the instrument or procedure should
result in the same values when the measurement is repeated. However, subjective judgment is

24
involved in the process of recording observations and translating data into categories.
Especially when more than one person is involved in such a process, there is a risk that there
is a lack of consistency in the decisions. Reliability could therefore be defined as absence of
random errors (Bell & Bryman, 2011).
When validity of a study is questioned, it is questioned whether or not a measure of a concept
really measures that concept. In other words, is the measure valid or not? There are several
different ways of judging the validity of a measure of a concept, and consequently there are
also several different types of validity (Bell & Bryman, 2011). However, Wallén (2008)
defines validity as measuring only what is intended to measuring and that what an instrument
is supposed to measure corresponds with what it actually measures without systematical
errors. It is therefore important to have clear definitions of the concepts used and
understanding underlying factors by carefully preparing the study (Wallén, 2008).
In order to ensure the reliability and validity of the results in this thesis the researchers went
through each interview afterwards in order to ensure that everything was interpreted in a
similar way by both researchers. In case of any doubts, the interviewee was contacted by E-
mail for a confirmation or correction. In addition, some interviewees were interviewed twice
to ensure the findings from the first interview. Furthermore, the fact that the researchers
interviewed several actors at similar positions within the same department, allowed the
researchers to confirm what had been stated in the other interviews.
The quantitative analysis of the uncommitted engines was based on figures that were collected
internally. In order to estimate the significance of cancelled engines in finished goods
inventories, the researchers compared a database of order cancellations with engines currently
in uncommitted stock. Thus the researchers utilized two sources of data to conduct such
analysis. Consequently the risk of corrupt data increases as the number of sources with risk of
having corrupt data increases. This is the case since the sources were not used for
triangulation but only to create new data sets. Thus there is a risk for systematic errors
regarding the validity. Regarding the reliability the procedure was straightforward and with
only a few easily defined steps leaving little room for random errors regarding this procedure.
However, for quantitative analysis on committed engines the data analysis was not
straightforward. To an external researcher the interpretation of the data and managing the data
could have a great effect on the result of the analysis. Since this was concluded at an early
stage the researchers had to continuously collect qualitative input on how to interpret and
manage the data. This qualitative input was collected from staff operating in the different
parts of the OTD that was measured. Also qualitative input was gathered through dialogue
with experienced business controllers and logistics developers. The researchers were
operating from the Global Logistics office during the entire data collection and data analysis
phase, which simplified and shortened waiting times for key input. The data collected holds
greater potential to evaluate other processes in the OTD but outside of the scope of finished
goods. A decision was also made to reduce the sample size to orders in 2011Q2-2012Q3 since
the data quality on some key dates was found to be insufficient. The scope was only set on
25
sales orders, which is considered the base flow and is by far the largest flow of orders to
customers. The sample size only included products that are governed by Global Logistics,
which is also where the main flow is. In total figures 47,346 order lines were included in the
analysis.
The most critical assumption made in the data analysis was converting order lines with
different currencies into SEK. The researchers used the exchange rates on the last date of each
month. A better assumption would be to use weekly or even daily exchange rates. However,
due to the amount of currencies and the manual handling required, the researchers settled with
the pragmatic assumption.
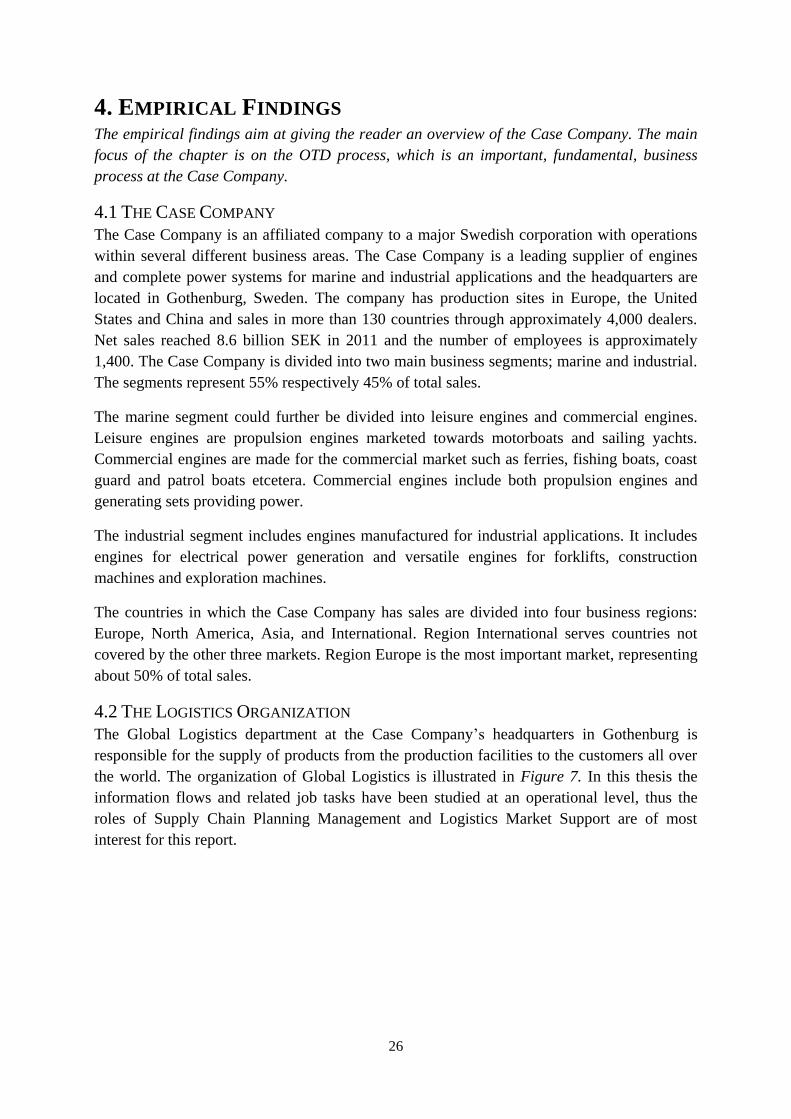
26
4. EMPIRICAL FINDINGS The empirical findings aim at giving the reader an overview of the Case Company. The main
focus of the chapter is on the OTD process, which is an important, fundamental, business
process at the Case Company.
4.1 THE CASE COMPANY
The Case Company is an affiliated company to a major Swedish corporation with operations
within several different business areas. The Case Company is a leading supplier of engines
and complete power systems for marine and industrial applications and the headquarters are
located in Gothenburg, Sweden. The company has production sites in Europe, the United
States and China and sales in more than 130 countries through approximately 4,000 dealers.
Net sales reached 8.6 billion SEK in 2011 and the number of employees is approximately
1,400. The Case Company is divided into two main business segments; marine and industrial.
The segments represent 55% respectively 45% of total sales.
The marine segment could further be divided into leisure engines and commercial engines.
Leisure engines are propulsion engines marketed towards motorboats and sailing yachts.
Commercial engines are made for the commercial market such as ferries, fishing boats, coast
guard and patrol boats etcetera. Commercial engines include both propulsion engines and
generating sets providing power.
The industrial segment includes engines manufactured for industrial applications. It includes
engines for electrical power generation and versatile engines for forklifts, construction
machines and exploration machines.
The countries in which the Case Company has sales are divided into four business regions:
Europe, North America, Asia, and International. Region International serves countries not
covered by the other three markets. Region Europe is the most important market, representing
about 50% of total sales.
4.2 THE LOGISTICS ORGANIZATION
The Global Logistics department at the Case Company’s headquarters in Gothenburg is
responsible for the supply of products from the production facilities to the customers all over
the world. The organization of Global Logistics is illustrated in Figure 7. In this thesis the
information flows and related job tasks have been studied at an operational level, thus the
roles of Supply Chain Planning Management and Logistics Market Support are of most
interest for this report.

27
Figure 7. Global Logistics organization chart.
Supply Chain Planning Management consists of a manager and eight supply chain planners.
The supply chain planners are responsible for the Sales and Operations Planning Process
(S&OP) for their respective products. The S&OP process aims to balance demand forecast
with material supply and capacity plans on a rolling 12 month’s basis. In addition to finalizing
the S&OP for their products the supply chain planners book orders into production with the
aid of the order promise function in the ERP. This is done when the ERP has failed to promise
orders to match the promised delivery date with the customer’s requested date.
Logistics Market Support consists of a manager and nine logistics market coordinators. The
logistics market coordinators are responsible for providing front offices with information
regarding the status of their related customer orders, booking of transport and back office
problem solving. The logistics market coordinators can be considered to serve as a bridge
regarding the information flow between front office at Sales and the supply chain planners at
Global Logistics.
4.3 THE SALES ORGANIZATION
As stated earlier, the sales organization at the Case Company is divided into four business
regions. These are Region Europe, Region North America, Region Asia and Region
International. However, a new organization of the business regions came into force on
January 1st 2013. The purpose with the re-organization is to integrate the sales structure and
make it more similar to how the business regions are organized at a corporate group level. The
new organization will consist of only three regions: Region Europe, Region Americas and
Region Emerging Markets and Asia Pacific. However, this report is only concerning the old
organization.
Region International is, geographically, the largest region with sales spread over large parts of
the globe. The region has its office at the Case Company’s headquarters in Gothenburg.

28
Region International is divided into sales areas. An area sales manager is responsible for sales
and marketing in the countries included in each area. The sales in each country usually take
place through an authorized importer, with which the area sales manager has contact.
However, in some cases the final customer may have direct contact with the area sales
manager depending on the nature of the business. The area sales manager is responsible for
negotiating the terms of sales with the customer. The Front Office (FO) then takes over much
of the contact with the customer and handles the necessary information flow with the
Logistics Market Support at Global Logistics regarding shipping dates and transport booking
etcetera. A credit controller is responsible for the credit processes and supports the area sales
manager when payment terms are negotiated. It is also the credit controller’s responsibility to
supervise whether payment from customers has been received or not. The credit controllers
are mainly measured on DSO, in other words accounts receivable. The primarily focus for the
credit controllers is therefore to secure customer payments.
The other three regions, Region Europe, Region North America and Region Asia are
organized a bit differently. These regions are not centralized to the headquarters in
Gothenburg, but organized through local market units closer to the customers. Sales staff at
each market unit is responsible for sales and marketing in the country or countries that belong
to the market unit.
4.4 THE GLOBAL DISTRIBUTION ORGANIZATION
The Case Company has wholly owned distribution centers on all continents. The purpose with
the distribution centers is to come closer to the customers on important markets by shortening
the lead times. There are also distribution centers in connection to the production plants.
Some of the distribution centers are managed locally in terms of inventory control. From
Global Logistics point of view they are considered to be internal customers as when they need
to refill stock, their request is handled as a customer order. When the goods have been
delivered to the local distribution center, it is no longer visible in the Case Company’s ERP
system. The length of time the engines are kept in stock at the local distribution centers is
therefore less visible for Global Logistics. However, the inventory carrying cost for the
engines in the local distribution centers still need to be carried by the Case Company. Figure
8 illustrates the Case Company’s global operations.
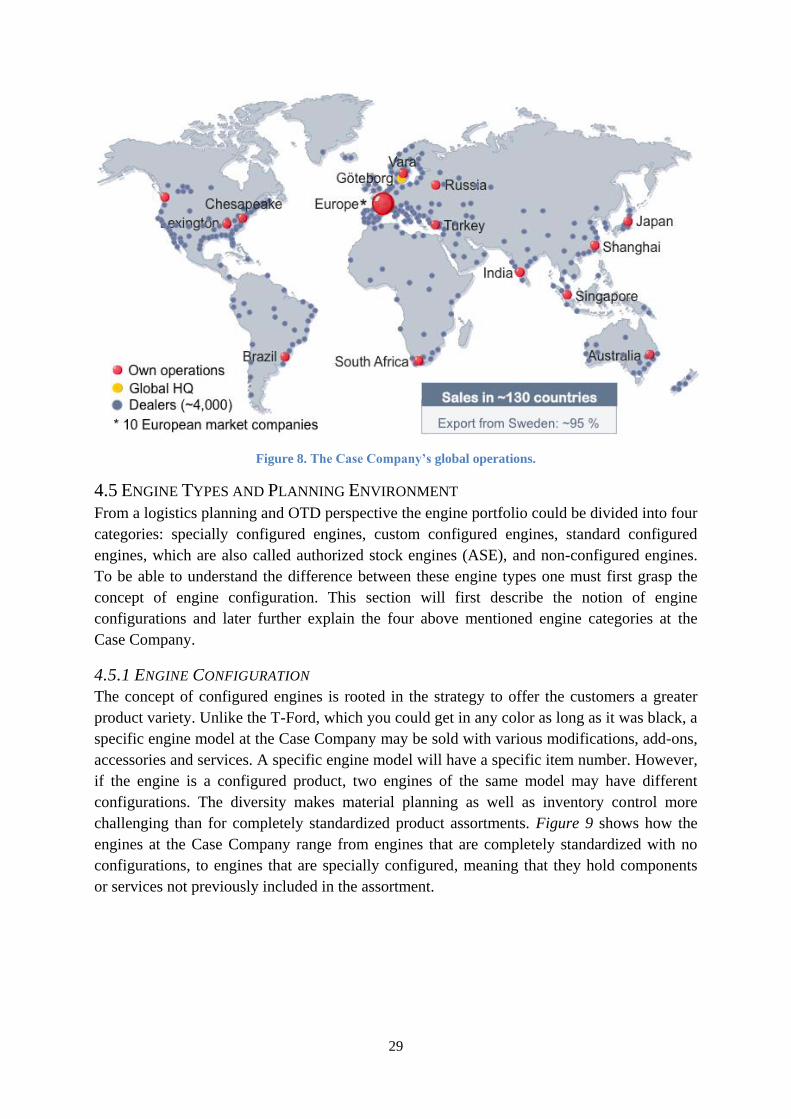
29
Figure 8. The Case Company’s global operations.
4.5 ENGINE TYPES AND PLANNING ENVIRONMENT
From a logistics planning and OTD perspective the engine portfolio could be divided into four
categories: specially configured engines, custom configured engines, standard configured
engines, which are also called authorized stock engines (ASE), and non-configured engines.
To be able to understand the difference between these engine types one must first grasp the
concept of engine configuration. This section will first describe the notion of engine
configurations and later further explain the four above mentioned engine categories at the
Case Company.
4.5.1 ENGINE CONFIGURATION
The concept of configured engines is rooted in the strategy to offer the customers a greater
product variety. Unlike the T-Ford, which you could get in any color as long as it was black, a
specific engine model at the Case Company may be sold with various modifications, add-ons,
accessories and services. A specific engine model will have a specific item number. However,
if the engine is a configured product, two engines of the same model may have different
configurations. The diversity makes material planning as well as inventory control more
challenging than for completely standardized product assortments. Figure 9 shows how the
engines at the Case Company range from engines that are completely standardized with no
configurations, to engines that are specially configured, meaning that they hold components
or services not previously included in the assortment.

30
Specially
configured engine
Custom
configured engine
Authorized Stock
Engine (ASE)
Non-configured
engines
Degree of standardisation
Degree of customization
Figure 9. Degree of customization and standardization with engine categories at the Case Company.
Specially Configured Engines
The category of specially configured engines includes engines which utilizes materials,
components, treatments, or documents that are not offered in the original configuration
options. In other words these items will have to be specially purchased or manufactured to
satisfy the customer’s requirements. Often this may require the creation of new bill of
material and estimation of costs and prices. Customers that request specially configured
engines have to complement the order with a proposal of the special configuration. This
proposal then needs to be checked by a sales engineer who will approve the proposal if the
Case Company will be able to fulfill the request. These engines have proven to be particularly
troublesome to sell if the original customer cancels the order late.
Custom Configured Engines
Custom configured engines are engines where the customer changes freely which modules he
or she wish to have on the configuration of the engine. The choice is however limited to the
present products assortment. The customer may change everything from packaging and paint
to type of transmission or generator sets, test certificates and labels.
Authorized Stock Engines (ASE)
ASEs are preconfigured engines which come with a standard engine configuration. These
standards are determined by sales volume and demand for short lead times as these engines
are approved to be kept in planned finished goods inventories. The item number of an ASE
will be the original item number of the engine model plus a suffix stating which ASE it is and
thus revealing the configuration of the engine.
Non-Configured Engines
Non-configured engines are not offered with any choice of modification. All engines from a
product model will be exactly the same. This category includes the product assortment of
small inboard and sailboat engines and the outboard assortment.
4.6 THE PRODUCTION ENVIRONMENT AT THE CASE COMPANY
Forecasting and manufacturing planning and control will differ among the engine categories.
Specially configured engines as well as custom configured engines are always MTO. They
may only end up in uncommitted finished engines stock if the customer chooses to cancel the
order on related engines when they are in production or already finished.
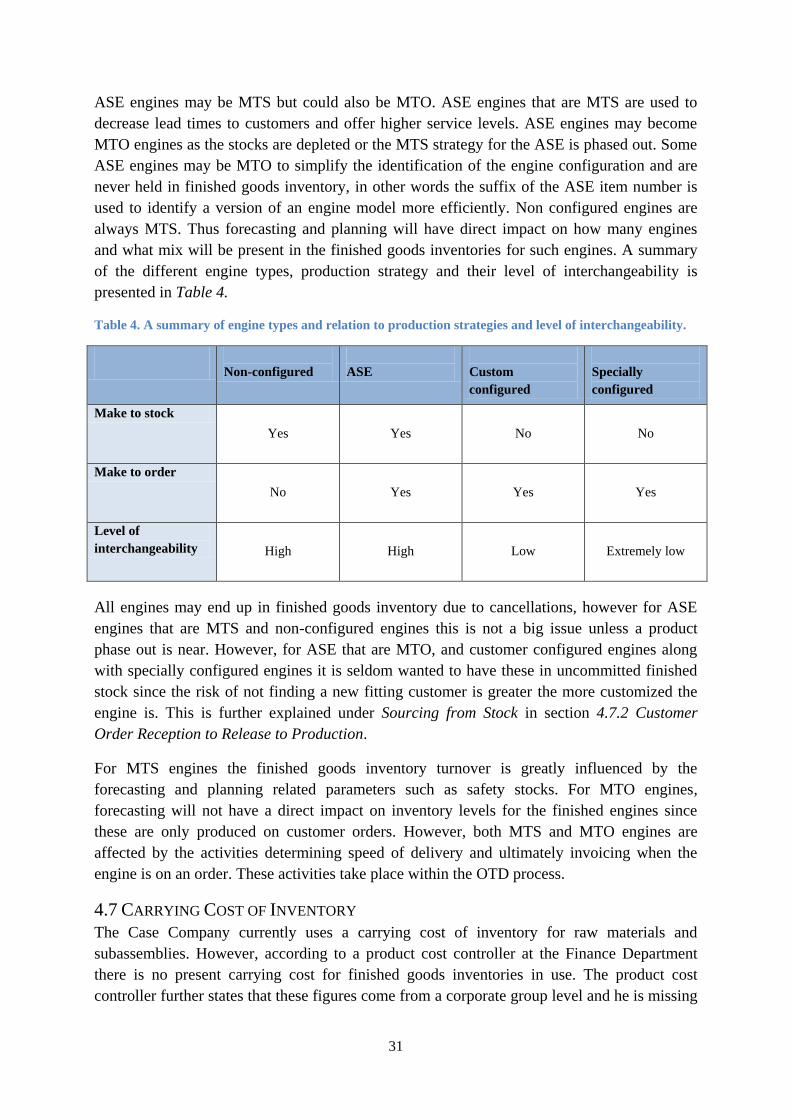
31
ASE engines may be MTS but could also be MTO. ASE engines that are MTS are used to
decrease lead times to customers and offer higher service levels. ASE engines may become
MTO engines as the stocks are depleted or the MTS strategy for the ASE is phased out. Some
ASE engines may be MTO to simplify the identification of the engine configuration and are
never held in finished goods inventory, in other words the suffix of the ASE item number is
used to identify a version of an engine model more efficiently. Non configured engines are
always MTS. Thus forecasting and planning will have direct impact on how many engines
and what mix will be present in the finished goods inventories for such engines. A summary
of the different engine types, production strategy and their level of interchangeability is
presented in Table 4.
Table 4. A summary of engine types and relation to production strategies and level of interchangeability.
Non-configured
ASE
Custom
configured
Specially
configured
Make to stock
Yes Yes No No
Make to order
No Yes Yes Yes
Level of
interchangeability High High Low Extremely low
All engines may end up in finished goods inventory due to cancellations, however for ASE
engines that are MTS and non-configured engines this is not a big issue unless a product
phase out is near. However, for ASE that are MTO, and customer configured engines along
with specially configured engines it is seldom wanted to have these in uncommitted finished
stock since the risk of not finding a new fitting customer is greater the more customized the
engine is. This is further explained under Sourcing from Stock in section 4.7.2 Customer
Order Reception to Release to Production.
For MTS engines the finished goods inventory turnover is greatly influenced by the
forecasting and planning related parameters such as safety stocks. For MTO engines,
forecasting will not have a direct impact on inventory levels for the finished engines since
these are only produced on customer orders. However, both MTS and MTO engines are
affected by the activities determining speed of delivery and ultimately invoicing when the
engine is on an order. These activities take place within the OTD process.
4.7 CARRYING COST OF INVENTORY
The Case Company currently uses a carrying cost of inventory for raw materials and
subassemblies. However, according to a product cost controller at the Finance Department
there is no present carrying cost for finished goods inventories in use. The product cost
controller further states that these figures come from a corporate group level and he is missing
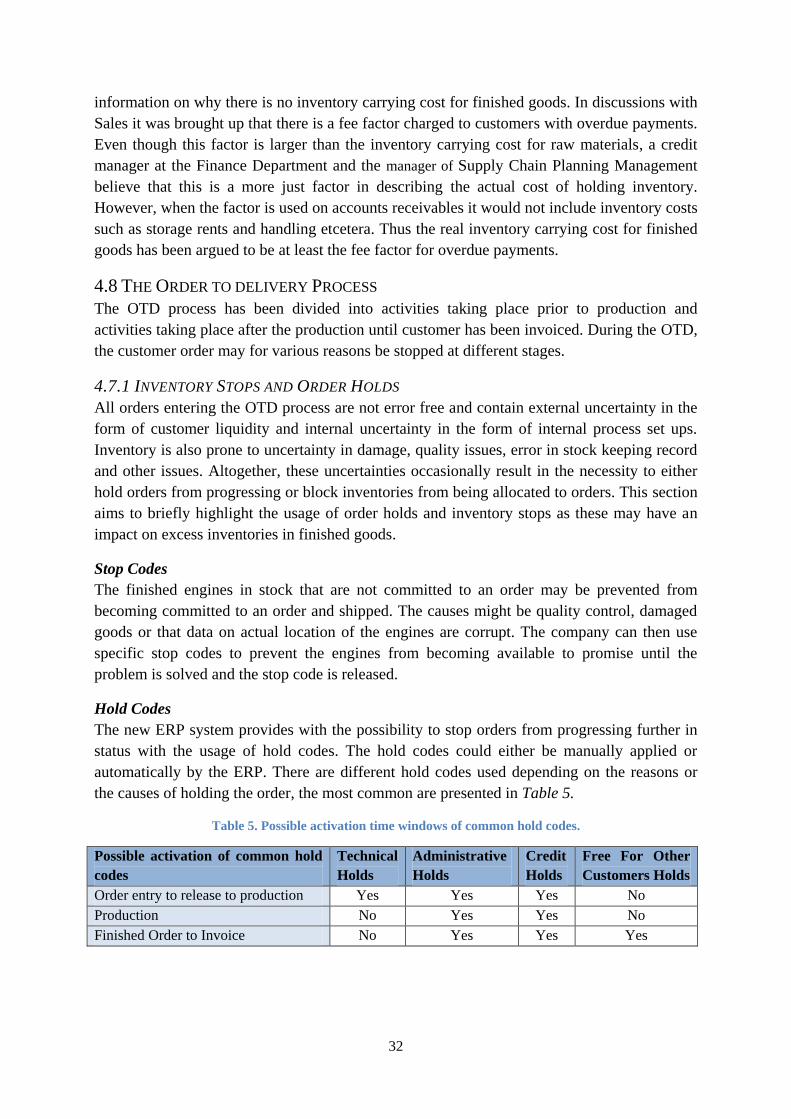
32
information on why there is no inventory carrying cost for finished goods. In discussions with
Sales it was brought up that there is a fee factor charged to customers with overdue payments.
Even though this factor is larger than the inventory carrying cost for raw materials, a credit
manager at the Finance Department and the manager of Supply Chain Planning Management
believe that this is a more just factor in describing the actual cost of holding inventory.
However, when the factor is used on accounts receivables it would not include inventory costs
such as storage rents and handling etcetera. Thus the real inventory carrying cost for finished
goods has been argued to be at least the fee factor for overdue payments.
4.8 THE ORDER TO DELIVERY PROCESS
The OTD process has been divided into activities taking place prior to production and
activities taking place after the production until customer has been invoiced. During the OTD,
the customer order may for various reasons be stopped at different stages.
4.7.1 INVENTORY STOPS AND ORDER HOLDS
All orders entering the OTD process are not error free and contain external uncertainty in the
form of customer liquidity and internal uncertainty in the form of internal process set ups.
Inventory is also prone to uncertainty in damage, quality issues, error in stock keeping record
and other issues. Altogether, these uncertainties occasionally result in the necessity to either
hold orders from progressing or block inventories from being allocated to orders. This section
aims to briefly highlight the usage of order holds and inventory stops as these may have an
impact on excess inventories in finished goods.
Stop Codes
The finished engines in stock that are not committed to an order may be prevented from
becoming committed to an order and shipped. The causes might be quality control, damaged
goods or that data on actual location of the engines are corrupt. The company can then use
specific stop codes to prevent the engines from becoming available to promise until the
problem is solved and the stop code is released.
Hold Codes
The new ERP system provides with the possibility to stop orders from progressing further in
status with the usage of hold codes. The hold codes could either be manually applied or
automatically by the ERP. There are different hold codes used depending on the reasons or
the causes of holding the order, the most common are presented in Table 5.
Table 5. Possible activation time windows of common hold codes.
Possible activation of common hold
codes
Technical
Holds
Administrative
Holds
Credit
Holds
Free For Other
Customers Holds
Order entry to release to production Yes Yes Yes No
Production No Yes Yes No
Finished Order to Invoice No Yes Yes Yes
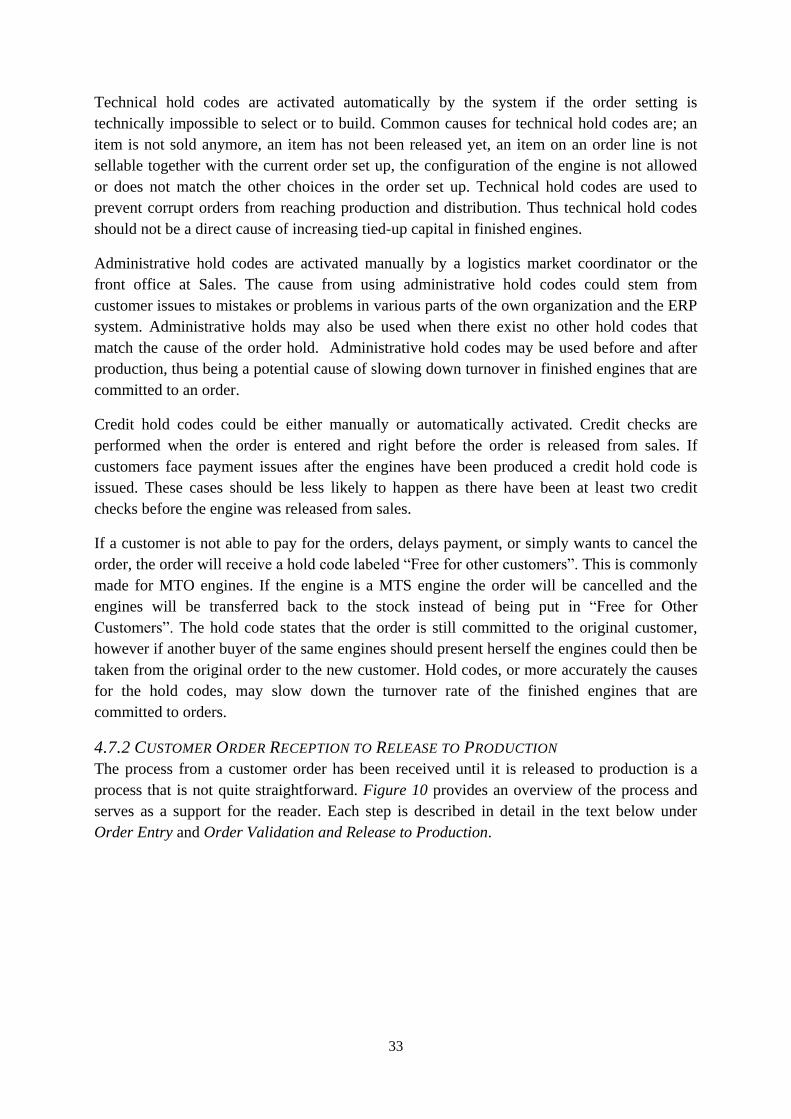
33
Technical hold codes are activated automatically by the system if the order setting is
technically impossible to select or to build. Common causes for technical hold codes are; an
item is not sold anymore, an item has not been released yet, an item on an order line is not
sellable together with the current order set up, the configuration of the engine is not allowed
or does not match the other choices in the order set up. Technical hold codes are used to
prevent corrupt orders from reaching production and distribution. Thus technical hold codes
should not be a direct cause of increasing tied-up capital in finished engines.
Administrative hold codes are activated manually by a logistics market coordinator or the
front office at Sales. The cause from using administrative hold codes could stem from
customer issues to mistakes or problems in various parts of the own organization and the ERP
system. Administrative holds may also be used when there exist no other hold codes that
match the cause of the order hold. Administrative hold codes may be used before and after
production, thus being a potential cause of slowing down turnover in finished engines that are
committed to an order.
Credit hold codes could be either manually or automatically activated. Credit checks are
performed when the order is entered and right before the order is released from sales. If
customers face payment issues after the engines have been produced a credit hold code is
issued. These cases should be less likely to happen as there have been at least two credit
checks before the engine was released from sales.
If a customer is not able to pay for the orders, delays payment, or simply wants to cancel the
order, the order will receive a hold code labeled “Free for other customers”. This is commonly
made for MTO engines. If the engine is a MTS engine the order will be cancelled and the
engines will be transferred back to the stock instead of being put in “Free for Other
Customers”. The hold code states that the order is still committed to the original customer,
however if another buyer of the same engines should present herself the engines could then be
taken from the original order to the new customer. Hold codes, or more accurately the causes
for the hold codes, may slow down the turnover rate of the finished engines that are
committed to orders.
4.7.2 CUSTOMER ORDER RECEPTION TO RELEASE TO PRODUCTION
The process from a customer order has been received until it is released to production is a
process that is not quite straightforward. Figure 10 provides an overview of the process and
serves as a support for the reader. Each step is described in detail in the text below under
Order Entry and Order Validation and Release to Production.
34
Order creation/
Order entry
Order Promise
(automated by
ERP)
Order Validation
Technical Control
(ERP)
Order Entered in
Pro-Sales (SO)
Order Entered in
Demand Schedule
Application (DS)
Technically
OK?Credit OK?
Specially custom
configured?
BOM Created By
Sales Engineer
Technical Control
Front Office or
Back Office, or
Sales Engineers,
other Special
Competence
Order Validation
Credit Check
(ERP)
Order Validation
Service Level
Check
(ERP)
Request date
= Promised
date?
Order Re-Promise
Front Office or
Back Office, or
Material Producers,
Production
Managers
Credit Manager
Check
Order Confirmed
(ERP/Front Office)
Order Frozen
Release from
sales office
Yes
Yes Yes
NoNoNo
No
Yes
Order Ok?
Rerun Re-order
promise,
Technical
control, or Credit
Manager Check
Order OK?
Order kept on hold
Order Cancelled
OR
Yes No
No
Yes
Figure 10. Order entry to release to production.
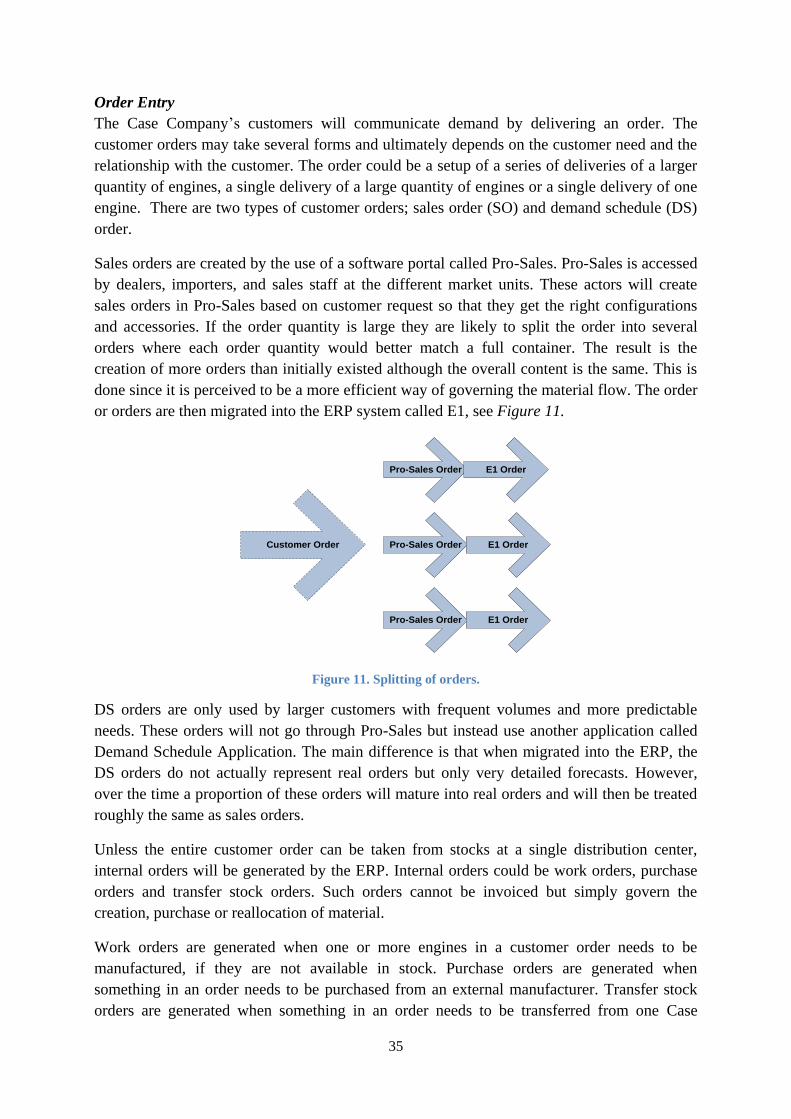
35
Order Entry
The Case Company’s customers will communicate demand by delivering an order. The
customer orders may take several forms and ultimately depends on the customer need and the
relationship with the customer. The order could be a setup of a series of deliveries of a larger
quantity of engines, a single delivery of a large quantity of engines or a single delivery of one
engine. There are two types of customer orders; sales order (SO) and demand schedule (DS)
order.
Sales orders are created by the use of a software portal called Pro-Sales. Pro-Sales is accessed
by dealers, importers, and sales staff at the different market units. These actors will create
sales orders in Pro-Sales based on customer request so that they get the right configurations
and accessories. If the order quantity is large they are likely to split the order into several
orders where each order quantity would better match a full container. The result is the
creation of more orders than initially existed although the overall content is the same. This is
done since it is perceived to be a more efficient way of governing the material flow. The order
or orders are then migrated into the ERP system called E1, see Figure 11.
Pro-Sales Order
Pro-Sales Order
Pro-Sales Order
E1 Order
E1 Order
E1 Order
Customer Order
Figure 11. Splitting of orders.
DS orders are only used by larger customers with frequent volumes and more predictable
needs. These orders will not go through Pro-Sales but instead use another application called
Demand Schedule Application. The main difference is that when migrated into the ERP, the
DS orders do not actually represent real orders but only very detailed forecasts. However,
over the time a proportion of these orders will mature into real orders and will then be treated
roughly the same as sales orders.
Unless the entire customer order can be taken from stocks at a single distribution center,
internal orders will be generated by the ERP. Internal orders could be work orders, purchase
orders and transfer stock orders. Such orders cannot be invoiced but simply govern the
creation, purchase or reallocation of material.
Work orders are generated when one or more engines in a customer order needs to be
manufactured, if they are not available in stock. Purchase orders are generated when
something in an order needs to be purchased from an external manufacturer. Transfer stock
orders are generated when something in an order needs to be transferred from one Case
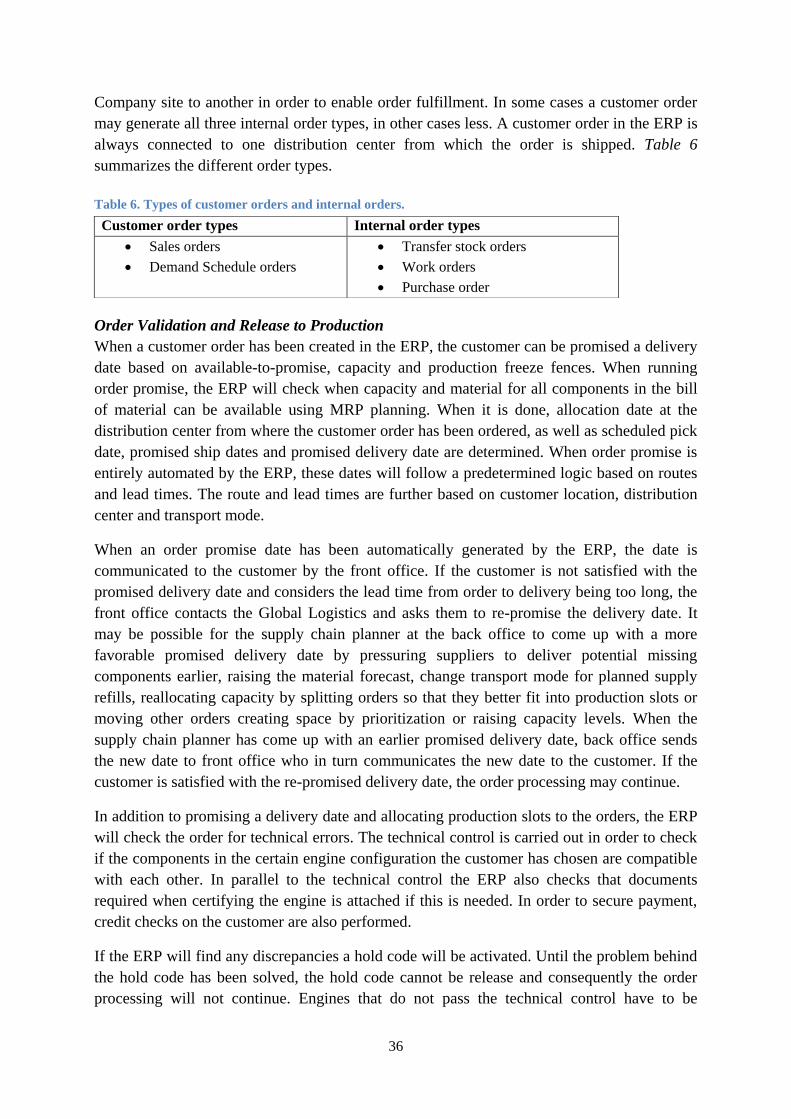
36
Company site to another in order to enable order fulfillment. In some cases a customer order
may generate all three internal order types, in other cases less. A customer order in the ERP is
always connected to one distribution center from which the order is shipped. Table 6
summarizes the different order types.
Table 6. Types of customer orders and internal orders.
Order Validation and Release to Production
When a customer order has been created in the ERP, the customer can be promised a delivery
date based on available-to-promise, capacity and production freeze fences. When running
order promise, the ERP will check when capacity and material for all components in the bill
of material can be available using MRP planning. When it is done, allocation date at the
distribution center from where the customer order has been ordered, as well as scheduled pick
date, promised ship dates and promised delivery date are determined. When order promise is
entirely automated by the ERP, these dates will follow a predetermined logic based on routes
and lead times. The route and lead times are further based on customer location, distribution
center and transport mode.
When an order promise date has been automatically generated by the ERP, the date is
communicated to the customer by the front office. If the customer is not satisfied with the
promised delivery date and considers the lead time from order to delivery being too long, the
front office contacts the Global Logistics and asks them to re-promise the delivery date. It
may be possible for the supply chain planner at the back office to come up with a more
favorable promised delivery date by pressuring suppliers to deliver potential missing
components earlier, raising the material forecast, change transport mode for planned supply
refills, reallocating capacity by splitting orders so that they better fit into production slots or
moving other orders creating space by prioritization or raising capacity levels. When the
supply chain planner has come up with an earlier promised delivery date, back office sends
the new date to front office who in turn communicates the new date to the customer. If the
customer is satisfied with the re-promised delivery date, the order processing may continue.
In addition to promising a delivery date and allocating production slots to the orders, the ERP
will check the order for technical errors. The technical control is carried out in order to check
if the components in the certain engine configuration the customer has chosen are compatible
with each other. In parallel to the technical control the ERP also checks that documents
required when certifying the engine is attached if this is needed. In order to secure payment,
credit checks on the customer are also performed.
If the ERP will find any discrepancies a hold code will be activated. Until the problem behind
the hold code has been solved, the hold code cannot be release and consequently the order
processing will not continue. Engines that do not pass the technical control have to be
Customer order types Internal order types
Sales orders
Demand Schedule orders
Transfer stock orders
Work orders
Purchase order

37
reconfigured by the back office so that it becomes technically correct and can be produced.
Issues regarding documentation may be solved by either the front office or the back office
depending on the nature of the hold code. Hold codes concerning credit and payment issues
are solved by a credit controller at the related local market unit.
When all potential issues are solved and the hold codes are released, the order can be
confirmed by the front office. The order will then be frozen and await release to production.
When an order is frozen no changes can be made and the order can ideally not be cancelled.
The order is released to production a fixed number of days before the real production start.
The processes in order entry to release to production directly govern planned lead times,
production utilization and inventory levels. However, although orders progress through self-
explanatory stages in the ERP, there is often a need for additional communication between
several roles at different departments. The most common actors are presented in Table 7.
Furthermore, Figure 12 illustrates the communication flow that may take place between some
of the actors when an order is re-promised.
Table 7. Actors in the OTD process and their responsibilities.
Actor Important responsibilities in the OTD
Sales staff Has contact with distributors or customers, manage relations, sell.
Front office staff at market units Support the sales staff, manage orders and can invoice.
Credit controller Solve payment related issues, decides credit limits and extended terms
Logistics market coordinators Organize communication between supply chain planners and the front
offices, books transports and can invoice.
Supply chain planners In charge of order scheduling, reruns order promise after manual
adjustments on capacity and material plans, finalizing S&OP plans
Material procurers at the local plant Handle most contacts with suppliers for the items that they purchase
Plant managers Make decisions on production capacity changes
Product planning department Governs which engine configurations are allowed to be selected in Pro-
Sales and the ERP system
Technical sales engineer Validates and creates bill of materials for specially configured engines
Group and/or senior managers at
Global Logistics or sales
May get involved when critical situation arise, such as large important
orders
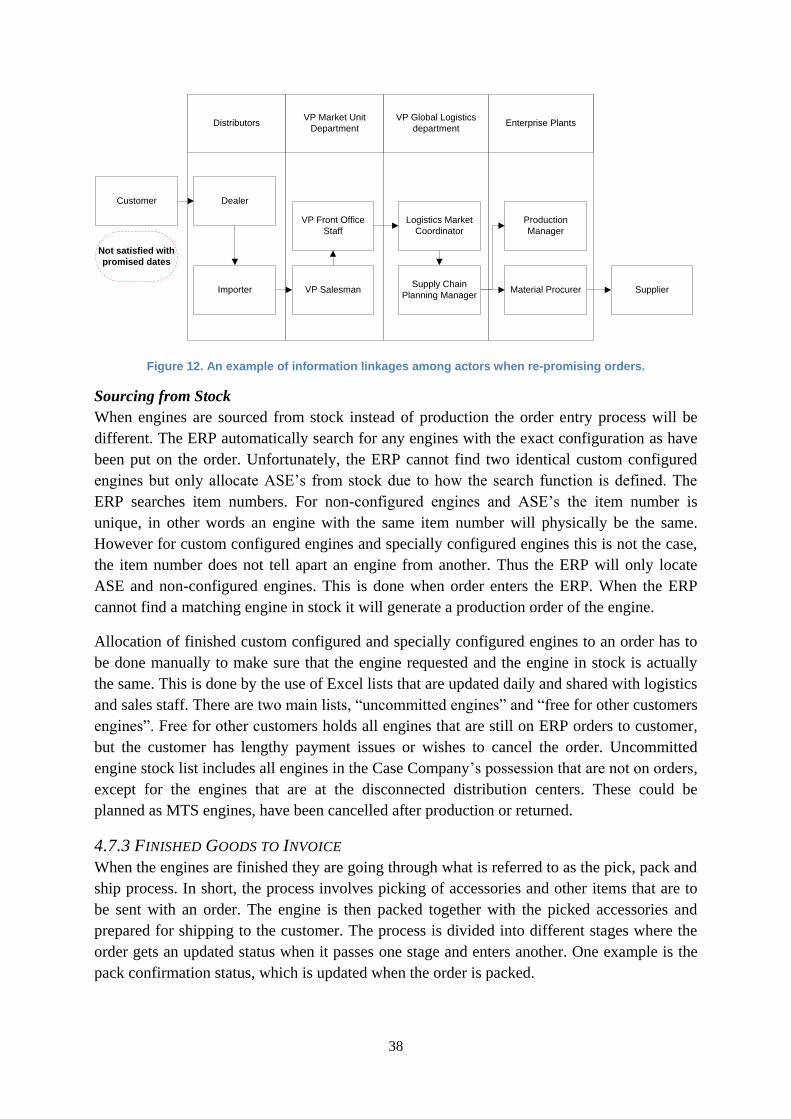
38
Distributors
Customer Dealer
Importer VP Salesman
VP Front Office
Staff
Logistics Market
Coordinator
Supply Chain
Planning ManagerMaterial Procurer Supplier
Production
Manager
VP Market Unit
Department
VP Global Logistics
departmentEnterprise Plants
Not satisfied with
promised dates
Figure 12. An example of information linkages among actors when re-promising orders.
Sourcing from Stock
When engines are sourced from stock instead of production the order entry process will be
different. The ERP automatically search for any engines with the exact configuration as have
been put on the order. Unfortunately, the ERP cannot find two identical custom configured
engines but only allocate ASE’s from stock due to how the search function is defined. The
ERP searches item numbers. For non-configured engines and ASE’s the item number is
unique, in other words an engine with the same item number will physically be the same.
However for custom configured engines and specially configured engines this is not the case,
the item number does not tell apart an engine from another. Thus the ERP will only locate
ASE and non-configured engines. This is done when order enters the ERP. When the ERP
cannot find a matching engine in stock it will generate a production order of the engine.
Allocation of finished custom configured and specially configured engines to an order has to
be done manually to make sure that the engine requested and the engine in stock is actually
the same. This is done by the use of Excel lists that are updated daily and shared with logistics
and sales staff. There are two main lists, “uncommitted engines” and “free for other customers
engines”. Free for other customers holds all engines that are still on ERP orders to customer,
but the customer has lengthy payment issues or wishes to cancel the order. Uncommitted
engine stock list includes all engines in the Case Company’s possession that are not on orders,
except for the engines that are at the disconnected distribution centers. These could be
planned as MTS engines, have been cancelled after production or returned.
4.7.3 FINISHED GOODS TO INVOICE
When the engines are finished they are going through what is referred to as the pick, pack and
ship process. In short, the process involves picking of accessories and other items that are to
be sent with an order. The engine is then packed together with the picked accessories and
prepared for shipping to the customer. The process is divided into different stages where the
order gets an updated status when it passes one stage and enters another. One example is the
pack confirmation status, which is updated when the order is packed.
39
During the process a credit check is initiated. It is a warning stating that orders should be
stopped from being shipped to customers. It could be considered as an emergency stop and is
used when a customer is in a serious financial situation and risk going bankrupt, when credit
limits have been exceeded, when pre-payment has not been received from the customer or if
the letter of credit for some reason is not ready. However, the credit check does not exist for
customers in Region International. Instead, these orders go through an extra process step in
which payment and other potential issues are checked. During this process step the order has
been updated to a status where it is formally in the hands of Region International, and Global
Logistics is not allowed to progress these orders until they are updated to the next status. The
reason is that the order should not pass this process step and be shipped until the issues have
been solved. If the issues are not solved in time, delaying the actual shipping of the order to a
date after the promised ship date, the engines will tie-up unnecessary capital for the Case
Company.
Transport Booking and Route Lead Times
The next step is to arrange with transportation to the customer of the engines. Transportation
cannot be booked until payment has been secured. In the case of Region International, the
orders must have passed through the extra process step in which payment is checked. The
logistics market coordinators receive an Email from the front office when an order is ready to
be shipped and transportation may be booked. Except for information regarding that payment
is secured, the logistics market coordinator also needs information about the packing structure
of the products before transportation can be booked. The packing structure is simply stating
how much space the shipments require on board a plane, truck or vessel. In general, the
logistics market coordinator contacts an internal logistics company owned by the corporate
group for the transport booking, but in some cases the logistics market coordinator may also
contact an external transportation firm or 3PL directly.
The transport booking process is relatively simple for Region Europe where most transports
are going by truck. These transports can be booked the day after, or even on the same day, as
an Email confirmation from front office with all the information needed has been received.
The reason for the simplified process is that the transport costs are already included in the
price. However, the booking process is more complex for overseas markets. Particularly for
Region International, which is a region that covers large parts of the globe. The reasons
behind the complexity for the overseas regions is that most of the transportation is done by
cargo vessels that depart for its destinations more seldom compared to continental European
truck transports. Typically the cargo vessels depart once a week or every second week. For
example, for Argentina the cargo vessels depart from Sweden every Thursday. Deadline for
transportation bookings is on Wednesday the week before departure.
Currently the promised ship date is the pick date plus a fixed route lead-time allowing for
time for transportation to the point of departure, unloading and loading at the point of
departure, administrative work and so on. Thus, when an order is promised there is a
likelihood that the order will receive a promised ship date rather unmatched to an actual
possible departure, and hence the order may have to have to wait several days before it can be
shipped. This is illustrated in Figure 13.
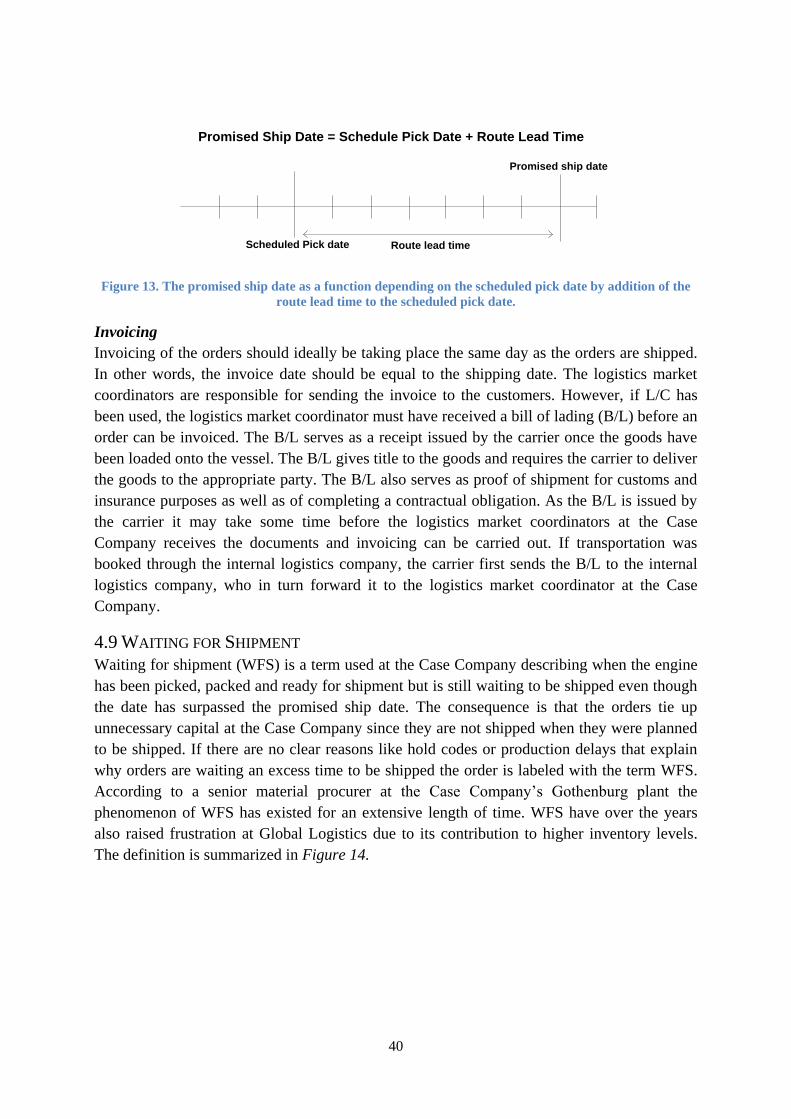
40
Scheduled Pick date
Promised ship date
Route lead time
Promised Ship Date = Schedule Pick Date + Route Lead Time
Figure 13. The promised ship date as a function depending on the scheduled pick date by addition of the
route lead time to the scheduled pick date.
Invoicing
Invoicing of the orders should ideally be taking place the same day as the orders are shipped.
In other words, the invoice date should be equal to the shipping date. The logistics market
coordinators are responsible for sending the invoice to the customers. However, if L/C has
been used, the logistics market coordinator must have received a bill of lading (B/L) before an
order can be invoiced. The B/L serves as a receipt issued by the carrier once the goods have
been loaded onto the vessel. The B/L gives title to the goods and requires the carrier to deliver
the goods to the appropriate party. The B/L also serves as proof of shipment for customs and
insurance purposes as well as of completing a contractual obligation. As the B/L is issued by
the carrier it may take some time before the logistics market coordinators at the Case
Company receives the documents and invoicing can be carried out. If transportation was
booked through the internal logistics company, the carrier first sends the B/L to the internal
logistics company, who in turn forward it to the logistics market coordinator at the Case
Company.
4.9 WAITING FOR SHIPMENT
Waiting for shipment (WFS) is a term used at the Case Company describing when the engine
has been picked, packed and ready for shipment but is still waiting to be shipped even though
the date has surpassed the promised ship date. The consequence is that the orders tie up
unnecessary capital at the Case Company since they are not shipped when they were planned
to be shipped. If there are no clear reasons like hold codes or production delays that explain
why orders are waiting an excess time to be shipped the order is labeled with the term WFS.
According to a senior material procurer at the Case Company’s Gothenburg plant the
phenomenon of WFS has existed for an extensive length of time. WFS have over the years
also raised frustration at Global Logistics due to its contribution to higher inventory levels.
The definition is summarized in Figure 14.
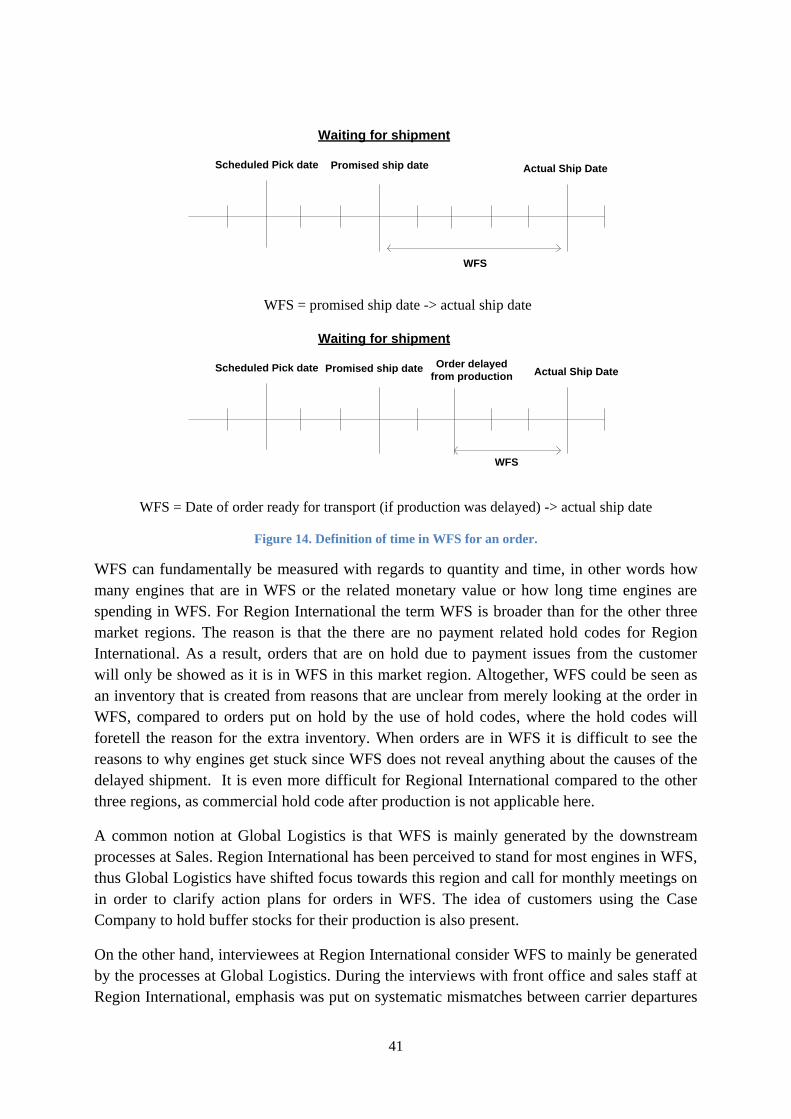
41
Scheduled Pick date Promised ship date
Waiting for shipment
Actual Ship Date
WFS
WFS = promised ship date -> actual ship date
Scheduled Pick date Promised ship date
Waiting for shipment
Actual Ship Date
WFS
Order delayed
from production
WFS = Date of order ready for transport (if production was delayed) -> actual ship date
Figure 14. Definition of time in WFS for an order.
WFS can fundamentally be measured with regards to quantity and time, in other words how
many engines that are in WFS or the related monetary value or how long time engines are
spending in WFS. For Region International the term WFS is broader than for the other three
market regions. The reason is that the there are no payment related hold codes for Region
International. As a result, orders that are on hold due to payment issues from the customer
will only be showed as it is in WFS in this market region. Altogether, WFS could be seen as
an inventory that is created from reasons that are unclear from merely looking at the order in
WFS, compared to orders put on hold by the use of hold codes, where the hold codes will
foretell the reason for the extra inventory. When orders are in WFS it is difficult to see the
reasons to why engines get stuck since WFS does not reveal anything about the causes of the
delayed shipment. It is even more difficult for Regional International compared to the other
three regions, as commercial hold code after production is not applicable here.
A common notion at Global Logistics is that WFS is mainly generated by the downstream
processes at Sales. Region International has been perceived to stand for most engines in WFS,
thus Global Logistics have shifted focus towards this region and call for monthly meetings on
in order to clarify action plans for orders in WFS. The idea of customers using the Case
Company to hold buffer stocks for their production is also present.
On the other hand, interviewees at Region International consider WFS to mainly be generated
by the processes at Global Logistics. During the interviews with front office and sales staff at
Region International, emphasis was put on systematic mismatches between carrier departures
42
and promised ship dates, which could at best represent WFS up to a few weeks. When instead
cases of longer WFS times are brought up the explanation was that little could have been done
to stop it from occurring as something unpredictable had occurred, such as political trade
sanctions.
4.10 INTERNATIONAL TRADE RISKS AND TIED-UP CAPITAL
The Case Company is a global company and the vast majority of its sales take place through
international trade. However, international trade is also imposed with certain risks. Engines
that are packed and ready to be shipped can sometimes be in WFS for a very long time due to
reasons that are difficult to foresee and are out of the control of the Case Company. The
political situation in many countries may change quickly and in the era of globalization it will
consequently affect the Case Company’s operations as well. Political instability, bureaucracy
or sanctions may result in making it temporarily, or in some cases even permanently,
impossible for customers in those countries to receive their orders. Below follows two cases
of such situations, where the consequence for the Case Company was excess capital tied-up in
finished goods.
As a respond to Iran’s intentions concerning their nuclear program, the European Union as
well as other nations imposed economic sanctions on the country regarding foreign trade,
financial services, energy sectors and technologies. For the Case Company this simply meant
that no products were allowed to be exported to Iran. Consequently, ordered engines from
Iranian customers that already were produced got stuck in WFS where they will be until new
customers have been found or when the sanctions are released and the engines can be
invoiced and shipped to its original customers in Iran.
Another aspect that the Case Company needs to counter includes issues regarding domestic
policies, bureaucracy and regulations on international trade that some countries impose.
Argentina introduced a 1:1 policy regarding foreign trade in 2011, meaning that importers are
free to bring goods into Argentina on the condition that they match the value of the imported
goods with exports. Consequently, Argentinean customers will have to match the imports
from the Case Company with an export of similar value. It may take some time and the
implication for the Case Company is simply that it has become more difficult to do business
in the country and that engines more often get stuck in WFS.
4.11 CUSTOMER PAYMENT CONDITIONS
The customers on the Case Company’s overseas markets are generally importers who
represent the Case Company in the country. The final customers, in other words the
consumers, contact the importer who in turn contacts the Case Company and forward their
orders. However, in some cases the consumer may also contact an area sales manager at the
Case Company directly for various reasons. It could be important key customers or customers
with special requirements. The payment terms are negotiated between the area sales manager
and the customer. However, in some cases a credit controller is involved as well, depending
on the nature of the payment terms that is under negotiation. The result of negotiations over
payment methods and payment terms depend on several parameters. The risk of payment

43
default and the customer’s payment ability in previous deals are of course important, but also
the value of the order and more qualitative issues such as the area sales manager’s relationship
with the customer.
According to the interviewed area sales managers, the payment terms could be a significant
mean of creating competitive advantage. Offering the customer lucrative payment terms could
in some cases be even more important than the price of the product offered and may
consequently constitute the difference between if the business will go to the Case Company or
any of its competitors. The area sales managers may offer their customers three different
payment methods. They are used to various extents on different regions and markets and
include pre-payment, open account with credit limits and letter of credit (L/C).
Pre-Payment
Prepayment is mainly applied in deals with new customers, customers that purchase engines
seldom or on an irregular basis and customers that may be incurred with a higher risk of
payment default. Prepayment simply means that the customers need to pay for the ordered
products before they are shipped from the Case Company. In some cases the customer is also
obliged to down payment before the ordered engines goes into production. However, the
decision of whether down payment is applied or not is taken by the area sales manager and
seems to vary between different sales managers, customers and markets. Prepayment is the
preferred payment method for the Case Company in terms of customer payment default risk
as the company can be assured that no products will be shipped until payment from the
customer has been received.
Open Account with Credit Limits
Open account is the most widely used payment method. An important issue when open
account is used as payment method is the credit limit. The credit limit is different from
customer to customer and is set by a credit controller. The limit is based on the credit rating of
the customers. The purpose of the credit ratings is to rank the capability of customers to repay
debts to the Case Company as well as the risk of default. The Case Company uses a credit
rating system when deciding upon its customers’ credit limits. The credit limit is set
individually for customers and is valid during one year. It means that the customer is allowed
to order products from the Case Company for a maximum value corresponding to the credit
limit before the invoices need to be paid. If a customer reaches the credit limit, a commercial
hold code is initiated, preventing new engines from being produced until payment has been
received for earlier invoiced engines. However, due to pressure from sales the credit
controller usually releases the commercial hold codes so that the ordered engines can go into
production. The credit controller do this when he or she trust the customer and believe that
customers will pay for the ordered engines even though the credit limit has been reached.
Depending on how a customer is rated according to the rating system, the size of the credit
limit offered by the Case Company will vary. Customers with a high credit rating are
considered as credit worthy and will therefore get higher credit limits. On the contrary,
customers with a low credit rating will get lower credit limits.
44
However, customers on overseas markets may sometimes get a very low credit rating. Not
necessarily because the customer’s financial situation is bad, but rather due to lacking
availability of financial information regarding the customers on these markets. According to
the credit controller it may cause problems as some customers that in fact are very reliable,
receive a low credit rating and consequently a low credit limit.
The standard payment term for open account is 30 days and access to the goods before
payment. However, often the area sales manager offers the customer better payment terms
than the standard payment terms, for example 60 days, 90 days, 120 days or even 180 days.
This is a way for the area sales managers to offer the customer competitive payment terms
and compete with offerings from competitors. Depending on the circumstances and the
relationship with the customer, the credit may be extended. When payment terms deviates
from the standard ones, the decision needs to be taken with support from a credit controller.
Letter of Credit
L/C can to a large extent be considered as trading with documents rather than goods, where
the Case Company pays a fee to a bank in exchange for a L/C. The L/C that the bank issues is
a document serving as a guarantee to the seller, in other words the Case Company, that it will
receive payment for the delivered goods by the issuer of the L/C regardless of whether the
buyer fails to pay. The bank will only issue a L/C to the seller if they believe the buyer will
pay. However, by using L/C the Case Company transfer the risk of customer payment default
from them to the bank. L/C is mainly used for customers in Region International and the use
of it is agreed upon between the area sales manager and the customer. A credit controller is
then contacted in order to arrange the details regarding the L/C such as contacting and dealing
with the banks. Although the use of L/C is a security for the Case Company, it is a time-
consuming process as documents need to be sent between the banks and the seller and the
buyer and if anything with the documents is incorrect the process will have to start all over
again. Some area sales managers have expressed that pre-payment is a viable option to L/C as
it is cheaper and more flexible. However, the use of L/C is sometimes necessary and in some
countries it is also a cultural issue. For example, customers in India tend to insist on using L/C
even though, from a risk perspective, it is not always necessary.
Orders where L/C has been agreed upon, as payment method will get a L/C hold code that
stops the engines from going into production. The L/C hold code will be released when the
L/C is ready. The reason for the hold code is to prevent engines from being produced and then
risk losing the customer before payment is secured, but also avoid capital being tied up in
WFS. However, the long lead-times associated with L/C result in that the credit controller
experiences pressure from Sales to release L/C hold codes from orders so that they can go into
production before the bureaucracy is completed. The customers usually want their engines as
soon as possible according to sales, and making the credit controller release L/C hold codes so
that engines can go into production, before the L/C is actually ready, is a way for sales to
speed up the lead times.
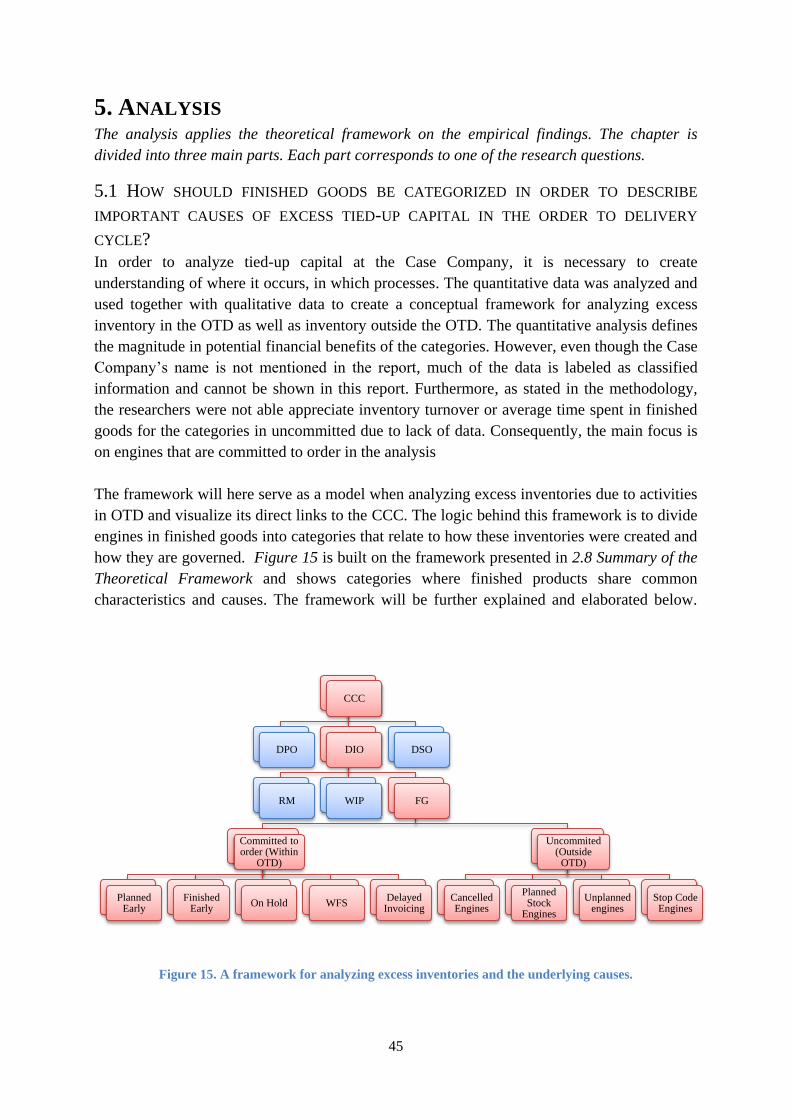
45
5. ANALYSIS The analysis applies the theoretical framework on the empirical findings. The chapter is
divided into three main parts. Each part corresponds to one of the research questions.
5.1 HOW SHOULD FINISHED GOODS BE CATEGORIZED IN ORDER TO DESCRIBE
IMPORTANT CAUSES OF EXCESS TIED-UP CAPITAL IN THE ORDER TO DELIVERY
CYCLE?
In order to analyze tied-up capital at the Case Company, it is necessary to create
understanding of where it occurs, in which processes. The quantitative data was analyzed and
used together with qualitative data to create a conceptual framework for analyzing excess
inventory in the OTD as well as inventory outside the OTD. The quantitative analysis defines
the magnitude in potential financial benefits of the categories. However, even though the Case
Company’s name is not mentioned in the report, much of the data is labeled as classified
information and cannot be shown in this report. Furthermore, as stated in the methodology,
the researchers were not able appreciate inventory turnover or average time spent in finished
goods for the categories in uncommitted due to lack of data. Consequently, the main focus is
on engines that are committed to order in the analysis
The framework will here serve as a model when analyzing excess inventories due to activities
in OTD and visualize its direct links to the CCC. The logic behind this framework is to divide
engines in finished goods into categories that relate to how these inventories were created and
how they are governed. Figure 15 is built on the framework presented in 2.8 Summary of the
Theoretical Framework and shows categories where finished products share common
characteristics and causes. The framework will be further explained and elaborated below.
Figure 15. A framework for analyzing excess inventories and the underlying causes.
CCC
DPO DIO
RM WIP FG
Committed to order (Within
OTD)
Planned Early
Finished Early
On Hold WFS Delayed
Invoicing
Uncommited (Outside
OTD)
Cancelled Engines
Unplanned engines
Planned Stock
Engines
Stop Code Engines
DSO
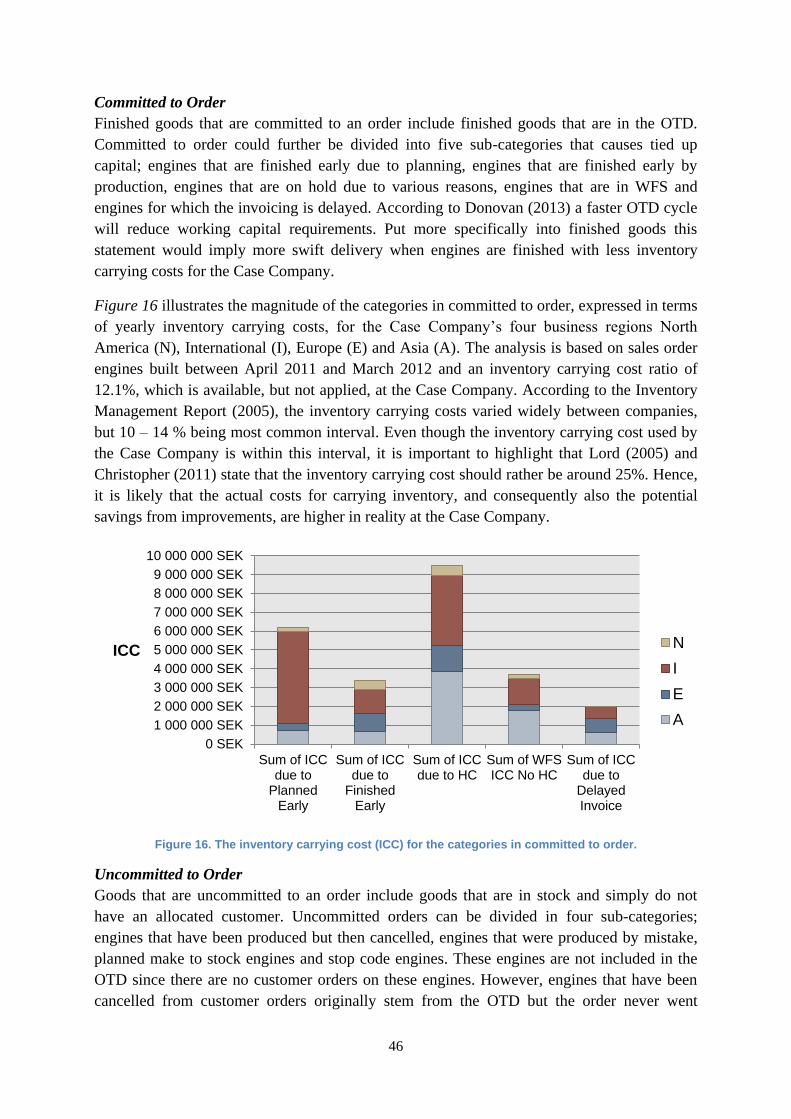
46
Committed to Order
Finished goods that are committed to an order include finished goods that are in the OTD.
Committed to order could further be divided into five sub-categories that causes tied up
capital; engines that are finished early due to planning, engines that are finished early by
production, engines that are on hold due to various reasons, engines that are in WFS and
engines for which the invoicing is delayed. According to Donovan (2013) a faster OTD cycle
will reduce working capital requirements. Put more specifically into finished goods this
statement would imply more swift delivery when engines are finished with less inventory
carrying costs for the Case Company.
Figure 16 illustrates the magnitude of the categories in committed to order, expressed in terms
of yearly inventory carrying costs, for the Case Company’s four business regions North
America (N), International (I), Europe (E) and Asia (A). The analysis is based on sales order
engines built between April 2011 and March 2012 and an inventory carrying cost ratio of
12.1%, which is available, but not applied, at the Case Company. According to the Inventory
Management Report (2005), the inventory carrying costs varied widely between companies,
but 10 – 14 % being most common interval. Even though the inventory carrying cost used by
the Case Company is within this interval, it is important to highlight that Lord (2005) and
Christopher (2011) state that the inventory carrying cost should rather be around 25%. Hence,
it is likely that the actual costs for carrying inventory, and consequently also the potential
savings from improvements, are higher in reality at the Case Company.
Figure 16. The inventory carrying cost (ICC) for the categories in committed to order.
Uncommitted to Order
Goods that are uncommitted to an order include goods that are in stock and simply do not
have an allocated customer. Uncommitted orders can be divided in four sub-categories;
engines that have been produced but then cancelled, engines that were produced by mistake,
planned make to stock engines and stop code engines. These engines are not included in the
OTD since there are no customer orders on these engines. However, engines that have been
cancelled from customer orders originally stem from the OTD but the order never went
0 SEK
1 000 000 SEK
2 000 000 SEK
3 000 000 SEK
4 000 000 SEK
5 000 000 SEK
6 000 000 SEK
7 000 000 SEK
8 000 000 SEK
9 000 000 SEK
10 000 000 SEK
Sum of ICCdue to
PlannedEarly
Sum of ICCdue to
FinishedEarly
Sum of ICCdue to HC
Sum of WFSICC No HC
Sum of ICCdue to
DelayedInvoice
ICC N
I
E
A

47
through delivery and invoice. For a manufacturer with a lot of configured products,
cancellation of products is more sensitive than for producers of more standardized goods.
5.2 WHY IS EXCESS CAPITAL TIED-UP IN FINISHED GOODS INVENTORY?
The framework divided finished goods into nine different categories. This part of the analysis
deals with why excess capital is tied-up in finished goods by analyzing each category in more
detail. A focal area of the analysis is the issue of hold codes and WFS. The reason for this is
not only because it was stressed by the managers at Global Logistics as a critical issue to
solve, but also due to its nature of being a complex problem showing a clear example of the
need for integration of not only sales and logistics but also credit management. The theoretical
points brought up on conflicting departmental objectives and the consequences on taking
decisions in silos will be illustrated by this rather delicate phenomenon.
5.2.1 PLANNED EARLY
A non-negligible part of the tied up capital in finished committed engines are the committed
engines that are planned to be received at a distribution center earlier than the otherwise
expected allocation date. According to Horning (2003) planning can be an important cause of
excess finished goods inventory buffers. Engines that are planned early are given an
allocation date that results in longer time in finished goods. There are several causes behind
planned earlier allocation dates for engines. Three main reasons are order splitting, pre-
building of engines due to holidays or weekends and errors or mistakes. In line with Crandall
& Crandall (2003), it is shown that production planning will create excess inventories in order
to stabilize the work flow for production.
Order Splitting During Order Promise
During order promise, order splitting in terms of production, may occur when the planning
manager chooses to utilize production flexibility on the order. This then allows the ERP to
allocate engines on separate order lines to different dates. The planning manager specifies the
scope of the production flexibility in terms of which engines and for how long they may be
planned early. This function is utilized when the free capacity of the production line
corresponding to the requested date of allocation is not sufficient. To meet with customer
requested dates and maintain service levels the planning manager then will use production
flexibility to allocate engines where there are slots left in production prior or at the requested
allocation date.
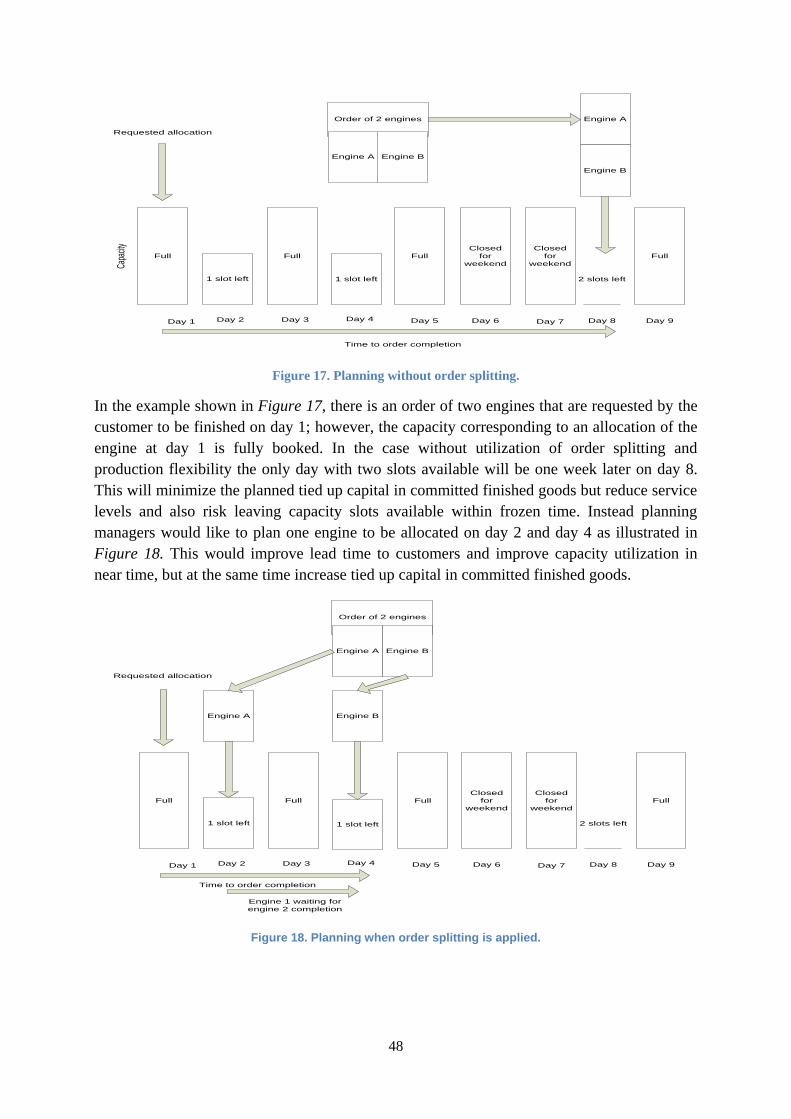
48
Full
1 slot left
Full Full
1 slot left
Full
Day 1 Day 2 Day 3
2 slots left
Day 4 Day 5
Closed
for
weekend
Closed
for
weekend
Day 6 Day 7 Day 8 Day 9
Order of 2 engines
Engine BEngine A
Engine A
Engine B
Requested allocation
Capa
city
Time to order completion
Figure 17. Planning without order splitting.
In the example shown in Figure 17, there is an order of two engines that are requested by the
customer to be finished on day 1; however, the capacity corresponding to an allocation of the
engine at day 1 is fully booked. In the case without utilization of order splitting and
production flexibility the only day with two slots available will be one week later on day 8.
This will minimize the planned tied up capital in committed finished goods but reduce service
levels and also risk leaving capacity slots available within frozen time. Instead planning
managers would like to plan one engine to be allocated on day 2 and day 4 as illustrated in
Figure 18. This would improve lead time to customers and improve capacity utilization in
near time, but at the same time increase tied up capital in committed finished goods.
Full
1 slot left
Full Full
1 slot left
Full
Day 1 Day 2 Day 3
2 slots left
Day 4 Day 5
Closed
for
weekend
Closed
for
weekend
Day 6 Day 7 Day 8 Day 9
Order of 2 engines
Engine BEngine A
Engine A Engine B
Requested allocation
Time to order completion
Engine 1 waiting for
engine 2 completion
Figure 18. Planning when order splitting is applied.
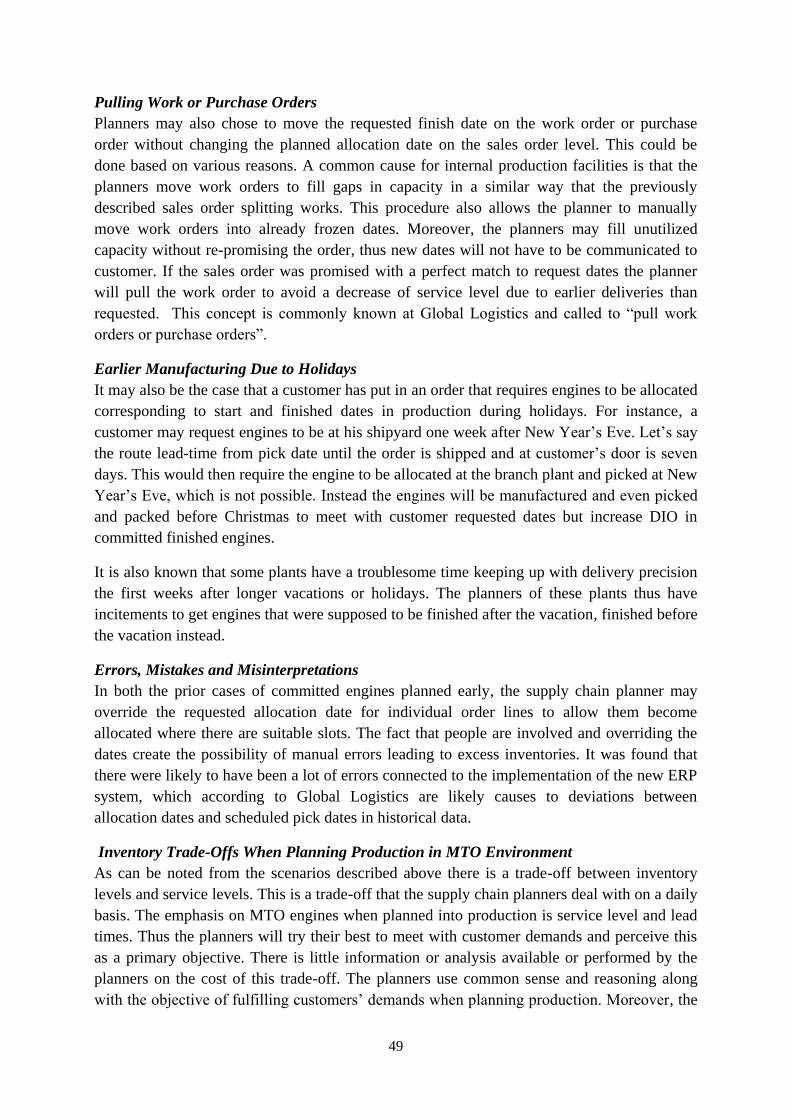
49
Pulling Work or Purchase Orders
Planners may also chose to move the requested finish date on the work order or purchase
order without changing the planned allocation date on the sales order level. This could be
done based on various reasons. A common cause for internal production facilities is that the
planners move work orders to fill gaps in capacity in a similar way that the previously
described sales order splitting works. This procedure also allows the planner to manually
move work orders into already frozen dates. Moreover, the planners may fill unutilized
capacity without re-promising the order, thus new dates will not have to be communicated to
customer. If the sales order was promised with a perfect match to request dates the planner
will pull the work order to avoid a decrease of service level due to earlier deliveries than
requested. This concept is commonly known at Global Logistics and called to “pull work
orders or purchase orders”.
Earlier Manufacturing Due to Holidays
It may also be the case that a customer has put in an order that requires engines to be allocated
corresponding to start and finished dates in production during holidays. For instance, a
customer may request engines to be at his shipyard one week after New Year’s Eve. Let’s say
the route lead-time from pick date until the order is shipped and at customer’s door is seven
days. This would then require the engine to be allocated at the branch plant and picked at New
Year’s Eve, which is not possible. Instead the engines will be manufactured and even picked
and packed before Christmas to meet with customer requested dates but increase DIO in
committed finished engines.
It is also known that some plants have a troublesome time keeping up with delivery precision
the first weeks after longer vacations or holidays. The planners of these plants thus have
incitements to get engines that were supposed to be finished after the vacation, finished before
the vacation instead.
Errors, Mistakes and Misinterpretations
In both the prior cases of committed engines planned early, the supply chain planner may
override the requested allocation date for individual order lines to allow them become
allocated where there are suitable slots. The fact that people are involved and overriding the
dates create the possibility of manual errors leading to excess inventories. It was found that
there were likely to have been a lot of errors connected to the implementation of the new ERP
system, which according to Global Logistics are likely causes to deviations between
allocation dates and scheduled pick dates in historical data.
Inventory Trade-Offs When Planning Production in MTO Environment
As can be noted from the scenarios described above there is a trade-off between inventory
levels and service levels. This is a trade-off that the supply chain planners deal with on a daily
basis. The emphasis on MTO engines when planned into production is service level and lead
times. Thus the planners will try their best to meet with customer demands and perceive this
as a primary objective. There is little information or analysis available or performed by the
planners on the cost of this trade-off. The planners use common sense and reasoning along
with the objective of fulfilling customers’ demands when planning production. Moreover, the

50
planners are also persuaded by the production plants to fill production slots, which also serve
as a primary objective when planning production.
5.2.2 FINISHED EARLY
Another issue lies within the fact that an engine will not necessarily enter finished goods stock
at the exact date as was planned on a sales order level. There may be delays from production
but there are also cases where engines are produced and allocated at a distribution center
earlier than what was planned. The engines will then be allocated at a distribution center
before the planned allocation date. Taking the concept of DIO in consideration, engines
finished early will contribute to a higher DIO by raising the value of the inventory
unnecessarily early unless shipping and invoicing of the engines are conducted earlier as well.
This problem could be described as a lack of process timing which is stated to be a common
reason for longer cycle times in main business processes (Andersen 1999). The findings are
also in line with the view that inefficient processes will generate excess inventories (Donovan,
2013). Finished early occurs when the internal production facility or the external supplier
have completed the work order or purchase order of the engines faster than planned and then
transferred them to the Case Company’s finished goods stock earlier than planned. In this case
the production facilities are the initiators of engines finished early.
5.2.3 ON HOLD
As have been described in the empirical framework there is a set of hold codes used to stop
customer orders from progressing in the OTD process due to various issues. Andersen (1999)
bring forward decreasing interruptions as one of four distinct strategies to speed up main
business processes. Avoiding the need for hold codes is therefore crucial to improve the OTD
cycle. If hold codes are not quickly resolved, they will slow down the order progress in the
OTD cycle and consequently raise excess inventory levels and contribute to higher DIO.
There are a few common hold codes used on orders described in section 4.7.1 Inventory Stops
and Order Holds. The quantitative analysis pointed out two hold codes as significant in terms
of why excess inventories are created. These are credit holds codes and free for other
customers hold codes, which will be analyzed in more detail below.
Credit Hold Codes
As described in the empirical framework credit hold codes are used for customers using open
account as payment method when credit limits have been reached. A credit hold code is
activated manually by a credit manager when he or she notices that the customer might have
difficulties with paying for the engines. The credit hold code thus stops the engines from
being shipped and invoiced, which prolongs the DIO days but safeguards against longer DSO
days. It should be noted that the credit manager is measured upon DSO and overdue payments
and thus have little incentives to decrease DIO days. Petrie (2008) highlights the risk of sub-
optimization of processes when employees are focused on the result of the activities they
carry out within their function, instead of the result of the process as a whole. A parallel could
be drawn to the actions of the credit manager. However, releasing a credit hold code just to
decrease DIO would be risky since the customer might not pay for the engines that are
shipped at all. Also, Region International do not use credit holds for finished engines on
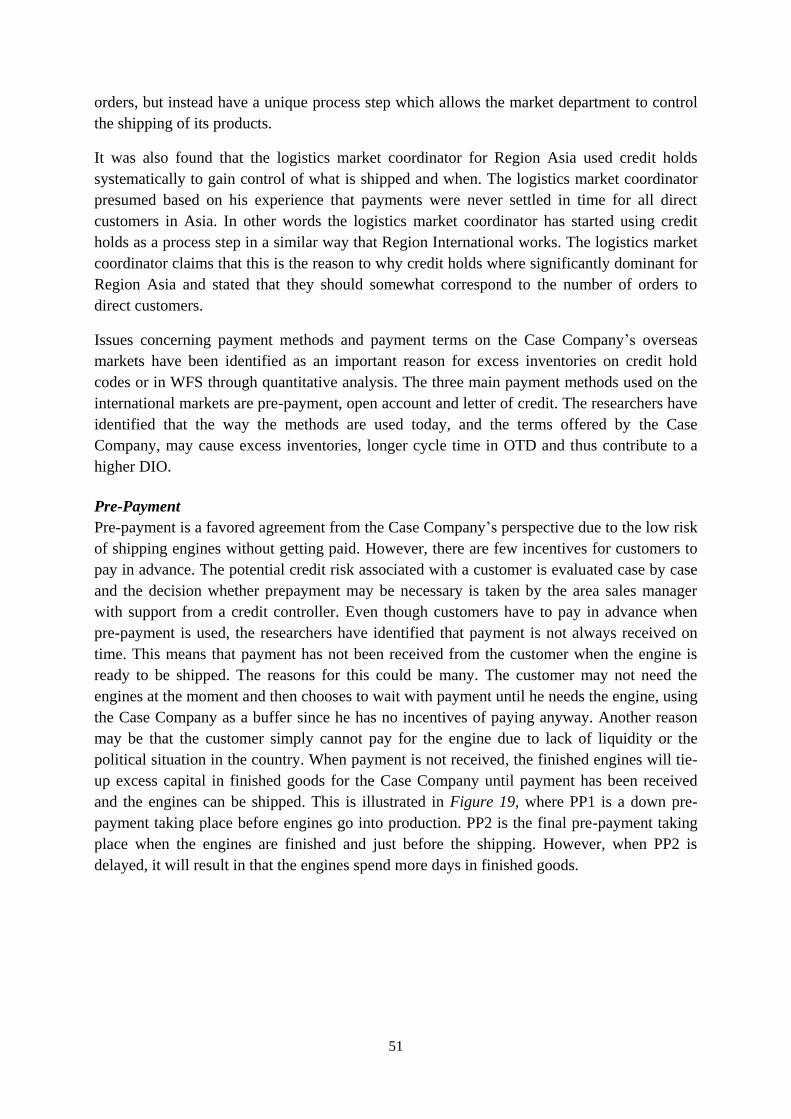
51
orders, but instead have a unique process step which allows the market department to control
the shipping of its products.
It was also found that the logistics market coordinator for Region Asia used credit holds
systematically to gain control of what is shipped and when. The logistics market coordinator
presumed based on his experience that payments were never settled in time for all direct
customers in Asia. In other words the logistics market coordinator has started using credit
holds as a process step in a similar way that Region International works. The logistics market
coordinator claims that this is the reason to why credit holds where significantly dominant for
Region Asia and stated that they should somewhat correspond to the number of orders to
direct customers.
Issues concerning payment methods and payment terms on the Case Company’s overseas
markets have been identified as an important reason for excess inventories on credit hold
codes or in WFS through quantitative analysis. The three main payment methods used on the
international markets are pre-payment, open account and letter of credit. The researchers have
identified that the way the methods are used today, and the terms offered by the Case
Company, may cause excess inventories, longer cycle time in OTD and thus contribute to a
higher DIO.
Pre-Payment
Pre-payment is a favored agreement from the Case Company’s perspective due to the low risk
of shipping engines without getting paid. However, there are few incentives for customers to
pay in advance. The potential credit risk associated with a customer is evaluated case by case
and the decision whether prepayment may be necessary is taken by the area sales manager
with support from a credit controller. Even though customers have to pay in advance when
pre-payment is used, the researchers have identified that payment is not always received on
time. This means that payment has not been received from the customer when the engine is
ready to be shipped. The reasons for this could be many. The customer may not need the
engines at the moment and then chooses to wait with payment until he needs the engine, using
the Case Company as a buffer since he has no incentives of paying anyway. Another reason
may be that the customer simply cannot pay for the engine due to lack of liquidity or the
political situation in the country. When payment is not received, the finished engines will tie-
up excess capital in finished goods for the Case Company until payment has been received
and the engines can be shipped. This is illustrated in Figure 19, where PP1 is a down pre-
payment taking place before engines go into production. PP2 is the final pre-payment taking
place when the engines are finished and just before the shipping. However, when PP2 is
delayed, it will result in that the engines spend more days in finished goods.
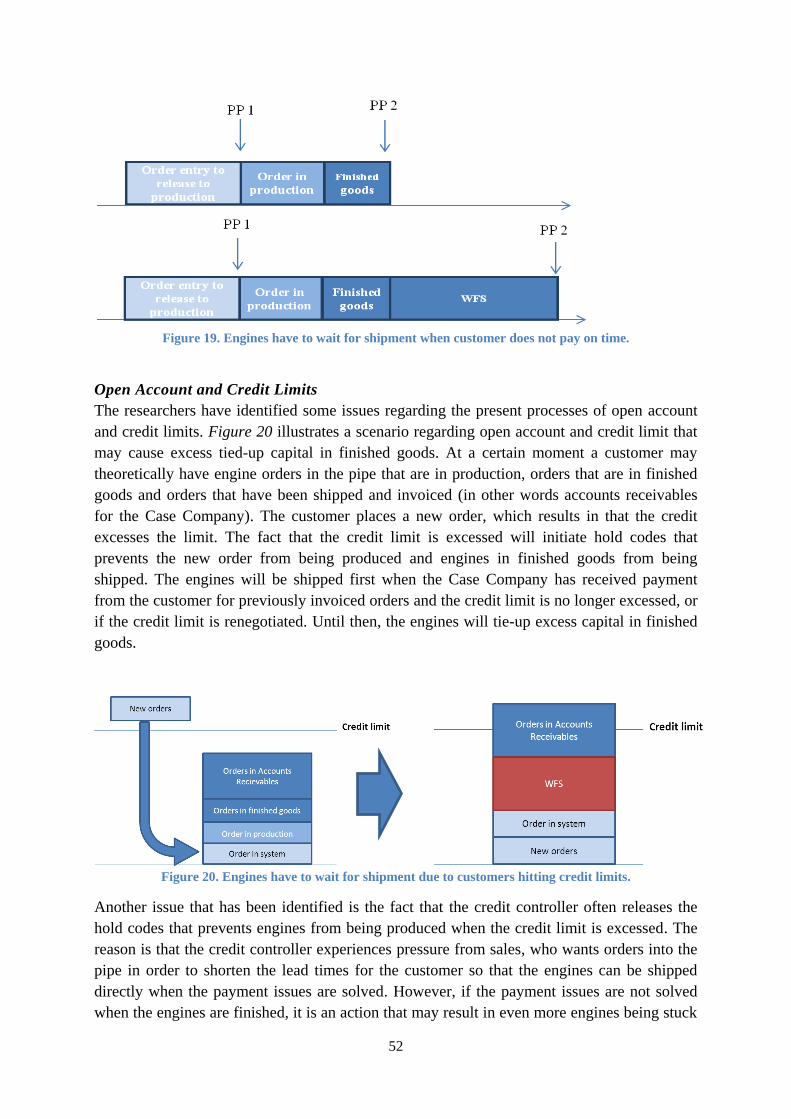
52
Figure 19. Engines have to wait for shipment when customer does not pay on time.
Open Account and Credit Limits
The researchers have identified some issues regarding the present processes of open account
and credit limits. Figure 20 illustrates a scenario regarding open account and credit limit that
may cause excess tied-up capital in finished goods. At a certain moment a customer may
theoretically have engine orders in the pipe that are in production, orders that are in finished
goods and orders that have been shipped and invoiced (in other words accounts receivables
for the Case Company). The customer places a new order, which results in that the credit
excesses the limit. The fact that the credit limit is excessed will initiate hold codes that
prevents the new order from being produced and engines in finished goods from being
shipped. The engines will be shipped first when the Case Company has received payment
from the customer for previously invoiced orders and the credit limit is no longer excessed, or
if the credit limit is renegotiated. Until then, the engines will tie-up excess capital in finished
goods.
Figure 20. Engines have to wait for shipment due to customers hitting credit limits.
Another issue that has been identified is the fact that the credit controller often releases the
hold codes that prevents engines from being produced when the credit limit is excessed. The
reason is that the credit controller experiences pressure from sales, who wants orders into the
pipe in order to shorten the lead times for the customer so that the engines can be shipped
directly when the payment issues are solved. However, if the payment issues are not solved
when the engines are finished, it is an action that may result in even more engines being stuck
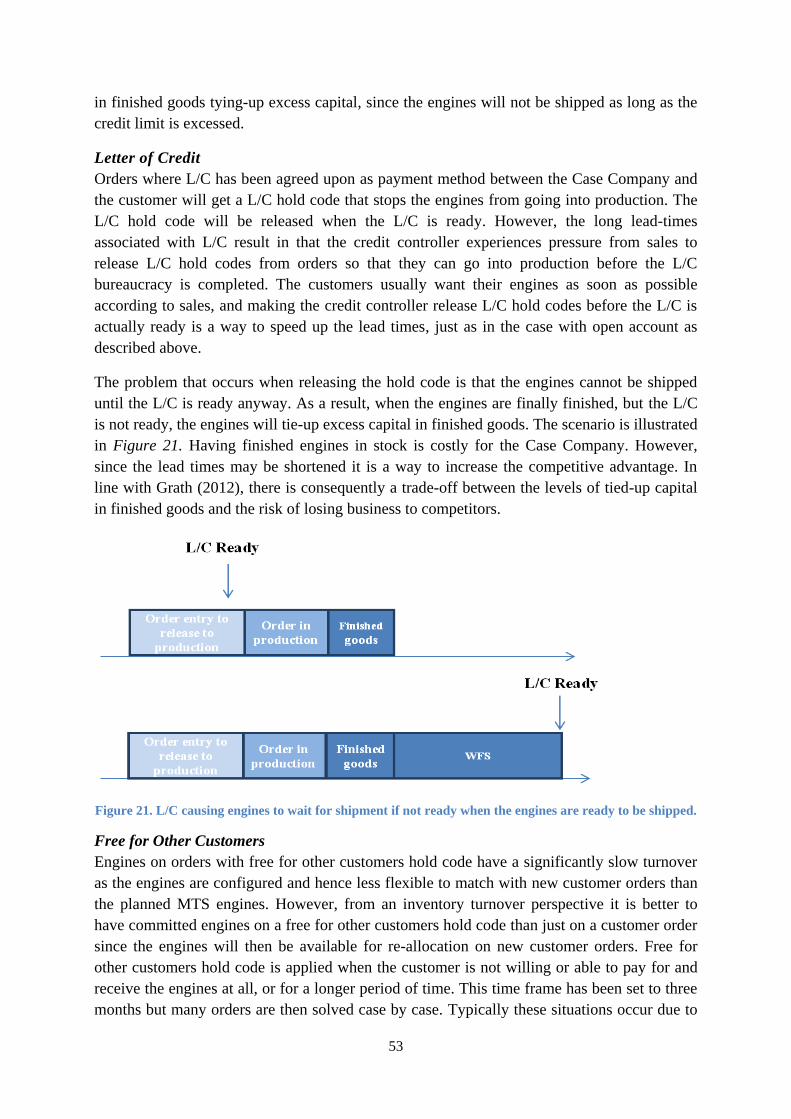
53
in finished goods tying-up excess capital, since the engines will not be shipped as long as the
credit limit is excessed.
Letter of Credit
Orders where L/C has been agreed upon as payment method between the Case Company and
the customer will get a L/C hold code that stops the engines from going into production. The
L/C hold code will be released when the L/C is ready. However, the long lead-times
associated with L/C result in that the credit controller experiences pressure from sales to
release L/C hold codes from orders so that they can go into production before the L/C
bureaucracy is completed. The customers usually want their engines as soon as possible
according to sales, and making the credit controller release L/C hold codes before the L/C is
actually ready is a way to speed up the lead times, just as in the case with open account as
described above.
The problem that occurs when releasing the hold code is that the engines cannot be shipped
until the L/C is ready anyway. As a result, when the engines are finally finished, but the L/C
is not ready, the engines will tie-up excess capital in finished goods. The scenario is illustrated
in Figure 21. Having finished engines in stock is costly for the Case Company. However,
since the lead times may be shortened it is a way to increase the competitive advantage. In
line with Grath (2012), there is consequently a trade-off between the levels of tied-up capital
in finished goods and the risk of losing business to competitors.
Figure 21. L/C causing engines to wait for shipment if not ready when the engines are ready to be shipped.
Free for Other Customers
Engines on orders with free for other customers hold code have a significantly slow turnover
as the engines are configured and hence less flexible to match with new customer orders than
the planned MTS engines. However, from an inventory turnover perspective it is better to
have committed engines on a free for other customers hold code than just on a customer order
since the engines will then be available for re-allocation on new customer orders. Free for
other customers hold code is applied when the customer is not willing or able to pay for and
receive the engines at all, or for a longer period of time. This time frame has been set to three
months but many orders are then solved case by case. Typically these situations occur due to
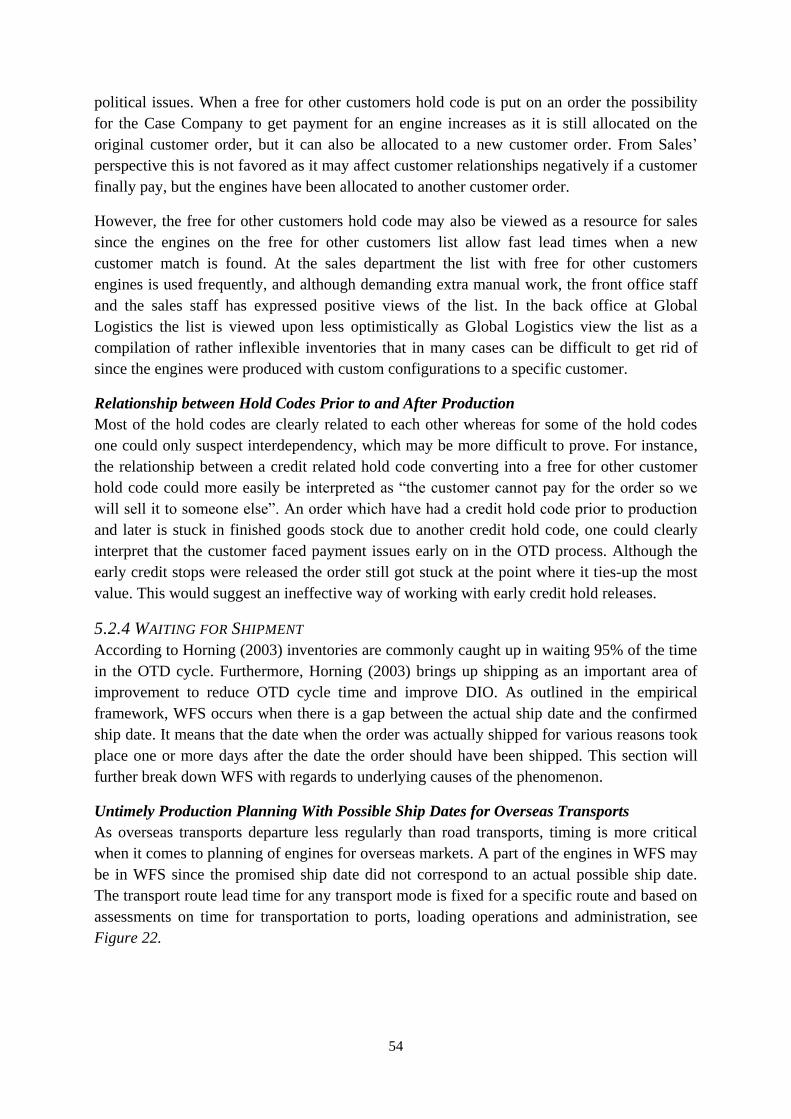
54
political issues. When a free for other customers hold code is put on an order the possibility
for the Case Company to get payment for an engine increases as it is still allocated on the
original customer order, but it can also be allocated to a new customer order. From Sales’
perspective this is not favored as it may affect customer relationships negatively if a customer
finally pay, but the engines have been allocated to another customer order.
However, the free for other customers hold code may also be viewed as a resource for sales
since the engines on the free for other customers list allow fast lead times when a new
customer match is found. At the sales department the list with free for other customers
engines is used frequently, and although demanding extra manual work, the front office staff
and the sales staff has expressed positive views of the list. In the back office at Global
Logistics the list is viewed upon less optimistically as Global Logistics view the list as a
compilation of rather inflexible inventories that in many cases can be difficult to get rid of
since the engines were produced with custom configurations to a specific customer.
Relationship between Hold Codes Prior to and After Production
Most of the hold codes are clearly related to each other whereas for some of the hold codes
one could only suspect interdependency, which may be more difficult to prove. For instance,
the relationship between a credit related hold code converting into a free for other customer
hold code could more easily be interpreted as “the customer cannot pay for the order so we
will sell it to someone else”. An order which have had a credit hold code prior to production
and later is stuck in finished goods stock due to another credit hold code, one could clearly
interpret that the customer faced payment issues early on in the OTD process. Although the
early credit stops were released the order still got stuck at the point where it ties-up the most
value. This would suggest an ineffective way of working with early credit hold releases.
5.2.4 WAITING FOR SHIPMENT
According to Horning (2003) inventories are commonly caught up in waiting 95% of the time
in the OTD cycle. Furthermore, Horning (2003) brings up shipping as an important area of
improvement to reduce OTD cycle time and improve DIO. As outlined in the empirical
framework, WFS occurs when there is a gap between the actual ship date and the confirmed
ship date. It means that the date when the order was actually shipped for various reasons took
place one or more days after the date the order should have been shipped. This section will
further break down WFS with regards to underlying causes of the phenomenon.
Untimely Production Planning With Possible Ship Dates for Overseas Transports
As overseas transports departure less regularly than road transports, timing is more critical
when it comes to planning of engines for overseas markets. A part of the engines in WFS may
be in WFS since the promised ship date did not correspond to an actual possible ship date.
The transport route lead time for any transport mode is fixed for a specific route and based on
assessments on time for transportation to ports, loading operations and administration, see
Figure 22.
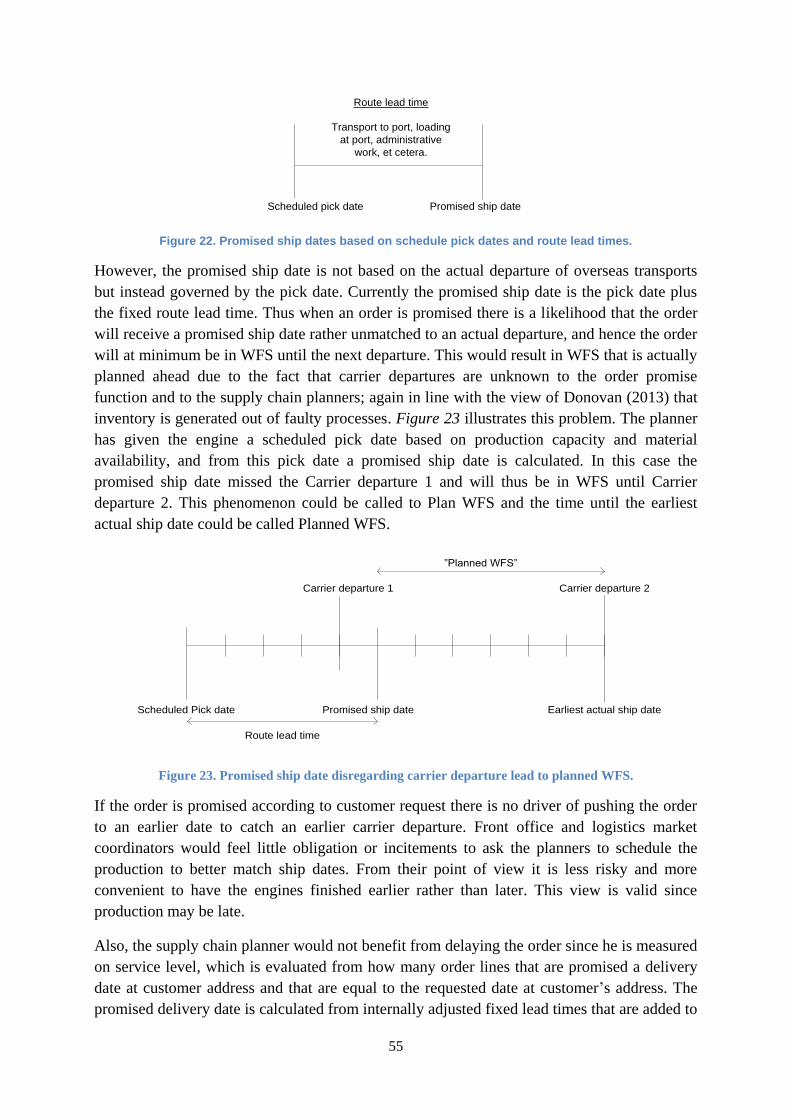
55
Scheduled pick date Promised ship date
Transport to port, loading
at port, administrative
work, et cetera.
Route lead time
Figure 22. Promised ship dates based on schedule pick dates and route lead times.
However, the promised ship date is not based on the actual departure of overseas transports
but instead governed by the pick date. Currently the promised ship date is the pick date plus
the fixed route lead time. Thus when an order is promised there is a likelihood that the order
will receive a promised ship date rather unmatched to an actual departure, and hence the order
will at minimum be in WFS until the next departure. This would result in WFS that is actually
planned ahead due to the fact that carrier departures are unknown to the order promise
function and to the supply chain planners; again in line with the view of Donovan (2013) that
inventory is generated out of faulty processes. Figure 23 illustrates this problem. The planner
has given the engine a scheduled pick date based on production capacity and material
availability, and from this pick date a promised ship date is calculated. In this case the
promised ship date missed the Carrier departure 1 and will thus be in WFS until Carrier
departure 2. This phenomenon could be called to Plan WFS and the time until the earliest
actual ship date could be called Planned WFS.
Scheduled Pick date Promised ship date
Carrier departure 1 Carrier departure 2
Earliest actual ship date
”Planned WFS”
Route lead time
Figure 23. Promised ship date disregarding carrier departure lead to planned WFS.
If the order is promised according to customer request there is no driver of pushing the order
to an earlier date to catch an earlier carrier departure. Front office and logistics market
coordinators would feel little obligation or incitements to ask the planners to schedule the
production to better match ship dates. From their point of view it is less risky and more
convenient to have the engines finished earlier rather than later. This view is valid since
production may be late.
Also, the supply chain planner would not benefit from delaying the order since he is measured
on service level, which is evaluated from how many order lines that are promised a delivery
date at customer address and that are equal to the requested date at customer’s address. The
promised delivery date is calculated from internally adjusted fixed lead times that are added to

56
the promised ship date. Thus, although the promised delivery date determines the service level
it is based on the assumption that the fixed transport lead time is correct and that the goods are
shipped on the promised ship date. Since the promised ship date was not determined by
possible carrier departures, delaying the order to better match an overseas transport could at
the present time imply a loss of service level.
On the other hand, the delivery precision will increase. Then again the delivery precision is
influenced by many other actors and the connection to the planner may not be as clear as for
service levels. Furthermore, Global Logistics has begun to remove any order in WFS from
their delivery precision measurements. Thus planned WFS will presently not affect the
delivery precision anyway. Hence, with the current set up and KPI’s there are limitations in
incitements to delay an order to better match it with a known carrier departure. Any solution
to this problem would have to counter sub-optimization as well as bad process timing.
From interviews with front office and area sales managers at Region International, planned
WFS due to bad timing of carrier departures could range from a few days to a few weeks of
WFS. Also, this deviation adds to the notion that information on order delivery from Global
Logistics is uncertain and hence it is difficult to be proactive due to this uncertainty. If
planners would have been measured on planned WFS he or she would request information on
carrier departures to plan production in a way that minimized this planned WFS. However,
planners could perceive it as unfair since there are also other factors that may generate WFS,
which the planner cannot prevent. In line with Donovan (2013) inventories are often created
by processes involving different functions.
Untimely Production Planning and Joint Shipping
A scenario described as rather common by both logistics market coordinators and supply
chain planners is when engines are in WFS since they are awaiting other engines or goods to
be loaded. The following analysis suggests that one cause for this occurrence could stem from
the differences in the concept of orders combined with lack of information exchange.
One issue that has to be highlighted in this context is the concept of orders, which is not as
straightforward as it might seem. When the salesman and the customer come to an agreement
of a specific quantity of items requested at a specific time this could be considered an order.
From the customer’s point of view, the Case Company has been informed to deliver the
products at a requested date. However, when entering the ERP system through Pro-Sales the
request is usually split up to several orders if the quantity is large. This is to enable production
planning to easier book orders into production. The quantities are also preferably set to match
a relevant unit load if possible, for example a container or semi-trailer.
An order of 40 engines would for instance be difficult to promise if the daily production
capacity is 15 engines. It will be difficult, but not impossible, as the planner may allow for
production flexibility, which in a way is similar to splitting the order. The benefit is that the
connection to the original order is kept. The drawbacks are increased tied-up capital since this
procedure would generate more tied-up capital in planned early. Also the administration costs
at Global Logistics will increase from letting the planners work with the utilization of
production flexibility of large orders.
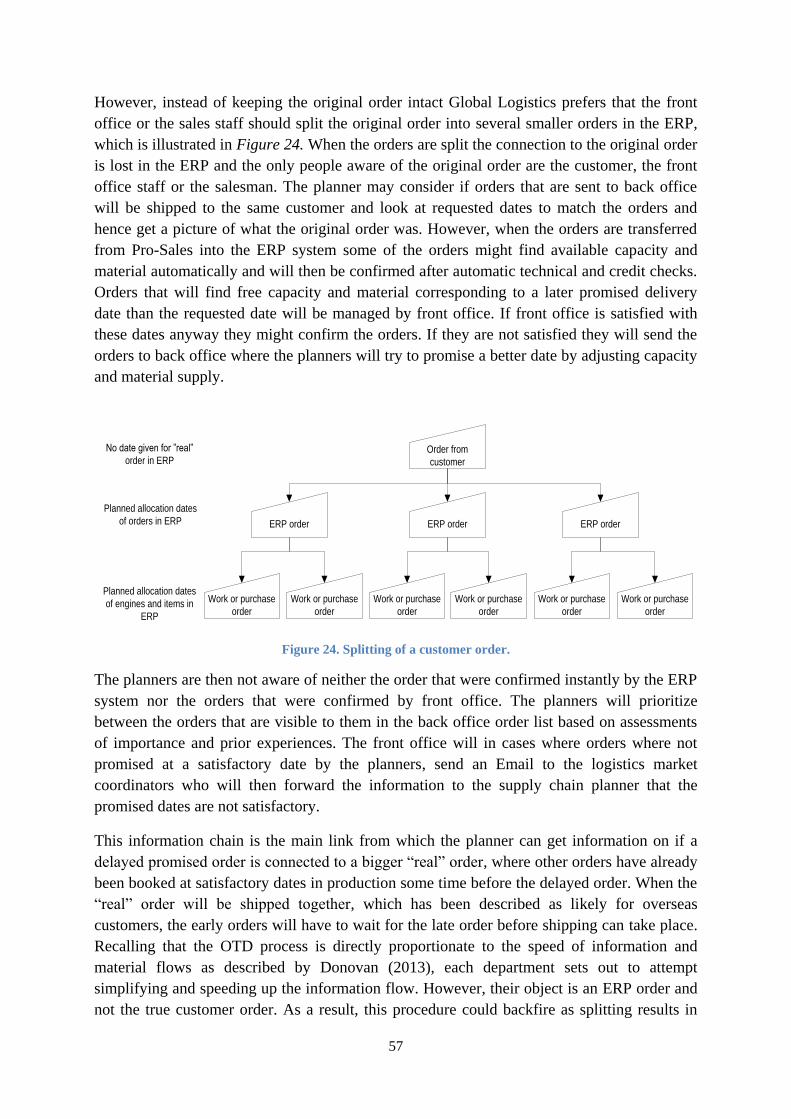
57
However, instead of keeping the original order intact Global Logistics prefers that the front
office or the sales staff should split the original order into several smaller orders in the ERP,
which is illustrated in Figure 24. When the orders are split the connection to the original order
is lost in the ERP and the only people aware of the original order are the customer, the front
office staff or the salesman. The planner may consider if orders that are sent to back office
will be shipped to the same customer and look at requested dates to match the orders and
hence get a picture of what the original order was. However, when the orders are transferred
from Pro-Sales into the ERP system some of the orders might find available capacity and
material automatically and will then be confirmed after automatic technical and credit checks.
Orders that will find free capacity and material corresponding to a later promised delivery
date than the requested date will be managed by front office. If front office is satisfied with
these dates anyway they might confirm the orders. If they are not satisfied they will send the
orders to back office where the planners will try to promise a better date by adjusting capacity
and material supply.
Order from
customer
ERP order ERP order ERP order
Work or purchase
order
Work or purchase
order
Work or purchase
order
Work or purchase
order
Work or purchase
order
Work or purchase
order
Planned allocation dates
of engines and items in
ERP
Planned allocation dates
of orders in ERP
No date given for ”real”
order in ERP
Figure 24. Splitting of a customer order.
The planners are then not aware of neither the order that were confirmed instantly by the ERP
system nor the orders that were confirmed by front office. The planners will prioritize
between the orders that are visible to them in the back office order list based on assessments
of importance and prior experiences. The front office will in cases where orders where not
promised at a satisfactory date by the planners, send an Email to the logistics market
coordinators who will then forward the information to the supply chain planner that the
promised dates are not satisfactory.
This information chain is the main link from which the planner can get information on if a
delayed promised order is connected to a bigger “real” order, where other orders have already
been booked at satisfactory dates in production some time before the delayed order. When the
“real” order will be shipped together, which has been described as likely for overseas
customers, the early orders will have to wait for the late order before shipping can take place.
Recalling that the OTD process is directly proportionate to the speed of information and
material flows as described by Donovan (2013), each department sets out to attempt
simplifying and speeding up the information flow. However, their object is an ERP order and
not the true customer order. As a result, this procedure could backfire as splitting results in

58
more orders that need processing which takes more time and also risk to generate longer times
in finished goods inventories.
One could conclude that WFS is created from splitting a “real” order that should be shipped
together into several orders in the ERP system as illustrated in Figure 25. This is a fact since
the people mainly booking the orders into production are not aware of the joint shipping
requirements. The order promising could be seen as a process that is cross functional since it
involves people from different departments. According to Donovan (2013) such processes are
often reasons to excess inventories. From a WFS point of view it is vital that the people at
front office, who may have information on joint shipping requirements, communicate this fact
to the planners.
Order 1 ready for shipment
Order 2 ready for shipment
Order 3 ready for shipment
Week 1 Week 2 Week 3 Week 4
WFS order 1
WFS order 2
Figure 25. A larger order has been divided into three orders in the ERP system, which are promised on
separate dates, thus generating WFS if joint shipping is requested.
The situation is moreover a bit more complicated since the front office might not always have
information on joint shipping. Furthermore, joint shipping may be a requirement that is only
valid if the engines are finished sufficiently near each other. In addition, decisions on joint
shipping could be taken after the orders have been booked into production and it is then more
difficult to avoid an increase of WFS by better production planning.
Political Issues
In line with Grath (2012), it has been shown how economic sanctions, trade policies and
political tensions such as war directly have affected the levels of tied-up capital at the Case
Company as orders are delayed or cannot even be shipped at all to the customer. As most
orders that are to be shipped overseas are MTO engines they are configured to fit the needs of
the specific customer. Consequently, if engines get stuck for a long time in WFS it may be
difficult to allocate them on other customer orders if the first customer for some reason cannot
receive the order.
Sudan, Algeria, Iran and Argentina are currently considered as risk countries as engines
allocated on orders to these countries risk being stuck in WFS for a significant length of time
or not even sold. The area sales managers are aware of the risks when trading with customers
in these countries and that the political situations and foundations for international trade
changes quickly. According to Madura (2010), there is always a trade-off between increased

59
sales and higher risk when engaging in international trade. Consequently, the Case Company
has to deal with a higher risk level in some countries in order to get business. It is therefore
necessary to develop increased cost awareness at Sales of holding finished goods inventories.
Since there is no inventory carrying cost factor applied for finished goods at the Case
Company today, there are less incentives to catch the seriousness of WFS and thus these costs
are not included when the risk assessment is done. The risks are hard to overcome, other than
being proactive and taking necessary precautions.
Payment Issues
Payment issues have been identified as a common cause for WFS from discussions with the
credit manager at Region International. How payment issues are related to WFS is the same as
to how they relate to orders on credit hold. The only difference is that orders in WFS due to
payment issues are not put on hold by the use of hold codes. Instead they get stuck in an order
status that is owned by Region International before the order is released to Global Logistics to
finalize transport booking and shipment.
Transport Booking
As stated in the empirical findings, customer orders going to Argentina depart by vessel from
Sweden every Thursday. Deadline for transportation bookings is on Wednesday the week
before departure. If the products are ready for transport booking on a Thursday, it means that
they just missed the deadline for transport booking of transportation the next week, and will
consequently not be shipped until Thursday in two weeks. As a result, the products will spend
two weeks including route lead time in finished goods inventory and tying-up capital, just
waiting to be shipped to its customer. The main reason for this is that the logistics market
coordinator can book transportation first when the engines are finished. If it would be possible
to book transportation earlier, before the engines are finished, the time in finished goods could
be reduced.
5.2.5 DELAYED INVOICING
The most common payment method is open account with credit limit. When the method is
used, the invoice should ideally be sent to the customer on the same date as when the order is
shipped. However, quantitative analysis showed that this is not always the case. For various
reasons the invoicing may be delayed. Until the invoice has been sent, the goods will be
accounted in finished goods inventories and thus contribute to a higher DIO. One of the
logistics market coordinators in charge of invoicing for Region Asia stated that due to other
critical issues that had to be dealt with more urgently, invoicing could be delayed from the
actual ship day of the goods.
5.2.6 Cancelled Engines
The cancelled order engine stock is a result of cancellations or returns of finished engines and
the stocks are thus not hold with the purpose of offering higher service levels, but an outcome
of unwanted events. The cancelled engine stock category is similar to the engines in “Free for
Other Customers” with the main difference that the cancelled engine stocks are not committed
to orders and thus not in the OTD process.
60
These engines are difficult to sell if they are custom configured and there lies a challenge in
matching their configurations with an open order if a pull principle is used. If a push principle
is used these engines would have to be offered to potential buyers and thus there is a need for
sales staff to identify buyers and generate competitive offers. If discounts need to be used
there is an issue if the salesman will earn less profit in selling these engines. However, if the
salesman would receive more profit from selling cancelled engines than MTS or first time
MTO engines it could be interpreted as creating incentives to increase cancelled order engine
stock.
5.2.7 PLANNED STOCK ENGINES
Planned engine stocks are always MTS. The purpose of these stocks is to keep high service
levels to customers. Planned engine stocks are located either close to related production site
and potential customers or only close to potential customers. Thus planned engine stocks
exists in distribution centers linked to external as well as internal wholly owned factories, but
also in distribution centers in countries where no production exists. Excess inventories in
planned engine stocks are rooted in external dimensions such as supply and demand
uncertainties, linked to forecasting accuracy. Forecasting has not been a focus of this study
but is significantly important and recommended for further research at the Case Company. Put
more specifically, inaccurate forecast of engines in terms of quantity and mix risk to yield
excess finished goods inventories. In addition, forecasting errors in accessories risk leaving
the company with the wrong quantity and mix of accessories. Since these are commonly sold
together with engines, missing accessories will prolong the time for engines in finished goods
as when entering the OTD process, the earliest date an order can be promised is when all
ordered goods are in stock.
5.2.8 UNPLANNED ENGINES
Engines produced by mistake or due to system errors do not need too much arguing for why
they cause excess inventory. This category has been proven difficult to distinguish in the
quantitative data collected, but evidence has been gathered from interviews, where
respondents have shared stories of a few incidents where cancellation of sales orders were
made but not their related work or purchase orders. A respondent from the Sales unveils that
she once forgot to cancel work orders of three engines that later were manufactured, as an
example. Many people explain that mistakes and errors were common during the
implementation of the new ERP system and that the causes were lack of understanding of the
system and the integration of the order levels. This understanding has improved by time, but
the chance of reoccurrence is present and can only be avoided through the knowledge and
awareness of the staff.
5.2.9 STOP CODE ENGINES
Products in the inventory can be stopped from becoming committed by the use of stop codes.
In these cases the Case Company has requested some additional actions to be performed
before the goods can be available to promise again or if it should be scrapped or donated to
charity instead. In this study the authors have not identified the amount of stop code goods,
but the category may aid the Case Company in future assessments of its inventory and
inventory turnover improvement opportunities.

61
5.2.10 FLEXIBLE PRODUCT MIX BUT INFLEXIBLE INVENTORIES
The MTO strategy with the usage of several modules on an engine has enabled great amount
of variants offered to customers. However, if engines are produced and due to some reasons
are not delivered to the original customer, the wide product variety can become a problem if
they end up in uncommitted engines or “free for other customers”. Since the ERP cannot
allocate custom configured or specially configured engines automatically from uncommitted
engines or “free for other customers” there is a need for a manual workaround. Thus, when a
new order comes in, someone must check manually if the engines on the order are available in
“free for other customers” or uncommitted engine stock. This is done by comparing Excel
lists of uncommitted engines and engines in “free for other customers”. This activity was not
described as a standard procedure due to the time consumption of the manual workaround.
However, front office staff at Region International stated that they compare their order books
now and then to match with “free for other customers”.
There have been attempts to automate these matching activities. This has been done by an
algorithm using all the module selections on an engine to create a unique ID for that selection.
This attempt failed and the tool was abandoned by Global Logistics. A primary reason was
that just the unique ID could not tell if an engine was related to another, thus an exact match
was needed. The problem is that modules that may differ are not only hardware on the engine.
Manuals, certificates, stickers and software are also included as module selection. Hence there
may be two exact engines with regards to hardware but one has an English manual and one
has a Chinese manual. The tool could not tell that these engines are related and with minimal
cost be interchangeable (just change manual in the package). With the current work
procedures and system support, the flexible manufacturing therefore generates inflexible
stocks. Of course the mass volume of the custom configured engines is constituted by a
relatively small number of unique configurations. Then on the other hand a massive amount
of unique configurations constitute a small volume and if these end up in uncommitted or
“free for other customers”, they may be less probable to match with new incoming orders.
Altogether, the inflexible stocks and the lack of efficient allocation when sourcing from these
stocks can lead to excess inventories. Forslund et al. (2009) highlight that improper use of
ERP systems were observed as a major hindrance to an efficient OTD process and this could
be seen as an example of this. The usage of modules that could have been loose items instead
makes sourcing of configured items from stock more difficult.
5.2.11 LACK OF INVENTORY CARRYING COSTS ESTIMATIONS
It was also found that the Case Company does not actually use any inventory carrying cost for
its finished goods inventory. Hence, costs associated with carrying finished goods inventories
are not linked to the finished goods. Lambert & La Londe (1976), Ellram et al. (1998), Bardin
et al. (2003), and Christopher (2011) all highlight the importance of appropriate use of
inventory carrying costs. The absence of estimating and communicating the inventory
carrying costs could be an explanation of high levels of excessive inventories at the Case
Company, since the cost of holding the inventory is not fully taken into consideration by the
actors performing the activities that may result in excess inventories.
62
5.3 HOW CAN EXCESS TIED-UP CAPITAL IN FINISHED GOODS INVENTORY BE
REDUCED WITHOUT REDUCING THE SERVICE LEVEL?
A large proportion of the Case Company’s orders are customer configured engines, in other
words MTO engines. The starting point is therefore that these engines should be shipped to
the customers directly when they are finished. Consequently, there should be no reason to
have these engines in finished goods inventory where they will tie-up excess capital and slow
down inventory turnover. In order to improve the inventory turnover of the Case Company’s
MTS engines, improved forecasting is a major topic. However, this is an area that is not
covered by the scope of the thesis.
5.3.1 HOW TO REDUCE ENGINES IN PLANNED EARLY
Excess tied-up capital caused by engines that fall under the planned early category could be
avoided, but at the expense of reduced service level or lower capacity utilization.
Management will have to weigh these factors against each other when reducing this category.
Measuring this category more thorough and state the extra inventory carrying costs may
provide management with a better ground for decision making.
5.3.2 HOW TO REDUCE ENGINES IN FINISHED EARLY
Engines that are finished early and cause excess tied-up capital in finished goods is a result of
inadequate delivery precision from the plants. However, improvement of the plants’ delivery
precision is not in the scope of this thesis. Nonetheless, it is important to highlight for the
plants the fact that engines finished early and allocated at a distribution center before the
planned allocation date will contribute to a higher DIO. What the Case Company could do is
to communicate the inventory carrying cost of excess inventories due to finished goods to
give the issue priority at supplying plants. This would require Global Logistics to measure this
category periodically. When engines are finished early, this should also be communicated to
the customer. If the customer wants the engines as soon as possible, then the engines can be
shipped earlier, making up for the early finish date. Hence, communication with the customer
could be a way of reducing excess tied-up capital in finished goods.
5.3.3 HOW TO REDUCE ENGINES ON HOLD
In this section it is analyzed how it is possible to reduce excess tied-up capital in finished
goods caused by credit holds and free for other customers hold code.
Credit Holds
Payment issues have been identified as an important reason for excess tied-up capital in
finished goods. As stated in the empirical framework, orders for Region International will be
in WFS, and orders for the other regions will be put on hold through a credit hold code until
the financial issues have been sorted out and the order can be shipped.
Regarding pre-payment, the researchers have identified that final payment is not always
received when the engines are finished and ready to be shipped. Grath (2012) highlights the
importance of being proactive concerning payments. A possible way of reducing the excess
capital tied-up in finished goods when prepayment is used is consequently to work more

63
proactively towards customers regarding communication and information. It may take several
days or even weeks before the Case Company has received payment from the customers and
the engines may be transport booked and finally shipped. It should be possible to proactively
inform and remind the customer well in advance that the engines will be finished at a certain
day so that the customer has arranged everything with the payment when the engines finally
are finished. It will then be possible to receive payment and book transportation closer to the
engines’ finish dates and consequently reduce excess tied-up capital in finished goods.
Another way to avoid excess capital being tied-up in finished goods due to late payments
from the customers is to simply require customers to pay for their ordered products before the
engines goes into production at the Case Company. The credit controllers and area sales
managers agree that this would be the optimized way of handling the pre-payment process.
However, the area sales managers, which in fact are the Case Company’s representative
towards the customers, say it would be difficult to make customers agree on paying for the
ordered engines before they go into production as the customers consider the lead-time from
payment until reception of the ordered engines as too long. Furthermore, Grath (2012)
emphasizes the risk of losing customers to competitors offering more convenient payment
terms. Consequently, a potential management decision at the Case Company, requiring
prepayment to be received before the engines go into production, needs to take this risk into
consideration. A potential incentive structure regarding pre-payment to make customers pay
on time or before engines go into production should be discussed and analyzed by
management at the Case Company as well, as it also could be a way to reduce tied-up capital.
Grath (2012) highlights that it is usually a firm’s internal processes that is the most effective
way to improve issues that may arise regarding payments, particularly when it comes to open
account with credit limits. As the activities around open account with credit limits are
organized at the Case Company today, the risk of sub-optimization in terms of inventory
turnover is obvious. It should not be possible for a customer to place an order that exceeds the
credit limit as it will cause a stop in the shipping of goods to the customer until payment has
been received. It does not only cause excess tied-up capital for the Case Company, but is also
inconvenient for the customer as the products will be delayed. Larsson & Ljungberg (2001)
stress the importance of information transparency between the actors in well-functioning
processes. Hence, when a customer is about to exceed the credit limit when an order is placed
it is necessary that the Case Company communicates this and its possible implications. The
main actors that will have to share information are the credit controller, the salesman and the
customer. The information needs to include that previously ordered goods will not be shipped
until the customer has paid off previous invoices or the credit terms are renegotiated.
L/C is a complex way of doing business. It costs money and cause excess tied-up capital when
the L/C is not ready when the engines are ready to be shipped. The easiest way of reducing
excess tied-up capital is of course to stop using L/C, or at least reduce the use of it. However,
from a risk and customer perspective this would be difficult. Andersen (1999) favors activities
to be performed in parallel instead of sequences. If the L/C is opened in parallel with the
64
production of the engines in a customer order, the OTD cycle time may be shortened. This is
also favored by sales. However, the L/C is not always ready when the engines are finished.
Consequently, the engines will tie-up excess capital in finished goods until the L/C is ready
and the engines can be shipped. In order to reduce excess tied-up capital in finished goods,
these activities should therefore take place sequentially rather than in parallel. When L/C is
used it is therefore important to make sure that all details regarding the L/C are ready before
the engines go into production so that the engines can be shipped directly when they are
finished. However, again it will imply a trade-off between lead times for the customer and the
cost for excess tied-up capital for the Case Company.
Free for Other Customers
The free for other customers hold code could be used as a tool for reducing excess tied-up
capital in finished goods. Currently, if three months have passed since the promised ship date
for a committed engine and the engine has still not been shipped for various reasons, it will
receive a free for other customers hold code. The possibility for the Case Company to get
payment for the engine then increases as it is still allocated on the original customer order, but
it can also be allocated to a new customer order. One way to reduce excess tied-up capital in
finished goods would therefore be if the free for other customer hold code were put on
engines within a shorter time period than three months after promised ship date. This is a
suggestion favored by the cost focused Global Logistics. However, in line with Bardi et al.
(2003), Sales is of another opinion and more concerned with how the customers may be
affected by such decision.
As identified previously in the analysis, there might be various reasons for why engines are
delayed and not shipped as promised. When putting a free for other customer hold code on a
customer order and the engine gets allocated to a new customer, the original customer will no
longer be able to claim the order. The original customer may be an important customer for the
Case Company, and depending on how the customer reacts, a situation that may hurt the
relationship to the customer has occurred. In addition, and even worse, there is always a risk
that the customer may turn to a competitor for future orders. Particularly if the original
customer plans to claim the order, but cannot for the moment due to for example political
issues or reached credit limits, and it gets a free for other customer hold code and is allocated
to a new customer order close to the promised ship date. Jüttner et al. (2005) argues that it is
important that logistics is involved in potential customer priority decisions. This could be
crucial when it comes to keeping good customer relationships. However, also in line with
Jüttner et al. (2005), the marketing function also needs to be more cost driven and reject sales
that are not profitable for the firm as a whole.
5.3.4 HOW TO REDUCE ENGINES IN WAITING FOR SHIPMENT
Several possible improvement areas have been found regarding WFS. The internal
communication and information flows at the Case Company needs to be improved in order to
reduce engines in WFS and the issues are described in more detail below.
65
Untimely Production Planning With Possible Ship Dates for Overseas Transports
Andersen (1999) stresses timing of activities in a business process as a way to reduce the
cycle time. Today there is no real connection between the promised ship date of an order and
the departure date of the vessel that will carry the goods. However, by better matching the
promised ship date with the actual departure of the vessels, the cycle time can be reduced and
consequently the finished goods inventory turnover will increase. This could be done by
improving the timing between the production planning and possible ship dates. The
production planning should therefore be based on actual carrier departures. The current
assumption at the Case Company, that a fixed route lead-time could be added to a scheduled
pick date in order to calculate a correct promised ship date is inaccurate, and the assumption
should be avoided. For road transports the flexibility of the transport mode allows this
assumption to pass without significant impact on excess inventories but it does not work out
for overseas transport.
Untimely Production Planning and Joint Shipping
Baptiste et al (2008), state that in order to reach an ideal outbound logistics system the
production planning function and transport planning should be perfectly integrated. To solve
the problem of WFS due to joint shipping, the production planning and the transport planning
must be better synchronized. The ERP system does not foretell the fact that some orders are
required to be shipped together, making it more difficult for production planners to consider
this issue when promising orders. In line with Petrie (2008), employees will have limited
insight in the processes of the organization as a whole. Taking joint shipping in consideration
it may be problematic when a customer orders a mix of engines types, since planners are
organized by engine types with limited insight on when other planners promise their orders.
Here the sales department could aid the production planning with coordination by sharing
information on joint shipping prior to order re-promise. If joint shipping requirements are not
clear after communicating with the customer, the sales department could be aided by looking
at orders with same request dates, same customer address and if the transport mode is sea
transport. They may then compare the dates that these orders have been promised and assess
potential days in WFS and submit this information to the planners involved in re-promising
the orders.
Political Issues
Various political issues have been identified to cause excess tied-up capital in finished goods.
Today’s globalized world is dynamic and the political situation in many countries changes
quickly. The sanctions against Iran enforced by the international community also affected the
Case Company in terms of excess tied-up capital. However, as stated by Grath (2012),
companies involved in international trade will have to accept a higher risk profile. It is
therefore difficult to reduce excess tied-up capital caused by political issues other than being
aware of what is going on in the world and paying attention to the development of the
political situation, laws and regulations in countries with a particular high risk profile.

66
Payment Issues
As described earlier in the analysis, there are no credit hold codes that stop orders in Region
International from being shipped. Instead, the orders have to go through an extra process step
in which potential credit issues are checked. Consequently, the improvements analyzed under
Credit Holds in section 5.3.3 How to Reduce Engines On Hold? are valid for engines in WFS
as well.
Transport Booking
It should be possible to work more proactively with the transport booking process by making
the information the logistics market coordinator needs to book transportation available earlier,
before the engines is finished. Andersen (1999) suggests that activities in a process should be
carried out in parallel, rather than serial. In other words, the transport booking should take
place when the engines are still in production. By doing that, at least theoretically, the engines
could be shipped as soon as they have gone through the pick, pack and ship process. As the
transport booking process look like today, there are two main obstacles for pro-active
transport booking. Information regarding the pack structure is received first when the engines
have been packed and payment must be secured. However, pro-active transport booking also
assumes a high delivery precision from the plants.
The pack structure seems to be the hardest obstacle to overcome as the engines needs to be
manually weighed and measured. Obviously, this can be done first when the engines are
completely finished and packed. However, it should be possible to use an IT-solution that
computes the weight of all components in a configured engine as well as its measures. Until
this is possible, it should at least be feasible to be proactive with transport booking for
standardized engines and ASE engines.
5.3.5 HOW TO REDUCE DELAYED INVOICING
According to Andersen (1999), interruptions of important activities in the processes should be
avoided to improve process performance. The empirical data available is insufficient to judge
whether the respondent should or should not delay invoicing since the logistics market
coordinator is responsible for other critical activities in the OTD such as transport booking,
communicating with front offices and production planners. However, the staff in charge of
invoicing could be aided in the prioritization of work by informing them on the benefits of
instant invoicing in terms of costs. In accordance with the definition of DIO and DSO, if swift
invoicing is prioritized so is DIO.
5.3.6 HOW TO REDUCE ENGINES IN UNCOMMITTED STOCKS
Engines that are uncommitted to customer order include cancelled engines, planned stock
engines, unplanned stock engines and stop code goods, as described in the framework
previously in the analysis. Earlier in the analysis an identified cause for excess inventories in
uncommitted engines was "inflexible stocks”, in terms of difficulties of allocating
uncommitted custom configured engines on new customer orders. This results in engines
possibly being left in uncommitted and new orders initiating production of new engines
instead of utilizing available engines in uncommitted stock. During discussions with
67
representatives from Product Planning and Global Logistics three alternatives have been
identified in order to simplify sourcing of custom configured engines from uncommitted
engines, but also from committed engines with a “free for other customers” hold code.
1.) Reducing product variety. Customers that are more risky and perceived more likely to
generate orders that in the end leave finished engines in “free for other customers” or
uncommitted, should only be able to order standard configured engines. In a proposition from
Global Logistics this would include all customers not located at the same continent as the
production facilities or customers with previous payment problems.
2.) Simplifying module structures. Module structure in the ERP could be simplified, moving
items such as manuals and certificates out of the configuration and just leaving hardware
elements that are non-interchangeable left.
3.) Improving search and allocation functionality. The search and matching processes
could be simplified by the use of improved matching tools.
The first alternative was not favored by the respondents at the Region International, which
have no plants on the same continents that they are covering, thus limiting their product
variety to customers to only use standardized configurations. The suggestion is an excellent
example of the conflicting objectives between sales and logistics described in the theoretical
framework, section 2.7.2 The Need for Common Goals in the Order to Delivery Process. The
suggestion is clearly focused on reducing costs of carrying excess inventories by
standardizing the product assortment and making finished engines more interchangeable
allowing a higher inventory turnover. However, decreasing the product assortment to allow
for higher inventory turnover is conflicting with the interest of Sales. The Sales department
states that a main competitive advantage of the company is not only the price but also its
product variety. The Sales department put forward that there are competitors that can produce
more standardized engines cheaper but cannot deliver the wide product variety that the Case
Company can. These statements are in line with Jüttner et al. (2005), stating that marketing
and sales must communicate customer opportunities, and on the other hand logistics must
communicate costs to build success for the company as a whole.
The third alternative is favorable over the second alternative since this could be done by
improving how the unique ID of a configuration is set and thus there is no need to change the
module structure that staff at all departments already have been acquainted with. By sorting
out critical and noncritical elements in a database linked to the ERP a new unique ID could be
generated at a node level. At this level the only modules that are different from other unique
ID’s are the modules that are inexpensive to change, for example manuals.

68
6. DISCUSSION AND RECOMMENDATIONS This chapter discusses the analysis and highlights how it can contribute to improvements at
the Case Company. In addition, there is also a discussion about how the findings can
contribute to companies in general as well as to the academia.
6.1 HOW THE THESIS CONTRIBUTES TO THE CASE COMPANY
The framework developed in the analysis divides the Case Company’s finished goods
inventory into two main categories: committed and uncommitted. Furthermore, a number of
sub-categories that cause excess tied-up capital were identified and elaborated.
Lack of Information, Mutual Understanding and Transparency
Engines that are planned early is to a large extent caused by order splitting and earlier
manufacturing due to holidays in order to shorten the lead time from order to delivery for the
customer, but also to fill out gap in production capacity. Consequently, a reduction of excess
tied-up capital will most likely affect the customer negatively and the trade-off between lower
levels of tied-up capital and customer satisfaction needs to be taken in consideration for this
category. Excess tied-up capital due to engines that are finished early is a result of that the
production facilities for various reasons simply produce and allocate the engines earlier than
what was planned. A more adequate delivery precision from the plants is of course preferred
in order to avoid excess tied-up capital in finished goods. However, if engines are finished
early anyway, it is important to regularly communicate this to the customers. If it is ok for the
customers, then the engines that are finished early could also be shipped earlier and the excess
tied-up capital can be reduced.
Payment issues have also been identified as a cause of excess tied-up capital in the analysis. A
major problem seems to originate in how the Case Company’s own processes are designed
today. For example, when open account is used as payment method, it may automatically
cause excess tied-up capital in finished goods when customers place orders that exceed the set
credit limit. The Case Company must communicate this to the customer as well as the
possible implications. It should not be possible to place an order that will stop engines from
being shipped. Another issue is the fact that the credit controller experiences pressure from
sales to get orders into the pipe, even though they might get stuck in finished goods later on.
That is a result of sales primary customer focus and secondary cost focus that has been
experienced during the thesis. Hence, the more cost focused Global Logistics needs to
communicate the costs for carrying excess inventories more clear.
Along with the payment issues, the lack of appropriate integration between production
planning and transport planning has been identified as a reason that delays engines from being
shipped as promised, causing excess tied-up capital for the Case Company. It particularly
regards the Case Company’s overseas markets. The promised ship date needs to be better
matched with the actual departure of the vessels by improving the timing between the
production planning and possible ship dates. Consequently, the production planning should be
based on actual carrier departures, which is not the fact today. The departure dates therefore

69
need to be communicated to the planners so that they can take it into consideration when
planning. During the writing of the thesis, the researchers found that the work was
progressing and the development of a calendar with possible ship dates that should be used by
the planners was about to be implemented. It would have been interesting to measure the
possible effects on inventory turnover; however, the implementation was rolled out during the
final stage of the thesis and there was no time to do so. Anyway, it is a step in the right
direction for speeding up inventory turnover. Similarly, as described in the analysis,
communication needs to be improved when it comes to production planning and joint
shipping as well.
Obviously, an underlying problem causing excess tied-up capital in finished goods seems to
be lack of appropriate information flows and transparency between different functions and
departments. A problem must be attacked from its roots. Consequently, in order to improve
the processes causing excess tied-up capital as identified in the analysis, the first thing that
must be improved is the communication and transparency within the Case Company as well
as between the Case Company and its customers. In addition to this, the conflicting objectives
between sales and logistics have been apparent during the writing of the thesis. Logistics is
very focused on keeping the costs for logistics and inventory down but sometimes lack a
customer focus. This could be illustrated by logistics wish to strive for more standardization
in terms of product mix, as well as putting a free for other customers hold code within a
shorter time period on engines in finished goods where promised ship date has been passed.
The sales, on the other hand, would reject such decisions, as their main focus is customer
satisfaction rather than lowering the costs. Of course, both keeping the costs down and
keeping customer satisfaction high are essential factors for a successful and competitive
company. Hence, in order to make changes that gain the company as a whole, logistics and
sales need to achieve better understanding of each other’s operations and objectives.
The researchers would therefore like to suggest the creation of a cross-functional management
team, involving relevant actors from both logistics and sales that are part of the OTD process.
With regard to the inventory carrying costs illustrated in Figure 16. The inventory carrying
cost (ICC) for the categories in committed to order., it is appropriate to start with the business
regions where the costs for inventory are highest, in other words Region International and
Region Asia. The cross functional team could in the first place serve as a forum for discussion
and information sharing in order to create mutual understanding and increase the transparency
between logistics and sales and across the OTD process. It is important that the people
actually working in the processes that cause excess tied-up capital attend the meetings.
Consequently, possible attendees could be area sales managers, front office, credit controllers,
logistics market coordinators and supply chain planners. The team should meet on a regular
basis and have a fixed agenda in order to get the most out of each meeting. It is important that
the members of the team take an active role in the meetings in order to share their ideas as
well as learning from others. In a more long-term perspective the cross-functional team could
also serve as a decision forum in order to make decisions that gain the company as a whole
instead of just individual functions, with the risk of sub-optimization.
70
Communication and Feedback on Inventory Carrying Costs to Involved Actors
As has been shown there are several different functions that are involved in the OTD process.
In these functions there are roles such as the credit controller and sales staff at Sales and
logistics market coordinators and supply chain planners at Global Logistics. These roles
actively take decisions and perform activities that influence the output of the overall process.
In this thesis the main focus has been on finished goods inventory and thus the length of the
OTD process cycle have been focal, and more specifically when products are finished until
they are invoiced. Here it was shown that the length may be determined by actions taken
earlier in the OTD process.
An excellent example has been one explanation to why orders get stuck in WFS and hold
codes; payments are not settled before production. This is a complex issue where it is not easy
to blame one role or one function for generating the problems. Nonetheless, the issue affects
the cash flow of the Case Company negatively. A solution could be to provide the involved
roles with information on the cost or conversely the savings potential that there lies within
solving the issue. Thus there is a need to create a process and tools to communicate these
costs to the involved parties. Inventory carrying cost due to WFS and hold codes should be
communicated to front office, sales staff and credit controller at Sales, but also to logistics
market coordinators and supply chain planners at Global Logistics. The data needs to be
filtered to match the receiver. An area sales manager should be able to see the costs related to
his or her markets and relate to the orders. If such feedback is provided it may grow new
seeds of continuous improvements regarding cash flows and “ownership” of the costs. For
instance, the information could aid Sales when assessing risks for particular customers.
A bold suggestion would be to allocate inventory carrying costs on the engines in WFS or On
Hold for the time that they have been tying-up excess capital. This additional cost would not
initially be added to the price but only to the cost, resulting in smaller margins. To consider
implementation of such a suggestion deeper understanding of the current processes, the
inventory carrying cost and consent from Sales is required. The result would connect costs to
where they are generated. Here the capital cost and the opportunity cost components of the
inventory carrying costs may be difficult to include. This alternative would imply a larger IT
investment as well as change management in relation to follow ups through measurements
and cross functional meetings. Measurements and cross functional cooperation could also be
considered a prerequisite to implement such a change. However, in its ideal state this
alternative would grant greater cost visibility at a faster pace within the OTD process.
More Efficient Sourcing of Configured Engines
The way engines are sourced from stock today, the ERP can only deal efficiently with non-
configured products or standard configured products or ASE’s. Matching tools have been
developed but not utilized as they lack a process for who should use them and when.
Moreover, the capability of the matching tool was limited since it could only give suggestions
for perfect matches, in other words completely identical configurations. For many of the
configured engines, only a few unique configurations are ever produced. The current sourcing
process from customer configured engines leaves room for the risk of producing engines that
71
the Case Company already has in stock, as well as increasing the risk of obsolescence. A
better tool would check for similar engines that can be reconfigured without significant costs
and give the Case Company the option to source from these engines to supply current orders.
The configured ID could be developed and used for sourcing instead of item number for
configured products. This could aid the Case Company in decreasing excess inventories and
improve cash flows.
6.2 HOW THE THESIS CONTRIBUTES TO FIRMS IN GENERAL
Although the framework in the analysis is constructed based on the specific setting at the Case
Company, it can be used for inspiring other companies in viewing their finished goods
differently in order to better track causes of the inventories. Such frameworks may build on
the framework delivered in this thesis but may also be adjusted to match the specific
companies’ organizational environments and processes. The notion of dividing finished goods
into committed and uncommitted may aid companies that struggle with longer OTD process
cycles. For these firms the inventory level and product mix in uncommitted inventories are
not sufficient to describe causes for high overall finished goods inventory levels, since a lot of
goods will be on orders. Long OTD process cycles will have impact on inventory turnover
and thus firms need to understand where excess inventories are created in the OTD process.
This thesis highlights a few areas that could be generalized and used by other firms. An
example of an adjustment could be the judgment of delayed invoicing, in other words
determining the logic of when an invoice is delayed or not.
Furthermore, the analysis suggests that the way the order scheduling application in the Case
Company’s ERP system has been configured result in built-in excess inventories in the OTD
process. This learning could advise other firms to investigate any built in excess inventories
due to their order scheduling. The findings also show that the creation of excess inventories
can be caused by sub optimization of credit controlling and sales staff. Concluding that firms
need to better integrate sales and credit management to allow for a reduction of OTD cycle
time and excess inventories. The thesis also lifts the challenge of offering a great product
variety by describing the complications of allocating such products to new orders if these
products were not delivered to the original customer. The notion of simplifying allocation of
customized products from stock by the use of improved matching tools may prove an
important benefit for companies working with mass customization in order to improve their
inventory turnover. The thesis also highlight the importance for other firms to address the cost
of carrying inventory and communicate these costs to the employees influencing the creation
of excess inventories in finished goods. Firms should strive to give feedback on the actions of
its employees in order to create an environment for improvements. This thesis highlight in
particular the feedback for employees in cross functional processes where the output of the
process is influenced daily by many people that do not have any regular communication with
each other. For instance, at the Case Company the salesman encourages the credit controller
to release credit holds with the result of excess inventories noted by Global Logistics. Thus
the salesman should receive feedback on the results to allow for reflections on actions to
avoid the negative outcome.
72
6.3 HOW THE THESIS CONTRIBUTES TO THE ACADEMIA
In order to reach the purpose of the thesis it was necessary to understand where excess capital
is tied-up in finished goods. An extensive research of theory was therefore conducted during
the thesis work in order to find state-of the art research on the subject. However, most
research papers that were found on finished goods inventories treated the subject on a generic
level and lacked theoretical relevance enabling deeper analysis of why they actually occur.
Particularly for finished goods inventories in products related to MTO. The framework
developed in the thesis could therefore be a good starting point and provide support when
analyzing causes for excess tied-up capital in manufacturing companies. Another benefit with
the framework is the connection between the inventory categories and CCC, which is a main
KPI on how well a firm performs regarding cash flows.
Although the categorization of finished goods inventory is adapted to the Case Company’s
processes, the framework fill out some of the gaps that seems to be present in current
literature. However, the framework could be subject for further development and research.
Inventories in raw material and work in progress could be further elaborated and categorized.
Furthermore, different departments and actors at the Case Company tend to optimize their
way of working in order to fulfill their own objective. However, for the company as a whole it
rather results in sub-optimization. It has also been found that the process timing could be
improved if different actors had better access to information, particularly when it comes to
planning. Overall, it is a result of conflicting KPI’s, lack of transparency and communication.
The result is excess inventory in finished goods. Hence, the analysis of the different
categories in the framework can confirm what literature states concerning the importance of
common goals, communication and transparency for efficient processes within an
organization.

73
7. CONCLUSIONS This chapter presents the conclusions that can be drawn from the analysis regarding the three
research questions that support the purpose of the thesis.
How should finished goods be categorized in order to describe important causes of excess
tied up capital?
Finished goods have been divided into two main categories where the first one is finished
goods in engines that are committed to an order and the second one is finished goods in
engines that are uncommitted to an order. Finished goods that are committed to an order
includes finished goods that are in the OTD (in other words allocated on a customer order)
and could be further divided into five sub-categories that causes tied up capital; engines that
are finished early due to planning, engines that are finished early by production, engines that
are on hold due to various reasons, engines that are in waiting for shipment and engines for
which the invoicing is delayed. Finished goods that are uncommitted to an order are not in the
OTD (in other words not allocated on a customer order) and include goods that are in stock
and can be divided in four sub-categories; engines that have been produced but then
cancelled, engines that were produced by mistake, planned make to stock engines and stop
code engines.
Why is excess capital tied up in finished goods inventory?
Excess tied-up capital in finished goods is strongly linked with how the business processes are
carried out at the Case Company. The lack of appropriate information sharing and
transparency along with conflicting KPI’s and prioritizations between various functions and
actors result in inefficient processes. The analysis show that different types of planning in the
OTD, activities regarding payments, transport booking and invoicing tend to contribute to an
extended OTD process cycle and hence excess tied-up capital. In addition, the fact that the
Case Company offers a flexible product mix, but lacks an efficient system for matching
configured uncommitted engines with new customer orders, slows down the inventory
turnover for uncommitted finished goods.
How can excess tied up capital in finished goods inventory be reduced without reducing the
service level?
To reduce excess tied-up capital in finished goods there is a need to change and improve the
identified root causes. Consequently it is necessary to create a more holistic view among
processes, functions and actors at the Case Company. It implies that objectives have to be
aligned in order to optimize the output for the company as a whole. In addition, process
timing and information sharing must be improved so that the right prioritizations can be done,
especially regarding production planning and transport planning, but also when it comes to
credit management that may slow down the inventory turnover. Furthermore, in order to
speed up the inventory turnover for uncommitted configured engines, the search and
allocation functionality needs to be improved to better match new customer orders.

74
8. FURTHER RESEARCH This section will bring forward further research suggestions based on observations during the
study. These areas are considered to have significant value from an inventory reduction and
control perspective but were not further investigated in the thesis. The answer to how to
reduce excess inventories for finished goods uncommitted to orders put forward in this thesis
was retroactive in nature. By improving search and allocation functions this category could be
reduced. However, an even more interesting approach is to investigate a more proactive
approach by studying the processes that create excess inventories in uncommitted finished
goods. In this thesis such areas were excluded as more emphasis was put into the finished
goods committed to orders. More specifically further research could be carried out in the
following areas with their connection to DIO and cash flows: forecasting for MTS products in
global supply chains, cancellation policies at firms with mass customization and MTO
production strategies, common reasons for stop codes and processes for releasing stopped
inventory, evaluate risks of errors and mistakes in order management and production
scheduling with multi-level orders in ERP. These areas are more or less known issues related
to the presented framework and may serve as an extended analysis to further develop it.
However, the researchers were able to identify closely related areas with potential academic
value. These areas are described in more detail below.
During the thesis it was found that DIO was requested as a measurement on less aggregate
levels with high accuracy. Several ways of calculating DIO were registered and the difference
between Global Logistics and the Finance Department was apparent. An interesting research
area would be to further investigate how DIO is measured and interpreted in other companies
and question whether there are correlation between more accurate calculations and improved
inventory governance. For instance, ideally average inventories should be calculated by taking
daily inventory levels and divide by 365 if the period is a year. A common notion is to use the
starting and ending inventory of a period and divide this by two but this method does not
consider variations within the period. How does the way DIO is calculated and communicated
affect inventory levels?
It was also found that the implementation of the ERP systems contributed to significantly
higher inventory levels. It would be an important academic contribution to further investigate
whether this pattern is common or not for other firms. Moreover, with companies changing to
new system support while at the same time growing into international markets it would be
valuable to investigate the effects of disconnected distribution centers with regards to overall
inventory levels.
75
BIBLIOGRAPHY Andersen B. (1999). Process Cycle Time Reduction – A Back-to-Basics Look at Removing
Bottlenecks. Quality Progress. Vol. 32, Iss. 7, p. 120.
Bardi E. J., Coyle J. J. & Langley Jr. C. J. (2003). The Management of Busines Logistics – A
Supply Chain Perspective. 7th
edition, Mason: South-Western Thomson Learning.
Baptiste P., Alsene E. & Gaudimier R. (2008). Integration of production and shipping
planning: A co-operative approach. Production planning and control. Vol. 19, Iss 7, pp. 645 –
654.
Bell E. & Bryman A. (2007). Business Research Methods. New York: Oxford University
Press.
Callioni, G., de Montgros, X., Slagmulder, R., van Wassenhove, L. N. & Wright, L. (2005).
Inventory- Driven Costs. Harvard Business Review. Vol. 83, Iss. 3, pp. 135-141.
Casey, G. (1997). Flatten the cash cycle with even-flow vendor payments. Professional
Builder. p. 30.
Chambers S., Johnston R. & Slack N. (2007). Operations Management. 5th
edition. Harlow:
Pearson Education.
Christopher M. (2011). Logistics and Supply Chain Management. 4th
edition, Harlow: Pearson
Education.
Crandall R. & Crandall W. (2003). Managing Excess Inventories: A Life-Cycle Approach.
Academy of Management Executive. Vol. 17, No. 3, pp. 99-113.
Donovan R. M. (2013). Lean Supply Chain Management and Inventory Optimization.
Available at <http://www.rmdonovan.com/inventory_management/> 2013-02-20.
Ellram L. M., Lambert D. M., Stock J. R. (1998). Fundamentals of Logistics Management.
International Edition, Singapore: McGraw-Hill.
Forslund H., Jonsson P. & Mattsson S. (2009). Order-to-delivery process performance in
delivery schedule environments. International Journal of Productivity and Performance
Management. Vol. 58 Iss. 1 pp. 41 – 53.
Gammelgaard B. & Larson P. (2002). The logistics triad: survey and case study results.
Transportation Journal. Vol. 41, No. 2/3, pp. 71-82.
Gillham B. (2010). Case Study Research Methods. London: Continuum International
Publishing.
Grath, A. (2012). The Handbook of International Trade and Finance: the Complete Guide to
Risk Management, International Payments and Currency Management, Bonds and
Guarantees, Credit Insurance and Trade Finance. 2nd
edition, London: Kogan Page.
76
Guerard J. B. Jr. & Schwartz E. (2007). Quantitative Corporate Finance. New York:
Springer.
Horning F. & McCann (2003). Cycle time reduction find out what’s slowing down the
process from order to delivery and speed things up. Pittsburgh Post Gazette, pp. 1-3.
Jonsson P. & Mattsson S. A. (2009). Manufacturing Planning and Control. Meidenhead:
McGraw-Hill.
Jose M., Lancaster C. & Stevens J. L. (1996). Corporate Returns and Cash Conversion
Cycles. Journal of Economics and Finance. Vol. 20, Iss: 1, pp. 33-47.
Jüttner U., Christopher M. & Baker S. (2005). Demand chain management - integrating
marketing and supply chain management. Industrial Marketing Management. 36, pp. 377-
392.
Kemper B. P. H. & de Mast J. (2009). Principles of Exploratory Data Analysis in Problem
Solving: What Can We Learn from a Well-Known Case? Quality Engineering. Iss: 21, pp.
366-375.
La Londe B. & Lambert D. (1977). A Methodology for Calculating Inventory Carrying Costs.
International Journal of Physical Distribution & Logistics Management. Vol. 7, Iss: 4, pp.
193-231.
Larsson, E. & Ljungberg, A (2001). Processbaserad Verksamhetsutveckling. Lund:
Studentlitterratur.
Lumsden K. (2011). Logistikens Grunder. 2nd
edition, Lund: Studentlitteratur AB.
Madura, J. (2010). International Financial Management. 10th
edition, Mason: South-
Western/Cengage Learning.
Persson J. & Davidsson P. (2005). Integrated Optimization and Multi-agent Technology for
Combined Production and Transportation Planning. 38th Hawaii International Conference
on System Sciences. pp. 1-8.
Petrie, A. (2008). Developing Products with a Holistic Process. Design Management Review.
Vol. 19, Iss. 3, pp. 68-90.
Stake R. E. (1995). The Art of Case Study Research. Thousand Oaks: Sage Publications.
Turnbull, L. (2008) Get it in, move it out. Canadian Transportation Logistics. Vol. 111, Iss. 5
p. 38.
Wallén G. (2008). Vetenskapsteori och forskningsmetodik. Lund: Studentlitteratur AB.
Yin R. K. (2009). Case Study Research - Design and Methods. 4th
edition, London: Sage
Publications.
77
LIST OF INTERVIEWEES Åkerström R., Business Controller, Finance
Andersson M., Credit Manager, Finance
Baldyga Y., Area Sales Manager, Region International
Claesson A., Logistics Market Coordinator, Global Logistics
Edström, M., Global Demand Manager, Global Logistics
Hadziosmanagic D., Credit Controller, Region International
Hamilton D., Area Sales Manager, Region International
Jerrelind A., Business Analyst, IT Department
Kirakosian H., Logistics Market Coordinator, Global Logistics
Konradsson A., Area Sales Manager, Region International
Lindström L. J., Logistics Developer, Global Logistics
Kjellman U. B., Front Office Area Manager, Region International
Ljungkrantz M., Manager Logistics Market Support, Global Logistics
Mattsson D., Manager of Supply Chain Planning Management, Global Logistics
Rise P., Product Cost Controller, Finance
Tan K., Process and Solution Manager, Global Logistics
Thörnbring M., Front Office Area Manager, Region International
Truong R., Logistics Market Coordinator, Global Logistics
Wallin C., Business Analyst, Global Logistics