Increasing life expectancy and rapid fertility decline … · Web viewPopulation Ageing and Labour...
49
Population Ageing and Labour Supply Prospects in China from 2005 to 2050 Xiujian Peng Australian Institute for Social Research The University of Adelaide [email protected] Abstract: Increasing life expectancy and rapid fertility decline since the 1970s have combined to create in China a very rapid rate of population ageing. These demographic developments are expected to result in an ageing workforce and a significant slow-down in the growth of the working age population. Since the participation rate of the elderly population is much lower than that of the prime-age labour force, ageing of the workforce will reduce the aggregate labour force participation rate (LFPR). These two factors, negative growth of the working age population and the declining aggregate LFPR, combine to put downward pressure on labour supply. The present paper examines the trend of the labour supply in China over the next 45 years under alternative fertility scenarios by taking account of the demographic composition effect and potential trends of the age-and sex-specific labour force participation rate. The main 1
Transcript of Increasing life expectancy and rapid fertility decline … · Web viewPopulation Ageing and Labour...

Population Ageing and Labour Supply Prospects in China
from 2005 to 2050
Xiujian PengAustralian Institute for Social Research
The University of [email protected]
Abstract:Increasing life expectancy and rapid fertility decline since the 1970s have combined
to create in China a very rapid rate of population ageing. These demographic
developments are expected to result in an ageing workforce and a significant slow-
down in the growth of the working age population. Since the participation rate of the
elderly population is much lower than that of the prime-age labour force, ageing of
the workforce will reduce the aggregate labour force participation rate (LFPR). These
two factors, negative growth of the working age population and the declining
aggregate LFPR, combine to put downward pressure on labour supply. The present
paper examines the trend of the labour supply in China over the next 45 years under
alternative fertility scenarios by taking account of the demographic composition effect
and potential trends of the age-and sex-specific labour force participation rate. The
main findings are that population ageing and the very likely decline in the labour
force participation rate of the young population (aged 15 to 24) will accelerate the
decline of labour supply from 2020 onwards. It follows that easing the current one-
child policy as early as possible may slow down the decline in labour supply by
increasing the base of the working age population and decelerating the rate of
population ageing.
1

1 Introduction Increasing life expectancy and rapid fertility decline since the 1970s have combined
to create in China a very rapid rate of population ageing. These demographic
developments are expected to result in an ageing workforce and a significant slow-
down in the growth of the working age population. According to the UN medium
variant of population projection, the size of the working age population will increase
only slightly in the next 10 years and begin to shrink soon after 2020. Furthermore,
since the participation rate of the elderly population is much lower than that of the
prime-age labour force, ageing of the workforce will reduce the aggregate labour
force participation rate (ALFPR). Negative growth of the working age population
combined with the declining aggregate LFPR will put downward pressure on labour
supply.
It is improbable that the demand for labour will fall to match declines in labour
supply (McDonald and Kippen 2001). In fact, there are sound reasons for believing
that labour demand will rise for the years to come (Tsay 2003). Hence, the contraction
of available labour has potentially important adverse implications for economic
growth in China (Peng 2005). Government officials and scholars in China are,
consequently, eager to identify suitable strategies to cope with the ageing problem. A
common suggestion from scholars is that liberalization of the strict population control
policy may help to decelerate the rate of population ageing, slow down the decrease in
the labour force and mitigate the adverse prognoses for macroeconomic growth.
However, any such liberalization will counteract the original object of China’s family
planning policy by increasing population growth. The potential conflict between
achieving a desirable demographic structure and a desirable population size poses a
dilemma for policy makers.
The present paper examines the future trend of labour supply in China over the period
2005 to 2050 under alternative fertility regimes. I will investigate the impact of
different age structures (demographic composition effects) on future labour supply
and the implications of changes in the current level of the labour force participation
rate. The present analysis ignores the effects of international migration.
2
Our study adopts an analytical approach similar to McDonald and Kippen in 2001 but
without considering international migration. However, unlike McDonald and Kippen,
we examine the impact of changes in the age structure on labour supply.
The paper is organized as follows: the next section places the present investigation in
the context of the ageing – growth nexus by briefly summarising major findings about
the adverse implications of ageing for macroeconomic performance. Section three
discusses the evolution of the working age population over the period 2005 to 2050
under alternative fertility scenarios. Section four explores the effects of population
ageing on the labour force participation rate and, therefore, on the labour supply.
Possible changes in the age- and sex-specific labour force participation rates are
investigated in section five and the final section presents conclusions and policy
implications.
2 Ageing and economic growth in China – evidence from CGE modelling
The impact of population ageing on economic growth is a matter of deep concern to
scholars and policymakers alike. A prominent link in the ageing – growth nexus is the
induced change in the labour supply. I have examined this link in an earlier study with
the help of the computable general equilibrium model (PRCGEM) to simulate the
macroeconomic consequences of population ageing in China during the 21st century
(Peng 2005). The qualitative result of this investigation is that with a constant fertility
rate (at 1.62) and a constant average labour force participation rate (at the 2000 level
of 82.35 per cent) in the baseline scenario, reduction in labour supply reduces the
growth rate of per capita real GDP by 2 percentage points annually during the 2020s,
by 2.6 and 3.0 percentage points p.a. during the 2030s and 2040s, respectively,
comparing with the growth rate of the first decade in the century.
If China’s TFR were to increase to 1.8 or to replacement level 2.1 at the beginning of
the century, then China’s labour supply would expand. Given the same rate of
productivity improvement, this expansion would help to mitigate the adverse effects
of population ageing on macroeconomic growth.1
1 It should be noted that an increase in economic growth may indeed be associated with a deterioration of per capita income because of the acceleration of the rate of growth of the total population induced by higher fertility regimes.
3

If, on the other hand, the TFR continued to decline to the very low level, such as 1.35,
then aggregate economic growth will fall even further. The reduction in the size of the
total population initially (during the first twenty years) serves to raise the growth of
per capita real income slightly above the baseline scenario population, however, from
the 2030s onwards even per capita real income drops below the baseline case because
the low TFR accelerates the rate of decline of the labour supply which, in turn, slows
down the process of capital formation.
Constancy of the ALFPR (at the 2000 level of 82.35 per cent) during the simulation
period is a highly restrictive assumption. It is highly implausible that China’s LFPR
will remain at such a high level throughout the 21st century. In the first instance,
ageing of the workforce will reduce the ALFPR because the participation rate of the
elderly population is much lower than that of the prime-age labour force. Secondly,
expansion of educational opportunities at young ages will remove large, and possibly
increasingly large, numbers of young people from the labour force and substantially
reduce their labour force participation rate. Thirdly, the development of a pension
system in China, especially in the rural areas, will weaken incentives to work for the
older age groups and, hence, it may reduce the participation rate of the elderly
population.
The exceedingly likely reduction in the labour force participation rate, combined with
negative growth of the working age population that is driven by low fertility, will put
further downward pressure on labour supply in China. Given the adverse implications
for the macro economy of changes in labour supply, it is important to understand the
demographic forces that shape labour supply. These involve prominently the labour
force participation rate, and its interaction with the ageing profile of the population.
This paper will focus on trend changes of labour supply in China over the period 2005
to 2050 under the assumption of alternative fertility regimes. I will explore the effects
of demographic shifts on the labour force participation rate as well as on
compositional changes, the age-and sex-labour force participation rate.
3 Alternative population scenarios and evolution of working age
population
4
The rapid population ageing and potential labour supply contraction beyond 2020 are
primarily the result of the dramatic decline in fertility rates during the 1970s and 80s
and the low fertility in the 1990s. Family planning policy has played an important role
in the rapid demographic shift (Hernandez, 1984; Kaufman, Zhang and Zhang, 1989,
Wang, Keng and Smyth, 2002). 2 Since its introduction at the beginning of the 1970s
there have been 300 million fewer births than would have occurred if the pre-existing
birth rate had been maintained (Wu, 1997).
The significant success of the family planning policy in reducing population growth
suggests that the Chinese government may be able to adjust the fertility rate by
relaxing the current one-child per couple restriction. The question whether to adjust
the current population policy, or how to adjust it, is a major issue for scholars and
policy makers.
3.1 The choice of population policy
So far there are mainly two views of the future direction of population policy in
China:
Negative population growth strategy. It has been argued that the large size of
China’s population has hampered her economic growth and development (Zhai,
2000, 2001; Wu, et al. 2004 and Li, X. P. 2002). Therefore, controlling
population growth should remain the main objective of population policy.
Secondly, the increase in the population size that would result from easing the
one-child policy will put high pressure on the labour market and on the
ecological environment, and restrain rapid economic growth. These
considerations suggest that the fertility rate should be maintained below the
replacement level in the long run. Government should implement a negative
population growth strategy in the medium to long run.
Advocates of a negative population growth strategy debate how far fertility
should be reduced. There are two main views:
2 The past thirty years have witnessed significant achievements in this area. China has achieved noticeable reductions in the birth rate, death rate and natural growth rate within a comparatively short period of time (Wang, Keng and Smyth, 2002). The crude birth rate of about 14.5 per thousand and population growth rate of 7.3 per thousand in 2000 are both less than half the comparable figures in the 1970s. The total fertility rate has dropped sharply from 4.01 in 1970 to 1.92 in 1990 and further to 1.8 in 2000, close to the average level of developed countries.
5

◊ Retention of the one-child policy. The notable success in reducing the
fertility rate has been accompanied by significant instances of unevenness
between rural and urban areas, and East and West China. This imbalance
implies that any relaxation of the one-child policy will cause a new baby
boom that is driven by the high fertility rates in many poor and backward
areas.
◊ Partial relaxation of the one-child policy. The second view maintains that
the total fertility rate should be stabilized in the long run at the average level
of the late 1990s, around 1.8. In order to achieve this target, the government
should partially adjust the restrictive one child policy regime at the beginning
of the 21st century.
Zero population growth strategy. Other scholars are concerned about the
consequences of low fertility and its potentially serious adverse effects on the
economy. They vigorously advocate that China should maintain a stable
population size in the long run. That is, policy should aim be raise the TFR from
its current level of 1.8 to the replacement level of 2.1 or 2.0 and maintain it there.
This would require replacement of the current one-child policy with a universal
two child per couple policy at the beginning of the 21st century (Li, J.X. 2002)
3.2 Fertility scenarios and the proportion of the elderly population
Based on the discussion of the population policy choices in China, I will choose four
fertility scenarios to roughly capture the effects of alternative population policy
strategies on the fertility rate, working age population and age structures.
Baseline scenario – constant fertility: I choose the constant fertility variant
prepared by UN Population Division to be the baseline scenario. In this scenario,
TFR is 1.7 between 2000 and 2005, and remains there until 2050.
Scenario 2 – low fertility variant: In this scenario, TFR decreases from 1.7
(2000 to 2005) to 1.49 (2005 to 2010), 1.41 (2010 to 2015) and further to 1.35
(2015 to 2020), and remains there until 2050. This fertility scenario is
approximately consistent with the one-child policy regime.
Scenario 3 – medium fertility variant: In this scenario, TFR increases from 1.7
(2000 to 2005) to 1.74 (2005 to 2010), 1.81 (2010 to 2015), and further to 1.84
(2015 to 2020) and remains there until 2050. This scenario may capture the
6
compromise solution mentioned above (partial adjustment to current one-child
policy).
Scenario 4 – High fertility variant: TFR in this scenario increases from 1.7
(2000-2005) to 1.9 (2005-2010), 1.95 (2010-2015), 2.0 (2015-2020), 2.05 (2020-
2025), and further to 2.08 (2025 to 2030) and remains there until 2050. This high
fertility scenario may capture the two-child policy in China.
The population projections corresponding to the first three fertility scenarios are
prepared by the UN Population Division in 2004. The last population projection is
prepared by Qiao and Chen (2003).
Tables 1, 2 and 3 report the profiles for the first half of the 21st century of total
population sizes, proportions of elderly population and working age population under
four fertility scenarios.
Total population size
The total population size differs significantly between the four scenarios, especially
after 2020. Under constant fertility (TFR remains at 1.7), total population peaks at
around 1420 million in 2025, declines subsequently to reach 1326 million in 2050. If
China’s TFR continues to decline and reaches 1.35 after 2015 (low fertility variant),
total population peaks at around 1368 millions in 2020, declines rapidly to 1171 in
2050. In contrast, under high fertility variant (TFR remains at 2.08), population
reaches a peak of 1502 million in 2045. The total population falls to 1498 million in
2050. The difference between the low variant and high variant population projections
amounts to 327 million in the middle of this century. In scenario 3 (medium variant),
population peaks at 1446 million in 2030. By 2050, the total population will be 1392
million. The gap of total population at the middle of this century between scenario 3
and scenario 2 is 221 million.
Table 1: China’s Population projection: total population size (million)
YearBaseline
(Constant fertility)Scenario 2
(Low variant)Scenario 3
(Medium variant)Scenario 4
(High variant)2000 1274 1274 1274 12742010 1353 1342 1355 13582020 1409 1368 1424 1436
7

2030 1419 1347 1446 14882040 1389 1278 1432 15022050 1326 1171 1392 1498
Source: UN (2004) and Qiao and Chen (2003)
The proportion of elderly population and population ageing
The extent and speed of ageing depend inter alia on the fertility level (Table 2). None
of the four population scenarios can exert any effect on the absolute size of the elderly
population -- defined as population aged 65 and above -- until people born in the first
decade of the 21st century reach age 65. From the perspective of economic growth,
however, the important consideration relates to the proportionate size of the elderly
population, not its absolute size. The proportion of the elderly in the total population
increases most rapidly in the low fertility scenario (scenario 2). It reaches 12.4, 17.5
and 28.1 per cent, respectively, in years 2020, 2030 and 2050. In the baseline scenario
(constant fertility) and scenario 3 (medium variant), the proportions of the elderly
rises to 24.8 and 23.6 per cent by 2050, while in scenario four (high variant), this
proportion will be only 18.4 per cent. The difference between scenarios 2 and 4 in
2050 will be 35 per cent. The differences in the proportion of the elderly population
under four fertility regimes denote a significant impact of fertility choice on future
population structure.
Table 2: Trends of the proportion of elderly in China (per cent)(Population aged 65 and over)
Year Baseline(Constant fertility)
Scenario 2(Low variant)
Scenario 3(Medium variant)
Scenario 4(High variant)
2000 6.8 6.8 6.8 6.82010 8.3 8.4 8.3 8.22020 12 12.4 11.9 10.72030 16.6 17.5 16.3 14.12040 23 25 22.3 18.22050 24.8 28.1 23.6 18.4
Source: UN (2004) and Qiao and Chen (2003)
3.3 Working age population
The four scenarios show the same growth rate of the working age population during
the first two decades because the change in the fertility level can only affect the size
of the working age population after some 15 to 20 years (Table 3). The working age
population will keep increasing to a peak of 1001 million around 2015 under the first
three scenarios. The absolute sizes of the working age population start to diverge after
2020. In scenario two, the working age population decreases at the fastest rate. It
8

declines to 720 million by 2050. Accordingly, a continued decline in China’s fertility
rate to very low levels will lead to a rapidly shrinking labour force in China, reducing
the current working age population by some 17 percent in 2050. However, if the
Chinese government can manage to increase the TFR to the replacement level, for
example by implementing a universal two-child policy (scenario 4), then the working
population will continue to increase and reach a peak around 2035 before declining
slightly to 940 million in 2050. This represents a working age population that is 76
million larger than in 2000. By maintaining the replacement level fertility, China can
prevent its working age population from declining during the first half of this century.
The difference in the total size of the working age population between the four
fertility scenarios becomes very significant by the middle of the century. For example,
the working age population will be 23 percent less in scenario 2 than in scenario 4
(220 million less working age population), and 15 per cent less in scenario 2 than in
scenario 3 (125 million less working age population). The large differentials in the
size of the working age population under the alternative fertility regimes after 2030
indicates the substantial impact of population policy adjustment on China’s future
labour supply.
Table 3: Trends of working age population in China (million)(Population aged 15 to 64)
Year Baseline(Constant fertility)
Scenario two(Low variant)
Scenario three(Medium variant)
Scenario four(High variant)
2000 871 871 871 8712010 978 978 978 9782020 992 992 992 9922030 959 934 966 9872040 870 814 891 9472050 810 720 845 940
Source: UN (2004) and Qiao and Chen (2003).
4 The demographic composition effect and labour supply Labour supply is the product of the size of the working age population in each age and
sex category and the age-and sex-specific labour force participation rates (McDonald
and Kippen 2001). Since changing age structures affect the age-specific labour force
participation rates, it changes the aggregate labour force participation rate (ALFPR)
(Dugan and Robidoux, 1999). We use a simple accounting framework to calculate the
trend of the ALFPR from 2000 to 2050 under alternative fertility scenarios.
9

(1)
(2)
Where is the ALFPR in year t, is the participation rate of cohort in year t,
and is the share of cohort in the total working age population aged 15 to 64, ,
in year t. We identify ten 5-year sex-specific cohorts ( =1, 2,…10) in the analysis.
Equation (1) shows that changes in the ALFPR reflect either changes in cohort (age-
specific) participation rates or changes in the composition of the working age
population for given cohort participation rates - the demographic composition effect.
Many social, economic and cultural factors influence the cohort participation rates. In
this section we will ignore such changes, leaving the discussion to the next section,
and only calculate the demographic composition effect.
The data from China’s fifth population census in 2000 show that the ALFPR was
82.35 per cent. Detailed cohort and sex specific participation rates in 2000 are shown
in Table 5. We estimate the trend of the ALFPR during 2010 to 2050 by assuming
that the cohort participation rates remain at their 2000 level. It is convenient to define
this effect with the following equation:
(3)
is the aggregate participation rate that would have been observed at time t if all
cohort participation rates remain at their 2000 levels. Table 5 presents the estimates of
aggregate labour force participation rates for the baseline scenario (constant fertility).
The evolution of the demographic age structure reduces the ALFPR from 82.35
percent in 2000 to approximately 78.8 per cent in 2050 if China’s TFR remains at 1.7.
The demographic composition effect from 2000 to 2050 is 3.6 percentage points. As a
result, the labour force in the baseline scenario will contract to 638 million (Table 7)
11 percent below its level in 2000.
Table 4 Detailed Demographic composition effect on labour force participation rate in China from 2000 to 2050
2000 2010 2020
10
Age
group PR*(Per cent)
(1)
Source population
weights(Per cent)
(2)
Contributionto aggregate participation
rate(Per cent)
(2)*(1)/100
Source population
weights(Per cent)
(3)
Contributionto aggregate participation
rate(Per cent)
(3)*(1)/100
Source population
weights(Per cent
(4))
Contributionto aggregate participation
rate(Per cent)
(4)*(1)/100 Men 15-19
49.1 5.94 2.92 5.49 2.70 4.44 2.18
Women 15-19
51.74 5.56 2.88 4.93 2.55 3.99 2.07
Men 20-24
90.23 5.07 4.58 6.25 5.64 4.98 4.50
Women 20-24
85.39 5.07 4.33 5.67 4.84 4.49 3.84
Men25-29
97.9 6.52 6.39 5.26 5.15 5.32 5.21
Women25-29
86.66 6.46 5.60 4.89 4.24 4.81 4.17
Men30-34
98.07 7.32 7.18 5.07 4.97 6.02 5.90
Women30-34
87.97 7.18 6.32 4.79 4.22 5.51 4.85
Men35-39
97.89 6.45 6.32 6.21 6.08 5.05 4.94
Women35-39
88.38 6.28 5.55 5.95 5.26 4.75 4.20
Men40-44
97.44 4.96 4.83 6.44 6.28 4.86 4.73
Women40-44
86.25 4.69 4.04 6.25 5.39 4.65 4.01
Men45-49
96.41 5.24 5.05 5.32 5.13 5.93 5.72
Women45-49
79.97 5.03 4.03 5.12 4.10 5.77 4.61
Men50-54
90.90 3.92 3.57 4.27 3.88 6.10 5.55
Women50-54
67.15 3.69 2.48 4.00 2.69 6.01 4.04
Men55-59
80.30 2.89 2.32 4.20 3.38 4.94 3.96
Women55-59
54.57 2.70 1.47 4.08 2.23 4.87 2.66
Men60-64
60.35 2.61 1.57 2.94 1.78 3.79 2.29
Women60-64
38.94 2.41 0.94 2.85 1.11 3.71 1.45
Mentotal
87.80 50.93 44.72 51.46 44.98 51.44 44.99
Womentotal
76.68 49.07 37.63 48.54 36.61 48.56 35.87
Total 82.35 100 82.35 100 81.59 100 80.86
*PA is participation rate.
Table 4 (continued): Detailed Demographic composition effect on labour force participation rate in China from 2000 to 2050
11

Age group 2030 2040 2050
Source population
weights(Per cent)
(6)
Contributionto aggregate participation
rate(Per cent)
(6)*(1)/100
Source population
weights(Per cent)
(7)
Contributionto aggregate participation
rate(Per cent)
(7)*(1)/100
Source population
weights(Per cent)
(8)
Contributionto aggregate participation
rate(Per cent)
(8)*(1)/100 Men 15-19 4.59 2.25 4.47 2.20 4.26 2.09
Women 15-19 4.14 2.14 4.05 2.09 3.86 2.00
Men 20-24 4.49 4.05 4.83 4.36 4.41 3.98
Women 20-24 4.05 3.46 4.37 3.73 4.00 3.41
Men25-29 4.53 4.43 4.99 4.88 4.74 4.64
Women25-29 4.09 3.54 4.52 3.92 4.31 3.73
Men30-34 5.04 4.95 4.86 4.77 5.11 5.01
Women30-34 4.58 4.03 4.41 3.88 4.64 4.09
Men35-39 5.36 5.24 4.88 4.78 5.27 5.16
Women35-39 4.89 4.32 4.44 3.92 4.80 4.24
Men40-44 6.04 5.89 5.42 5.28 5.12 4.99
Women40-44 5.60 4.83 4.97 4.29 4.67 4.03
Men45-49 5.05 4.87 5.74 5.54 5.13 4.94
Women45-49 4.82 3.85 5.30 4.24 4.70 3.76
Men50-54 4.83 4.39 6.44 5.85 5.66 5.15
Women50-54 4.70 3.16 6.05 4.06 5.24 3.52
Men55-59 5.79 4.65 5.30 4.25 5.91 4.74
Women55-59 5.76 3.15 5.15 2.81 5.54 3.02
Men60-64 5.75 3.47 4.89 2.95 6.43 3.88
Women60-64 5.89 2.29 4.93 1.92 6.22 2.42
Mentotal 51.47 44.20 51.82 44.86 52.04 44.58
Womentotal 48.53 34.78 48.18 34.86 47.96 34.21
Total 100 78.97 100. 79.71 100 78.79
Source: Data in column one is calculated by the author based on China’s fifth population census in 2000 and data in columns two to eight is based on United Nations population projection (constant fertility variant) (2004).
12

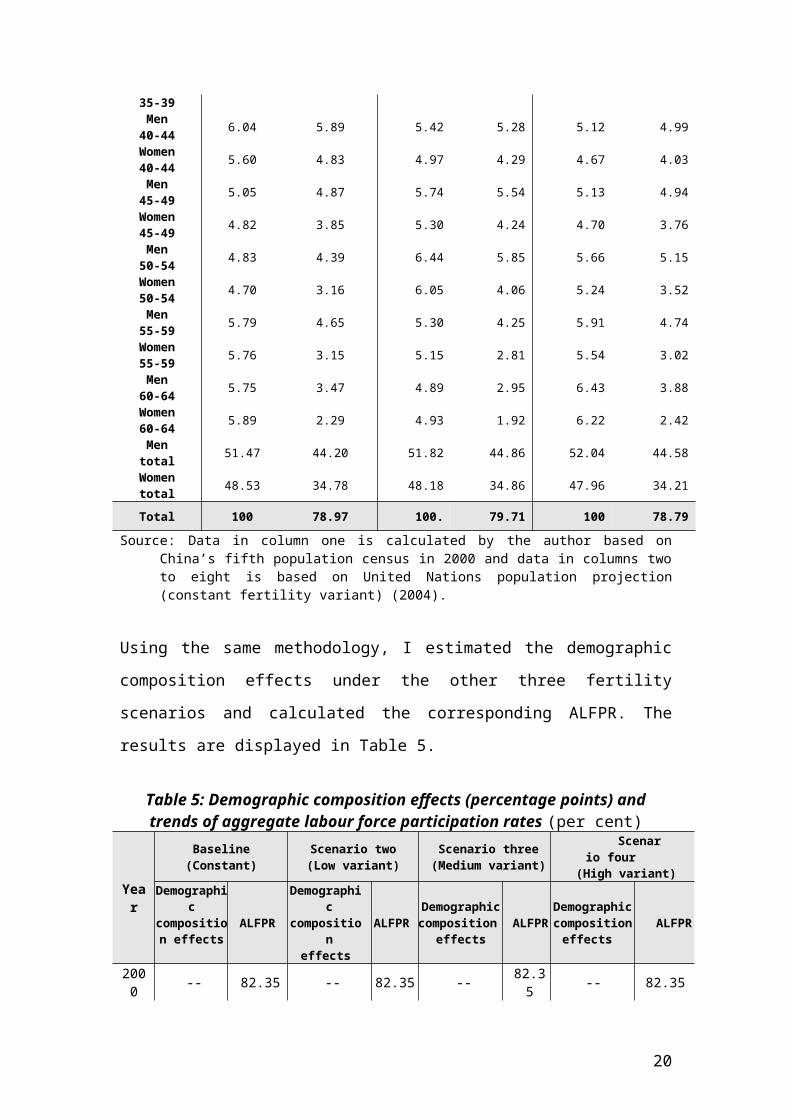
Using the same methodology, I estimated the demographic composition effects under
the other three fertility scenarios and calculated the corresponding ALFPR. The
results are displayed in Table 5.
Table 5: Demographic composition effects (percentage points) and trends of aggregate labour force participation rates (per cent)
Year
Baseline (Constant) Scenario two(Low variant)
Scenario three(Medium variant)
Scenario four(High variant)
Demographic composition
effects ALFPRDemographiccomposition
effectsALFPR
Demographiccomposition
effectsALFPR
Demographiccomposition
effects ALFPR
2000 -- 82.35 -- 82.35 -- 82.35 -- 82.352010 -0.76 81.59 -0.76 81.59 -0.76 81.59 -0.76 81.592020 -1.49 80.86 -1.49 80.86 -1.49 80.86 -1.49 80.862030 -3.38 78.97 -3.03 79.32 -3.52 78.83 -3.15 79.202040 -2.64 79.71 -2.66 79.69 -2.63 79.72 -2.59 79.762050 -3.56 78.79 -4.19 78.16 -3.39 78.96 -3.16 79.19
During the initial 20 years there is no difference in the demographic composition
effect among the four scenarios. The differences that do emerge during the 2030s and
2040s are not significant in view of slight differences in the age structure. However, it
becomes significant with the increasing divergence in the age structure. In 2050, the
demographic composition effect is 1.03 percentage points larger in scenario two (low
variant) than in scenario four (high variant). The most rapid population ageing in
scenario two reduces the ALFPR to 78.16 per cent. As a result, total labour force
declines to 563 million, 21.5 percent below its 2000 level (Table 6). However, in
scenario four characterized by a higher fertility rate and relatively slower population
ageing, the demographic composition effect is smaller (3.16 percentage points),
generating a relatively higher ALFPR (79.19 per cent). As a result, the total size of
labour force will be 754 million in 2050, 5 per cent larger than in 2000.
Differences in the demographic composition effects under alternative fertility
scenarios enlarge the disparity of the total sizes of labour force. By 2050, the labour
force will be 25 per cent lower in scenario 2 than in scenario 4 (without demographic
composition effects, the labour force is 23 per cent less in scenario 2 than in scenario
4.
13

Table 6: Trends of labour force with demographic composition effects
Year Baseline(Constant)
Scenario two(Low variant)
Scenario three(Medium variant)
Scenario four(High variant)
2000 717 717 717 7172005 763 763 763 7632010 798 798 798 7982020 803 803 803 8032030 757 741 762 7932040 693 648 710 7652050 638 563 667 754
5 Age- and sex-specific participation rates and labour supply
Our investigation of the impact of the age structure on labour supply in the preceding
section assumed that age and sex-specific participation rates remain at their 2000
levels. This section examines potential changes in the age- and sex-specific
participation rates over the next 45 years.
During the 1980s China experienced an increase in the aggregate labour force
participation rate (ALFPR), from 82 per cent in 1982 to 85 per cent in 1990, that was
spread across most working age groups. The only exceptions were the age groups 15
to 19 and 20 to 24, for whom participation rates dropped (Figure 1). Even though the
ALFPR declined slightly during the 1990s, it remained at a historical high level. In
1995, it dropped slightly to 84.97 percent, declining further to 82.35 percent in 2000.
The relatively young age groups, 15 to 19 and 20 to 24, are the main contributors to
the decline because their participation rates display a sustained and fast drop. Groups
in the upper age brackets 50 to 54 and 55 to 59 also contributed to the decline.
14

Comparison of LFPRs by gender indicates that the evolution of the LFPR for women
is the main driver for the changes in the aggregate ALFPR over the period 1980 to
2000 (Figure 2). The LFPR for males remains roughly stable (except for the young
age group) while for females the LFPR increases in all age groups during the 1980s,
except for the age groups 15-19 and 20-24, and then declines slightly during the
1990s.
The historical evolution of age- and sex-specific LFPRs displayed in Figure 2 also
shows that,
First, women’s LFPR are lower than men’s in all cohorts (except for cohort
15-19);
Secondly, the divergence increases significantly beyond age 45. Women’s
workforce participation declines substantially at age 45, while men maintain a
high participation rate until they reach age 60. The difference in compulsory
retirement age between men and women - 55 and 50 years, respectively - is
one reason;
Thirdly, women’s LFPR exceeds men’s for the age group 15 to 19, indicating
the lower education opportunities for women.
15
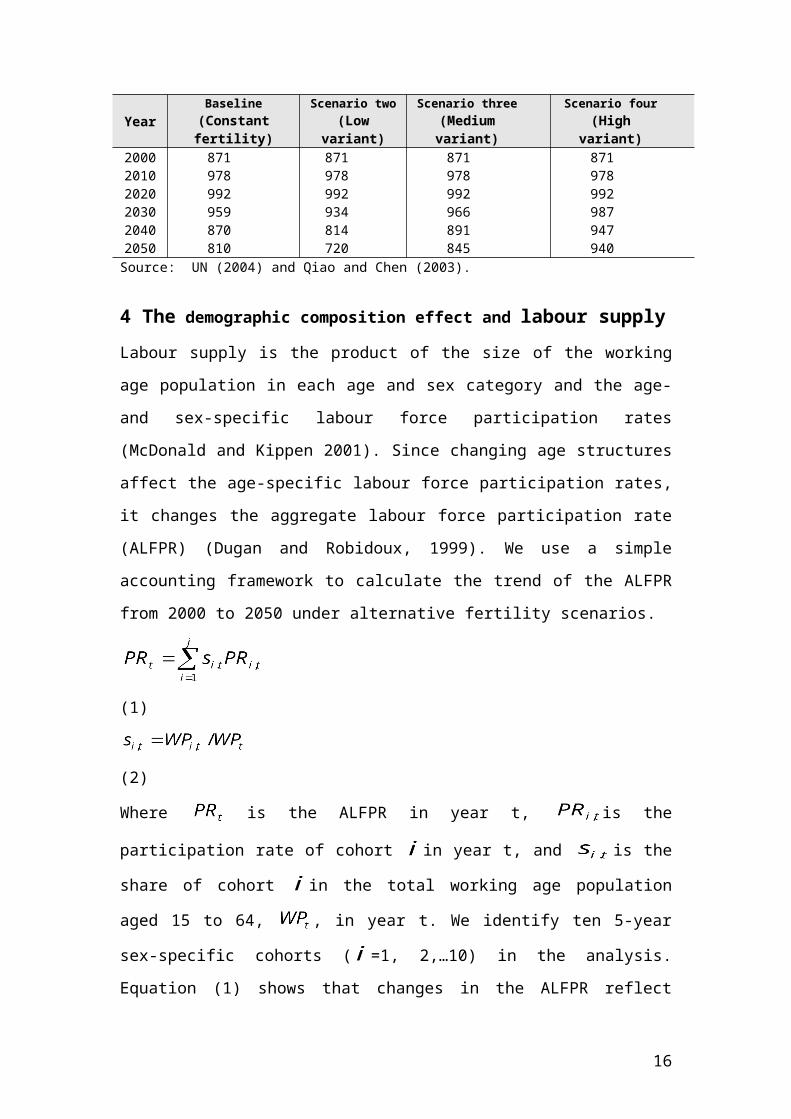
Figure 2: Age-specific LFPR for males and females,China, 1980 and 2000
Many social, economic and cultural factors affect the age- and sex-specific
participation rates. This section explores the nature of changes in those rates during
the first half of this century in China.
5.1 Labour force participation of the young population
Table 7 compares the participation rates of the age groups 15-19 and 20-24 in China
with other selected countries in 2000.
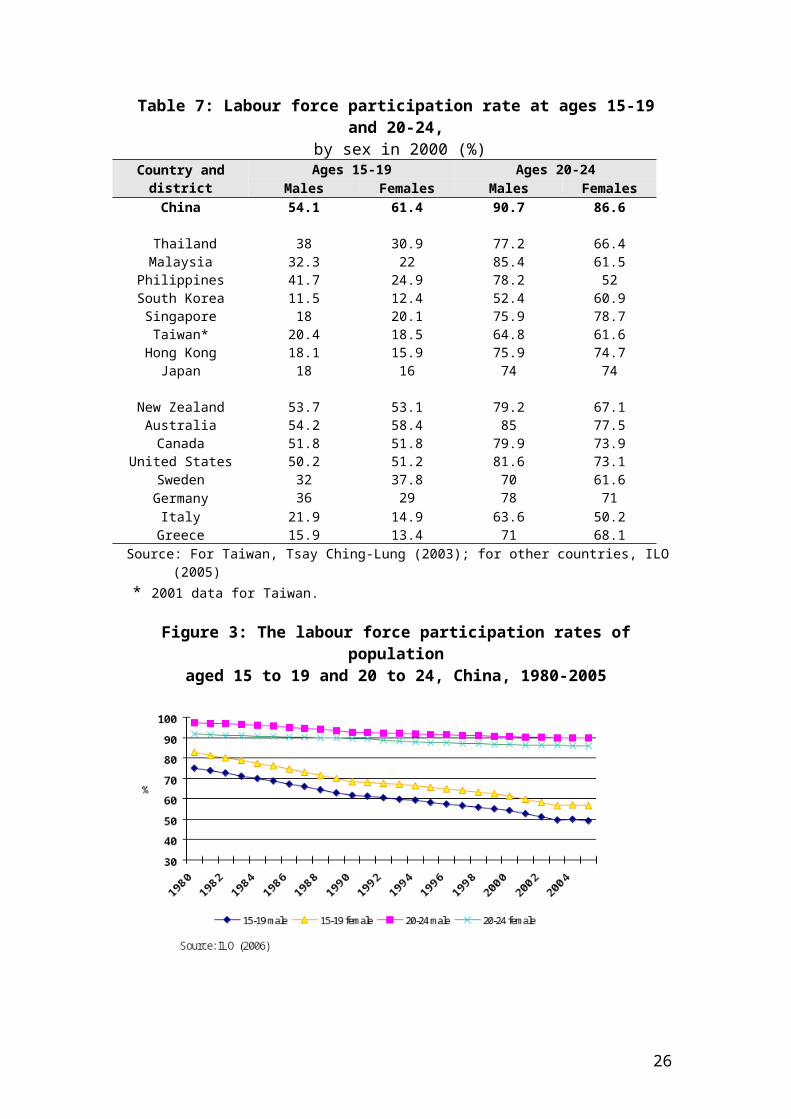
Labour force participation rates, 15-19 age group
The LFPR for this age group (54.1 and 61.4 for males and females, respectively) is
very high in China compared with other selected Asian and western countries and
regions. For example, in South Korea the comparable rates were only 11.5 per cent
and 12.4 per cent, respectively. The high participation rate in China reflects the very
low rates of participation in education at these ages.3 As educational opportunities
expand, particularly for women, the labour force participation rate of this group would
be expected to decline. Indeed, historical data shows that the LFPR of this group in
China has already declined (Figure 3). In 2005, these figures were 49.3 and 56.4,
respectively. Within 25 years, labour force participation of this group has fallen by 34
per cent for males and by 32 per cent for female.
3 The relatively high LFPR at the age group 15 –19 in some developed countries, such as New Zealand, Australia, Canada and United States reflects a combination of formal education with part-time work. (McDonald and Kippen 2001).
16
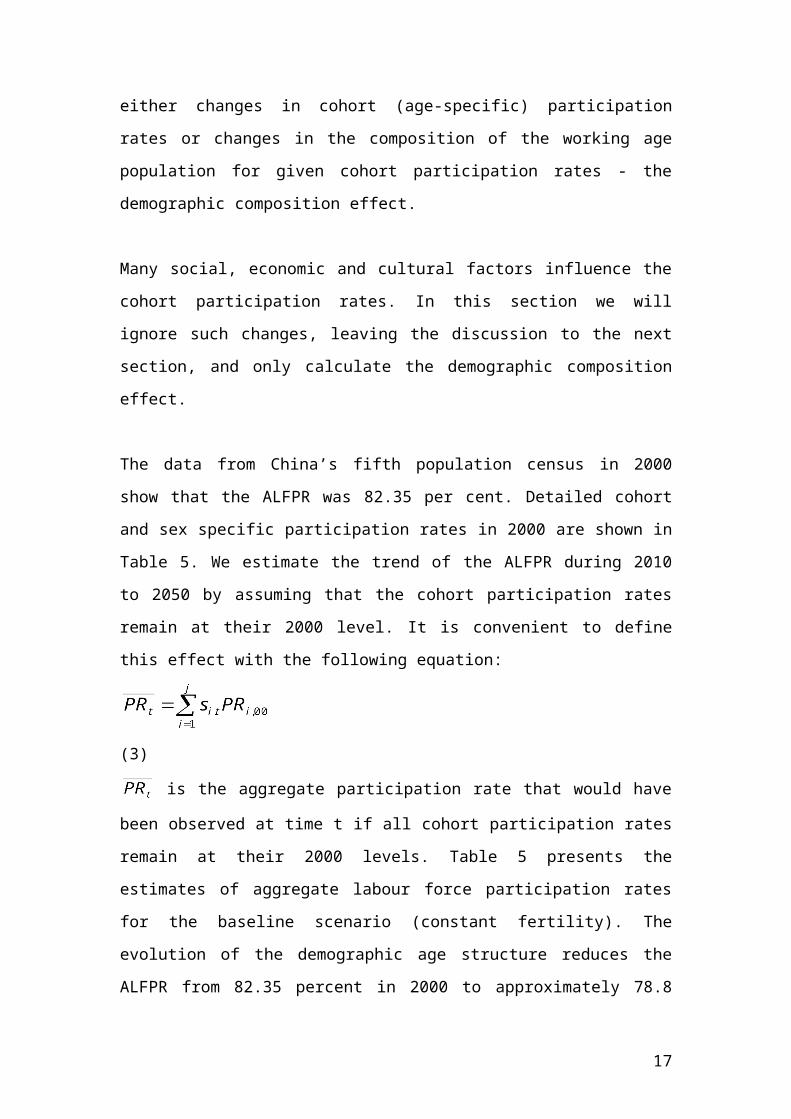
Table 7: Labour force participation rate at ages 15-19 and 20-24,by sex in 2000 (%)
Country and districtAges 15-19 Ages 20-24
Males Females Males FemalesChina 54.1 61.4 90.7 86.6
Thailand 38 30.9 77.2 66.4Malaysia 32.3 22 85.4 61.5
Philippines 41.7 24.9 78.2 52South Korea 11.5 12.4 52.4 60.9Singapore 18 20.1 75.9 78.7Taiwan* 20.4 18.5 64.8 61.6
Hong Kong 18.1 15.9 75.9 74.7Japan 18 16 74 74
New Zealand 53.7 53.1 79.2 67.1Australia 54.2 58.4 85 77.5Canada 51.8 51.8 79.9 73.9
United States 50.2 51.2 81.6 73.1Sweden 32 37.8 70 61.6
Germany 36 29 78 71Italy 21.9 14.9 63.6 50.2
Greece 15.9 13.4 71 68.1Source: For Taiwan, Tsay Ching-Lung (2003); for other countries, ILO (2005) * 2001 data for Taiwan.
Figure 3: The labour force participation rates of population aged 15 to 19 and 20 to 24, China, 1980-2005
The experience of selected Asian countries and regions shown in Table 8 confirms
our conjecture Labour force participation for this young age group has declined
dramatically over the past 35 years. In Hong Kong it has declined by 68 per cent for
males and by 74 per cent for females. Singapore has experienced a similar dramatic
decline. The fall is even more impressive in South Korea, amounting to 80 per cent
17

for males and 74 per cent for females. In Thailand, the dramatic decline in LFPR
occurred after 1990. Within 15 years (from 1990 to 2005), the LFPR for males fell by
51 per cent for males and by 71 per cent for females.
Table 8: Labour force participation rate at ages 15-19 by sex (%)
YearHong Kong Singapore South Korea Thailand Japan
Male Female Male Female Male Female Male Female Male Female
1960 --- --- --- --- --- --- --- --- 51.6 49.71970 --- --- 55.7 43 45.9 40.3 77.4 77.2 36.6 35.91971 50.4 56.4 --- --- -- --- --- --- --- ---1975 --- --- -- -- 46 47.5 --- --- --- ---1976 51.4 55.3 44.1 42.2 --- --- --- --- --- ---1980 41.8 40.7 45.8 48.1 27.3 34.4 70.9 71 20.3 18.81985 35.2 31.5 32.6 33.7 14.5 21.1 69.6 70.7 -- --1990 29.6 25.8 26.9 28.3 10.8 18.7 67.7 69.4 19.9 17.41995 22.6 18.8 20.5 19.1 9.5 14.5 47.5 44 18.8 15.82000 18.1 15.9 18 20.1 11.5 12.4 38 30.9 17.4 15.42005 15.9 14.9 14.8 15.4 8.8 10.6 33.5 19.8 -- --
Source: Data for Japan is from National Institute of Population and Social Security Research, Japan (2006). All other data are from ILO (2006)
This historical evidence informs all the scenarios of labour supply projections in this
study. The LFPR of the age group 15 to 19 in China follows its historical trend from
1980 to 2005 and declines thereafter at 1.6 per cent annually (from 2006 to 2050).
Under this assumption, the LFPR for males of this group will be 23.9 and 29.1 per
cent for females in 2050 (Table A1 in Appendix for the detailed change in the
participation rates.). By 2050 the assumed LFPRs are roughly equal to the levels of
Hong Kong and Singapore at the beginning of the 1990s and of Japan at the end of the
1970s. Compared with the very low participation rate of this age group in the East and
South East Asian countries and regions shown in Table 8, this assumption may be
considered an optimistic conjecture.
Labour force participation rates, 20-24 age group
The LFPR for the group 20-24 in China has also declined, but the drop is much
smaller than for the age group 15-19. Over the quarter century 1980 to 2005 the rate
declined by 7.2 per cent for men and by 11 per cent for women (Figure 3). In 2005,
LFPR for men was 89.8 and for women it was 85.9 percent.
Compared with the countries shown in Table 7, LFPR of this age group in China in
2000 is much higher than that in all the selected Asian and western countries and
regions. The experience of the selected Asian countries and regions in Table 9 implies
18

that with the continued economic development, LFPR for this age group will keep
declining in China. Meanwhile, “as technology advances, and as those with high skills
continue to receive high rewards from the labour market, it is likely that young adults
will spend more time in acquiring higher levels of formal education” (McDonald and
Kippen, page 7, 2001). Thus, in all the scenarios of the present paper, I assume that
LFPR for this age group keeps its historical track and continues to decline at 0.3 per
cent annually for men and 0.25 per cent for women until 2050 (Table A1 in Appendix
for the detailed change in the participation rates..
Table 9: Labour force participation rate at ages 20-24 by sex (%)
YearHong Kong Singapore South Korea Thailand Japan
Male Female Male Female Male Female Male Female Male Female1980 89.8 80.2 92.5 79 76.5 53.5 87.8 80.3 74.7 71.11985 88.2 83.4 88.8 78.9 63.3 55.1 90.4 81.2 -- --1990 85.8 83.2 84 80.9 60.2 64.6 91.6 81.7 75.4 75.51995 79.2 77.2 76.2 77.2 58.8 66.1 85.7 71.7 75.8 74.22000 75.9 74.7 75.9 78.7 52.4 60.9 77.2 66.4 70.2 70.52005 70.8 71.8 72.8 77.9 59.1 66 77.5 64.4 -- --
Source: Data for Japan is from National Institute of Population and Social Security Research, Japan
(2006). All other data are from ILO (2006)
5.2 LFPR of population of the old, 50 to 64 age group
The distinguishing feature of figure 4 is that the female LFPR for each of the older
age cohorts of the population is distinctly lower than for the corresponding males.
Figure 4: The LFPR for population aged 50-64 by sex (%), China, 1980-2005
19
Males’ participation rates
The changes in the LFPR can be divided into two stages. From 1980 to 1990 it
followed a slight positive trend, increasing to 93.3 (from 91.5 in 1980) and 83.5 per
cent (from 83.2 in 1980), respectively, for age groups 50-54 and 55-59. After 1990,
the LFPR began to decline slightly. In 2005, it dropped to 92.7 per cent for age group
50-54, which was still higher than the level in 1980. However, the LFPR for age
group 55-59 has dropped to 80.9 per cent, which is 2.3 percentage points lower than
in 1980. The LFPR for males aged 60-64 has steadily increased from 62.9 in 1980 to
68.7 per cent in 2005
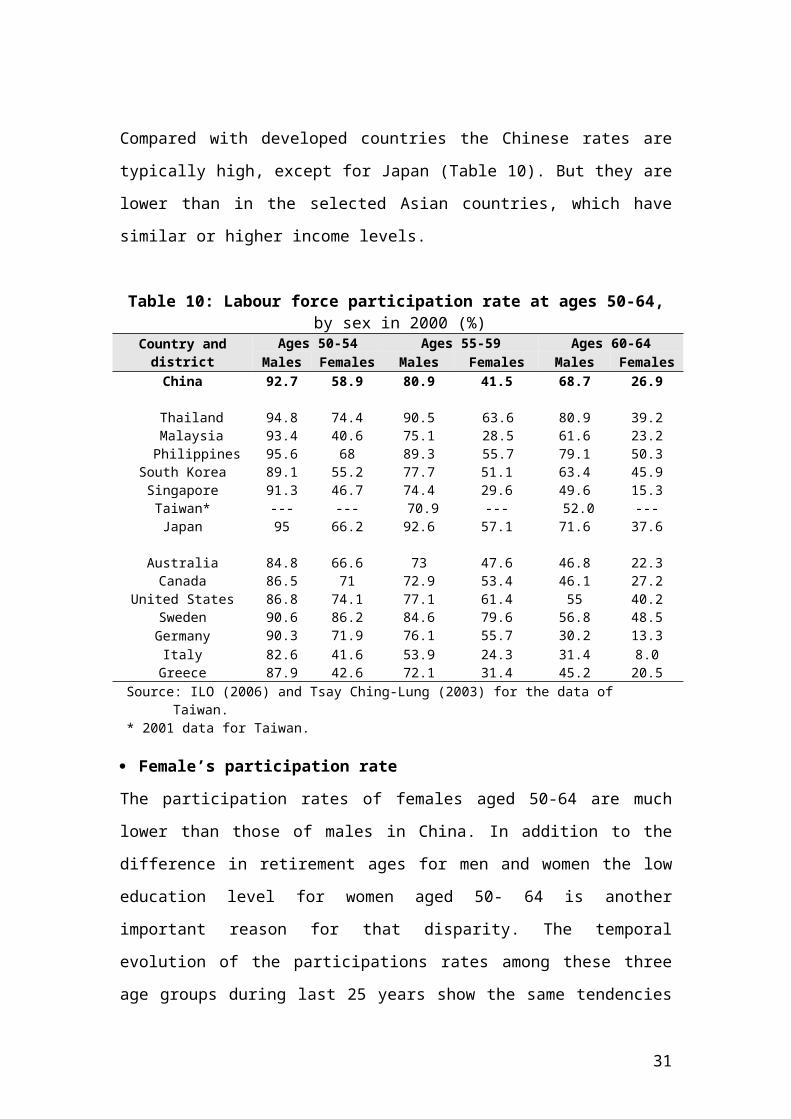
Compared with developed countries the Chinese rates are typically high, except for
Japan (Table 10). But they are lower than in the selected Asian countries, which have
similar or higher income levels.
Table 10: Labour force participation rate at ages 50-64,by sex in 2000 (%)
Country and districtAges 50-54 Ages 55-59 Ages 60-64
Males Females Males Females Males FemalesChina 92.7 58.9 80.9 41.5 68.7 26.9
Thailand 94.8 74.4 90.5 63.6 80.9 39.2Malaysia 93.4 40.6 75.1 28.5 61.6 23.2
Philippines 95.6 68 89.3 55.7 79.1 50.3South Korea 89.1 55.2 77.7 51.1 63.4 45.9Singapore 91.3 46.7 74.4 29.6 49.6 15.3Taiwan* --- --- 70.9 --- 52.0 ---
Japan 95 66.2 92.6 57.1 71.6 37.6
Australia 84.8 66.6 73 47.6 46.8 22.3Canada 86.5 71 72.9 53.4 46.1 27.2
United States 86.8 74.1 77.1 61.4 55 40.2Sweden 90.6 86.2 84.6 79.6 56.8 48.5
Germany 90.3 71.9 76.1 55.7 30.2 13.3Italy 82.6 41.6 53.9 24.3 31.4 8.0
Greece 87.9 42.6 72.1 31.4 45.2 20.5Source: ILO (2006) and Tsay Ching-Lung (2003) for the data of Taiwan.* 2001 data for Taiwan.
Female’s participation rate
The participation rates of females aged 50-64 are much lower than those of males in
China. In addition to the difference in retirement ages for men and women the low
education level for women aged 50- 64 is another important reason for that disparity.
20

The temporal evolution of the participations rates among these three age groups
during last 25 years show the same tendencies as those for men: increase during 1980s
followed by declines during the 1990s.
The participation rates of females at ages 50 to 59 in China are lower than in most of
the countries and regions shown in Table 10 (In Asia, only Singapore and Malaysia
and in Western countries, only Italy and Greece have lower participation rate than
China in 2000). For the age group 60-64, the participation rate among the countries
shows a large divergence. If we only compare with the Asian countries, women’s
participation rate among 60-64 years old in China is much lower than in Japan, South
Korea, Thailand and Philippines.
Looking ahead, there is a great deal uncertainty surrounding the evolution of the
participation rate of these age groups for both males and females. This study assumes
three evolutionary trends over the next 45 years:
First, slightly decline then stability: Given the existing retirement ages, sustained
economic growth, rising living standard and a gradually improving pension system,
the LFPR of the older population (50-59) is likely to decline slightly initially, and
then to stabilize at that lower level. For the period 2005 -2015, this study adopts the
ILO projection. This is a conventional assumption and we define it, therefore, as the
“conventional case” (CC) (Table A2 in Appendix for the detailed change in the
participation rates).
Second, moderate increase: The OECD (1998) suggests that, in an ageing
society, attention should be focused on increasing the labour force participation of
men at older ages. This may be brought about by an increase in the retirement age.
Furthermore, expansion of women’s educational engagement will stimulate their
economic activity and labour force participation, especially after age 40. The
development of education affects all cohort participation rates. Increases in the
school enrolment rate, especially in upper secondary and tertiary enrolments, will
reduce the participation rate, especially among the young (15-24) while increasing
it later in life, especially after age 40. The evidence from Australia and Canada
shows that there exists a positive relationship between education level and labour
force participation rate, especially for women (Day and Dowrick, 2004; Dugan and
Robidoux, 1999). Accordingly, this study assumes that by 2050 the labour force
21

participation rates for these three age groups will increase to the level of Japan in
2000. For men, the annul rates of increase will be 0.06, 0.3 and 0.04 per cent for
age groups 50-54, 55-59 and 60-64, respectively. For women, the corresponding
figures are 0.28, 0.76 and 0.52 per cent. We define this scenario as the “optimistic
case” (OC). The detailed changes in the participation rates under OC are displayed
in Table A3 in Appendix.
Third, substantial increase: Sweden has the highest female LFPR at ages 50 and
above in the developed countries. We follow McDonald and Kippen (2001) to
assume that in the next 45 years, female LFPR in China will increase to Sweden’s
2000 level. Under this assumption, the annul growth rates of female LFPR for the
age groups 50- 54, 55-59 and 60-64, will be 0.87, 1.5 and 1.3 per cent, respectively.
We assume that the male labour force participation will be the same as in the
optimistic case. We define this scenario as the “very optimistic case” (VOC), and
provide documentation of the hypothesized changes in the participation rates in
Table A4.
The LFPR for both sexes of the intermediate age groups, 25 to 49, are assumed to
remain at their 2000 level.
5.3 The labour supply prospects over the period 2005 to 2050
Based on the assumed evolution of the age- and sex-specific LFPR, the projected
working age population and the demographic composition effects, we calculate the
trends of the labour force in China during the period 2005-2050. The results are
shown in Figures 5 and 6.
In the conventional case (Table 11), after a slight increase during the first two
decades, the total size of the labour force declines in all alternative fertility scenarios.
In the baseline case, the labour force declines to 582 million, which is equivalent to
76 percent of the 2005 labour force. Under the low variant scenario (TFR will
continue to decline to 1.35), the total labour force drops to slightly over 500 million,
and China will lose more than one quarter of the current labour force.
Table 11: Trends of labour force under conventional case
22

Year Baseline(Constant)
Scenario two(Low variant)
Scenario three(Medium variant)
Scenario four(High variant)
2005 763.2 763.2 763.2 763.22010 779.3 779.3 779.3 779.32020 766.7 766.7 766.7 766.72030 701.6 691.0 704.0 725.82040 642.2 602.6 656.0 693.32050 582.2 512.4 608.6 677.6
We notice that if we only consider the demographic composition effect, and if China
maintains its current age- and sex-specific participation rates at the 2000 level, then
lifting the fertility rate to the replacement level (high variant scenario) will help
increase the labour supply over the next 45 years (refer to Table 6). However, under
the conventional case, with the assumed decline in the LFPR of young people (aged
19 to 24) and slight change in the elderly population (aged 50 to 64), the total size of
the labour force will fall after 2020 as in the baseline case and scenarios two and
three. By 2050, the labour force will be 11 percent smaller than in 2005 in Scenario 4.
Table 12: Trends of labour force under optimistic case
Year Baseline(Constant)
Scenario two(Low variant)
Scenario three(Medium variant)
Scenario four(High variant)
2005 763.2 763.2 763.2 763.22010 781.7 781.7 781.7 781.72020 775.4 775.4 775.4 775.42030 716.5 706.0 718.9 740.02040 660.8 627.1 674.5 711.52050 606.0 536.1 632.5 702.0
The evolutionary pattern of the labour force of in the optimistic case is much closer to
the conventional case (Table 12). The only difference is the slightly larger labour
supply after 2020 as a result of the assumed increase in the LFPR for both males and
females aged 50-64. For instance, in the low variant scenario, by 2050 there will be
23.7 million more labourers in the optimistic case compared to conventional case. In
the high variant scenario, this figure is 24.4 million.
In the very optimistic case, the substantial increase in the participation rate of elderly
females cannot completely offset the declining trend of labour supply in all fertility
scenarios after 2020 (Table 13). But the extent of the fall has been considerably
reduced. For instance, in the high fertility scenario, the total size of the labour force in
2050 will be only 5 percent smaller than in 2005.
23

Table 13: Trends of labour force under very optimistic case
Year Baseline(Constant)
Scenario two(Low variant)
Scenario three(Medium variant)
Scenario four(High variant)
2005 763.2 763.2 763.2 763.22010 783.3 783.3 783.3 783.32020 782.0 782.0 782.0 782.02030 728.5 718.1 730.8 751.52040 677.8 638.2 691.7 728.32050 628.6 558.6 655.1 725.5
Comparing these three evolutionary cases, by 2050 the labour supply will be 7 percent
larger in the very optimistic case than in conventional case under high fertility
scenario (Figure 5).
Figure 5: The comparison of trend of labour supply under three assumed cases(High variant scenario)
This simulation exercise implies that even if China’s TFR rises to near the
replacement level, the total size of labour supply will begin to shrink after 2020
(Figure 5). This tends to reflect the decline in the LFPR of young people, irrespective
of the behaviour of the LFPR of elderly population. The dramatic drop in the
participation rate of young people is the main driver of the decline in the labour
supply in the high fertility scenario. In contrast, the sharp decline of labour supply in
the low, constant and medium variant scenarios is manly caused by the shrinking
working age population as a result of low fertility.
6. Conclusion and policy implications
24
The present paper examines the trend over the next 45 years of the labour supply in
China. Alternative fertility scenarios have been constructed that take account of
demographic composition effects and plausible changes in age-and sex-specific
labour force participation. In order to sustain the focus on demographic factors the
present analysis ignores international migration flows. The main findings are:
First, given present levels of fertility the working age population in China will
decline from 2020 onwards (constant fertility scenario-baseline case). If current
fertility declines to a very low level (low variant scenario), then there will be a
very sharp drop in the working age population. Conversely, increasing the current
fertility level to 1.84 (medium variant) will only increase the working age
population slightly without preventing the declining trend beyond 2020. In order to
achieve sustainable growth of the working age population the fertility rate would
need to increase to replacement level. In that case, the working age population in
2050 will slightly exceed its 2000 level.
Secondly, the upward shift of the age structure, i.e., population ageing, will put
downward pressure on the labour supply under all fertility scenarios. This reflects
the fact that population aging reduces the aggregate labour force participation rate,
even if the relevant cohort labour force participation rates remain at their 2000
levels. However, the demographic composition effect will be more severe in low
fertility scenarios than with high fertility, enlarging the differences of labour
supply in the alternative scenarios.
Thirdly, the very likely decline in the labour force participation rate of the young
population (aged 15-24), especially the very young aged 15-19, reduces the labour
supply substantially from 2020 onwards in the low, constant and medium fertility
scenarios. The higher fertility level in scenario four can not completely offset the
declining trend of the labour supply, irrespective of the LFPR behaviour of the
elderly population.
China’s economy has been and will continue to benefit from the “demographic
window” that is opened by the increasing labour supply during next 15 years in
combination with the low share of the elderly population. However, once the
demographic window closes at around 2020, the demographic profile for China will
be quite different. As population ageing becomes increasingly prominent, the annual
supply of new labour will start to decline sharply in response to the low fertility of the
25
1990s. China will enter a long period of demographic crossover: a consistently
reduction in the new labour supply coupled with a consistent rise of the elderly
population (Wang 2005). The present investigation demonstrates that the
demographic composition effects and the probable decline in the labour force
participation rate of the young population will accelerate the declining trend of the
labour supply and make the situation even worse. Furthermore, any feasible increase
in the labour force participation rate of the old provides at best only a partial offset.
How China can sustain its economic growth in the light of these labour market
developments? Without considering potential changes in labour demand, it is difficult
to determine whether shrinking labour supply is really a problem for economic
growth. However, some research has provided evidence to support the importance of
maintaining the size of the labour supply. Peng (2005) found that with a constant
fertility rate (at 1.62) during the first half of this century, a falling labour supply in
China will reduce the growth rate of per capita real GDP by 2 percentage points
annually during the 2020s, and by 3 percentage points p.a. during the 2040s. The
Productivity Commission in Australia found complementary evidence suggesting that
the combination of falling labour supply and population ageing in Australia would
slow the economic growth rate to nearly 1.25 per cent a year by the mid 2020s, which
is roughly half its present rate (Productivity Commission 2005). Similarly, Masson
and Tryon (1990) from IMF, Turner et al. (1998) at OECD, and McMorrow and
Roeger (1999) from the European Commission have completed major studies with
large macroeconomic forecasting models and their multicountry studies of industrial
nations project slowing growth after 2010 as a result of population ageing, and further
deceleration of growth after 2025.
Secondly, there is no prior experience in an advanced country of falling labour supply
over a long period of time. Advanced countries have typically experienced gradual to
rapid increases in the labour supply during the last 30 years (McDonald and Kippen
2001). In the Asian “tiger” economies, such as Hong Kong, South Korea, Singapore
and Thailand the labour force has more than doubled during the period 1970 to 1995.
China’s rapid economic growth during last 25 years is accompanied by a 57 percent
growth in the labour force.
26

Thirdly, it is less than likely that the demand for labour will fall to match the
reduction in the labour supply. Even though increases in the price of labour could
stimulate improvements to productivity, there is no suggestion that labour demand
will fall overall. The counter argument is much more likely: the rapid rate of
technological advance and the growing availability of investment capital will
stimulate the demand for people (McDonald and Kippen 2001, Judy and D’Amico
1997). Furthermore, the ageing of the population will itself alter the occupational
structure of the labour force. Consumption demand will shift increasingly towards
services and products consumed intensively by older members of the community.
These outputs are typically labour intensive. It follows that the scope for technology
to replace labour is limited (McDonald and Kippen 2001).
Fourthly, maintaining a stable labour force is of crucial importance for China.
International competition for skilled and even low-skilled workers will intensify with
the progress of global population ageing and resulting labour shortage, particularly in
developed countries, during the coming decades. Significant amounts of capital will
continue to flow from the advanced economies to the economies that have an
abundant labour supply. China’s comparative advantages lie in labour-intensive
manufacturing. With the decline of labour supply in China, wages will increase, and
China’s low labour cost advantage in attracting capital will be eroded progressively.
Since the ageing of China’s population commenced at a relatively low per capita
income level, the stance of policy needs to be growth-oriented. Maintaining an
abundant labour supply to attract foreign capital will help to sustain economic growth
and to accommodate increasingly elderly population.
The importance of maintaining the labour supply for economic growth suggests
prompt relaxation of the current one-child policy as a plausible and efficient policy
option. The gradual increase in the fertility level would dampen the decline of the
labour force by increasing the working age population and mitigating the
demographic composition effect on the LFPR. Though no policy change can reverse
the arrival of the demographic crossover, an early departure from the one-child policy
and a gradual increase in fertility could help to lighten the pressure of population
ageing 20 to 30 years from now (Wang, 2005).
27

Expansion of education at young ages will remove large numbers of young people
from the labour force and sharply reduce their labour force participation rate.
Countervailing policy choices include increasing the retirement age and encouraging
elderly to stay in the labour force in order to raise the labour force participation rates
of elderly. These strategies reflect the common policy approach in OECD countries.
They would constitute constructive policy choice for China in 10 to 15 years when the
supply of labour begins to decline.
28

References:Bloom, E. D. and G. J. Williamson (1998), “Demographic Transition and Economic
Miracles in Emerging Asia”, The World Bank Economic Review, Vol.12 (3),
pp.419-55.
Day, C. and S. Dowrick, (2004), “Ageing Economics: Human Capital, Productivity
and Fertility”, Agenda, Vol.119 (1), pp.1-20.
Dugan, B. and Robidoux, B. (1999) “Demographic Shifts and Labour Force
participation Rates in Canada”, Canadian Business Economics, Summer 1999,
pp.42-56.
Hernandez, D.J. (1984) Success or Failure? Family Planning Programs in the Third
World, Westport, CT: Greenwood Press.
ILO (2006), http://laborsta.ilo.org.
Judy R. and C. D’Amico (1997) Workforce 2020: Work and Workers in the 21st
Century. Indianapolis, IN: Hudson Institute.
Kaufman, J., Zhang, Z. & Zhang, Y.(1989) “Family planning policy and practice in
China, 1986-1988”, Population and Development Review, 14(2), pp.245-86.
Li, J. X. (2002), “China’s Population: ‘Reduction of Population Size’ should not to be
the target”, Journal of Population Research, No.6 (in Chinese).
Li, X. P. (2002), “The Necessity and Possibility of Further Reducing China’s Fertility
Rate”, Journal of Population Research, No.4 (in Chinese).
Masson, P. R. and R. W. Tryon (1990), “Macroeconomic Effects of Projected
Population Ageing in Industrial Countries,” IMF Staff Papers, 37, pp.453-85.
McMorrow, K and W. Roeger (1999), The Economic Consequences of an Ageing
Population, European Commission, Directorate-General for Economic and
Financial Affairs (ECFIN), Luxembourg, Office for Official Publications of the
European Communities.
McDonald, P and R. Kippen (2001), “Labour Supply Prospects in 16 Developed
Countries, 2000-2050,” Population and Development Review, 27(1): 1-32.
National Institute of Population and Social Security Research, Japan (2006),
http://www.ipss.go.jp/index-e.html.
Peng, X. J. (2005) “Population Ageing, economic Growth and Population Policy
options in China –A Computable General Equilibrium Analysis”, PhD
Dissertation, Monash University.
29

Productivity Commission (2005), “Economic Implications of an Ageing Australia”,
Research Report of Productivity Commission in Australia.
Qiao, X. and Chen, W. (2003), “Forecast of the Population Development Trend in
China”, Research Report of Institute of Population Research, Renmin University
of China.
Tsay, Ching-lung (2003), “Below-replacement fertility and prospects for labour force
growth in Taiwan,” Journal of Population Research, Vol.20 (1): 67-87.
Turner, D., C. Giornio, A. D. Serres, A. Vourc’h, and P. Richardson (1998), “The
Macroeconomic Implications of Ageing in a Global Context”, Economics
Department Working Paper, No.193, OECD.
United Nations (2003), World Population Prospects: The 2004 Revision.
Wang, F. (2005), “Can China Afford to Continue its One-Child Policy?” Asia Pacific
Issues, No.77, East-West Centre.
Wang, J., L. Keng and R. Smyth (2002), “China's population policy and design
alternatives: using the market to regulate China's population growth”, Asian
Profile, Vol.30 (5), 379-91.
Wang, J. Y, Y. Y. He, Z. C. Wang and C. R. Duan (2004), “An Assessment of Total
Fertility Rate of the Provinces of China in 2000”, Journal of Population Research,
No.2, pp.10-19 (in Chinese).
Wu, C. P. (1997), General Report of China’s Changing Population and Its
Development (in Chinese), Beijing, Higher Education Press.
Wu, C. P., L. Wang and Z. F. Miao (2004), “Process, Prospects and Countermeasures
of Population Ageing with Chinese Characteristics”, Journal of Population
Research, No.1, pp.8-16 (in Chinese).
Zhai, Z. W. (2000), “Stabilizing the low fertility rate: Concept, Theory and Strategy”
(in Chinese), Journal of Population Research, No. 3.
__________(2001), “Analysis on the Dilemma between Population Size and Age
Structure in China”, Journal of Population Research, No.3 (in Chinese).
30
Appendix:
Table A1: The possible evolution of the LFPR at ages 15-24 from 2005 to 2050 by sex (%)
YearAged 15-19 Aged 20-24
Males Females Males Females2005 49.3 56.4 89.8 85.92010 45.5 52.4 88.4 84.82015 42.0 48.7 87.1 83.82020 38.7 45.2 85.8 82.72025 35.7 42.0 84.5 81.72030 33.0 39.0 83.2 80.72035 30.4 36.3 82.0 79.72040 28.1 33.7 80.7 78.72045 25.9 31.3 79.5 77.72050 23.9 29.1 78.3 76.7
Table A2: The possible evolution of the LFPR at ages 50-64 from 2005 to 2050 by sex (%) – conventional case
YearAged 50-54 Aged 55-59 Aged 60-64
Males Females Males Females Males Females2005 92.5 57.8 79.8 40.3 70.2 26.82010 92.2 57.4 79.3 39.7 70.8 26.72015 92.0 57.3 79.0 39.5 71.0 26.72020 92.0 57.3 79.0 39.4 71.0 26.72025 92.0 57.3 79.0 39.4 71.0 26.72030 92.0 57.3 79.0 39.4 71.0 26.72035 92.0 57.3 79.0 39.4 71.0 26.72040 92.0 57.3 79.0 39.4 71.0 26.72045 92.0 57.3 79.0 39.4 71.0 26.72050 92.0 57.3 79.0 39.4 71.0 26.7
Table A3: The possible evolution of the LFPR at ages 50-64 from 2005 to 2050 by sex (%) – optimistic case
31

YearAged 50-54 Aged 55-59 Aged 60-64
Males Females Males Females Males Females2005 92.5 57.8 79.8 40.3 70.2 26.82010 92.8 58.6 81.1 41.8 70.4 27.82015 93.0 59.5 82.4 43.5 70.5 28.82020 93.3 60.4 83.8 45.1 70.7 29.92025 93.6 61.2 85.1 46.9 70.8 31.12030 93.9 62.1 86.5 48.7 71.0 32.22035 94.1 63.0 87.9 50.5 71.1 33.42040 94.4 63.9 89.4 52.5 71.3 34.72045 94.7 64.9 90.8 54.5 71.4 36.02050 94.9 65.8 92.3 56.6 71.6 37.3
Table A4: The possible evolution of the LFPR at ages 50-64 from 2005 to 2050 by sex (%) – very optimistic case
YearAged 50-54 Aged 55-59 Aged 60-64
Males Females Males Females Males Females2005 92.5 57.8 79.8 40.3 70.2 26.82010 92.8 60.4 81.1 43.4 70.4 28.62015 93.0 63.0 82.4 46.7 70.5 30.52020 93.3 65.8 83.8 50.3 70.7 32.52025 93.6 68.8 85.1 54.2 70.8 34.72030 93.9 71.8 86.5 58.3 71.0 37.02035 94.1 75.0 87.9 62.8 71.1 39.52040 94.4 78.3 89.4 67.6 71.3 42.12045 94.7 81.8 90.8 72.8 71.4 44.92050 94.9 85.5 92.3 78.4 71.6 47.9
32