Income inequality and high blood pressure in Colombia: a...
13
Income inequality and high blood pressure in Colombia: a multilevel analysis Desigualdad de renta e hipertensión arterial en Colombia: un análisis multinivel Desigualdade de renda e hipertensão arterial na Colômbia: uma análise multinível Diego I. Lucumi 1 Amy J. Schulz 2 Ana V. Diez Roux 3 Andrew Grogan-Kaylor 4 Correspondence D. I. Lucumi Escuela de Gobierno Alberto Lleras Camargo, Universidad de los Andes. Cr 1 No 19-27 Bloque Aulas AU, tercer piso, Bogotá/ Cundinamarca – 110121, Colombia. [email protected] 1 Escuela de Gobierno Alberto Lleras Camargo, Universidad de los Andes, Bogotá, Colombia. 2 School of Public Health, University of Michigan, Ann Arbor, U.S.A. 3 Dornsife School of Public Health, Drexel University, Philadelphia, U.S.A. 4 School of Social Work, University of Michigan, Ann Arbor, U.S.A. ARTIGO ARTICLE doi: 10.1590/0102-311X00172316 Cad. Saúde Pública 2017; 33(11):e00172316 Abstract The objective of this research was to examine the association between income inequality and high blood pressure in Colombia. Using a nationally represen- tative Colombian sample of adults, and data from departments and munici- palities, we fit sex-stratified linear and logistic multilevel models with blood pressure as a continuous and binary variable, respectively. In adjusted mod- els, women living in departments with the highest quintile of income inequal- ity in 1997 had higher systolic blood pressure than their counterparts living in the lowest quintile of income inequality (mean difference 4.42mmHg; 95%CI: 1.46, 7.39). Women living in departments that were at the fourth and fifth quintile of income inequality in 1994 were more likely to have hypertension than those living in departments at the first quintile in the same year (OR: 1.56 and 1.48, respectively). For men, no associations of income inequality with either systolic blood pressure or hypertension were observed. Our find- ings are consistent with the hypothesis that income inequality is associated with increased risk of high blood pressure for women. Future studies to ana- lyze pathways linking income inequality to high blood pressure in Colombia are needed. Hypertension; Social Inequity; Multilevel Analysis This article is published in Open Access under the Creative Commons Attribution license, which allows use, distribution, and reproduction in any medium, without restrictions, as long as the original work is correctly cited.
Transcript of Income inequality and high blood pressure in Colombia: a...

Income inequality and high blood pressure in Colombia: a multilevel analysis
Desigualdad de renta e hipertensión arterial en Colombia: un análisis multinivel
Desigualdade de renda e hipertensão arterial na Colômbia: uma análise multinível
Diego I. Lucumi 1
Amy J. Schulz 2
Ana V. Diez Roux 3
Andrew Grogan-Kaylor 4
CorrespondenceD. I. LucumiEscuela de Gobierno Alberto Lleras Camargo, Universidad de los Andes.Cr 1 No 19-27 Bloque Aulas AU, tercer piso, Bogotá/ Cundinamarca – 110121, [email protected]
1 Escuela de Gobierno Alberto Lleras Camargo, Universidad de los Andes, Bogotá, Colombia.2 School of Public Health, University of Michigan, Ann Arbor, U.S.A.3 Dornsife School of Public Health, Drexel University, Philadelphia, U.S.A.4 School of Social Work, University of Michigan, Ann Arbor, U.S.A.
ARTIGOartiCle
doi: 10.1590/0102-311X00172316
Cad. Saúde Pública 2017; 33(11):e00172316
Abstract
The objective of this research was to examine the association between income inequality and high blood pressure in Colombia. Using a nationally represen-tative Colombian sample of adults, and data from departments and munici-palities, we fit sex-stratified linear and logistic multilevel models with blood pressure as a continuous and binary variable, respectively. In adjusted mod-els, women living in departments with the highest quintile of income inequal-ity in 1997 had higher systolic blood pressure than their counterparts living in the lowest quintile of income inequality (mean difference 4.42mmHg; 95%CI: 1.46, 7.39). Women living in departments that were at the fourth and fifth quintile of income inequality in 1994 were more likely to have hypertension than those living in departments at the first quintile in the same year (OR: 1.56 and 1.48, respectively). For men, no associations of income inequality with either systolic blood pressure or hypertension were observed. Our find-ings are consistent with the hypothesis that income inequality is associated with increased risk of high blood pressure for women. Future studies to ana-lyze pathways linking income inequality to high blood pressure in Colombia are needed.
Hypertension; Social Inequity; Multilevel Analysis
This article is published in Open Access under the Creative Commons Attribution license, which allows use, distribution, and reproduction in any medium, without restrictions, as long as the original work is correctly cited.

Lucumi DI et al.2
Cad. Saúde Pública 2017; 33(11):e00172316
Introduction
High blood pressure, a major risk factor for cardiovascular disease 1, is an important and growing public health problem in low- and middle-income countries 2. A substantial literature in high income countries shows that the contextual characteristics of the place where people live, including social, and economic characteristics, play a key role in shaping the risk of being hypertensive 3,4. Although contextual factors have been suggested as key contributors to the rising burden of high blood pressure in low- and middle-income countries 5, empirical evidence remains limited.
Among distinctive contextual factors in many low- and middle-income countries, income inequal-ity reflects historical and contemporary political factors, and powerfully shapes the living conditions of individuals and communities 6,7. Some studies suggest that people living in contexts with high levels of inequality over time are more likely to have poor health outcomes 8,9,10. Several plausible explanatory frameworks have been proposed linking income inequality to health 11.
Individual explanations emphasize the role of income inequality in shaping individual human capital (e.g., education) and income levels. Under conditions of high income inequality, some people will have much lower incomes than others, and therefore may be less able to obtain resources neces-sary to maintain their health. These inequalities in personal income contribute to differences in the individual’s access to education, economic, and material (e.g., housing conditions) resources 12, which can then lead to disparities in health outcomes.
Psychosocial explanations suggest that income inequalities may influence blood pressure through psychosocial effects of social comparison 13. This perspective suggests that people with fewer eco-nomic resources may feel frustrated, or may feel devalued and inferior, as they compare them-selves to those with greater economic resources 9,14. The social capital mechanism suggests that inequality is socially corrosive and leads to social conflict and increasing levels of mistrust between groups with greater and those with fewer resources 9,13. There is some empirical support for this pathway, with one recent study concluding that social capital, assessed as a contextual phenom-enon, may reduce blood pressure through decreasing chronic stress or increasing the modulation of stressful events 15.
Finally, neomaterial explanations suggest that differences in high blood pressure across geograph-ic areas may reflect differences in investments in human capital 16 and the differential accumulation of exposures and experiences that have their sources in the material world 12,17. For example, people living in contexts that lack adequate investment in health-supportive infrastructures, or in areas that encounter multiple social problems due to inadequate investment in human capital or employment opportunities, for example, may experience high levels of chronic stress, a key psychosocial predictor of high blood pressure 18.
Building on this discussion, this study advances the existing literature in two ways. First, we address the widely debated issue of the lag time during which income inequality should work to pro-duce an effect on health. Studies that use contemporaneous measurements for income inequality and the health outcome of interest have been criticized because they assume that the mechanisms included in the three models previously described occur simultaneously or instantaneously to produce adverse health outcomes 19. Further studies were able to address this limitation, and found that it may take up to 15 years for income inequality to have a significant influence on chronic health conditions similar to hypertension 8,20. However, no previous research has examined the lag time during which income inequality can lead to hypertension, nor have previous studies examined this question in the context of low to middle income countries, where pathways and processes may differ from those in higher income countries. Secondly, we examine the relationship between income inequality and high blood pressure in Colombia, a low- and middle-income country and one of the most economically unequal countries in the world, where cardiovascular disease is the leading cause of death 21,22, and a quarter of the adult population meet criteria for having hypertension 23.
We tested the conceptual model in Figure 1 examining three specific research questions. First, is there an association between income inequality and high blood pressure at the departmental level in a national Colombian sample of adults and, if so, is this association stronger for longer compared to shorter time lags? Does the inequality degree in income influence cardiovascular risk above and beyond indicators of economic development? And, finally, does the association between income

INCOME INEQUALITY AND HIGH BLOOD PRESSURE 3
Cad. Saúde Pública 2017; 33(11):e00172316
inequality and high blood pressure remain after accounting for poverty concentration at the munici-pal level and socioeconomic position indicators measured at the individual level?
Methods
Study and data sources
Data came from several sources. Individual-level data came from the Colombian National Survey of Health (CNSH-2007). CNSH-2007 was a cross-sectional study that analyzed the health status of the civilian, non-institutionalized Colombian population aged 0-69 years 24. From this sample, analyses were restricted to a subsample of 13,301 men and women aged 18-69 who participated in both the interview and clinical component of the CNSH-2007. Data for departments (Colombia’s names for states or provinces in other countries) and municipalities were obtained from the last two Colombian national censuses (1993 and 2005), and from official reports. The study was approved by the Univer-sity of Michigan Institutional Review Board.
Measures
• Outcomes
Blood pressure was modeled as a continuous outcome variable, systolic blood pressure (SBP), and also as a binary variable (hypertension) that was defined as SBP ≥ 140mmHg, or diastolic blood pressure ≥ 90mmHg or self-reported use of antihypertensive medication. Systolic and diastolic blood pres-sure were taken from the clinical component of the CNSH-2007. These variables were measured in one single occasion with participants seated quietly and using a digital sphygmomanometer Omron HEM-714.
• Independentvariables
The Gini coefficient was used to measure income inequality at the department level (similar to states in the U.S. context), as suggested in previous research 8. The Gini coefficient ranges from 0 (absence of
Figure 1
Conceptual model of the study.

Lucumi DI et al.4
Cad. Saúde Pública 2017; 33(11):e00172316
inequality) to 1 (maximum inequality). Similarly to previous studies, the Gini coefficient was rescaled to range between 0 and 20 8,20. The Gini coefficients for each department, calculated for 1994, 1997, 2002 and 2007, were used in the analysis to correspond to latency periods for income inequality of 13, 10, 5, and 2 year lags, respectively. Information on the Gini coefficient for the 8 Colombian depart-ments created after the Constitution of 1991 were not disaggregated in 1994 and 1997. Thus, new departments were assigned and the Gini coefficient estimated for them as a whole. No disaggregated nor combined Gini coefficient was available for these 8 departments between 2002 and 2007. Conse-quently, the analysis for these years was restricted to the 24 departments that existed in 1991 and the Capital District. To have the possibility of non-linear relationships, we modeled Gini coefficients as quintile categories (with the highest quintile as the referent). Due to the lack of available data, no vari-able was included to adjust for potential interdepartamental mobility to address the issue of exposure time to income inequality as suggested in previous research 20.
Gross domestic product (GDP) per capita was measured at the departmental level. GDP per capita for 1994, 1997, 2002 and 2007 was available in Colombian pesos and then divided by 100,000. For poverty concentration – the only municipal-level variable in this study –, we used the index of unsatisfied or unmet basic needs (IUBN). This index includes indicators such as inadequate housing, housing with critical overcrowding, housing with inadequate services, households with high levels of economic dependence, and households with school-age children not enrolled in school. The IUBN index serves as a proxy for income, and incorporates non-monetary aspects of economic well-being and basic service availability. The groups that do not reach the minimum threshold are classified as poor. The data used to calculate the proportion of people in each municipality considered “poor”, according to the IUBN, were derived from the 1993 and 2005 national censuses. GDP per capita and IUBN were modeled as continuous variables.
Educational attainment was divided into less than primary, primary, high school, and higher than high school (reference). Physical capital was a summary measure of 15 household assets (e.g., refrigerator, car), 19 characteristics of housing quality (e.g., floor materials), and overcrowding. The composite measure used in this analysis was the first component of a principal component analysis, divided into tertiles, with the highest tertile serving as the reference category.
• Covariates
Age, in years, was a control variable in all multivariate models. Self-reported ethnicity/race (indig-enous population, blacks, and mixed, defined as those who did not report belonging to any ethnic/racial group), health insurance (yes = referent), and living in rural areas (yes = referent) were used to examine changes in the direction and strength of the associations in the final models.
Statistical analysis
We stratified analyses by sex because of evidence of sex differences in the associations between eco-nomic conditions and high blood pressure 4,25. In multilevel models, 7,529 women and 5,278 men were nested within municipalities (n = 235 for women; 232 for men), nested within 32 departments and the Capital District. Because sampling weights for municipalities were not reported and the intent of this study is to estimate associations rather than estimate hypertension prevalence, sampling weights were not used in the analyses, following the approach of previous multilevel studies 25,26.
After calculating univariate descriptive statistics, we examined the association between income inequality and SBP and hypertension at different time lags. To do this, we regressed the outcome on the Gini coefficient as a continuous and ordinal variable for each year lag adjusting for age. This allows us to examine the first question of whether this association is stronger for a longer time lag than for shorter time lags. We chose the time lag with the strongest association between income inequality and high blood pressure for subsequent analysis.
An unconditional linear or logistic regression model was fit for each outcome variable to esti-mate the intraclass correlation coefficient (ICC), an estimate of variation in the outcome variable, attributable to the department-level variation. Unlike multilevel models with a continuous dependent variable, in multilevel logistic regression analyses the ICC estimation is not straightforward. Thus,

INCOME INEQUALITY AND HIGH BLOOD PRESSURE 5
Cad. Saúde Pública 2017; 33(11):e00172316
for variance estimation with hypertension as outcome variable, we used the latent variable method, where the individual level variance is equal to π2/3 (that is, 3.29).
We fit four subsequent age-adjusted multilevel models. To complete the answer to the first ques-tion we obtained the total effect of income inequality by estimating in model 1 the association of this variable with our two blood pressure variables: SBP and hypertension. For this analysis we used the time lag of income inequality with the strongest association with the blood pressure variables, based on the results of the previous steps. To address the second question, in model 2 we included the GDP per capita variable for the same year as the income inequality variable. This allowed us to test whether the association between income inequality and high blood pressure remain statistically significant after accounting for economic development at the departmental level. To address our third ques-tion, model 3 included poverty concentration, measured at the closest year of the selected year lag of income inequality, and model 4 added educational attainment and physical capital. Analyses were conducted in Stata Release 13 (StataCorp LP, College Station, USA).
Results
Descriptive statistics are shown in Table 1. Results are presented as unweighted sample frequencies, means, and proportions. The mean age was similar for both sexes (38 years). Mixed population was the largest ethnic/race group for both sexes, and almost 60% of the participants had completed at least high school diploma. For both men and women, a greater proportion of participants were in the low-est tertile of physical capital. There was substantial variation in income inequality, GDP per capita, and poverty concentration across geographic areas. The range of income inequality in Colombian departments did not substantially change and did not show any clear trend between 1994 and 2005.
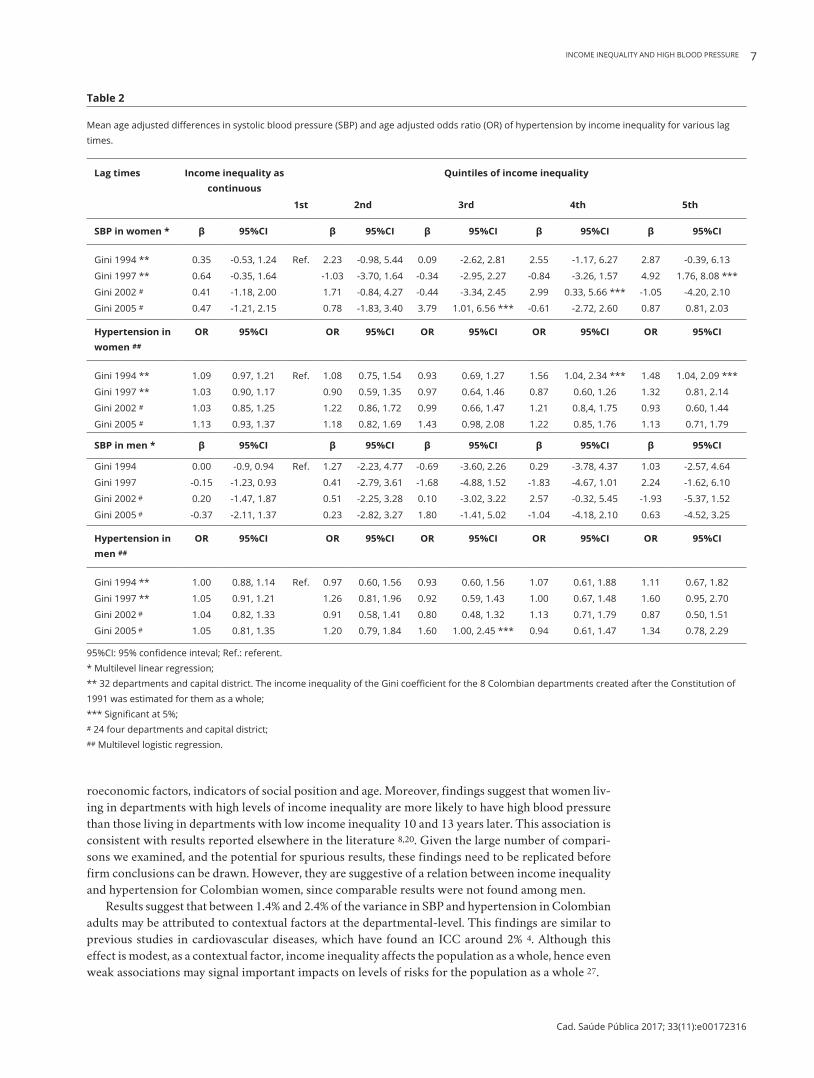
For women, living in the highest quintile of income inequality in 1997 was associated with higher systolic blood pressure in 2007. Living in the two highest quintiles of income inequality in 1994 was associated with higher odds of hypertension in 2007. For men, we did not found any association of income inequality as a continuous or ordinal variable with systolic blood pressure or hypertension for any lag time (Table 2). For comparison purposes, subsequent adjusted analyses for men used the same lag times as those identified as predictive in women.
Based on the unconditional models, the estimated ICC for SBP at the department level was 1.4% for women and 1.7% for men. For hypertension, the ICC was 2.0 for women and 2.3 for men.
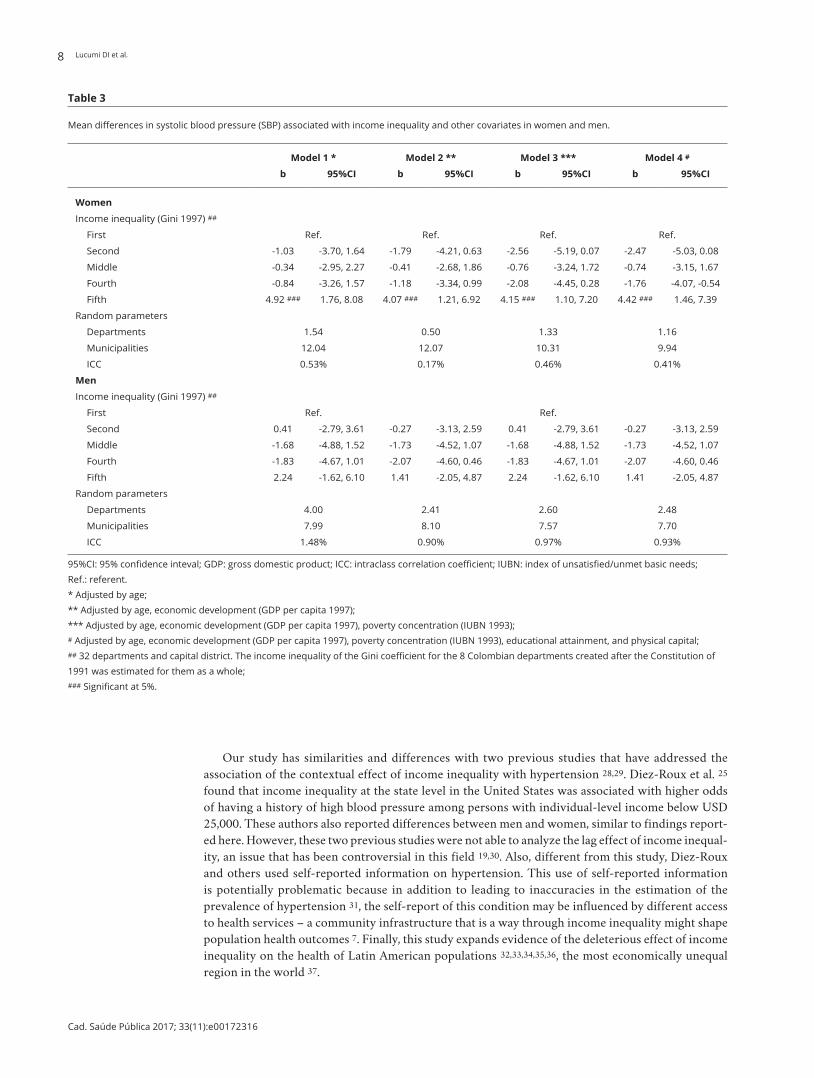
Table 3 shows adjusted results from linear multilevel regression among women. After adjusting for education and physical capital and other relevant covariates in the model, women living in depart-ments with the highest quintile of income inequality in 1997 (10-year lag time) had higher SBP than their counterparts living in the lowest quintile of income inequality in the same year (4.42; 95%CI: 1.46, 7.39). However, no trend across quintiles was observed. Among men, income inequality was not associated with SBP (Table 3).
Women living in departments that were at the fourth and fifth quintile of income inequality in 1994 (13-year lag time) were more likely to have hypertension than those living in departments at the first quintile in the same year (OR: 1.56; 95%CI: 1.04, 2.34 and OR: 1.48; 95%CI: 1.04, 2.09, respec-tively) (Table 4). This association was statistically significant and did not substantially change after adjusting other variables in the model. The multilevel logistic regressions of hypertension for men are shown in Table 4. Neither marginal nor statistically significant associations were found for the Gini coefficient in 1994.
With just one exception, no substantial changes were observed in the final models for men and women after adjusting for race/ethnicity, health insurance and rural area. The one exception was a protective effect of intermediate inequality levels (tertile 3) on SBP in women after accounting for these additional covariates (results not shown).

Lucumi DI et al.6
Cad. Saúde Pública 2017; 33(11):e00172316
Table 1
Descriptive statistics of Colombian adult respondents aged 30-69 and stratified by sex, 2007.
Variable Men Women
n Mean (SD) or % n Mean (SD) or %
Level 1: individuals
age (years) 7,571 37.82 5,307 37.67
ethnicity/race
indigenous group 559 7.39 449 8.48
Black 859 11.36 706 11.36
Mixed 6,144 81.25 4,140 78.19
educational attainment
less than elementary 500 6.60 364 6.86
Primary (5 years) 2,598 34.32 1,902 35.84
High school (11 years) 3,558 47.00 2,500 47.11
More high school (≥ 12 years) 915 12.09 541 10.19
Physical capital
First 3,043 40.19 2,322 43.75
Second 2,500 33.02 1,674 31.54
third 2,028 26.79 1,311 24.70
Covered health insurance
Yes 5,768 76.19 3,820 71.98
Place of residence
Urban 6,043 79.82 4,099 77.24
Level 2: municipalities *
Poverty concentration
iUBN 1993 (range: 9.15-100.00) 7,529 44.15 (22.53) 5,278 45.38 (22.96)
iUBN 2005 (range: 5.43-100.00) 7,571 34.92 (21.53) 5,307 35.89 (21.83)
Level 3: departments
income inequality
Gini 1994 **,*** (range: 7.10-12.30) 7,571 9.9 (1.17) 5,307 9.89 (1.17)
Gini 1997 **,*** (range: 8.66-13.34) 7,571 10.97 (0.98) 5,307 10.96 (0.97)
Gini 2002 **,# (range: 9.41-11.91) 6,505 10.58 (0.66) 4,575 10.59 (0.65)
Gini 2005 **,# (range: 9.11-11.57) 6,505 10.26 (0.65) 4,575 10.25 (0.65)
economic development
GDP per capita 1994 ## (range: 6.82- 38.63) 7,571 16.17 (7.00) 5,307 15.99 (6.96)
GDP per capita 1997 ## (range: 10.89-84.96) 7,571 27.38 (12.84) 5,307 27.08 (12.82)
GDP per capita 2002 ## (range: 18.39-161.05) 7,571 41.49 (20.08) 5,307 41.21 (20.12)
GDP per capita 2005 ## (range: 20.11-214.74) 7,571 54.93 (27.30) 5,307 54.62 (27.25)
GDP: gross domestic product; IUBN: index of unsatisfied/unmet basic needs; SD: standard deviation. * n = 235 women; n = 232 men; ** Originally 0.00-1.00 and rescaled to 0.00-20.00; *** n = 33; # n = 25; ## In COP divide by 100,000.
Discussion
To the best of our knowledge, no previous studies in Latin American have examined the association between income inequality and high blood pressure, a key risk factor for cardiovascular disease 1. This study yields several important findings. Among women, high income inequality was statistically and significantly associated with higher SBP and higher odds of hypertension, over and above other mac-
INCOME INEQUALITY AND HIGH BLOOD PRESSURE 7
Cad. Saúde Pública 2017; 33(11):e00172316
Table 2
Mean age adjusted differences in systolic blood pressure (SBP) and age adjusted odds ratio (OR) of hypertension by income inequality for various lag times.
Lag times Income inequality as continuous
Quintiles of income inequality
1st 2nd 3rd 4th 5th
SBP in women * β 95%CI β 95%CI β 95%CI β 95%CI β 95%CI
Gini 1994 ** 0.35 -0.53, 1.24 ref. 2.23 -0.98, 5.44 0.09 -2.62, 2.81 2.55 -1.17, 6.27 2.87 -0.39, 6.13
Gini 1997 ** 0.64 -0.35, 1.64 -1.03 -3.70, 1.64 -0.34 -2.95, 2.27 -0.84 -3.26, 1.57 4.92 1.76, 8.08 ***
Gini 2002 # 0.41 -1.18, 2.00 1.71 -0.84, 4.27 -0.44 -3.34, 2.45 2.99 0.33, 5.66 *** -1.05 -4.20, 2.10
Gini 2005 # 0.47 -1.21, 2.15 0.78 -1.83, 3.40 3.79 1.01, 6.56 *** -0.61 -2.72, 2.60 0.87 0.81, 2.03
Hypertension in women ##
OR 95%CI OR 95%CI OR 95%CI OR 95%CI OR 95%CI
Gini 1994 ** 1.09 0.97, 1.21 ref. 1.08 0.75, 1.54 0.93 0.69, 1.27 1.56 1.04, 2.34 *** 1.48 1.04, 2.09 ***
Gini 1997 ** 1.03 0.90, 1.17 0.90 0.59, 1.35 0.97 0.64, 1.46 0.87 0.60, 1.26 1.32 0.81, 2.14
Gini 2002 # 1.03 0.85, 1.25 1.22 0.86, 1.72 0.99 0.66, 1.47 1.21 0.8,4, 1.75 0.93 0.60, 1.44
Gini 2005 # 1.13 0.93, 1.37 1.18 0.82, 1.69 1.43 0.98, 2.08 1.22 0.85, 1.76 1.13 0.71, 1.79
SBP in men * β 95%CI β 95%CI β 95%CI β 95%CI β 95%CI
Gini 1994 0.00 -0.9, 0.94 ref. 1.27 -2.23, 4.77 -0.69 -3.60, 2.26 0.29 -3.78, 4.37 1.03 -2.57, 4.64
Gini 1997 -0.15 -1.23, 0.93 0.41 -2.79, 3.61 -1.68 -4.88, 1.52 -1.83 -4.67, 1.01 2.24 -1.62, 6.10
Gini 2002 # 0.20 -1.47, 1.87 0.51 -2.25, 3.28 0.10 -3.02, 3.22 2.57 -0.32, 5.45 -1.93 -5.37, 1.52
Gini 2005 # -0.37 -2.11, 1.37 0.23 -2.82, 3.27 1.80 -1.41, 5.02 -1.04 -4.18, 2.10 0.63 -4.52, 3.25
Hypertension in men ##
OR 95%CI OR 95%CI OR 95%CI OR 95%CI OR 95%CI
Gini 1994 ** 1.00 0.88, 1.14 ref. 0.97 0.60, 1.56 0.93 0.60, 1.56 1.07 0.61, 1.88 1.11 0.67, 1.82
Gini 1997 ** 1.05 0.91, 1.21 1.26 0.81, 1.96 0.92 0.59, 1.43 1.00 0.67, 1.48 1.60 0.95, 2.70
Gini 2002 # 1.04 0.82, 1.33 0.91 0.58, 1.41 0.80 0.48, 1.32 1.13 0.71, 1.79 0.87 0.50, 1.51
Gini 2005 # 1.05 0.81, 1.35 1.20 0.79, 1.84 1.60 1.00, 2.45 *** 0.94 0.61, 1.47 1.34 0.78, 2.29
95%CI: 95% confidence inteval; Ref.: referent. * Multilevel linear regression; ** 32 departments and capital district. The income inequality of the Gini coefficient for the 8 Colombian departments created after the Constitution of 1991 was estimated for them as a whole; *** Significant at 5%; # 24 four departments and capital district; ## Multilevel logistic regression.
roeconomic factors, indicators of social position and age. Moreover, findings suggest that women liv-ing in departments with high levels of income inequality are more likely to have high blood pressure than those living in departments with low income inequality 10 and 13 years later. This association is consistent with results reported elsewhere in the literature 8,20. Given the large number of compari-sons we examined, and the potential for spurious results, these findings need to be replicated before firm conclusions can be drawn. However, they are suggestive of a relation between income inequality and hypertension for Colombian women, since comparable results were not found among men.
Results suggest that between 1.4% and 2.4% of the variance in SBP and hypertension in Colombian adults may be attributed to contextual factors at the departmental-level. This findings are similar to previous studies in cardiovascular diseases, which have found an ICC around 2% 4. Although this effect is modest, as a contextual factor, income inequality affects the population as a whole, hence even weak associations may signal important impacts on levels of risks for the population as a whole 27.
Lucumi DI et al.8
Cad. Saúde Pública 2017; 33(11):e00172316
Table 3
Mean differences in systolic blood pressure (SBP) associated with income inequality and other covariates in women and men.
Model 1 * Model 2 ** Model 3 *** Model 4 #
b 95%CI b 95%CI b 95%CI b 95%CI
Women
income inequality (Gini 1997) ##
First ref. ref. ref. ref.
Second -1.03 -3.70, 1.64 -1.79 -4.21, 0.63 -2.56 -5.19, 0.07 -2.47 -5.03, 0.08
Middle -0.34 -2.95, 2.27 -0.41 -2.68, 1.86 -0.76 -3.24, 1.72 -0.74 -3.15, 1.67
Fourth -0.84 -3.26, 1.57 -1.18 -3.34, 0.99 -2.08 -4.45, 0.28 -1.76 -4.07, -0.54
Fifth 4.92 ### 1.76, 8.08 4.07 ### 1.21, 6.92 4.15 ### 1.10, 7.20 4.42 ### 1.46, 7.39
random parameters
Departments 1.54 0.50 1.33 1.16
Municipalities 12.04 12.07 10.31 9.94
iCC 0.53% 0.17% 0.46% 0.41%
Men
income inequality (Gini 1997) ##
First ref. ref.
Second 0.41 -2.79, 3.61 -0.27 -3.13, 2.59 0.41 -2.79, 3.61 -0.27 -3.13, 2.59
Middle -1.68 -4.88, 1.52 -1.73 -4.52, 1.07 -1.68 -4.88, 1.52 -1.73 -4.52, 1.07
Fourth -1.83 -4.67, 1.01 -2.07 -4.60, 0.46 -1.83 -4.67, 1.01 -2.07 -4.60, 0.46
Fifth 2.24 -1.62, 6.10 1.41 -2.05, 4.87 2.24 -1.62, 6.10 1.41 -2.05, 4.87
random parameters
Departments 4.00 2.41 2.60 2.48
Municipalities 7.99 8.10 7.57 7.70
iCC 1.48% 0.90% 0.97% 0.93%
95%CI: 95% confidence inteval; GDP: gross domestic product; ICC: intraclass correlation coefficient; IUBN: index of unsatisfied/unmet basic needs; ref.: referent. * adjusted by age; ** Adjusted by age, economic development (GDP per capita 1997); *** Adjusted by age, economic development (GDP per capita 1997), poverty concentration (IUBN 1993); # Adjusted by age, economic development (GDP per capita 1997), poverty concentration (IUBN 1993), educational attainment, and physical capital; ## 32 departments and capital district. The income inequality of the Gini coefficient for the 8 Colombian departments created after the Constitution of 1991 was estimated for them as a whole; ### Significant at 5%.
Our study has similarities and differences with two previous studies that have addressed the association of the contextual effect of income inequality with hypertension 28,29. Diez-Roux et al. 25 found that income inequality at the state level in the United States was associated with higher odds of having a history of high blood pressure among persons with individual-level income below USD 25,000. These authors also reported differences between men and women, similar to findings report-ed here. However, these two previous studies were not able to analyze the lag effect of income inequal-ity, an issue that has been controversial in this field 19,30. Also, different from this study, Diez-Roux and others used self-reported information on hypertension. This use of self-reported information is potentially problematic because in addition to leading to inaccuracies in the estimation of the prevalence of hypertension 31, the self-report of this condition may be influenced by different access to health services – a community infrastructure that is a way through income inequality might shape population health outcomes 7. Finally, this study expands evidence of the deleterious effect of income inequality on the health of Latin American populations 32,33,34,35,36, the most economically unequal region in the world 37.

INCOME INEQUALITY AND HIGH BLOOD PRESSURE 9
Cad. Saúde Pública 2017; 33(11):e00172316
Table 4
Odds ratios of hypertension associated with contextual and individual level variables for women and men.
Model 1 * Model 2 ** Model 3 *** Model 4 #
b 95%CI b 95%CI b 95%CI b 95%CI
Women
income inequality (Gini 1994) ##
First ref. ref. ref. ref.
Second 1.08 0.75-1.54 1.03 0.74-1.44 1.03 0.74-1.44 1.04 0.73-1.47
Middle 0.93 0.69-1.27 0.95 0.72-1.26 0.94 0.71-1.26 0.96 0.71-1.29
Fourth 1.56 ### 1.04-2.34 1.51 ### 1.05-2.19 1.51 ### 1.04-2.19 1.56 ### 1.06-2.30
Fifth 1.48 ### 1.04-2.09 1.53 ### 1.11-2.10 1.53 ### 1.11-2.11 1.52 ### 1.09-2.13
random parameters
Departments 0.02 0.01 0.01 0.02
Municipalities 0.15 0.15 0.15 0.14
iCC 0.57 0.25% 0.25% 0.58%
Men
income inequality (Gini 1994) ##
First ref. ref.
Second 0.97 0.60-1.56 0.93 0.58-1.47 0.92 0 .58-1.47 0.92 0.58-1.47
Middle 0.93 0.62-1.39 0.94 0.64-1.40 0.93 0.63-1.39 0.95 0.64-1.42
Fourth 1.07 0.61-1.88 1.04 0.61-1.77 1.04 0.60-1.78 1.03 0.60-1.76
Fifth 1.11 0.67-1.82 1.12 0.70-1.79 1.12 0.70-1.81 1.11 0.69-1.79
random parameters
Departments 0.08 0.10 0.08 0.09
Municipalities 0.10 0.13 0.14 0.14
iCC 2.31 2.84% 2.27 2.56%
95%CI: 95% confidence inteval; GDP: gross domestic product; ICC: intraclass correlation coefficient; IUBN: index of unsatisfied/unmet basic needs; ref.: referent. * adjusted by age; ** Adjusted by age, economic development (GDP per capita 1994); *** Adjusted by age, economic development (GDP per capita 1994), poverty concentration (IUBN 1993); # Adjusted by age, economic development (GDP per capita 1994), poverty concentration (IUBN 1993), educational attainment, and physical capital; ## 32 departments and capital district. The income inequality of the Gini coefficient for the 8 Colombian departments created after the Constitution of 1991 was estimated for them as a whole; ### Significant at 5%.
Others have also reported gender differences in the relationship between income inequality and health outcomes. For example, Chen et al. 38 reported gender differences in the association between income inequality and health insurance and vaccination. They explained these results as linked to the unequal distribution by gender of benefits of social welfare policies and differences in the awareness and access to preventive programs. All these results are consistent with the evidence from the general health literature that shows a stronger association between individual- and contextual-level socioeco-nomic factors and health among women compared with men.
Several gaps remain in understanding the association between income inequality and health. Some examples illustrate areas of further inquiry. Theoretical explanations for the gender differences observed in this study are necessary, as are empirical models testing those potential pathways. These differences may be associated with social, structural and psychosocial determinants for women, while greater salience of behavioral factors have been related to health outcomes among men 39. In addition, the mechanisms through which income inequality influence health is an area that deserves more attention. Furthermore, studies may build upon these findings to examine both the specific and
Lucumi DI et al.10
Cad. Saúde Pública 2017; 33(11):e00172316
combined contribution of the three mechanisms that have been proposed for explaining the associa-tion between income inequalities on health.
Among the mechanisms proposed to explain the association between income inequality and high blood pressure, the findings reported here are consistent with neomaterial pathways that emphasizes unequal contextual characteristics and availability of health-supportive infrastructure such as trans-portation, food availability and recreational facilities and opportunities among Colombian depart-ments. Income inequality may influence local infrastructure and material assets that play a key role in the adoption and maintenance of behaviors associated to high blood pressure. However, according to the neomaterial explanation income inequality also influences the private resources held by indi-viduals such as education 27. Our findings do not give strong support for this pathway, as associa-tions between income inequality and high blood pressure remained unchanged after accounting for education and relevant markers of material resources, such as physical capital. However, due to data limitations in this analysis we were not able to test all three mechanisms proposed for the relationship between income inequality and hypertension.
This study has several limitations. First, we were not able to include measurements of income inequality at the municipal level. However, as has been reported in the previous literature, the poten-tial effect of income inequality on health should be examined at the state levels (departments of Colombia) as it reflects political mechanisms, such as the disparities between states in spending in social goods such as healthcare, education, and welfare 8. Secondly, although we adjusted several socioeconomic indicators at different levels, we did not adjust income at the individual level. In addi-tion to the limitations of having accurate measurements of income, the inclusion in our analyses of income at the individual level, similarly to some of the indicators, may generate controversy because it is not clear if individual income works as a genuine confounder or mediating variable 9. Thirdly, because of data limitations we were not able to directly adjust population movement across depart-ments during the time period under study. However, as people tend to move to areas with better economic conditions we assume that the limitation of our analysis goes in the direction of a likely underestimation of the results.
That being said, we have to be cautious about the current results, and future research should, if possible, adjust interdepartamental mobility to test our hypothesis of underestimation of the current findings. This would mean that if those people in the most economically unequal departments have to stay there due to limited resources and opportunities for their mobility to the most equal areas, that noxious exposures should lead to a stronger association between income inequality and hypertension. Fourthly, although CNSH-2007 did not include the eldest population (≥ 70 years old), who almost always have higher prevalence of hypertension than the youngest groups, the evidence suggests that elderly health is influenced by contextual factor including income inequality as found in Brazil 32, a country with similar Gini coefficient found for Colombia. Future studies, if data on hypertension in a national survey is available for this population, should address this limitation. Finally, although the data of high blood pressure used in this study were collected almost ten years ago, there is not current comparable evidence that allows us to examine changes in the prevalence of hypertension among all Colombian departments. That being said, no relevant changes in the inequality in Colombia have been reported in the last decades.
Conclusion
Our findings are consistent with the hypothesis that income inequality is associated with increased risk of high blood pressure, and this association is significant after accounting for other relevant variables. Although both the ICC and size of the association between income inequality and high blood pressure were modest, this association may lead to a considerable population burden of high blood pressure and cardiovascular morbidity and mortality, as income inequality is a contextual fac-tor that applies to the overall Colombian population. Further research to examine more explicitly the pathways through which income inequality is associated with high blood pressure will be helpful in identifying potential points of intervention.

INCOME INEQUALITY AND HIGH BLOOD PRESSURE 11
Cad. Saúde Pública 2017; 33(11):e00172316
Contributors
D. I. Lucumi conceptualized, conducted the analy-sis, and contributed to the interpretation and writ-ing. A. J. Schulz provided conceptual guidance to the conceptualization, contributed to the interpretation and writing, and edited the article. A. V. Diez Roux and A. Grogan-Kaylor contributed to the interpre-tation and writing and edited the article.
Acknowledgments
D. I. Lucumi received funds for his doctoral disser-tation from Fulbright Colombia, Ministry of Edu-cation of Colombia, National Department of Sci-ence, Technology and Innovation (COLCIENCIAS), and International Development Research Centre (IDRC).
References
1. Lawes CMM, Vander Hoorn S, Rodgers A; In-ternational Society of Hypertension. Global burden of blood-pressure-related disease, 2001. Lancet 2008; 371:1513-8.
2. Ibrahim MM, Damasceno A. Hypertension in developing countries. Lancet 2012; 380:611-9.
3. Leal C, Chaix B. The influence of geographic life environments on cardiometabolic risk fac-tors: a systematic review, a methodological assessment and a research agenda. Obes Rev 2011; 12:217-30.
4. Matheson FI, White HL, Moineddin R, Dunn JR, Glazier RH. Neighbourhood chronic stress and gender inequalities in hypertension among Canadian adults: a multilevel analy-sis. J Epidemiol Community Health 2010; 64: 705-13.
5. Reddy KS, Naik N, Prabhakaran D. Hyperten-sion in the developing world: a consequence of progress. Curr Cardiol Rep 2006; 8:399-404.
6. Subramanian SV, Belli P, Kawachi I. The mac-roeconomic determinants of health. Annu Rev Public Health 2002; 23:287-302.
7. Lynch J. Income inequality and health: expand-ing the debate. Soc Sci Med 2000; 51:1001-5.
8. Subramanian SV, Kawachi I. Income inequality and health: what have we learned so far? Epi-demiol Rev 2004; 26:78-91.
9. Wilkinson RG, Pickett KE. Income inequal-ity and population health: a review and ex-planation of the evidence. Soc Sci Med 2006; 62:1768-84.
10. Pickett K, Wilkinson R. Income inequality and health: a causal review. Soc Sci Med 2015; 128:316-26.
11. Kawachi I, Subramanian SV, Almeida-Filho N. A glossary for health inequalities. J Epidemiol Community Health 2002; 56:647-52.
12. Lynch JW, Smith GD, Kaplan GA, House JS. Income inequality and mortality: importance to health of individual income, psychosocial environment, or material conditions. BMJ 2000; 320:1200-4.
13. Wilkinson RG. Socioeconomic determinants of health. Health inequalities: relative or abso-lute material standards? BMJ 1997; 314:591-5.
14. Kawachi I, Kennedy BP. Income inequality and health: pathways and mechanisms. Health Serv Res 1999; 34:215-27.
15. Hamano T, Fujisawa Y, Yamasaki M, Ito K, Nabika T, Shiwaku K. Contributions of so-cial context to blood pressure: findings from a multilevel analysis of social capital and sys-tolic blood pressure. Am J Hypertens 2011; 24: 643-6.
16. Kaplan GA, Pamuk ER, Lynch JW, Cohen RD, Balfour JL. Inequality in income and mortality in the United States: analysis of mortality and potential pathways. BMJ 1996; 312:999-1003.
17. Bartley M. Health inequality: an introduction to theories, concepts and methods. Oxford: Polity Press; 2004.
Lucumi DI et al.12
Cad. Saúde Pública 2017; 33(11):e00172316
18. Sparrenberger F, Cichelero FT, Ascoli AM, Fonseca FP, Weiss G, Berwanger O. Does psy-chosocial stress cause hypertension? A system-atic review of observational studies. J Hum Hypertens 2009; 23:12-9.
19. Mellor JM, Milyo J. Is exposure to income in-equality a public health concern? Lagged ef-fects of income inequality on individual and population health. Health Serv Res 2003; 38:137-51.
20. Gadalla TM, Fuller-Thomson E. Examin-ing the lag time between state-level income inequality and individual disabilities: a mul-tilevel analysis. Am J Public Health 2008; 98: 2187-90.
21. Martínez E, Díaz P. Morbilidad y mortalidad de la población colombiana. Bogotá: Ministe-rio de la Protección Social/Universidad de An-tioquia; 2010.
22. Martinez JC. Factores asociados a la morta-lidad por enfermedades no transmisibles en Colombia, 2008-2012. Biomedica 2016; 36: 535-46.
23. Lucumi D. Disparities in hypertension in Co-lombia: a mixed-methods-study [PhD Thesis]. Ann Arbor: University of Michigan; 2014.
24. Rodríguez J, Ruiz F, Peñaloza E, Eslava J, Gó-mez LC, Sánchez H, et al. Encuesta nacional de salud 2007. Resultados nacionales. Bogotá: Fundación Cultural Javeriana de Artes Gráfi-cas; 2009.
25. Diez-Roux AV, Link BG, Northridge ME. A multilevel analysis of income inequality and cardiovascular disease risk factors. Soc Sci Med 2000; 50:673-87.
26. Celeste RK, Nadanovsky P. How much of the income inequality effect can be explained by public policy? Evidence from oral health in Brazil. Health Policy 2010; 97:250-8.
27. Lynch J, Smith GD, Harper S, Hillemeier M, Ross N, Kaplan GA, et al. Is income inequality a determinant of population health? Part 1. A systematic review. Milbank Q 2004; 82:5-99.
28. Chen Z, Meltzer D. Beefing up with the chans: evidence for the eeffects of relative income and income inequality on health from the China Health and Nutrition Survey. Soc Sci Med 2008; 66:2206-17.
29. Diez-Roux AV. Multilevel analysis in public health research. Annu Rev Public Health 2000; 21:171-92.
30. Subramanian SV, Blakely T, Kawachi I. Income inequality as a public health concern: where do we stand? Commentary on “Is Exposure to Income Inequality a Public Health Concern?”. Health Serv Res 2003; 38:153-67.
31. Mentz G, Schulz AJ, Mukherjee B, Raguna-than TE, Perkins DW, Israel BA. Hypertension: development of a prediction model to adjust self-reported hypertension prevalence at the community level. BMC Health Serv Res 2012; 12:312.
32. Chiavegatto Filho AD, Lebrao ML, Kawachi I. Income inequality and elderly self-rated health in Sao Paulo, Brazil. Ann Epidemiol 2012; 22:863-7.
33. Rasella D, Aquino R, Barreto ML. Impact of in-come inequality on life expectancy in a highly unequal developing country: the case of Brazil. J Epidemiol Community Health 2013; 67:661-6.
34. Larrea C, Kawachi I. Does economic inequality affect child malnutrition? The case of Ecuador. Soc Sci Med 2005; 60:165-78.
35. De Maio FG, Linetzky B, Ferrante D, Fleischer NL. Extending the income inequality hypoth-esis: ecological results from the 2005 and 2009 Argentine National Risk Factor Surveys. Glob Public Health 2012; 7:635-47.
36. Subramanian SV, Delgado I, Jadue L, Vega J, Kawachi I. Income inequality and health: mul-tilevel analysis of Chilean communities. J Epi-demiol Community Health 2003; 57:844-8.
37. González I, Martner R. Overcoming the “emp-ty box syndrome”. Determinants of income distribution in Latin America. CEPAL Review 2012; 108:7-25.
38. Chen Z, Gotway Crawford CA. The role of geographic scale in testing the income inequal-ity hypothesis as an explanation of health dis-parities. Soc Sci Med 2012; 75:1022-31.
39. Moss NE. Gender equity and socioeconomic inequality: a framework for the patterning of women’s health. Soc Sci Med 2002; 54:649-61.

INCOME INEQUALITY AND HIGH BLOOD PRESSURE 13
Cad. Saúde Pública 2017; 33(11):e00172316
Resumen
El objetivo de este estudio fue examinar la asocia-ción entre desigualdad de renta e hipertensión ar-terial en Colombia. Usando una muestra nacional representativa de adultos colombianos, y datos de los departamentos (estados) y municipios, proba-mos modelos lineales y logísticos multinivel, estra-tificados para el género, con la presión arterial co-mo variable continua y binaria, respectivamente. En los modelos ajustados, las mujeres que residían en departamentos del país con el quintil más alto de desigualdad de renta en 1997 presentaban pre-sión arterial sistólica más elevada que las mujeres que residían en el quintil más bajo de desigualdad de renta (diferencia media de 4,42mmHg; IC95%: 1,46, 7,39). Las mujeres que residían en departa-mentos en el cuarto y quinto quintiles de desigual-dad de renta en 1994 tenían una mayor probabili-dad de presentar hipertensión arterial que aquellas en departamentos en el primer quintil durante el mismo año (OR: 1,56 y 1,48, respectivamente). En los hombres, no se observaron asociaciones entre desigualdad de renta y presión sistólica o hiper-tensión arterial. Nuestros hallazgos corroboran la hipótesis de la asociación entre desigualdad de renta y aumento de riesgo de hipertensión arterial en mujeres. Se necesitan más estudios para anali-zar los vínculos entre la desigualdad de renta y la hipertensión arterial en Colombia.
Hipertensión; Inequidad Social; Análisis Multinível
Resumo
Este estudo teve como objetivo examinar a asso-ciação entre desigualdade de renda e hipertensão arterial na Colômbia. Usando uma amostra na-cional representativa de adultos colombianos e dados dos departamentos (estados) e municípios, testamos modelos lineares e logísticos multinível, estratificados para gênero, com a pressão arterial como variável contínua e binária, respectiva-mente. Nos modelos ajustados, as mulheres que residiam em departamentos do país com o quintil mais alto de desigualdade de renda em 1997 apre-sentavam pressão arterial sistólica mais elevada do que as mulheres que residiam no quintil mais baixo de desigualdade de renda (diferença média de 4,42mmHg; IC95%: 1,46, 7,39). As mulheres que residiam em departamentos no quarto e quinto quintis de desigualdade de renda em 1994 tinham maior probabilidade de apresentar hipertensão arterial do que aquelas em departamentos no pri-meiro quintil no mesmo ano (OR: 1,56 e 1,48, res-pectivamente). Nos homens, não foram observadas associações entre desigualdade de renda e pressão sistólica ou hipertensão arterial. Nossos achados corroboram a hipótese da associação entre desi-gualdade de renda e aumento de risco de hiper-tensão arterial em mulheres. São necessários mais estudos para analisar os elos entre a desigualdade de renda e a hipertensão arterial na Colômbia.
Hipertensão; Iniquidade Social; Análise Multinível
Submitted on 11/Oct/2016Final version resubmitted on 25/Jan/2017Approved on 08/Mar/2017