Inclusive National Accounts: Introduction...Inclusive National Accounts: Introduction In contrast,...
40
Inclusive National Accounts: Introduction Partha Dasgupta Working Paper, No 67–12
Transcript of Inclusive National Accounts: Introduction...Inclusive National Accounts: Introduction In contrast,...

Inclusive National Accounts: Introduction
Partha Dasgupta
Working Paper, No 67–12

Published by the South Asian Network for Development and Environmental Economics (SANDEE)PO Box 8975, EPC 1056, Kathmandu, Nepal.Tel: 977-1-5003222 Fax: 977-1-5003299
SANDEE research reports are the output of research projects supported by the SouthAsian Network for Development and Environmental Economics. The reports have beenpeer reviewed and edited. A summary of the findings of SANDEE reports are alsoavailable as SANDEE Policy Briefs.
National Library of Nepal Catalogue Service:
Partha Dasgupta Inclusive National Accounts: Introduction
(SANDEE Working Papers, ISSN 1893-1891; WP 67–12)
ISBN: 978- 9937-8521-5-9
SANDEE Working Paper No. 67–12

Inclusive National Accounts: Introduction
Partha DasguptaUniversity of Cambridge andUniversity of ManchesterLondon, UK
January 2012
South Asian Network for Development and Environmental Economics (SANDEE) PO Box 8975, EPC 1056, Kathmandu, Nepal
SANDEE Working Paper No. 67–12

The South Asian Network for Development and Environmental Economics
The South Asian Network for Development and Environmental Economics (SANDEE) is a regional network that brings together analysts from different countries in South Asia to address environment-development problems. SANDEE’s activities include research support, training, and information dissemination. Please see www.sandeeonline.org for further information about SANDEE.
SANDEE is financially supported by the International Development Research Center (IDRC), The Swedish International Development Cooperation Agency (SIDA), the World Bank and the Norwegian Agency for Development Cooperation (NORAD). The opinions expressed in this paper are the author’s and do not necessarily represent those of SANDEE’s donors.
The Working Paper series is based on research funded by SANDEE and supported with technical assistance from network members, SANDEE staff and advisors.

Contents
1. Introduction 1
2. Economic Evaluation 1
2.1 Alternative Notions of Sustainable Development 2
2.2 Plan of the Paper 3
3. An Economy’s Productive Base 4
3.1 Familiar Assets 4
3.2 Institutional Capital 5
3.3 Time as an Asset 5
4. The Social Value of Capital Assets: Shadow Prices 6
5. Wealth and the Productive Base 8
5.1 Wealth as a Criterion for Sustainable Development 8
5.2 Wealth as a Criterion for Policy Evaluation 9
6. Special Issues 9
6.1 Economic Growth and the Environment: the Environmental Kuznets Curve 9
6.2 Necessities vs. Luxuries 10
6.3 Irreversible Uses 11
6.4 Substitution Possibilities 12
6.5 A Common Misconception about Wealth 13
6.6 The Attraction of Current Consumption and GDP 13
7. Reflections 14
References 16
List of Boxes
Box 1: Limitations of the Human Development Index 21
Box 2: Sustainability Criteria 22
Box 3: Types of Natural Capital 23
Box 4: Estimating Shadow Prices 25
Box 5: Valuing Natural Capital 27
Box 6: The World Ba1nk’s Approach to Sustainability Analysis 29
List of FiguresFigure 1: GDP and emissions in OECD Countries 30
Figure 2: Concentrations and sulfur dioxide 31

South Asian Network for Development and Environmental Economics6

1
Inclusive National Accounts: Introduction
Inclusive National Accounts: Introduction*
1. Introduction
People evaluate economies for prescribing and assessing, which, taken together involve five sets of questions:
(A) What does the economy look like? (B) What has it looked like in recent years? (C) What should our economic forecast be under “business as usual”? (D) How is the economy likely to perform under alternative policies? (E) What policies should be recommended for the economy?
National accounts contain information that directly addresses questions A to C. They are “descriptors” and are intended to be the raw material for economic evaluation. Unfortunately, the framework for national accounts currently in use throughout the world suffers from a narrowness in what they cover. Vast quantities of information relevant for economic evaluation do not appear in the accounts. Some don’t because the appropriate data are hard, even impossible, to collect; but others don’t only because until recently the theory of economic evaluation didn’t ask for them. The demand for green national accounts has been prompted by the recognition that contemporary accounts are an unsatisfactory basis for economic evaluation.
In this paper I provide an outline of what would ideally be needed for a comprehensive set of national accounts. National governments and international agencies ought ideally to go even beyond green national accounts. Unfortunately though, that ideal cannot be met, at least not in the near future. Nevertheless, improvements to the framework for national accounts can be made even now. Such improvements would be very partial, but would nevertheless be a significant advance.
2. Economic Evaluation
Let us call the person conducting the economic evaluation the social evaluator. The social evaluator could be a citizen, thinking about things before casting his vote on political candidates; she could be an ethicist hired to offer guidance to the government; he could be a government official; and so on. Being a social evaluator, the person accommodates the interests and desires of others, not just her own self, when engaged in evaluation exercises.
The currency in which economic evaluation is usually conducted is human well-being. Questions B to E divide into two classes of investigation. Policy evaluation, including project evaluation, addresses questions D and E. The idea is to evaluate an economy at a point in time before and after a hypothetical change (the policy change) has been made to it. Say a government official has been asked to determine whether a wetland should be drained so as to build a housing estate. The official’s task would be to assess the economy with and without the wetland conversion and to compare the two situations normatively. In principle, policy evaluation, including project evaluation, can be used to identify “optimum” development, which is a development path a society would ideally wish to follow (question E). In contrast to policy evaluation, the notion of sustainable development is prompted by questions B and C. The idea is to evaluate economic change when the change is brought about by the passage of time itself.
There is, of course, nothing novel about a focus on economic evaluation. Over the decades national governments and international agencies have routinely assessed the performance of economies. And they have always evaluated
* Paper prepared for the Expert Group on Green National Accounting for India. For their comments on the earlier version, the author is grateful to Nitin Desai, Vijay Kelkar, and Priya Shyamsundar.

South Asian Network for Development and Environmental Economics2
policies, one way or the other. But until recently those evaluations have mostly not been based on an explicit conception of human well-being. Even when they have been so based, the criteria have been ad hoc and unsuitable for sustainability analysis. In Box 1 we demonstrate the unsuitability in the case of the most well-known of such normative criteria, namely, the Human Development Index of the United Nations’ Development Programme (UNDP, 1990, and every year since then in its Human Development Report).
While the welfare economic theory that underlies policy evaluation is old (for a review, see Little and Mirrlees, 1974; Atkinson and Stiglitz, 1980), sustainability analysis is new. So, although we review the ethical core of policy evaluation here (Section 4.2), this paper focuses on sustainability analysis.
2.1 Alternative Notions of Sustainable Development
The requirement that an object should be sustained over a period of time means that it shouldn’t diminish over the period. In their classic Report, the Brundtland Commission (World Commission, 1987) re-cast questions B and C by interpreting the object of interest as human needs. The Report defined sustainable development as “... development that meets the needs of the present without compromising the ability of future generations to meet their own needs.”
Say an economy has been enjoying economic growth by investing in buildings, factories, mines, and transport facilities. If those investments have been accompanied by a depletion of the economy’s forests, wetlands, and aquifers, the social evaluator should ask whether economic growth there is sustainable or whether future needs will be compromised. The widespread acknowledgement today that national accounts should include the use and depletion of “natural capital” can be traced to that Report.
Notice that the quoted passage from the Brundtland Commission Report mentions human needs, not human well-being. We are to assume that sustainable development requires that future generations will have no less of the means to meet their needs than we do ourselves; it doesn’t ask for more. As needs are the austere component of well-being, a country’s economic development could be sustainable in the Commission’s sense without it being judged to be optimal.
Notice also that the Commission’s definition is directed at sustaining the factors required to satisfy human needs (food, clothing, shelter, personal relationships, leisure activities). But those factors would be available only if the society in question were to possess adequate quantities of capital assets to produce them. Sustainable development therefore requires that relative to their populations, each generation should bequeath to its successor at least as large a quantity of what may be called a society’s productive base as it had itself inherited from its predecessor. The social evaluator’s task then is to measure the productive base in such a way that its movement through time tracks movements in human well-being exactly. It transpires that conceptually there is a very simple way to do that. The required measure of an economy’s productive base is its wealth.
In contrast to the Brundtland Commission’s Report, the economics literature on sustainable development has taken human well-being to be the direct object of interest. Two alternative formulations have been explored: current well-being and intergenerational well-being. When authors adopt the former object, they ask whether the economy under study is functioning in ways that would enable future generations in that economy to achieve a level of well-being at least as high as the current level. The factors that determine current well-being include consumption of various goods and services and leisure activities. So, the criterion function for sustainable development reduces to a weighted sum of those determinants; the weights being the marginal contributions of those determinants, respectively, to current well-being. Solow (1974) and Hartwick (1977) were early theoretical exercises in this vein. Empirical work (albeit many authors do not use the term “sustainable development” in their writings) includes Nordhaus and Tobin (1972) and Jones and Klenow (2010). These authors put flesh into an earlier literature on the meaning of income (Lindahl, 1933; Hicks, 1940; Samuelson, 1961; Mirrlees, 1969; Sen, 1976). In their formulation, a society’s economic development would be said to be sustainable at a point in time if (and only if) its income were non-declining at that time. Box 2 contains a formalization of this line of reasoning.

3
Inclusive National Accounts: Introduction
In contrast, when scholars adopt intergenerational well-being as the object of interest, their presumption is that at any given date social well-being is not only the well-being of the current generation, it also includes the potential well-beings of the generations that will follow. The point is to ask whether the economy under study is functioning sufficiently well to ensure that intergenerational well-being there does not decline over time. Hamilton and Clemens (1999) and Dasgupta and Maler (2000) noted that because the factors determining intergenerational well-being are the stocks of capital assets the economy has inherited from the past, the criterion function for sustainable development reduces to a weighted sum of the stocks of those assets; the weights being the marginal contributions of those stocks, respectively, to intergenerational well-being. The weights are therefore the assets’ shadow prices, and the weighted sum of the stocks is the society’s wealth. The authors concluded that a society’s economic development would be sustainable at a point in time if (and only if) its wealth were non-declining at that time. Empirical work in this vein includes Hamilton and Clemens (1999), Dasgupta (2001 [2004]), and Arrow et al. (2004, 2011). Box 2 contains a formalization of this line of reasoning.
Income is a flow, while wealth is a stock. Wealth is the dynamic counterpart of income. Obviously, income and wealth would move in the same way over time if the economy under study is in a steady state. That’s because in a steady state, the composition of the economy remains the same over time, implying that relative shadow (spot) prices remain constant over time. Outside steady states, however, the two formulations differ and a choice has to be made between them.
As the object of ethical interest, current well-being is adequate neither in policy evaluation nor in sustainability analysis. The reason is that current well-being doesn’t include future possibilities in its reckoning. For example, current well-being could be high even if the future bodes ill. In policy evaluation we have long been comfortable including the well-beings of future generations. To illustrate, recall that the criterion on the basis of which social cost-benefit analysis is commonly undertaken (viz., the present discounted value of the flow of net social benefits) compares present and future prospects with and without the project being evaluated. Those prospects are evaluated in terms of intergenerational well-being.
As in social cost benefit analysis, we take intergenerational well-being to be the object of interest in sustainability analysis. And for the same reason: intergenerational well-being includes the potential well-beings of future generations. Proposition 1 (below) says that wealth is the correct measure of a society’s productive base; that’s because it tracks movements in intergenerational well-being.
Sustainable development is a different notion from optimum development. It is different even from efficient development. Intergenerational well-being could be growing in an inefficient economy; equally, it could be growing in a sub-optimal way.1 In developing the welfare economics of sustainable development, the social evaluator defines shadow prices on the basis of a path of development that is forecast; she does not (nor should she) assume that the economy is on an optimum or efficient path. Prices in the market may provide scaffolding for such exercises, but the corrections that have to made on them to obtain shadow prices could well be very large.
2.2 Plan of the Paper
In this second of our Background Papers for the Expert Group for Green National Accounting for India,2 we provide a sketch of the basis on which national accounts ought to be prepared if they are to be useful in economic evaluation. It is an interesting and important fact that the criterion with which policy should be evaluated (questions D and E) is the same as the one that should be used for identifying sustainable development (questions B and C). The numerical index reflecting that criterion is wealth.
The paper proceeds as follows:
In Section 2 we offer the list of asset categories comprising an economy’s productive base. To construct a numerical index of that base involves an aggregation exercise. So in Section 3 we identify the numerical weights
1 The best book-length accounts of optimum and efficient economic development remain Chakravarty (1969) and Arrow and Kurz (1970). 2 The first Background Paper in circulatiopn among Members of the Expert Group is “A Note on Fugitive Resources,” by Partha Dasgupta.
The third and fourth Background Papers, by Priya Shyamsundar and Haripriya Gundimeda, respectively, are currently being prepared for distribution.
South Asian Network for Development and Environmental Economics4
that should be awarded to the assets in the aggregation. Those weights are called shadow prices. In Section 4 we show that wealth in our comprehensive sense is the appropriate index for both policy evaluation and sustainability analysis.
The former claim may be puzzling. After all, the literature on policy evaluation, including project evaluation, is old and gigantic. There the criterion on the basis of which policy changes are recommended is the present discounted value (PDV) of net social benefits from those changes.3 No one ever mentioned wealth there. Notice though that the PDV of social benefits is a stock, not a flow. In Section 4.2 we show that the PDV of social benefits arising from a policy change is the accompanying change in wealth.
The rest of the paper focuses on sustainability analysis because the literature is new and may be unfamiliar. Section 5 concludes with a discussion of a number of issues that have been raised in connection with the theory underlying economic evaluation. Section 6 contains summary remarks. Whenever convenient, we relegate a discussion of particular features of sustainability analysis to a set of Boxes accompanying the text.
3. An Economy’s Productive Base
An economy’s productive base consists of its capital assets. What do the assets consist of? It is intuitive that they consist not only of the assets to which people there have access, but also the social infra-structure that influences the way those assets are put to work for human use, now and in the future. It makes sense then to invoke a broad notion of assets. We do that here and discover that the list includes at least two categories of assets whose appearance could seem quixotic. But welfare economic theory demands their inclusion (Section 4 and Box 2). Several categories however are familiar. We begin with the latter.
3.1 Familiar Assets
They include:
(1) Reproducible capital (roads, buildings, ports, machinery, equipment). In common parlance, including the parlance of national accounts, this category pretty much exhausts the list of capital assets. When national income accountants and international organizations speak of investment, they usually mean the accumulation of reproducible capital.4
(2) Human capital (education, skills, tacit knowledge, health). This class of assets is embodied in people. As teachers are painfully aware, human capital is not costlessly transferable from one person to another. So, the accumulation of human capital involves costs.
Education, skills, and health are both ends and means. They have intrinsic worth, but are also of indirect value (investment in human capital raises a person’s productivity). Despite that, investment in education (e.g., teachers’ salaries) is commonly regarded in national accounts as current consumption. That is bad practice. Similarly, expenditure on health is commonly taken to be part of current consumption. That too is a mistake. There are now well-known techniques for estimating the stock of human capital in a society and valuing it. Arrow et al., (2011) offers empirical illustrations.
(3) Knowledge (science and technology). This category includes such items as Nature’s laws, abstract theorems, formulae, and algorithms. They are durable public goods; that is, once discovered, they are in principle there for all to use, repeatedly. But for someone to make use of knowledge, three conditions must be met: (i) a recognition by that person that the knowledge exists; (ii) the person should have the relevant skills (human capital!); and (iii) there should be no legal or social barrier to applying the knowledge. Research and development (R&D) involves investments that advance codified knowledge. Frequently, that knowledge can be obtained freely from external sources, for example, once patents have run out. Gains in knowledge owing to the passage of time require a different estimation procedure (Arrow et al., 2011). We observe why in Section 2.3.
3 See, for example, Little and Mirrlees (1968, 1974) and Dasgupta et al. (1972).4 Reproducible capital is frequently called “manufactured capital”.

5
Inclusive National Accounts: Introduction
(4) Natural capital (local ecosystems, biomes, sub-soil resources). Today it has become a commonplace that Nature should enter explicitly in economic calculations. Because Nature has been neglected for so long in the literature on social and economic development, we pay special attention to natural capital in this paper. And because the expression “green national accounts” places emphasis on the role of natural capital in our lives, we need to classify the various forms of natural capital. We do that in Box 3.
(5) Population (size and demographic profile). Conceptually, this category raises the deepest problems, because people are both the reason well-being should occupy the ethical core of sustainability analysis and the means to the realization of well-being. Arrow et al. (2003) showed that estimating shadow prices of populations poses especial problems. Fortunately it is possible to show that there are circumstances in which population can be included in sustainability analysis by replacing wealth by wealth per capita (Dasgupta, 2001 [2004]; Arrow et al., 2011).
3.2 Institutional Capital
Categories (1)-(5) are not exhaustive. Today it is not uncommon to refer to “religious capital”, “social capital”, “cultural capital”, and more broadly “institutional capital”, when we try to understand the progress or regress of societies. So, we have a further category of assets to consider:
(6) Institutions. By “institutions” we mean the myriad of formal and informal arrangements among people that influence the allocation of resources, both at a moment in time and through time. Households, firms, communities, and the State are obvious examples of institutions. But institutions also include a broader kind of “enabling” assets, such as the rule of law, social norms of behaviour, and habitual social practices. Access to institutions is non-rivalrous in character and should be freely open to all. So, institutions are a class of public goods.
How do institutions enter sustainability analysis? They do by influencing the value of other capital assets. Suppose the State apparatus in a country is corrupt, implying that the judicial system is unreliable. Because people find it difficult to protect their property rights, the value of the capital assets they own is small, other things being equal. Corruption reduces the social worth of assets.5
Institutions influence the composition of consumption and saving and the character of future institutions. There are institutions that foster progress by having in place a structure of incentives that encourage people to allocate goods and services in their most productive uses. But institutions aren’t enough. If they are to progress, people must trust one another and have confidence in their institutions. Well developed competitive markets, tight social norms and codes of conduct, and good governance together can combine to help create and maintain trust and confidence. But mutual trust and the cooperation that can result from it can’t be guaranteed even under sound institutions. Opportunistic behaviour can beget opportunistic behaviour. Institutions can founder under a cascade of opportunism unless there are checks and balances in place by virtue of the presence of a mesh of countervailing institutions.6
In contrast, there are institutions that are a hindrance from the start. Under weak, misguided, or corrupt governance, goods and services end up in unproductive (even wrong) places. When vested interests govern social decisions, neither efficiency nor more narrowly, justice gets much of a look-in. A society’s capacity to flourish shrinks when its institutions deteriorate (owing to civil wars, ethnic strife, increasing corruption) and its other assets don’t accumulate sufficiently to compensate for that deterioration. Likewise, a society’s capacity to flourish shrinks when its material assets (e.g., natural capital) depreciate and its institutions aren’t able to improve sufficiently to compensate for that depreciation or alter behaviour so that the assets begin to accumulate.
3.3 Time as an Asset
We haven’t quite yet covered the myriad of assets that comprise a society’s productive base:
Consider a small oil exporting country. Being small, the country has no control over international oil prices. Meanwhile, or so let us imagine, an oil cartel, of which our country is not a member, raises the price of oil on a 5 No doubt the purpose of corrupt practice is to enhance the market worth of assets owned by the practitioner. In the text we are referring to
the social worth of assets. 6 On the role of trust in sustainable development, see Dasgupta (2011).

South Asian Network for Development and Environmental Economics6
continual basis. Our country therefore enjoys capital gains on its reserves without having to engage in any form of capital accumulation. Its productive base expands.7 Similarly, it could be that the country enjoys an expansion of its knowledge base by deploying scientific advances elsewhere without paying for that privilege. In both circumstances our country enjoys an expansion of its productive base simply by waiting. That tells us we should include time in a society’s productive base.
The suggestion could seem perverse. We usually regard a commodity to be an asset only if it is durable, whereas time is fleeting. Moreover, unlike assets in categories 1 to 6, which can be accumulated or decumulated at will, time moves at a constant pace, which is the pace it has set itself. But classifications are meant to serve a purpose, they are not cast in iron in some Platonic universe. The aim of sustainability analysis is to construct a measure of a society’s productive base that can be used to judge whether it is pursuing a sustainable development path. If that aim can only be achieved if we include time in the society’s productive base, we should regard it as an asset. So we now have one further capital asset on our list, namely, (7) Time!8
4. The Social Value of Capital Assets: Shadow Prices
Goods and services are of value because they contribute to human well-being. What are the contents of a person’s well-being? Here we note that they include the engagements that are open to a person; and that those in turn centre on the person’s relationships with others, the consumption of goods and services involving herself and those to whom she relates, her ability to meet her obligations to others and to pursue her projects, purposes and the many mundane things that define her life. And so on. We care about many of those engagements directly, but others are of only indirect value to us. But no matter what, every engagement requires goods and services if they are to be undertaken. It follows that in its reduced form, individual well-being, and therefore the aggregate well-being of a society, is a function of the consumption and use of goods and services.
Capital assets in categories 1 to 6 are the means by which consumption goods and services are produced. Several are however ends as well (health, learning). At any given date, intergenerational well-being is determined by (a) the assets a society has inherited from the past, (b) the society’s subsequent development (which in turn will be shaped by that inheritance), and (c) chance.
The role of chance introduces technical matters that are not essential to our analysis here. So we focus on (a) and (b).
Excepting for time, assets are durable goods. Some are tangible (roads, wetlands), while others are not (knowledge, institutions, time). No doubt capital assets depreciate (machines and equipment undergo wear and tear even when left unused; fisheries are destroyed when over-harvested; and societies have been known to forget their traditional knowledge), but they offer a flow of services over time. A desk offers the scholar an object on which she is able to read, write, and type. The value of the desk is the worth of the contribution it is expected to make to scholarly activity. In order to assess that worth, we need to estimate the value of the scholarly activity itself. The latter’s value will include the enjoyment the scholar experiences from the activity and the benefits others enjoy from the fruits of that activity. Of course, it could be that she is fully compensated for the benefits others enjoy from her work, the compensation being, say, higher earnings and increased adulation. But it may be that the higher earnings and increased adulation, when taken together, are less than the totality of benefits others enjoy from the fruits of her scholarly activity. In the latter case we should estimate not only the value of the desk to the scholar - that would be the desk’s private value to the scholar - but also that part of the value to others that does not get reflected in her increased emoluments and social esteem. In short, we should be interested in the desk’s social worth. But the desk in question is one among (hopefully!) many writing desks. That particular desk can therefore be viewed as a marginal unit of the totality of all writing desks. The social worth of a marginal unit of an asset is called its
7 The same logic says that, other things being equal, an oil importing country would find its productive base shrinking as the international price of oil rose over time.
8 Arrow et al. (2011) develops methods for estimating the contribution of time to an economy’s wealth.

7
Inclusive National Accounts: Introduction
shadow price. The shadow price of a capital asset is the contribution a marginal unit of it is forecast to make to intergenerational well-being.
An asset’s shadow price depends not only on its current use, but also on its future use. That means the shadow price is a function of the forecast of the asset’s use. That’s an inevitable feature of the worth of anything. A writing desk that is predicted to rest unused and unrecognised is value-less today. In contrast, if it is predicted that the desk will be used to good effect, its current shadow price would be positive. Social evaluators who agree on everything but their forecasts of the table’s use would impute different shadow prices to the desk.
In our example of the table, the focus was on the dependence of shadow price on the way in which an asset is predicted to be used. More generally, though, an asset’s shadow price depends on the forecast of the economy’s entire future trajectory. To see why and how, consider a wetland. Among other things, it is the habitat for insects and birds. Now, agriculture benefits from pollination. If an economy’s development path is predicted to be rapacious in the destruction of its wetlands, there will be an especial scarcity of wetlands in the future. Therefore, the wetland’s shadow price today would be high, other things being equal. Current shadow prices contain a great deal of information about future prospects.
Forecasts are not mere guesses. If they are to carry conviction, forecasts should be based on a defendable theory of the social and natural processes that shape a society’s future. That means shadow prices are based on counter-factuals: they are determined not only by the forecast of the shape of things to come, but also by the forecasts of future development had the current stocks of capital assets been otherwise. To put it another way, if they are to carry conviction, forecasts should be based on a defendable theory of the evolving political economy shaping the society under study.
Shadow prices form the link between capital assets and intergenerational well-being. For example, if the concept of intergenerational well-being includes distributional considerations, as it clearly should, shadow prices would reflect those considerations (an asset in the hands of someone needy would be valued higher than if in the hands of someone well-off; other things being the same). Shadow prices also reflect the balance that is desirable in our conception of well-being between current and future consumption of goods and services. And so on.
In very exceptional (i.e., idealized) circumstances an asset’s shadow price equals its market price. In normal circumstances shadow prices differ from market prices. By “normal circumstances” we mean circumstances in which individual actions give rise to externalities, a class of phenomena that are ubiquitous in institutions where property rights are weak. Externalities are rampant when natural capital is used.9 And they reveal themselves as gaps between market prices and shadow prices. So, if at time t, Pi(t) is the shadow price of asset i, Ri(t) its market price, and Ei(t) the social value of the externalities i’s presence creates, then
Pi(t) = Ri(t) + Ei(t). (1)
Box 4 contains an overview of methods that have been developed in recent years for estimating shadow prices. An asset is a “good” if its shadow price is positive, it is a “bad” if its shadow price is negative. The estimation of shadow prices involves “values” (the particular conception of human well-being being deployed by the social evaluator), “theories” (the character of the social and natural processes on the basis of which forecasts are made), and “facts” (the size distribution of various capital assets, the extent of their substitutability among one another, the determinants of the demand and supply of goods and services, and so forth). So it should be no surprise that even reasonable people could disagree over the magnitude of shadow prices. In recent years, those disagreements have been sharpest over the social worth of natural resources such as carbon and nitrogen concentrations (which at current levels are “bads”) and the oceans (which taken together are a “good” in a multitude of ways).
Shadow prices are not Platonic objects, nor can they be plucked from air on mere whim and prejudice. We will never get shadow prices “right”, but we can try to narrow the range in which they are taken by reasonable people to lie. The social evaluator estimates shadow prices, but recognizes that others may question her estimates. In democratic societies those differences are resolved through the ballot box. Box 5 contains a review of methods that have been deployed for estimating the shadow price of natural capital.
9 Many natural resources are mobile. Property rights to assets are hard to define, let alone enforce, for such assets. See the first Background Paper for the Expert Group, under the title, “Notes on Fugitive Resources”.

South Asian Network for Development and Environmental Economics8
5. Wealth and the Productive Base
How is a society’s productive base to be measured? We are interested, remember, in an index that tracks intergenerational well-being over time. Earlier we noted that the required index is a comprehensive measure of a society’s wealth. We now elaborate.
Imagine there are M capital assets, labelled by i. Let Ki(t) be the stock of asset i at date t and Pi(t) its shadow price. Wealth is the social worth of the economy’s capital assets. Formally, if W(t) it the economy’s wealth at t,
W(t) = i S[Pi (t)Ki (t)]. (2)
Wealth is a weighted sum of a society’s assets, the weights being their respective shadow prices. Because the index aggregates the society’s entire productive base, wealth is referred to as inclusive wealth by some (Dasgupta, 2001 [2004]; World Bank, 2006) and comprehensive wealth by others (Arrow et al., 2011). In what follows, we refer to W simply as “wealth”.10
5.1 Wealth as a Criterion for Sustainable Development
Equation (2) is an expression for wealth, not intergenerational well-being. However, the two are synchronous in time. The finding is central to sustainability analysis. So we state it formally here but relegate the proof to Box 2:
Proposition 1. Intergenerational well-being increases during a brief period of time if and only if wealth per capita at constant shadow prices increases over that same period of time.
It will prove useful to re-cast Proposition 1 in a form that is more intuitive. To do that it’s simplest if population is assumed to remain constant over time. That way we can drop population from the formula for the change in wealth, because by assumption it neither accumulates nor decumulates.
Let V(t) denote intergenerational well-being at t. Formally, equation (2) and Proposition 1 imply
DV(t) = i S[Pi(t)DKi(t)]. (3)
If Dt is a short interval of time starting at date t, then we may write
DKi (t) = [DKi (t)/Dt]Dt,
which, on using in equation (3) yields
DV(t) = i S[Pi (t){DKi (t)/Dt}]Dt. (4)
But the right hand side of equation (4) is net investment during the brief interval Δt. That means Proposition 1 can be re-expressed as
Proposition 2. Intergenerational well-being increases over a brief period of time if and only if net investment is positive in that same period of time.
If population is increasing over time, Propositions 1 and 2 should be interpreted in per capita terms. Here it is as well to illustrate Proposition 2’s significance with the help of a numerical example.
Imagine a closed economy. In a given year it invests 5 billion dollars in reproducible capital, human capital, and research and development. But suppose that natural capital is depleted and degraded that year by 6 billion dollars (all expressed in shadow prices of course!). Equation (4) would record that, owing to the disinvestment, the country became poorer over the year by 1 billion dollars. Propositions 1 and 2 would both imply that development was unsustainable that year. The two Propositions say the same thing, but in different words.
10 World Bank (2011) defines wealth differently and, as we will confirm in Box 6, wrongly when used in sustainability analysis.

9
Inclusive National Accounts: Introduction
5.2 Wealth as a Criterion for Policy Evaluation
Policy evaluation involves assessing the impact on intergenerational well-being of a perturbation to an economy at a point in time. The perturbation could be an investment project, or a change in the tax system. What are the counterparts of Propositions 1 and 2 in policy evaluation?
Consider an investment project. The project involves the reallocation of capital assets from one set of activities to another. To illustrate, consider that labour, land, machines, and equipments would be required for the project in each year of its life. Presumably they would be deployed elsewhere if the project were not accepted. So the project requires a redeployment of those assets. Suppose the project is to commence at date t. The trick is to expand the meaning of a capital asset to include the task to which the project has been assigned. With that re-interpretation we can re-write equation (3) as
DV(t) = i S[Pi (t)DKi (t)]. (5)
But now there is a difference. Accepting the project would be to perturb the economy. But the perturbation would be applied at time t. It can be shown the right-hand-side of equation (5) is the PDV of the flow of social benefits generated by the reallocation of capital assets (DKi (t)) that comprise the project.11 So we may re-phrase the familiar criterion for project evaluation as
Proposition 3. A project increases intergenerational well-being if and only if the change in wealth brought about by the resulting re-allocation of assets is positive.
6. Special Issues
Sustainability analysis and the greening of national accounts raise a number of special issues that deserve special discussion. We turn to them.
6.1 Economic Growth and the Environment: the Environmental Kuznets Curve
Ecosystem services are not only intrinsically valuable, they also have functional worth. But scratch an economist and you are likely to find someone who regards natural capital as a luxury. It is commonly thought that, to quote an editorial in the UK’s The Independent (4 December 1999), “... (economic) growth is good for the environment because countries need to put poverty behind them in order to care,” or, to quote The Economist (4 December, 1999: 17), “... trade improves the environment, because it raises incomes, and the richer people are, the more willing they are to devote resources to cleaning up their living space.”
The underlying idea was popularized in World Bank (1992). Emissions of nitrous oxides (NOx), sulfur oxides (SOx), particulates and lead were found to have declined since 1970 in OECD countries even while GDP had increased. World Bank (1992) also found that among countries where per capita GDP was under US $1,200 per year, the less poor countries suffered from greater concentration of sulfur dioxide, but that among countries enjoying per capita GDP in excess of US $1,200, those that were richer had lower concentrations. In short, the relationship between GDP per capita and concentration was found to be an inverted-U (Figures 1-2) Among environmental economists the relationship was promptly christened the “environmental Kuznets curve”, because a similar relationship between GDP per head and income inequality had been found decades ago by the economist Simon Kuznets. It was found natural to interpret the finding in such terms as the following:
“People in poor countries can’t afford placing a weight on the natural environment over material well-being. So, in the early stages of economic development pollution is taken to be an acceptable, if unfortunate, side-effect of growth in GDP per capita. However, when a country has attained a sufficiently high standard of living, people care more about the natural environment. This leads them to pass environmental legislation and create new institutions to protect the environment.”
11 The most general proof is in Dasgupta (2009).

South Asian Network for Development and Environmental Economics10
The literature on the environmental Kuznets curve is now huge (for reviews, see S. Dasgupta et al., 2002; Dinda, 2004; D.I. Stern, 2004). However, studies confirming the inverted-U shape have continued to focus on ambient air pollution in cities (e.g., Harbaugh et al., 2002). Notice that such pollutants literally blow way. For example, over time the air-shed over a city can be expected to improve in quality if emissions there were to decline. But sewage is another form of pollution we would expect to be “subject” to the environmental Kuznets curve. Health in the cities declined at the beginning of the Industrial Revolution, largely owing to an increase in urban pollution. With rising incomes, though, the local environment eventually improved.
Because it is consistent with the notion that as their incomes rise people spend proportionately more on environmental quality, it has proved tempting to believe that the environmental Kuznets curve holds for environmental quality generally, because it’s a comforting thought.
The temptation should be resisted.12 For example, if the degradation of natural capital were irreversible, economic growth itself could be at risk. For such cases we would not expect to observe an inverted-U. And there are other reasons we should reject the environmental Kuznets curve as a metaphor for the relationship between GDP per capita and the state of the natural environment. Here are four reasons:
First, as just noted, the inverted-U has been shown to be valid for pollutants involving local, short-term damages (sulphur, particulates, fecal coliforms), not for the accumulation of household and industrial waste, nor for pollutants involving long-term and more dispersed costs, such as carbon dioxide, which typically have been found to increase continuously with GDP (World Bank, 1992; N. Stern, 2006). Secondly, the relationship between GDP per head and environmental pollution wouldn’t be the inverted-U if the feedback from pollution to the state of ecosystems is positive (D.I. Stern et al., 1996). Third, the inverted-U hides system-wide consequences of emissions. Reductions in one pollutant in one country, for example, could involve increases in other pollutants in the same country or transfers of those same pollutants to other countries. Acid rains are an example of the externalties that emitting countries impose on countries down wind.
And fourth, in most cases where pollution concentrations have declined with rising GDP, the reductions have been due to local institutional reforms, such as environmental legislation and market-based incentives to reduce environmental impacts. Such reforms may ignore their possible adverse side effects on the poor and future generations. Where the environmental costs of economic activity are borne by those under-represented in the political process, the incentives to correct environmental problems are likely to be weak. The upper panel of Figure 1 can mislead one to think that it reflects a universal relationship between the environment and economic development.
The solution to environmental degradation lies in such institutional reforms as would offer incentives to private users of resources to take account of the social costs of their actions. The inverted-U curve suggests this can happen in some cases, that is all. Moreover, as we have already deduced, growth in GDP per capita is a wrong objective, we should instead be studying movements in wealth, not movements in GDP. Movements in wealth over time pick up the right tradeoffs between the factors that determine intergenerational well-being. If there are tradeoffs that can be exploited between different types of capital assets, wealth summarizes those tradeoffs in the right way, by being constructed in terms of shadow prices. In Box 5 we show that shadow prices reflect whatever tradeoffs there happen to be.
6.2 Necessities vs. Luxuries
A large part of what Nature offers us is a necessity, not a luxury. Many of the services we obtain from natural capital are “basic needs”. Among the visible products are food, fibres, fuel, and fresh water (MEA, 2003, calls them “provisioning services”). But many are hidden from view. Thus, ecosystems maintain a genetic library, preserve and regenerate soil, fix nitrogen and carbon, recycle nutrients, control floods, mitigate droughts, filter pollutants, assimilate waste, pollinate crops, operate the hydrological cycle, and maintain the gaseous composition of the atmosphere (MEA, 2003, calls them “regulatory services”; see Box 3). A number of services filter into a global
12 The observations below are taken from Arrow et al. (1995), which was republished, with comments by a number of experts, in Environment and Development Economics (1996), Vol. 1, No. 1.
11
Inclusive National Accounts: Introduction
context, but many are geographically confined. Human well-being and the state of our natural environment are closely linked.
Natural capital offers joint products. Circulation of material (ocean currents and the wind system) transfers energy across the globe (e.g., it influences precipitation) and dilutes pollutants. Wetlands recycle nutrients and produce purified water. Mangrove forests protect coastal land from storms and are spawning grounds for fish. And so on. Unhappily, social tensions arise in those many cases where an ecosystem has competing uses (farms versus forests versus urban developments; forests versus agro-ecosystems; coastal fisheries versus aquaculture).13 Dasgupta (1982, 1993) and Sachs et al. (1998) traced the location of world poverty in part to the fact that the tropics harbour some of the most fragile ecosystems, including those that regulate disease. Carpenter et al. (2005) and Hassan et al. (2005), which contain the first two sets of technical reports accompanying the Millennium Ecosystem Assessment (MEA), found that 15 out of the 24 major ecosystem services that the MEA examined are either already degraded or are currently subject to unsustainable use.
A resource can be a luxury for others even while it is a necessity for some. Consider watersheds, which nurture commercial timber, agricultural land, recreational opportunities, and both market and non-market products (gums, resin, honey, fibres, fodder, fresh water, timber, and fuel-wood). Watershed forests purify water and protect downstream farmers and fishermen from floods, droughts, and sediments. In tropical watersheds, forests house vast quantities of carbon and are the major home of biodiversity. A number of products from watersheds are necessities for local inhabitants (forest dwellers, downstream farmers, and fishermen), some are sources of revenue for commercial firms (timber companies), while others are luxuries for outsiders (eco-tourists). Some benefits accrue to nationals (agricultural products and fibres), while others spill over geographical boundaries (carbon sequestration). So, while watersheds offer joint products (protection of biodiversity, flood control, carbon sequestration, household necessities), they also provide potential services that compete against one another (commercial timber, agricultural land, biodiversity). Competition for Nature’s services has been a prime force behind the transformation of our landscape. Politics often intervenes to ensure that commercial demand trumps local needs, especially under non-democratic regimes. Governments in poor countries have been known to issue timber concessions in upstream forests to private logging firms, even while evicting forest dwellers and encouraging siltation and the risk of floods downstream. Nor can the international community be depended upon to apply pressure on governments. When biodiversity is lost at a particular site, eco-tourists go elsewhere that has rich biodiversity on offer. So, international opinion is often at best tepid. In both examples, local needs are outflanked by outsiders’ demands.
6.3 Irreversible Uses
Ecosystems are driven by interlocking non-linear processes that run at various speeds and operate at different spatial scales (Steffen et al., 2004). That is why ecosystems harbour multiple basins of attraction. The global climate system is now a well known example, but small-scale ecosystems also contain multiple basins of attraction; and for similar reasons. So long as phosphorus run-off into a fresh water lake is less than the rate at which the nutrient settles at the bottom, the water column remains clear. But if over a period of time the run-off exceeds that rate, the lake collapses into a eutrophic state. Usually the point at which the lake will collapse is unknown. That means the system is driven by non-linear stochastic processes.
When wetlands, forests, and woodlands are destroyed (for agriculture, mining, timber extraction, urban extension, or whatever), traditional dwellers suffer. For them, and they are among the poorest in society, there are no substitutes. For others, there is something else, often somewhere else, which means there are substitutes. Degradation of ecosystems is like the depreciation of roads, buildings, and machinery - but with three big differences: (1) depreciation of natural capital is frequently irreversible (or at best the systems take a long time to recover; (2) except in a very limited sense, it isn’t possible to replace a depleted or degraded ecosystem by a new one; and (3) ecosystems can collapse abruptly, without much prior warning. Imagine what would happen to a city’s inhabitants if the infrastructure connecting it to the outside world was to break down without notice. Vanishing water holes,
13 See Tomich et al. (2004), Tomich et al. (2004), and Palm et al. (2005); and Hassan, Scholes, and Ash (2005), respectively, on those tensions.

South Asian Network for Development and Environmental Economics12
deteriorating grazing fields, barren slopes, and wasting mangroves are spatially confined instances of corresponding breakdowns among the rural poor in poor countries. In recent years we have also seen how an ecological collapse accompanying high population growth, such as the one that has been experienced in recent years in the Horn of Africa and the Darfur region of Sudan, can trigger rapid socio-economic decline (Homer-Dixon, 1999; Diamond, 2005; Collier, 2007). The range between a need and a luxury is thus enormous and context-ridden. Macroeconomic reasoning glosses over the heterogeneity of Earth’s resources and the diverse uses to which they are put, by people residing at the site and those elsewhere.
6.4 Substitution Possibilities
Environmental debates are often over the extent to which people are able to substitute one thing for another. Many believe that problems arising from the depletion of natural capital can always be overcome by the accumulation of manufactured capital, knowledge, and skills. Lomborg (2001) is an example from the popular literature. But the viewpoint pervades official economics. Macroeconomic growth theories, for example, are mostly built on economic models in which Nature makes no appearance (Romer, 1996; Barro and Sal-i-Martin, 2003; Helpmann, 2004). The implicit assumption there must be that reproducible capital and human skill and ingenuity can be relied upon to make the sustainability of Nature’s services unimportant. However, there are scientists who argue that Humanity has reached the stage where there are severe limits to further substitution possibilities among large numbers of natural resources and among environmental resources and other forms of capital assets (e.g., Ehrlich and Goulder, 2007).
Four kinds of substitution help to ease resource constraints, be they local or global. First, there can be substitution of one thing for another in consumption (nylon and rayon substituting for cotton and wool; pulses substituting for meat). Secondly, manufactured capital can substitute for labour and natural capital in production (the wheel and double-glazing are two extreme examples). Thirdly, novel production techniques can substitute for old ones.14 Fourthly, and for us here most importantly, natural resources themselves can substitute for one another (e.g., renewable energy sources could substitute for non-renewable ones). These examples point to a general idea: as each resource is depleted, there are close substitutes lying in wait, either at the site or elsewhere. The thought that follows is that even as constraints increasingly bite on any one resource base, Humanity should be able move to other resource bases, either at the same site or elsewhere. The enormous additions to the sources of industrial energy that have been realized (successively, human and animal power, wind, timber, water, coal, oil and natural gas and, most recently, nuclear power) are a prime historical illustration of this possibility.15
Humanity has been substituting one thing for another since time immemorial. Even the final conversion of forests into agricultural land in England in the Middle Ages was a form of substitution: large ecosystems were transformed to produce more food.16 But both the pace and scale of substitution in recent centuries have been unprecedented. Landes (1969) has argued that the discovery of vast numbers of ways of substituting resources among one another characterized the Industrial Revolution in late eighteenth century. The extraordinary economic progress in Western Europe and North America since then, and in East Asia more recently, has been another consequence of finding new ways to substitute goods and services among one another and to bring about those substitutions. That ecosystems are spatially dispersed has enabled this to happen. The ecological transformation of rural England in the Middle Ages probably reduced the nation’s biodiversity, but it increased income without any direct effect on global productivity.
But that was then and there, and we are in the here and now. The question is whether it is possible for the scale of human activity to increase substantially beyond what it is today without placing undue stress on the major ecosystems that remain. The cost of substituting manufactured capital for natural resources can be high. Low-cost substitutes could turn out to be not so “low-cost” if the true costs are used in the accounting, rather than the costs recorded in the marketplace. Depleting one type of natural capital and substituting it with another form of natural capital or with a manufactured capital is frequently uneconomical. The example of global climate is a constant reminder of that.
14 For example, the discovery of effective ways to replace the piston by the steam turbine (i.e., converting from reciprocating to rotary motion) was introduced into power plants and ships a little over 100 years ago. The innovation was an enormous energy saver in engines.
15 But these shifts have not been without unintended consequences. Global climate change didn’t feature in economic calculations until very recently.
16 Forests in England had begun to be denuded earlier, by Neolithic Britons and the Romans.

13
Inclusive National Accounts: Introduction
6.5 A Common Misconception about Wealth
Wealth is a weighted sum of an economy’s stock of capital assets (equation (2)). Shadow prices are the weights. They are the rates at which assets substitute for one another in the measure of wealth. So, wealth is a linear index of the stocks of capital assets.
There are scholars (Daly et al., 2007) who worry that the linear form of wealth hides an assumption, that knowledge, reproducible, and human capital are always able to substitute for natural capital. That is a misconception. Proposition 1 does not require assets to be substitutable for one another in production or consumption.
In fact Proposition 1 has no empirical content, it is an equivalence relationship. The Proposition offers a tool for sustainability analysis. It says, for example, that if the social evaluator seeks to know whether an economy is on a path of sustainable development, she should keep track of the economy’s wealth, it says nothing more. Proposition 1 doesn’t presume that capital assets can substitute for one another in production or consumption, nor does it insist they are complements. The presence or absence of substitution possibilities in production and consumption among various categories of capital assets enter sustainability analysis via shadow prices. Imagine, for example, that asset h is a form of natural capital that is now close to a dangerously low level, crossing which would prove catastrophic to the economy. Suppose too that the exact point at which the threshold would be crossed is unknown. In such a case, if h+1 is a run-of-the-mill asset, Ph(t)/Ph+1(t) would be a gigantic number; so large, perhaps, that it wouldn’t be possible to accumulate sufficient quantities of h+1 as compensation for any further decline in the stock of h.17
6.6 The Attraction of Current Consumption and GDP
Wealth per capita is a stock, while consumption and income per capita are flows. That alone shows that GDP cannot serve well as an index with which to undertake either sustainability analysis or policy evaluation (Propositions 1 and 3). Nor was it meant to serve those purposes. GDP is a measure of economic activity and was designed for use in a world where a significant proportion of people were unemployed and resources lay idle. As a criterion for evaluating short run economic policy, GDP has served admirably. But in recent decades growth in GDP has assumed normative significance, with no argument to support it. Greening national accounts doesn’t mean that “green GDP” is the right evaluative criterion; it is not. Even green GDP is a flow variable, and both sustainability analysis and policy evaluation require that the social evaluator peers into the future. That in turn means that national accounts should be built round an economy’s productive base, which means stocks of assets.
Nevertheless, GDP is so attractive that without international cooperation it would be hard for any government to abandon it as an index of progress. Here is why.
GDP as a Strategic Weapon
GDP consists of goods and services in hand; and those goods and services can be deployed so as to gain advantage in the international sphere. Never mind if a country enjoys large GDP by depleting its natural capital; GDP can be (and is) used by a government as a strategic weapon in a world where nations compete against one another for economic and political significance. Not only does a nation’s status in the world rise if it enjoys GDP growth, high GDP enables a nation to tilt the terms of trade with the rest of the world to its advantage. History is replete with examples that demonstrate the strategic advantages of GDP growth. The competitive advantages associated with GDP growth lead to a to-date unexplored form of the “tragedy of the commons”: nations vie with one another for competitive advantage by bolstering GDP, thereby jeopardizing future well-being. As in classic instances of the tragedy, international recognition of the wasteful nature of such a form of competition is a needed first step toward shifting national economic policies toward the accumulation of wealth. To call for GDP growth and demand sustainable development at the same time is to ask for too much.
17 The remarks here have been adapted from Arrow et al. (2007), which was a reply to Daly et al. (2007).

South Asian Network for Development and Environmental Economics14
Conspicuous Consumption as Status
What holds true for governments has as its base humanity’s sociability. As social animals, we are both competitive and conformist. We want to attain status in our community in certain ways and yet want simultaneously to be like others in other ways. In his classic work on the Gilded Age, Veblen (1924) spoke of “conspicuous consumption” so as to draw attention to consumption as a status symbol (fancy automobiles, expensive clothing, mansions). Notice that if a consumption good is to be a status symbol, it must be conspicuous; hence the title of Veblen’s classic.
Veblen’s notion of status has been extended greatly to cover the more general tendency of people to try to out-do the “Jones’s”. Social scientists have modelled such forms of consumption competition more generally as “rat races”, each household trying to beat all others in their consumption patterns, in an ever-losing proposition: no one is much happier, even though all are consuming larger and larger amounts of conspicuous goods (Easterlin, 1974, 1995, 2001; Oswald, 1997). A formal proof of that intuition was offered by Arrow and Dasgupta (2009). The proof requires that fo conspicuous consumption is to lead unerringly to a rat race, some other consumption goods (e.g., leisure) must be inconspicuous.
People don’t compete with others in every sphere of life. But if goods relying hugely on natural capital (e.g. automobiles, airplanes) were underpriced in the past and remain underpriced, and if those goods are conspicuous (again, automobiles and airplanes), then they would be natural focal points for competition. Habits reinforce the motivation for status. They influence our current taste for goods and services. To the extent habits have a persistent influence, the past is ever present. This leads to history dependence, or path dependence, of the course of events. Extreme forms of history dependence are often called “lock-in effects”.
Complementing habits are economic and social infrastructures, whose growth accompanies conspicuous consumption (gas stations, expanding motorways, airports). Together they give rise to a spiralling process involving the exploitation of natural capital, one that continually increases but adds far less to human well-being than anticipated. Crucially, the spiral jeopardizes the well-being of future generations. Here again, the process resembles the “tragedy of the commons”: Everyone works harder, consumes more, and depletes natural capital at faster rates than they would if they all agreed to work less hard and consume less, but are unable to find a mechanism for enforcing the agreement (Schor, 1998; Arrow and Dasgupta, 2009)).
7. Reflections
As we elaborate in Box 5,the social worth of natural resources can be decomposed into three parts: use value, intrinsic value, and option value. The proportions differ. Oil and natural gas aren’t usually thought to possess intrinsic value, nor perhaps much option value, but they do have use value. The great apes are intrinsically valuable; some would say they should have no other value, that they are an end in themselves, not a means to anything. Option value is the value we apportion to a natural resource which could prove to be have a social worth beyond its known use value or intrinsic value. Biodiversity possesses all three types of value. Although there are several excellent treatises on valuation methods (e.g. Freeman, 1992), they are altogether too limiting for the task in hand. MEA (2003) has drawn our attention to the plight of the world’s ecosystems. Yet, in comparison with the number of studies we currently have at our disposal on the valuation of environmental amenities, the size of the literature on the valuation of ecosystems is pityfully small. This paper has sketched a formulation that tells us the steps that are necessary to value ecosystem services. Valuation in practice requires a multi-disciplinary effort. As a minimum, economists need to get together with environmental scientists to device methods for implementing steps (a)-(c) in Section 3, which provide the basis for valuing ecological systems.
However, the valuation techniques we have enumerated here and in Box 3 and Box 4 are built round the idea that preferences and demands, as they stand, should be respected. There is an enormous amount to be said for this, reflecting as it does a democratic viewpoint. But even when commending it, we shouldn’t play down the strictures of those social thinkers who have urged the rich, be they in rich countries or in poor ones, to curb their material demands, to alter their ways so as to better husband Earth’s limited resources. Their thought is that we deplete resources without trying to determine the consequences of depleting them, sometimes because we haven’t the

15
Inclusive National Accounts: Introduction
time to find out, but sometimes because we may not wish to know, since the answer may prove to be unpalatable to us. Being sensitive to ecological processes requires investment in early education on the connection between human well-being and the natural environment. If such strictures as we are alluding to seem quaint today, it may be because we are psychologically uncomfortable with the vocabulary. But that isn’t an argument for not taking them seriously.
South Asian Network for Development and Environmental Economics16
References
Acharya, G (2000) ‘Approaches to Valuing the Hidden Hydrological Services of Wetland Ecosystems.’ Ecological Economics, 35(1), 63-74
Acharya, G; Barbier, EB (2000) ‘Valuing Ground Water Recharge Through Agricultural Production in the Hadejia’Jama’are Wetlands in Northern Nigeria.’ Agricultural Economics, 22, 247-259
Arrow, KJ, et al. (1995) ‘Economic Growth, Carrying Capacity, and the Environment.’ Science, 268(5210). Reprinted in Environment and Development Economics, 1996, 1
Arrow, KJ (1971) ‘Political and Economic Evaluation of Social Effects of Externalities.’ In Intriligator, M (ed) Frontiers of Quantitative Economics, Vol. 1. Amsterdam: North Holland
Arrow, KJ; Dasgupta, PS (2009) ‘Conspicuous Consumption, Inconspicuous Leisure.’ Economic Journal, 2009, 119 (541), F497-F516
Arrow, KJ; Dasgupta, P; Goulder, L; Daily, G; Ehrlich, PR; Heal, GM; Levin, S; Mäler, KG; Schneider, S; Starrett, DA; Walker, B (2004) ‘Are We Consuming Too Much?.’ Journal of Economic Perspectives, 18(1), 147-172
Arrow, KJ; Daily, G; Dasgupta, P; Ehrlich, PR; Goulder, L; Heal, GM; Levin, S; Mäler, KG; Schneider, S; Starrett, DA; Walker, B (2007) ‘Consumption, Investment, and Future Well-Being: Reply to Daly et al.’ Conservation Biology, 21(5), 1363-1365
Arrow, KJ; Dasgupta, P; Goulder, LH; Mumford, K; Oleson, K (2011) ‘Sustainable Development and the Measurement of Wealth.’ NBER Discussion Paper
Arrow, KJ; Dasgupta, P; Mäler, KG (2003) ‘The Genuine Savings Criterion and the Value of Population.’ Economic Theory, 21(2), 217-225
Arrow, KJ; Fisher, A (1974) ‘Preservation, Uncertainty and Irreversibility.’ Quarterly Journal of Economics, 88, 312-19
Arrow, KJ; Kurz, M (1970) Public Investment, the Rate of Return and Optimal Fiscal Policy. Baltimore: Johns Hopkins University Press
Arrow, KJ; Solow, RM; Portney, P; Leamer, E; Radner, R; Schuman, H (1993) ‘Report of NOAA Panel on Contingent Valuation.’ Federal Register, 58, 4601-14
Atkinson, AB; Stiglitz, JE (1980) Lectures in Public Economics. New York: McGraw Hill
Balmford, A; Fisher, B; Green, RE; Naidoo, R; Strassburg, B; Kerry Turner, R; Rodrigues, ASL (2011) ‘Bringing Ecossystem Services into the Real World: An Operational Framework for Assessing the Economic Consequences of Losing Wild Nature.’ Environmental & Resource Economics, 84(2), 161-175.
Barbier, EB (2000) ‘Valuing the Environment as an Input: Review of Mangroive-Fishery Linkages.’ Ecological Economics, 35(1), 47-61
Barro, RJ; Sal-i-Martin, X (2003) Economic Growth. Cambridge: MIT Press
Bateman, IJ; Mace, GM; Fezzi, C; Atkinson, G; Turner, K (2011) ‘Economic Analysis of Ecosystem Service Assessments.’ Environmental & Resource Economics, 84(2), 177-218
Bin, O; Polasky, S (2005) ‘Evidence on the Amenity Value of Wetlands in a Rural Setting.’ Journal of Agricultural and Applied Economics, 37(3), 589-602
Bulte, EH; Lipper, L; Stringer, R; Zilberman, D (2008) ‘Payments for Ecosytem Services and Poverty Reduction: Concepts, Issues, and Empirical Perspectives.’ Environment and Development Economics, 13(3), 245-254
Carpenter, SR; Pingali, PL; Bennet, EM; Zurek, MB (eds) (2005) Ecosystems and Human Well-Being, Vol. 2: Scenarios.Washington, DC: Island Press
Carson, RT (2004) Contingent Valuation: A Comprehensive Bibliography and History. Northampton, MA (USA): Edward Elgar
Chakravarty, S (1969) Capital and Development Planning. Cambridge, MA: MIT Press
Cline, William R (1992) The Economics of Global Warming. Washington, DC: Institute for International Economics
Coase, R (1960) ‘The Problem of Social Cost.’ Journal of Law and Economics, 3(1), 1-44
Collier, P (2007) The Bottom Billion. Oxford: Oxford University Press
Daily, G; Ellison, K (2002) The New Economy of Nature: The Quest to Make Conservation Profitable. Washington, DC: Island Press
17
Inclusive National Accounts: Introduction
Daly, HE; Czech, B; Tranger, DL; Rees, WE; Grover, M; Dobson, T; Trombulak, SC (2007) ‘Are We Consuming Too Much - for What?’ Conservation Biology, 21(5), 1369-1382
Dasgupta, P (1982) The Control of Resources. Cambridge, MA: Harvard University Press
Dasgupta, P (1990) ‘The Environment as a Commodity.’ Oxford Review of Economic Policy, 6(1), 51-67
Dasgupta, P (1993) An Inquiry into Well-Being and Destitution. Oxford: Clarendon Press
Dasgupta, P (2001 [2004]) Human Well-Being and the Natural Environment. Oxford: Oxford University Press, 2nd ed. (2004)
Dasgupta, P (2009) ‘The Welfare Economic Theory of Green National Accounts.’ Environmental and Resource Economics, 42(1), 3-38
Dasgupta, P (2011) ‘A Matter of Trust: Social Capital and Economic Development.’ In Lin, J; Plescovik, B (eds) Annual World Bank Conference on Development Economics, 2009: Lessons from East Asia and the Global Financial Crisis. New York: World Bank and Oxford University Press
Dasgupta, P; Heal, GM (1979) Economic Theory and Exhaustible Resources. Cambridge: Cambridge University Press
Dasgupta, P; Mäler, KG (2000) ‘Net National Product, Wealth, and Social Well-Being.’ Environment and Development Economics, 5(1), 69-93
Dasgupta, S; Laplante, B; Wang, H; Wheeler, D (2002) ‘Confronting the Environmental Kuznets Curve.’ Journal of Economic Perspective, 16(1), 147-168
Diamond, J (2005) Collapse: How Societies Choose to Fail or Survive. London: Allen Lane
Dinar, A; Hassan, R; Mendelsohn, R; Benhin, J; et al. (2008) Climate Change and Agriculture in Africa: Impact Assessment and Adaptation Strategies. London: Earthscan
Dinda, S (2004) ‘Environmental Kuznets Curve Hypotheis: A Survey.’ Ecological Economics, 49(4), 431-455
Dobson, AP; Bradshaw, AD; Baker, AJM (1997) ‘Hope for the Future: Restoration Ecology and Conservation Biology.’ Science, 277, 515-522
Easterlin, R (1974) ‘Does Economic Growth Improve the Human Lot? Some Empirical Evidence.’ In David, PA; Reder, M (eds) Nations and Households in Economic Growth: Essays in Honor of Moses Abramowitz. New York: Academic Press
Easterlin, R (1995) ‘Will Raising the Incomes of All Increase the Happiness of All?’ Journal of Economic Behaviour and Organization, 47, 35-47
Easterlin, R (2001) ‘Income and Happiness: Toward a Unified Theory.’ Economic Journal, 111, 465-484
Ehrlich, PR; Goulder, LH (2007) ‘Is Current Consumption Excessive? A General Framework and Some Indications for the United States.’ Conservation Biology, 21(5), 1145-1154
Englin, J; Mendelsohn, R (1991) ‘A Hedonic Travel Cost Analysis for Valuation of Multiple Components of Site Quality: The Recreation Value of Forest Management.’ Journal of Environmental Economics and Management, 21, 275-90
Fankhauser, S (1995) Valuing Climate Change: The Economics of Greenhouse. London: Earthscan
Freeman III, AM (1993) The Measurement of Environmental and Resource Values: Theory and Methods. Washington, D.C.: Resources for the Future
Goldstein, J; Daily, GC; Friday, JB; Matson, PA; Naylor, RL; Vitousek, PM (2006), ‘Business Strategies for Conservation on Private Lands: Koa Forestry as a Case Study.’ Proceedings of the National Academy of Sciences, 103(26), 10140-10145
Gren, IM; Folke, C; Turner, RK; Bateman, I (1994) ‘Primary and Secondary Values of Wetland Ecosystems.’ Environmental and Resources Economics, 4(1), 55-74.
Haque, AK; Murty, MN; Shyamsundar, P (eds) (2011) Environmental Valuation in South Asia. New Delhi: Cambridge
Harbaugh, WT; Levinson, A; Wilson, DM (2002) ‘Ambient Air Pollution in Cities: Reexamining the Empirical Evidence for an Environmental Kuznets Curve.’ Review of Economics and Statistics, 84(3), 541-551
Hardin, G (1968) ‘The Tragedy of the Commons.’ Science, 162, 1243-8
Hartwick, JM (1977) ‘Intergenerational Equity and the Investing of Rents from Exhaustible Resources.’ American Economic Review, 66(5), 972-974
Hassan, R; Scholes, R; Ash, N (eds) for Millennium Ecosystem Assessments - (2005) Ecosystems and Human Well-Being: Current State and Trends. Washington DC: Island Press

South Asian Network for Development and Environmental Economics18
Henry, C (1974) ‘Investment Decisions under Uncertainty: the Irreversibility Effect.’ American Economic Review, 64, 1006-12
Hicks, JR (1940) ‘The Valuation of Social Income.’ Economica, 7(2), 105-124
Homer-Dixon, TE (1999) Environment, Scarcity, and Violence. Princeton, NJ: Princeton University Press
Jack, BK; Kousky, C; Sims, KRE (2008) ‘Designing Payment for Ecosystem Services: Lessons From Previous Experience with Incentive-Based Mechanisms.’ Proceedings of the National Academy of Sciences, 105(28), 9465-9470
Jalan, J; Somanathan, E (2008) ‘The Importance of Being Informed: Experimental Evidence on Demand for Environmental Quality.’ Journal of Development Economics, 87(1), 14-28
Kumar, P (ed) (2009) The Economics of Ecosystems and Biodiversity. Nairobi: United Nations Environment Programme
Landes, D (1969) The Unbound Prometheus. Cambridge: Cambridge University Press
Lindahl, E (1928) ‘Some Controversial Questions in the Theory of Taxation.’ In Musgrave, RA; Peacock, AT (eds) Classics in the Theory of Public Finance. London: MacMillan, 1958. Originally published in Swedish
Lindahl, ER (1933) ‘The Concept of Income.’ In Bagge, G (ed) Economic Essays in Honour of Gustav Cassel. London: Allen & Unwin
Little, IMD; Mirrlees, JA (1968) Manual of Industrial Project Analysis in Developing Countries: Social Cost Benefit Analysis. Paris: OECD
Little, IMD; Mirrlees, JA (1974) Project Appraisal and Planning for Developing Countries. London: Heinemann
Lomborg, B (2001) The Skeptical Environmentalist. Cambridge: Cambridge University Press
Mäler, KG; Wyzga, RE (1976) Economic Measurement of Environmental Damage. Paris: OECD
MEA - Millennium Ecosystem Assessment (2003) Ecosystems and Human Well-Being. Washington, DC: Island Press
Meade, JE (1952) ‘External Economies and Diseconomies in a Competitive Situation.’ Economic Journal, 62(1), 54-67
Meade, JE (1973) The Theory of Externalities. Geneva: Institute Universitaire de Hautes Etudes Internationales
Mirrlees, JA (1969) ‘The Evaluation of National Income in an Imperfect Economy.’ Pakistan Development Review, 9(1), 1-13
Mendelsohn, R; Dinar, A; Williams, L (2006) ‘The Distributional Impact of Climate Change in Rich and Poor countries.’ Environment and Development Economics, 11(2), 159-178
Myers, N; Kent, J (2000) Perverse Subsidies: How Tax Dollars Undercut our Environment and Our Economies. Washington, DC: Island Press
Nordhaus, WD; Tobin, J (1972) ‘Is Economic Growth Obsolete?’ In Economic Growth, 5th Anniversary Colloquium of the NBER. New York: Columbia University Press
Oswald, AJ (1997) ‘Happiness and Economic Performance.’ Economic Journal, 107, 1815-1831
Pagiola, S; Landell-Mills, N; Bishop, J (2002) ‘Making Market-Based Mechanisms Work for Forests and People.’ In Pagiola, S; Bishop, J; Landell-Mills, N (eds) Selling Forest Environmental Services: Market-Based Mechanisms for Conservation and Development. London: Earthscan
Pagiola, S; Rios, AR; Arcenas, A (2008) ‘Can the Poor Participate in Payments for Environmental Services? Lessons from the Silvopastoral Project in Nicaragua.’ Environment and Development Economics, 13(3), 299-326
Palm, CA, Vosti, SA; Sanchez, PA; Erickson, PJ (eds) (2005) Slash-and-Burn Agriculture: The Search for Alternatives. New York: Columbia University Press
Pattanayak, SK (2004) ‘Valuing Watershed Services: Concepts and Empirics from Southeast Asia.’ Agriculture, Ecosystems & Environment, 104(1), 171-184
Pattanayak, SK; Butry, DT (2005) ‘Spatial Complementarity of Forests and Farms: Accounting for Ecosystem Services.’ American Journal of Agricultural Economics, 87(4), 995-1008
Pattanayak, SK; Kramer, RA (2001) ‘Worth of Watersheds: A Producer Surplus Approach for Valuing Drought Mitigation in Eastern Indonesia.’ Environment and Development Economics, 6(1), 123-146
Pearce, D; Cline, W; Achanta, A; Fankhauser, S; Pachauri, R; Tol, R; Vellinga, P (1996) ‘The Social Cost of Climate Change: Greenhouse Damage and the Benefits of Control.’ In Bruce, J; Lee, H; Haites, E (eds) Climate Change 1995: Economic and Social Dimensions of Climate Change. Cambridge: Cambridge University Press
19
Inclusive National Accounts: Introduction
Reid, WV; Mooney, HA; Cropper, A et al. (2005) Ecosystems and Human-Wellbeing: Synthesis. Washington, DC: World Resources Institute
Repetto, R; Magrath, W; Wells, M; Beer, C; Rossini, F (1989) . Washington DC: World Resources Institute
Ricketts, TH; Daily, GC; Ehrlich, PR; Michener, C (2004) ‘Economic Value of Tropical Forests in Coffee Production.’ Proceedings of the National Academy of Sciences, 101, 12579-12582
Ricketts, TH; Regetz, J; Steffan-Dewenter, I; Cunninghamd, SA; Kremen, C; Bogdanski, A; Gemmill-Herren, B; Greenleaf, SS; Klein, AM; Mayfield, MM; Morandin, LA; Ochieng, A; Viana, BF (2008) ‘Landscape Effects on Crop Pollination Services: Are There General Patterns?.’ Ecology Letters, 11, 499-515
Romer, D (1996) Advanced Macroeconomics. New York: McGraw Hill
Rosenzweig, C; Hillel, D (1998) Climate Change and the Global Harvest: Potential Impacts of the Greenhouse Effect on Agriculture. New York: Oxford University Press
Sachs, JD; Gallup, JL; Mellinger, A (1998) ‘Geography and Economic Development.’ In Pleskovic, B; Stiglitz, JE (eds) Annual World Bank Conference on Development Economics. Washington DC: World Bank
Samuelson, PA (1961) ‘The Evaluation of ‘Social Income’: Capital Formation and Wealth.’ In Lutz, FA; Hague, DC (eds) The Theory of Capital. London: MacMillan
Scheffer, M (2009) Critical Transitions in Nature and Society. Princeton, NJ: Princeton University Press
Schor, J (1998) The Overspent American. New York: Basic Books
Sen, A (1976) ‘Real National Income.’ Review of Economic Studies, 43(1), 19-39
Smith, VK (1997) ‘Pricing What is Priceless: A Status Report on Non-Market Valuation of Environmental Resources.’ In Folmer, DC; Tietenberg, T (eds) The International Yearbook of Environmental and Resource Economics 1997/1998. Cheltenham: Edward Elgar
Smith, VK (2004) ‘Fifty Years of Contingent Valuation.’ In Folmer, H; Tietenberg, T (eds) The International Yearbook of Environmental and Resource Economics 2004/2005: A Survey of Current Issues. Cheltenhamd: Edward Elgar
Smith, VK; Desvousges, WH (1987) ‘An Empirical Analysis of the Economic Value of Risk Changes.’ Journal of Political Economy, 95(1), 89-114
Solow, RM (1974) ‘Intergenerational Equity and Exhaustible Resources.’ Review of Economic Studies, 41, Symposium Issue, 29-45
Spence, AM (1974) ‘Blue Whales and Optimal Control Theory.’ In Göttinger, H (ed), Systems Approaches and Environmental Problems. Gottingen: Vandenhoek and Ruprecht
Starrett, D (1972) ‘Fundamental Non-Convexities in the Theory of Externalities.’ Journal of Economic Theory, 4
Steffen, W; Sanderson, A; Tyson, PD; Jäger, J; Matson, PA; Moore III, B; Oldfield, F; Richardson, K; Schellnhuber, HJ; Turner II, BL; Wasson, RJ (2004) Global Change and the Earth System. Berlin: Springer
Stern, DI (2004) ‘The Rise and Fall of the Environmental Kuznets Curve.’ World Development, 32(8), 1419-1439
Stern, DI; Common, MS; Barbier, EB (1996) ‘Economic Growth and Environmental Degradation: The Environmental Kuznets Curve and Sustainable Development.’ World Development, 24(7), 1151-1160
Stern, NH (2006) The Stern Review of the Economics of Climate Change. Cambridge: Cambridge University Press
Tilman, D; Polasky, S; Lehman, C (2005) ‘Diversity, Productivity and Temporal Stability in the Economics of Humans and Nature.’ Journal of Environmental Economics and Management, 49(3), 405-426
Tomich, TP; van Noordwijk, M; Thomas, DE (eds) (2004) ‘Environmental Services and Land Use Change: Bridging the Gap between Policy and Research in Southeast Asia.’ Agriculture Ecosystems & Environment, 104(1)
Tomich, TP; Palm, CA; Velarde, SJ; Geist, H; Gillison, AN; Lebel, L; Locatelli, M; Mala, W; van Noordwijk, M; Sebastian, K; Timmer, D; White, D (2005) Forest and Agroecosystem Tradeoffs in the Humid Tropics. Nairobi: Alternatives to Slash-and-Burn Programme
Turner, RK; van den Bergh, CJM; Soderqvist, T; Barendregt, A; van der Straaten, J; Maltby, E; Ireland, EC (2000) ‘Ecological-Economics of Wetlands: Scientific Integration for Management and Policy, Ecological Economics, 35(1), 7-23
UNDP (1990 onward) Human Development Report. New York: Oxford University Press

South Asian Network for Development and Environmental Economics20
Veblen, T (1899 [1925]) The Theory of the Leisure Class: An Economic Study of Institutions. Originally published in 1899. Reprinted. London: George Allen & Unwin, 1925
Vincent, JR; Ali, RM; Associates (1997) Environment and Development in a Resource-Rich Economy: Malaysia Under the New Economic Policy. Cambridge, MA: Harvard Institute for International Development
Weisbrod, BA (1964) ‘Collective Consumption Services of Individual Consumption Goods’, Quarterly Journal of Economics, 77, 71-7
Williams, B (1985) Ethics and the Limits of Philosophy. London: Fontana/Collins
World Bank (1992) World Development Report. New York: Oxford University Press
World Bank (2006) Where is the Wealth of Nations? Washington, DC: World Bank
World Bank (2011) The Changing Wealth of Nations. Washington, DC: World Bank
World Commission on Environment and Development (1987) Our Common Future. New York: Oxford University Press
Zilberman, D; Lipper, L; McCarthy, N (2008) ‘When Could Payments for Environmental Services Benefit the Poor?’, Environment and Development Economics, 13(3), 255-278
21
Inclusive National Accounts: Introduction
Boxes
Box 1: Limitations of the Human Development Index
The Human Development Index (HDI) of the United Nations Development Programme (UNDP) is today arguably the most commonly-used indicator of societal well-being? The problem is, it is unable to track sustainable development. And in view of Proposition 3, it is useless for policy evaluation.
HDI is a composite index of GDP per capita, life expectancy at birth, and literacy. The former is a measure of economic activity, while the latter two measures reflect aspects of “human capital” (health and education, respectively). HDI is a pure number, lying between 0 and 1. Since 1990, UNDP has used HDI each year to rank countries. But users of the index (including UNDP) have gone further and tracked the HDI of countries over time, to judge whether a country has improved its performance or fallen behind. And there lies the problem. We show below how and why.
To describe HDI formally, let j (j = 1, 2, 3) denote a desirable attribute: 1 for GDP per head; 2 for life expectancy at birth; 3 for literacy. Suppose the sample of countries being compared consists of N countries (indexed by k; so k = 1,2,...,N). Let Xjk(t) be the numerical index of attribute j in country k. Write max {Xj} as the highest figure attribute j can possibly attain (100% for literacy; 80 years (say) for life expectancy; 50,000 international dollars (say) for GNP per head). And write min {Xj} as the minimum figure j can possibly attain (e.g., 0% for literacy). UNDP (1990) defined country k’s “performance gap” in attribute j in year t to be,
Ijk = [max {Xj} - Xjk(t)]/[max {Xj} - min {Xj}].18 (B-1.1)
In words, the numerator in equation (B-1.1) is the gap between the maximum value j can attain and the value attained by country k; while the denominator is the gap between the highest possible value of j and the lowest possible value. Clearly, Ijk is a number lying between 0 and 1, depending on the performance of the country.
Now use equation (B-1.1) to construct the average performance gap for country j as,
Ik(t) =j S[Ijk(t)]/3.
Ik(t) is a number lying between 0 and 1.
UNDP’s Human Development Index (HDI) for country j in year t is then defined as,
[HDI(t)]k = (1 - Ik(t)). (B-1.2)
Equation (B-1.2) says that [HDI(t)]k is a number lying between 0 and 1; the higher is [HDI(t)]k, the better is country k’s achievements in terms of the three attributes.
HDI has been much advertised by the United Nations Development Programme for over two decades. And because it is a simple index, HDI now has many adherents. But as a quality-of-life measure at a moment in time, it cannot be taken seriously. First, formula (B-1.2) is entirely ad hoc. There are an infinite number of indices that could be created to reflect the idea that GDP per capita, life expectancy at birth, and literacy matter. Take some other index based on those same attributes, and we would obtain a different ranking of contemporary countries. When the Classical Utilitarians proposed that we should sum individual utilities to arrive at a social assessment, they offered a moral conception to justify the move. UNDP by-passed any such thought of producing a justification.
The second thing to note about HDI is the absence of natural capital. That tells us that HDI is incapable of serving effectively in sustainability analysis. In view of Proposition 3, HDI is incapable of serving effectively in policy evaluation.
In either count, HDI is unsuitable for judging the performance of economies over time. Both theory and empirics show that a society’s HDI could increase over a period of time even as its productive base (i.e., wealth per capita) declines. As an index of sustainable development, HDI has to be rejected.
18 Over the years UNDP has modified the definition of Ijk, but none of the modifications affects the argument we offer below.
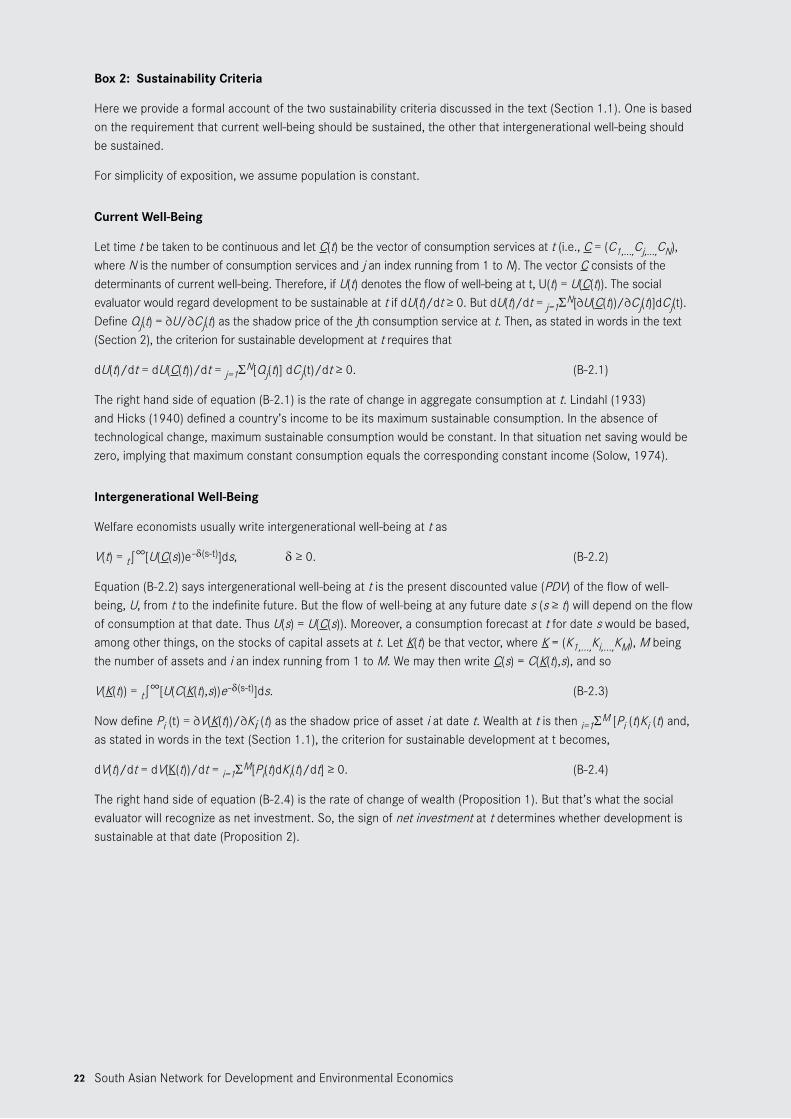
South Asian Network for Development and Environmental Economics22
Box 2: Sustainability Criteria
Here we provide a formal account of the two sustainability criteria discussed in the text (Section 1.1). One is based on the requirement that current well-being should be sustained, the other that intergenerational well-being should be sustained.
For simplicity of exposition, we assume population is constant.
Current Well-Being
Let time t be taken to be continuous and let C(t) be the vector of consumption services at t (i.e., C = (C1,...,Cj,...,CN), where N is the number of consumption services and j an index running from 1 to N). The vector C consists of the determinants of current well-being. Therefore, if U(t) denotes the flow of well-being at t, U(t) = U(C(t)). The social evaluator would regard development to be sustainable at t if dU(t)/dt ≥ 0. But dU(t)/dt = j=1SN[∂U(C(t))/∂Cj(t)]dCj(t). Define Qj(t) = ∂U/∂Cj(t) as the shadow price of the jth consumption service at t. Then, as stated in words in the text (Section 2), the criterion for sustainable development at t requires that
dU(t)/dt = dU(C(t))/dt = j=1SN[Qj(t)] dCj(t)/dt ≥ 0. (B-2.1)
The right hand side of equation (B-2.1) is the rate of change in aggregate consumption at t. Lindahl (1933) and Hicks (1940) defined a country’s income to be its maximum sustainable consumption. In the absence of technological change, maximum sustainable consumption would be constant. In that situation net saving would be zero, implying that maximum constant consumption equals the corresponding constant income (Solow, 1974).
Intergenerational Well-Being
Welfare economists usually write intergenerational well-being at t as
V(t) = t∫∞[U(C(s))e–d(s-t)]ds, d ≥ 0. (B-2.2)
Equation (B-2.2) says intergenerational well-being at t is the present discounted value (PDV) of the flow of well-being, U, from t to the indefinite future. But the flow of well-being at any future date s (s ≥ t) will depend on the flow of consumption at that date. Thus U(s) = U(C(s)). Moreover, a consumption forecast at t for date s would be based, among other things, on the stocks of capital assets at t. Let K(t) be that vector, where K = (K1,...,Ki,...,KM), M being the number of assets and i an index running from 1 to M. We may then write C(s) = C(K(t),s), and so
V(K(t)) = t∫∞[U(C(K(t),s))e–d(s-t)]ds. (B-2.3)
Now define Pi (t) = ∂V(K(t))/∂Ki (t) as the shadow price of asset i at date t. Wealth at t is then i=1SM [Pi (t)Ki (t) and, as stated in words in the text (Section 1.1), the criterion for sustainable development at t becomes,
dV(t)/dt = dV(K(t))/dt = i=1SM[Pi(t)dKi(t)/dt] ≥ 0. (B-2.4)
The right hand side of equation (B-2.4) is the rate of change of wealth (Proposition 1). But that’s what the social evaluator will recognize as net investment. So, the sign of net investment at t determines whether development is sustainable at that date (Proposition 2).

23
Inclusive National Accounts: Introduction
Box 3: Types of Natural Capital
Natural capital is of direct use in consumption (fisheries), of indirect use as inputs in production (oil and natural gas; the wide array of ecosystem services), and of use in both (air and water). The value of a resource may be utilitarian (as a source of food, or as a keystone species) - many people call this its use-value; it may be aesthetic (places of scenic beauty), or it may be intrinsic (primates). It may be all these things (biodiversity). Their worth to us could be from extraction (timber) or from their presence as a stock (forest cover), or from both (forests).
Natural capital often possesses yet another kind of value. It arises from a combination of two things: uncertainty in the future use-value of a resource and irreversibility in its use. Genetic material in tropical forests provides a prime example. The twin presence of uncertainty and irreversibility implies that preservation of its stock has the value of offering society flexibility as regards the future. Future options have an additional worth because, with the passage of time, more information should be forthcoming about the resource’s use-value. That additional worth is often called an option value.
Natural capital’s worth to us could be from the products we are able to extract from it (timber, gum, honey, leaves and bark), or from its presence as a stock (forest cover), or from both (watersheds). The stock could be an index of quality (air quality) or quantity. Quantity is sometimes expressed as a pure number (population size); in various other cases it is, respectively, (bio)mass, area, volume, depth. But even quality indices are often based on quantity indices, as in “parts per cubic centimetres” for measuring atmospheric haze.
We view natural capital here in an inclusive way. At one extreme are fossil fuels. It has become customary to call them “exhaustible resources” because each unit of a fossil fuel used in production is lost forever. Economists sometimes refer to natural capital as “environmental resources”, sometimes as “natural resources”, and at other times as “environmental natural resources”, the double adjective being a way to ensure that readers take their minds off dams, tarmac, bulldozers, chain-saws, and automobiles.
However, when economists speak of environmental resources, they have regenerative resources in mind. Handled with care, such forms of natural capital can be put to use in a sustained way, but get depleted if they are exploited at rates exceeding their ability to regenerate themselves. The central problem in sustainability science is to uncover ways by which a literally indeterminate number of interlocking natural processes that shape regenerative resources can be managed so as to enable Humanity to flourish indefinitely.
Ecosystems
The Millennium Ecosystem Assessment (MEA, 2003) was a pioneering study of the services Humanity enjoys from ecosystems. Ecosystems are a mesh of humans and natural resources interacting with one another at a multitude of speeds and across overlapping spatial scales. What constitutes an ecosystem is therefore dictated by the scope of an environmental problem. A number of ecosystems have a global reach (the deep oceans), others extend over large land masses (“biomes”, such as the Savannah and the tundra), some cover entire regions (river basins), many involve clusters of villages (micro-watersheds), while others are confined to the level of a single village (the village pond).
MEA (2003) offered a four-way classification of ecosystem services: (i) provisioning services (food, fibre, fuel, fresh water); (ii) regulating services (protection against natural hazards such as storms; the climate system); (iii) supporting services (nutrient cycling, soil production); and (iv) cultural services (recreation, cultural landscapes, aesthetic or spiritual experiences). Notice that cultural services and a variety of regulating services (such as disease regulation) contribute directly to human well-being, whereas others (soil production) contribute indirectly (by providing the means of growing food crops).
Pollution vs Conservation
Environmental pollutants are the reverse side of natural capital (Dasgupta, 1982). In some cases the emission of pollutants amounts directly to a degradation of ecosystems (the effect of acid rains on forests). In others, it means a reduction in environmental quality (deterioration of water quality), which also amounts to degradation of

South Asian Network for Development and Environmental Economics24
ecosystems (watersheds). There is then no reason to distinguish resource management problems from pollution management problems. Roughly speaking, “resources” are “goods”, while “pollutants” (the degrader of resources) are “bads”. In this sense, pollution is the reverse of conservation.
The mirror-symmetry between conservation and pollution is well illustrated by the atmosphere, which serves as both a source of nourishment and a sink for pollutants. The atmosphere is a public good. (If air quality is improved, we all enjoy the benefits, and none can be excluded from enjoying the benefits.) It is also a common pool for pollution. That it is a public good means that the private benefit from improving air quality is less than the social benefit. Without collective action there is underinvestment in air quality. On the other hand, as the atmosphere is a common pool into which pollutants can be deposited, the private cost of pollution is less than the social cost. Without collective action, there is an excessive use of the pool as a sink for pollutants. Either way, the atmosphere suffers from the “tragedy of the commons”.

25
Inclusive National Accounts: Introduction
Box 4: Estimating Shadow Prices
There is a Utopian scenario where market prices equal shadow prices. The state of affairs prevailing in Utopia is called the full optimum. There are no externalities at a full optimum (i.e., Ei(t) = 0 in equation (1) in the text). All potential externalities have been internalized in Utopia via institutional reforms and policy changes. In the world we have come to know, market prices are reasonable approximations for some goods and services; for others, they are not.
For public goods and bads, Ri(t) = 0 in equation (1) in the text, which means that Pi(t) = Ei(t). Fisheries in the open seas, carbon concentrations in the atmosphere, and such localized resources as mangroves and coral reefs and streams and ponds are examples of the latter.
Assets are stocks. So Pi(t) is the present discounted value (PDV) of the flow of net benefits generated by a marginal unit of asset i at date t.19 By the same token, Ei(t) in equation (1) is the PDV of the flow of the externalities generated by a marginal unit of i at t.
In estimating shadow prices of natural capital, it is safest to return to their definition. The definition tells us that in order to estimate the shadow price of any capital asset we need:
(a) A descriptive model of the economy. (b) The size and distribution of the economy’s capital assets at the date the evaluation is undertaken. (c) A conception of intergenerational well-being.
Ingenious techniques have been developed for those types of natural capital that are of direct use (Box 3), but are public goods (e.g., amenities and recreational areas, and such sites as are thought to possess intrinsic value (sacred groves). Freeman (1992) and Smith (1997) are fine expositions of the methods. Unfortunately, ecosystem services haven’t been studied much, which is why there is still no textbook on the subject. The February 2011 Issue of the journal, Environmental & Resource Economics (Vol. 48, No. 2), containing a Symposium on “Conservation and Human Welfare: Economic Analysis of Ecosystem Services”, is one of two rare exceptions in the prevailing literature on the valuation of ecosystem services (see especially, Balmford et al., 2011; and Bateman et al., 2011). The other is Haque et al. (2011), which is a fine collection of empirical studies sponsored by the South Asian Network for Development and Environmental Economics (SANDEE), by scholars in Bangladesh, India, Nepal, Pakistan, and Sr Lanka.
Asking Questions and Observing Behaviour
For environmental amenities, an appeal to requirements (a)-(c) above is problematic because of the enormous quantity of information demanded by them. So environmental and resource economists have devised two indirect methods. In one method, investigators ask people to place a value on ecological resources. This is often called contingent valuation. The other method requires investigators to study behaviour and the consequences of that behaviour to infer the value individuals place on those assets. This method is frequently called the revealed preference approach. It has been put to wide use in valuing subtle characteristics of capital assets that are hard to unscramble from their overall values. To illustrate, consider an asset that has multiple characteristics, such as land. The hedonic price method uses the market price of a piece of land to uncover the shadow price of one of its characteristic, for example, the value of its aesthetic qualities.
The hedonic price method has been much used to value real estate. In their work on inland wetlands in eastern North Carolina (USA), Bin and Polasky (2004) found that, other things being equal, proximity to wetlands reduced property values, presumably because of a greater infestation of insects and possibly bad odor. Wetlands have many virtues: decomposing waste, purifying water, and providing a sanctuary for birds and other animals. What Bin and Polasky (2004) discovered is that they may also possess a negative feature, namely bad odour!
As noted previously, the valuation methods that have become most popular were devised for environmental amenities; places of scenic beauty, cultural significance, and do on. The “cost of travel” to a site takes “revealed
19 The discount rate to be used in estimating the present values are social rates of discount.

South Asian Network for Development and Environmental Economics26
preference” to be the basis for valuing the site. Englin and Mendelsohn (1991) contains an application of the method for estimating the recreation value of forests.
The contingent valuation method (CVM) has proved to be extremely popular in those cases where there is no observed behaviour (see Carson, 2004, for an extensive bibliography). The idea is to ask people how much they would be willing to pay for the preservation of an environmental amenity (e.g., flood control) or a resource of intrinsic worth (e.g., an animal or bird species).
Each of the above methods is of limited use for valuing the local natural resource base in the poor world. Moreover, one can question whether requirements (a)-(c) can be met adequately by studying people’s behaviour or analysing their responses even to well-designed questions. One reason for being circumspect about those methods (there are many other reasons) is that people often aren’t aware of environmental risks. Jalan and Somanathan (2008) conducted an experiment among residents of a suburb of New Delhi. The aim was to determine the value of information on the health risks that arise from drinking water containing bacteria of faecal origin. Without purification, the piped water in 60 per cent of households were found to be contaminated. Among households in the sample that had not been purifying their piped water, some were informed by the investigators that their water was possibly contaminated, while the rest were not informed. The authors report that the former group of households was 11 per cent more likely to invest in purification within the following 8 weeks than the latter group. An additional year of schooling of the most educated male in the household was associated with a 3 per cent increase in the probability that its piped water was being treated. The finding is noteworthy because the wealth and education levels of households in the sample were above the national average. If ignorance of environmental risks is pervasive, estimates of the demand for environmental quality that assume full information must be misleading.20
Biases in Estimates
What is the point of basing shadow prices solely on one particular use-value when we know that natural capital often possesses other values too? The answer is that the method provides us with biased estimates of shadow prices. That can be useful information. For example, in a beautiful paper on the optimal rate of harvest of blue whales, Spence (1974) took the shadow price of whales to be the market value of their flesh, a seemingly absurd and repugnant move. But on estimating the population growth functions of blue whales and the harvest-cost functions, he found that under a wide range of plausible parameter values it would be most profitable commercially for the international whaling industry to agree to a moratorium until the desired long-run population size was reached, and for the industry to subsequently harvest the whales at a rate equal to the population’s optimal sustainable yield.21 In Spence’s analysis, preservation was recommended solely on commercial ground. But if preservation is justified when the shadow price of blue whales is estimated from their market price, the recommendation would, obviously, be reinforced if their intrinsic worth were to be added. This was the point of Spence’s exercise.
20 Determining the “willingness to pay” for changes in risk involves additional problems. See Smith and Desvouges (1987). 21 During the moratorium the whale population grows at the fastest possible rate. In Spence’s numerical computations, the commercially
most-profitable duration of the moratorium was found to be some 10-15 years

27
Inclusive National Accounts: Introduction
Box 5: Valuing Natural Capital
Box 4 offered an outline of various methods that have been applied to value natural capital. Here we provide a brief account of a direct method that is likely to prove indispensible for valuing eco-system services.
Using Nature’s Production Functions
We return to requirements (a)-(c) in Box 4, which were seen to be the basis for estimating shadow prices.
Carbon Concentration
The welfare economics of climate change requires carbon in the atmosphere to be priced. It has been customary in that literature (e.g., Cline, 1992; Stern, 2006) to place a global price for carbon concentration. A figure of 20 US dollars per ton for carbon’s global shadow price was suggested by Fankhauser (1995) and Pearce et al. (1996), with but scant justification. That figure was however used in the World Bank’s work on sustainable development (Hamilton and Clemens, 1999; World Bank, 2006). But there are likely to be enormous regional variations in the impact of global climate change on economic activity (Rosenzweig and Hillel, 1998; Mendelsohn et al., 2006; Dinar et al., 2008). Agriculture in semi-arid tropical countries is expected to suffer from warming, while in temperate regions it may benefit. If we apply distributional weights to the losses and gains, the disparity is bigger than the nominal figures that have been suggested, because the former group consists of countries that are almost all poor while the latter are middle-income to rich. Using a range of climate models, Mendelsohn et al. (2006) have published estimates of losses and gains in year 2100. The authors aggregated five sectors: agriculture, water, energy, timber, and coasts. Depending on the scenario, they found that the poorest countries (almost all in Africa) are likely to suffer damages from 12 per cent to 23 per cent of their GDP, while the range of impacts on the richest countries (North America and northern Europe) is from damages of 0.1 per cent to a gain of 0.9 per cent of their GDP. Dinar et al. (2008) fear that with warming, the agricultural income in the semi-arid tropics could be more than halved in 2100 from its projected value in the case where there is no warming. But these estimates are based on market prices. If distributional weights are applied to obtain a global shadow price of carbon, it would be a lot higher than if we were merely to add the regional gains and losses. It should also be noted that the effects of climate change on health and the environment (e.g. loss of species) were not included in those estimates.
Ecosystem Services
Several recent valuation studies have met requirement (a) by estimating the production function for nature’s service (e.g., pollination as a function of the distance to a forest; primary productivity as a function of biodiversity; net reproduction rate of a species), but have otherwise assumed that market data are more or less sufficient to meet the other requirements.22 Pattanayak and Kramer (2001) and Pattanayak and Butri (2005) constructed a hydrological model to measure the contribution of upland forests to farm productivity downstream. Hassan (2002) used quantitative models of woody land resources in South Africa to estimate the value to rural inhabitants of (among other resources) the Fynbois Biome, which dominates sandy soils there. Barbier (1994) and Gren et al. (1994) used formal ecological models to compile a catalogue of the various services that are provided by wetlands. In their study of wetlands in northern Nigeria, Acharya (2000) and Acharya and Barbier (2000) applied models of ground water recharge to show that the contribution wetlands make to recharging the basins is some 6 per cent of farm incomes. That’s a large figure. An ambitious study to estimate the value of ecosystems (biodiversity more generally) at a global coverage is Kumar (2009). That globally, forest services amount to about 6 per cent of world GDP is based on only eight of the 18 services on their list of forest services, is a sobering conclusion.
Option Value
Economists as a general rule encourage decision-makers to maximize the expected value of well-being, whereas environmentalists urge them to keep future options open. There is a sound intuitive basis for the latter. The use of
22 See Dobson et al. (1997), Barbier (2000), Turner et al. (2000), and Tilman et al. (2005) for illustrations of ecosystem production functions and the corresponding dynamics of the socio-ecological systems.

South Asian Network for Development and Environmental Economics28
environmental resources can have effects that are irreversible, implying that decisions today may constrain choices in the future. But that alone is not a reason for concern. If the future is known with certainty, there is no cost to foreclosing one’s future options. It is the twin presence of uncertainty and irreversibility that makes flexibility an attractive feature of a planned course of action. An option value reflects the social worth of flexibility.
Nowhere has the desirability of keeping future options open been advanced as vociferously as in discussions of the need for the on-site preservation of genetic diversity of plants and crops. Tropical forests are particularly noted for providing a habitat for a rich genetic pool, most of which is so far untapped for direct use, but some of which are ingredients in pharmaceutical products. Much attention has been drawn to the continued decay of the genetic variability of crops resulting from an increased reliance on a few high-yield varieties in large parts of the world. As new varieties of crop pests and diseases appear, the chance of locating crop varieties that are resistant to them will be that much lower if genetic reserves are small. The genetic pool is a public good whose value becomes more and more sharply etched with the passage of time. Kumar (2009) contains a recent attempt to estimate the option value of biodiversity.

29
Inclusive National Accounts: Introduction
Box 6: The World Bank’s Approach to Sustainability Analysis
As noted in the text (Section 2), a comprehensive list of an economy’s capital assets would include its population. If demographic features were to remain constant over time, the rate of change in comprehensive wealth would equal what could be called net saving (Hamilton and Clemens, 1999, called it “genuine saving”). Proposition 2 says that in such a situation an economy would be said to be enjoying sustainable development at a point in time if (and only if) net saving there were non-negative. Hamilton and Clemens (1999) estimated average net saving over the period 1970-1996 in 120 countries. Population grew in all countries on the list. As population was not viewed as a capital asset in their work, the sign of net saving in a country could not be relied upon to indicate whether development during the period in question had been sustainable there. The reason is that countries where net saving was positive could nevertheless have been experiencing unsustainable development owing to population growth.
Arrow et al. (2003) showed that estimating the shadow price of population will prove to be especially problematic. Fortunately, it is possible to show (Dasgupta, 2001 [2004]) that the problem can be bypassed if sustainable development is interpreted not as an increase over time in intergenerational well-being, but as an increase over time of the potential well-being of the average person across the generations. Dasgupta (2001 [2004]) also uncovered conditions under which economic development is sustainable at a point in time if (and only if) wealth per capita is non-declining. So we are required to estimate not only the rate of change in wealth (i.e., net saving), but also wealth.
World Bank (2011) recognized the need to estimate wealth in sustainability analysis. The authors estimated the shadow values of some components of wealth: the value of natural, human, and reproducible capital. However, they didn’t attempt to value important forms of what they call “intangible capital”, including human lifespan. They skirted that problem, in effect by assuming a figure for wealth and then assigning to the missing forms of wealth the difference between their assumed figure and the values of those components of wealth they assessed directly. More importantly, the authors defined wealth, not as the shadow value of an economy’s stock of capital assets, but as the PDV of aggregate consumption, from the present into the indefinite future. They estimated that PDV by assuming that aggregate consumption in a country will grow at a specific rate. If the authors were to have assumed a lower growth rate in aggregate consumption, their estimated value of intangible capital would have been correspondingly lower.
The procedure has at least three problems. First, if consumption is taken to be growing at a positive rate, and growing at a rate higher than the growth rate in population, the sustainability of economic development in their list of countries is assumed, not studied. Secondly, there isn’t, nor can there really be, an empirical basis for estimating future consumption without measuring the present basis for it, namely wealth. Third, the identification of wealth with the PDV of aggregate consumption is valid only under the (stringent) assumptions that the economy under study is following an optimal path and the production structure exhibits constant returns to scale. That the former is a bad assumption needs no elaboration. But the latter should be rejected at once in sustainability analysis: non-linearities are ubiquitous in the processes governing the Earth system.

South Asian Network for Development and Environmental Economics30
Figures
The practice: GDP and emissions in OECD countries
Index (1970=100)
Nitrogen oxides
GDP
Sulfur oxides
200
150
100
50
0
ParticulatesLead
1970 1975 1980 1985 1988
b)
The theory
Quantity index
Pollution
Incentives to protext the environment introduced
Cleaner and more efficient technologies adopted in response
Time
GDP
a)
Note: GDP, emissions of nitrogen oxides, and emissions of sulfur oxides are OECD averages. Emissions of particulates are estimated from the average for Germany, Italy, Netherlands, United Kingdom, and United States. Lead emissions are for United States.
Sources: OECD (1991); US Environmental Protection Agency (1991)
Figure 1: GDP and emissions in OECD Countries

31
Inclusive National Accounts: Introduction
Concentrations of sulfur dioxide
Micrograms per cubic meter of air
Income per capita (dollars, log scale)100 1,000 10,000 100,000
55
45
35
25
15
5
1976
1985
Figure 2: Concentrations and sulfur dioxide


South Asian Network for Development and Environmental Economics34
SANDEEP.O. Box 8975, E.P.C 1056, Lalitpur, Nepal
Street address: c/o ICIMOD, Khumaltar, Lalitpur, Nepal
Tel: 977 1 5003222, Fax: 977 1 5003299, Email: [email protected] Web: www.sandeeonline.org
SANDEE Sponsors