Thematic Presentations Business Growth Green Growth Inclusive Growth.
1
INCLUSIVE GROWTH POLICY NOTE 2
AGRICULTURE FOR INCLUSIVE GROWTH IN UGANDA1
A. INTRODUCTION
1. Agriculture is critical for sustainable development and poverty reduction, and agricultural
growth can be a powerful means for inclusive growth.2 The 2008 World Development Report found
that growth originating in the agricultural sector is two to four times as effective as growth originating in
the nonagricultural sector in increasing incomes of the bottom third of the income distribution.3
Agricultural growth has been the main instrument of rural poverty reduction in the most developing
countries, and not surprising, it has also had a much more direct impact on hunger than general economic
growth.4 According to the recent study by Timmer and Akkus, no country has sustained a rapid transition
out of poverty without raising productivity in its agricultural sector.5 While in the long run, the way to
raise rural productivity is to raise urban productivity (unless the nonagricultural economy is growing,
there is little long-term hope for agriculture) and out-migration to the growth areas, the historical record is
very clear on the important role that agriculture plays in stimulating growth in the nonagricultural
economy in the short to medium term.6
2. Uganda’s success in using agriculture for development and inclusive growth will depend on
a variety of factors, some of which are within the sector, some are cross-cutting and general to the
economy, and some are outside Uganda’s sphere of influence, such as the global and regional price
development of agricultural commodities. This Policy Note focuses on those factors that Ugandan
policymakers can influence, both within and outside the direct mandate of agricultural policymakers. The
key policy question in the Ugandan context is how to shift as many farmers as possible out of subsistence
agriculture into commercial agriculture.
3. During the past two decades, a diverse array of initiatives has promoted the
commercialization of smallholder agriculture in Uganda. The results have been quite mixed—over
time, along commodity lines, and in different locations. More success has been achieved in overseas
export products with values more than US$1,000 per ton (for example, coffee, tea, cotton, flowers, and
fish), with high-value products that can compensate high transaction costs in Uganda. In contrast,
performance of low-value food staples has been less successful, given the high share of transaction costs
in their prices, although farmers can cope with these costs for cross-border trade in which Uganda
remains quite competitive. Unless adequate public goods are provided to create conditions for
1 This Policy Note is prepared by Sergiy Zorya (ARD), Varun Kshirsagar (AFTAR), Madhur Gautam
(SAARD), Willy Odwongo (AFTAR), Jos Verbeek (AFTP2), and Rachel Sebudde (AFTP2). It draws on
various background studies recently undertaken for the Uganda Inclusive Growth Project. 2 Inclusive growth is defined as economic growth .
3 See World Bank, World Development Report 2008.
4 H. Binswanger-Mkhize, A. McCalla, and P. Patel, ―Structural Transformation and African Agriculture,‖
Africa Emerging Market Forum, Cape Town, South Africa, September 13–15, 2009. 5 P. Timmer and S. Akkus, ―The Structural Transformation as a Pathway Out of Poverty: Analytics,
Empirics and Politics,‖ Center for Global Development Working Paper 150, Washington, DC, July 23,
2008. 6 C. Barrett, M. Carter, and P. Timer, ―A Century-Long Perspective on Agricultural Development,‖
American Journal of Agricultural Economics 92 (2010): 447–68.

2
smallholders, who account for 96 percent of all farms in Uganda, to increase productivity of food staples,
which account for two-thirds of gross agricultural production, the contribution of agriculture to a shared
growth will remain much below its huge potential.
4. This Policy Note presents major interventions needed to accelerate agricultural
commercialization. It stresses that the current approach to promote commercialization by providing
inputs through the National Agricultural Advisory Services (NAADS) and other projects of the Ugandan
Ministry of Agriculture, Animal Industry, and Fisheries (MAAIF), as well as by targeting a small group
of larger farms, is not only insufficient to induce the desired structural transformation, it is also
economically distortive and fiscally expensive. Support measures may not necessarily target the very poor
(for example, in 2009, the rural poverty in Uganda was estimated at 26 percent). But they should not
exclude the majority of smallholders who are well positioned to commercialize, and the menu of support
measures needs a significant enrichment in addition to the support to NAADS. To attain the structural
transformation through a smooth process of smallholder commercialization, more pro-rural policy and
strategy interventions are needed to improve investment climate, to have better rural roads, to make land
market more flexible and land rights clearer, to improve access of smallholders to finance, to enhance the
provision of quality agricultural services, and to invest in the north. It is a complex multisectoral agenda
with high pay-offs.
5. This Policy Note is part of the larger analytical work carried out by the World Bank on
inclusive growth in Uganda. It therefore feeds into that larger effort. This note does not deal with
migration from rural to urban areas because that topic is covered in other notes. Migration from rural to
urban areas and urbanization are indeed determinants of agricultural incomes over the long run and
should be promoted through all means available to induce structural transformation in Uganda, given its
high population growth and the limited land availability. Yet, there is growing evidence worldwide7 and
from the recent study on integrating the north with the rest of Uganda8 that the economic growth process
as manifested in the structural transformation has become progressively less successful at integrating
agricultural labor into the rest of the economy. The turning point for equalizing agricultural and
nonagricultural productivity and incomes is becoming harder to reach, implying that rural to urban
migration will not happen overnight and that there is a critical need to stimulate agricultural productivity
as a source of economic growth in Uganda, which this Policy Note focuses on.
B. RECENT AGRICULTURAL DEVELOPMENTS
National accounts are likely to have underestimated the recent agricultural growth.
6. The current approach to commercialization in Uganda is based on the assumption that
smallholders would fail to perform, especially in recent years. According to the national accounts,
agricultural growth slowed down to 1.1 percent a year during 2004–08, compared to 5.4 percent during
1998–2002 (Table 1). Correspondingly, key policy documents like the National Development Plan and
the Development Strategy and Investment Plan for Agriculture, declare that more targeted interventions
are required to enhance agricultural growth, going beyond a broad-based development approach.
7 Timmer and Akkus, ―The Structural Transformation as a Pathway out of Poverty: Analytics, Empirics
and Politics.‖ 8 P. Dorosh and J. Thurlow, ―Agglomeration, Migration, and Regional Growth: A CGE Analysis for
Uganda,‖ International Food Policy Research Institute Discussion Paper 848, Washington, DC, February
2009.

3
7. Although more targeted interventions are indeed required, given that the agricultural sector needs
not only for ―prices to be right‖ but also for public goods that will stimulate private investments in the
sector and accelerate commercialization, the current focus of the government on the provision of private
goods instead of facilitation of the private sector to provide those goods is not a sustainable solution. It is
based on a number of incorrect assumptions and perceptions, including recent sectoral performance,
spatial differences, and the superiority of large farms over smaller farms.
Table 1: Share of Primary Growth Sectors in Gross Domestic Product (GDP) and Growth
Performance in Uganda
% share in GDP % annual growth
1988 1997 2004 2007 2008 1988-97 1998-2002 2004-08 2007 2008
Agriculture 51.1 33.1 17.3 14.5 15.4 3.9 5.4 1.1 1.7 2.2
Forestry 2.2 1.7 3.3 3.5 3.4 4.7 7.0 3.9 2.2 4.2
Manufacturing 5.9 8.4 7.0 6.9 7.2 13.2 7.2 6.3 7.6 6.7
Hotels and restaurants 1.1 1.9 4.0 4.1 4.1 13.1 3.8 9.6 9.2 12.5
Mining 0.1 0.6 0.3 0.3 0.4 34.6 8.0 13.0 5.0 10.4
Post &telecommunications 0.2 0.6 2.0 3.0 3.4 10.1 22.8 26.2 16.1 39.6
Construction 4.1 6.5 11.9 12.2 12.2 6.5 6.3 6.3 4.8 5.8
Source: Republic of Uganda, “National Development Plan 2010/11-2014/15”, National Planning
Authority, Kampala, 2010
8. There are many reasons to believe that sectoral growth in Uganda, dominated by
smallholders, has been better than reported in the national accounts. First, the poverty in rural areas
declined from 60 percent to 34 percent between 1992 and 2005/06, and then reduced further to 26 percent
in 2009/10. How could this have happened without positive changes in agriculture since 75 percent of
households derive primary livelihood from agriculture? Second, inflation in Uganda has been lower than
in neighboring countries, which report higher rates of agricultural growth (Table 2). Uganda is a small
open economy that is surrounded by food deficit countries, such as the Democratic Republic of Congo,
Kenya, and Sudan, and other countries, such as Tanzania and Rwanda, that sometimes import foods. If
Uganda‘s per capita agricultural production indeed lags behind that of neighboring countries, then the
inflation should be much larger.
Table 2: Agricultural Production and Inflation in Selected Countries, 2000–09
Ethiopia Kenya Tanzania Uganda
Agricultural value added, annual % growth 6.6 2.3 4.6 2.6
Per capita gross agricultural output (1999_01 = 100) 109 103 110 92
Annual GDP growth, % 8.2 3.7 6.5 7.1
Inflation, consumer prices, annual % 10.9 10.9 6.7 6.4
Source: World Development Indicators and FAOSTAT.
9. Third, Uganda has greatly diversified its export structure away from coffee. It has been
trading actively not only with industrial cash crops shown in Figure 1 but also with food staples—across
borders and with the World Food Program—for which Uganda is the largest source of locally procured
maize in Africa.

4
Source: IMF database.
Table 3 shows that Ugandan export performance was much better than that of its neighbors and was
average in the world during 2000–07. Food staples in Uganda remain less expensive than in most
neighboring countries, which allows Ugandan farmers to compete across borders (Figure 2).
Figure 1. Exports of Uganda, 1990/91–2008/09, US$ million
Source: IMF database.

5
Table 3. Real Agricultural Export Growth in Selected Countries, percent per year
Source: FAOSTAT.
Figure 2: Wholesale Prices of Maize and Beans in East Africa’s Capitals
Source: www.ratin.org.
10. Fourth, the quality of agricultural statistics in Uganda is very weak, and the data from the
national accounts often contradicts the data from the household surveys. For example, according to
the Uganda National Household Surveys (UNHS), maize and bean yields increased between 1999/00 and
2004/05, but according to the national accounts, they decreased (Table 4). Other indicators, such as gross
agricultural output or agricultural value-added, are unfortunately not reported in UNHS and, thus, cannot
be compared. But when the yield trends for major crops go in opposite directions, there are serious
problems with statistical data.
1970-79 1980-89 1990-99 2000-07
Ethiopia 2.4 -1.7 10.9 18.8
Kenya 7.5 -1.1 7.0 8.8
Tanzania -1.0 -7.2 9.4 4.3
Uganda -2.6 -3.4 14.6 15.3
Brazil 5.4 -3.1 7.8 14.4
Malaysia 8.5 0.7 7.3 13.0
Vietnam 10.0 16.6 17.3 11.4
Thailand 9.9 1.5 4.2 10.6
World + 4.7 0.3 4.1 8.4

6
Table 4: Comparison of Yield Estimates from UNHS and Uganda National Accounts
Maize, kilogram per hectare Beans, kilogram per hectare
UNHS National
accounts
UNHS Nation
al accounts
1999–00 1,234 1,732 752 599
2004–05 1,677 1,440 887 560
% change 35.3 –16.9 17.9 –6.5
Source: FAOSTAT and UNHS (1990/00 and 2005/06).
11. These conflicting data highlight the weaknesses of the official statistics in Uganda (and thus
highly encourage improving the collection of agricultural statistics). It also indicates that the
smallholder-based agriculture has very likely performed much better than believed. Agricultural growth
could not have been and cannot be driven by 4 percent of farms cultivating more than 5 hectares (ha)
(Table 5). It is mainly small and medium-size farms that have generated higher agricultural growth and
have fed Ugandans and many of the country‘s neighbors quite well.
Table 5: Distribution of Farm Size
Agro-Ecological
Zones
Small (up to 1
ha) (%)
Medium (1 to 5 ha)
(%)
Large(more
than 5 ha) (%) Observations
Eastern Highlands 53 43 3 1,689
Karamoja Drylands 73 25 2 76
Lake Albert Crescent 51 44 4 655
Lake Victoria Crescent 66 30 3 609
Mid-Northern 62 35 2 312
Southern Drylands 56 38 5 669
Southwest Highlands 55 40 4 375
West Nile 66 30 4 576
Western Highlands 63 34 3 406
National 58 38 4 5,367
Source: World Bank staff calculations based on UNHS III (2005/06).
12. Agricultural growth has taken place in spite of the chronic under provision of public
services to the sector. During 2001–08, the agricultural sector expenditure was only 4–5 percent of total
expenditure, and most spending on infrastructure, especially roads and electricity, bypassed rural areas.
Maintenance of many rural roads has been inadequate, keeping costs of inputs high and farm prices low—
a double taxation on farmers. Table 6 shows that most fertilizers in Uganda are 50 percent more
expensive than in Kenya. The situation is similar for most seeds and chemicals. Because high input prices
require significant cash advances, which under volatile weather and output price unpredictability
(covariant risks) are too risky for many smallholders and even large farms, the use of modern
technologies remains modest, even if they are profitable by calculations (Note: Prices are reported for
Kenya at Nairobi and for Uganda at Kampala.

7
Table 6: Prices of Fertilizers in Uganda and Kenya, December 2009–January 2010, US$ per ton
Types of
fertilizers
Uganda Kenya Difference
in $/ton
Difference
in %
DAP 944 618 325 52.7
SSP 821 662 158 23.9
17-17-17 841 556 285 51.2
CAN 800 424 376 88.8
Urea 718 530 188 35.5
Source: Price lists of selected input supplies companies in Kenya and Uganda.
Table 7: Use of Agricultural Inputs by Farm Size
Full sample
(4.9 acre per
household)
Small farms
(1 acre per
household)
Medium
farms (4.8
acres per
household)
Large
farms (43
acres per
household)
Land with improved seeds (%) 6.7 6.1 7.0 9.6
Land mulched (%) 13.9 13.3 14.0 17.1
Value of fertilizer applied (US$/acre) 0.58 0.19 0.78 2.30
Value of chemicals applied (US$/acre) 0.73 0.26 1.00 2.41
Source: Author’s calculations based on UNHS III (2005/06).
Note: For ease of comparison, an hectare measures 2.47 acres
13. A low use of inputs results in low yields. When the opportunities for opening up new land to
agriculture are much lower than they were only 10 years ago9 and the rapidly growing population requires
more food at lower prices, attention is needed for productivity-inducing public investments. Although
farm yields are unlikely to reach the levels attained on research stations, they can certainly reach the
levels of early adopters of improved low-input and high-input technologies promoted by the National
Agricultural Advisory Services (NAADS) and others, in particular the U.S. Agency for International
Development (USAID) and Danish International Development Agency projects (Table 8). Otherwise, the
significant agricultural potential will remain unrealized.
9 The number of agricultural households in Uganda increased from 3.2 million in 1995/96 to 4.2 million
in 2005/06, resulting in the halving of the average farm size just in 10 years.

8
Table 8: Yields Obtained by USAID Agricultural Productivity Enhancement Program–Supported
Farmers in Uganda, kilogram per acre
Commodity National
baseline
(2003/04)
Demonstration
plot yield with
low-input
technology
Demonstration
plot yield with
high-input
technology
Average
farmer yield
with low-input
technology
Average farmer
yield with high-
input technology
Coffee Robusta 295 700 1,350 450 1,250
Coffee Arabica 135 800 1,800 400 1,750
Banana 2,350 10,000 21,000 7,500 n/a
Cotton 185 420 750 375 680
Upland rice 600 1,500 2,250 1,250 2,000
Sunflower 250 600 900 525 n/a
Maize 520 1,100 2,000 1,000 1,800
Source: USAID, Uganda: Formative Evaluation of the Agricultural Productivity Enhancement Program
(Washington, DC: USAID, 2007).
Spatial differences in agricultural performance are not large, except in the
underperforming N orth.
14. There are spatial differences in farm performance, but those differences are not very large,
except when compared with the North. Figure 3 shows that the median value added from crop
production does not significantly vary by region. The best performing region is the West, which is well
equipped not only with good natural conditions but also with high population density10
and developed
infrastructure. Farmers select the most profitable crops and achieve higher yields, having good access to
infrastructure and markets for inputs and outputs. The country‘s Central and East regions perform worse,
having also worse agricultural conditions, fewer people, and weaker infrastructure. The differences in
performance between poor and nonpoor farm households are also not significant, with both households
generating agricultural income far below those in the nonagriculture sectors. Undoubtedly, the North lags
behind and, thus, requires targeted attention during the next decade to catch up with the rest of the
country.
10
In many cases, population density varies positively with land productivity but up to the point. In some
places in Uganda, where that point is reached with a very high level of density, overcrowding leads to
land degradation.

9
Figure 3: Value of Crop Added Value by Region and by Poverty Category, U Sh per acre
Source: World Bank Staff calculations based on UNHS III (2005/06).
Note: The box and whisker plots describe the distribution of crop income for poor and nonpoor
households in the four regions of Uganda. The rectangular area represents the interquartile range. The left
edge of the rectangle represents the value at the 25th percentile, while the right edge represents the value
at the 75th percentile. The vertical line passing through the rectangle is the median value (that is, 50th
percentile). The end points of the lines extending out from the rectangle represent values at the 5th
percentile and 95th percentile. Outliers are not shown.
15. Although the spatial differences are not large, farmers perform differently depending on
their access to adequate assets and infrastructure even within the same agroecological zone. Those
with access to adequate assets and infrastructure and faced with appropriate incentives actively engage in
markets and generate high agricultural incomes, while those who lack one or more of those three essential
ingredients largely do not. This difference implies that having favorable natural conditions and low-cost
labor is not sufficient to fully use Uganda‘s comparative advantage in agriculture. The government also
needs to invest in public goods, which is discussed in the next sections.
The level of agricultural commercialization in Uganda is low, and its increase
requires more than sectoral programs.
16. What is agricultural commercialization? Agricultural commercialization is far more than
marketing agricultural products. Commercialization is attained when household product choice and input
use decisions are made based on the principles of profit maximization. Commercialization is not restricted
only to cash crops because traditional foods crops are also frequently marketed to a considerable extent;
so, the analysis considers total agricultural production, not particular products. Overall, commercialized
households separate production and consumption decisions and participate in the markets for both staple
and industrial products to maximize profits.11
17. Commercialization is a part of the structural transformation and diversification of
agriculture. At the early stages of development, most farms are subsistent, specializing in producing one
11
M. Jaleta, B. Gebremedhin, and D. Hoekstra, ―Smallholder Commercialization: Processes,
Determinants, and Impact,‖ International Livestock Research Institute Discussion Paper 18, Nairobi,
Kenya, June 2, 2009.

10
or several food staples.12
In the absence of food markets and perceived high price and yield risks, food
self-sufficiency at a household level takes prominence. When an increase in the extent of the market leads
to higher and less volatile prices for nonstaple crops, farmers begin to allocate some land to nonstaple
crops. But the subsistence considerations, along with price and yield risks in an environment where
insurance markets are missing, forces farmers to adopt more diversified crop portfolios rather than
complete specialization in nonsubsistence crops. When the extent of the market reaches a certain
threshold, the price risk is reduced significantly; farmers turn to specialization again, but for markets and
not for their own consumption. Therefore, the two dimensions of structural change—(a) diversification
and specialization and (b) commercialization—are interlinked, and agricultural commercialization usually
proceeds in stages.
In this Policy Note, the two dimensions of structural change are captured by three indexes at the
household level:
a. Output commercialization index = value of agricultural output sold divided by value of
agricultural production. The index takes the value of 0 for subsistence and rises asymptotically to
1 along with rising sales.
b. Input commercialization index = value of purchased agricultural inputs divided by value
of agricultural production. This index equals 0 for subsistence, and theoretically, it is unbounded
because purchases can exceed sales and output.
c. Land concentration index (Herfindahl index) = sum of squares of cropland shares for
each individual farm crop land holding. The index rises asymptotically to 1 as the portfolio is
increasingly specialized.
18. Most farmers in Uganda are at the lower end of output and input commercialization. Figure
4a shows that at the bottom of the distribution 25 percent of all households sell less than 4 percent of their
produce to the market and that at the top of the distribution 25 percent sell more than a 50 percent of their
total production. On the input side, the situation looks even grimmer. About 25 percent of all households
in the lower part of the distribution purchase less than 1 percent of their inputs as a proportion of the total
production value. Of the households in the upper part, 25 percent buy only 23 percent or more as a
proportion of the total production value. This indicates that smallholders in Uganda largely use nontraded
inputs in favor of purchased inputs. Eventually, there is a positive relationship between output and input
commercialization indexes and the scale of household farms in Uganda (Figure 4b–c). Both plots
demonstrate that commercialization increases as the scale of farms grows and stabilizes after reaching the
maximum (Figure 4d–e). The maximums are approximately 10 and 15 acres for output and input
commercialization, respectively. The speed of growth to the point of maximum, however, is different.
Adding more acres (up to about 10 acres) quickly brings households in food surplus, while opting for
purchased inputs is a much slower process.
12
S. Emran and F. Shilpi, ―The Extent of the Market and Stages of Agricultural Specialization,‖ World
Bank Policy Research Working Paper 4534, Washington, DC, February 1, 2008.

11
Figure 4: Crop Commercialization Indexes in Uganda
Source: World Bank staff Calculations based on UNHS III (2005/06)
19. Ugandan farmers are greatly diversified, producing a number of products on their land.
The distribution of the Herfindahl index13
for land concentration for about 75 percent of all households is
below 0.27. The median of this index distribution is 0.17. To put those values into perspective, a farm that
dedicates equal thirds of its land to three different crops would have a Herfindahl index of 0.27. The
13
The Herfindahl index is a measure of the size of farmland area under various crops in relation to total
farmland area and an indicator of crop diversification and concentration.

12
lower median index indicates that it is not rare to see farmers producing four and even more crops at the
same time.
20. A strong U-shaped interplay exists between market participation and land and crop
specialization in Uganda, which illustrates that commercialization proceeds in stages. When farmers
begin selling a larger share of their produce, they first increase diversification of their production portfolio
until they reach about 16 percent of output commercialization (Figure 5). Very few farmers immediately
begin to specialize for markets. This U-shaped relationship implies that promoting certain technologies
through NAADS, for example, would not necessarily result in the immediate specialization in that
commodity. Farmers will keep having a diversified portfolio until they get adequate access to markets,
human capital, and factors of production to disconnect their production decisions from consumption.
According to the 2005/06 UNHS analysis of farmers from 750 rural communities, only when farmers
consistently begin selling more than 40 percent of their output do they turn to specialization for markets.
This evolutionary process is not unique to Uganda, and it calls for appreciation of the various forces in
action that prevent quick promotion of market specialization.
Figure 5: Relationship Between Output Commercialization and Herfindahl index
Source: World Bank staff presentation based on the UNHS III (2005/06).
Note: The figure is a description of the semiparametric fitted additive model of the response variable to its
predictors. Each of the smooth functions represented in the plots is the contribution of the variable to the
fitted additive predictor. The curve is drawn by connecting the points in plots of the fitted value of
function against its predictor. The dashed curves are pointwise two times the standard-error bands, which
can be viewed as approximately 95 percent pointwise confidence intervals.
21. Can farm commercialization be accelerated? Yes, by public investments in infrastructure,
human capital, quality research and advisory services, and other public goods. The analysis of forces that
determine the extent of farm commercialization in Uganda shows that they can be broadly categorized
into external/exogenous and internal/endogenous drivers. Table 9 presents the semiparametric regression
results of modeling the determinants of farm-level commercialization and specialization in Uganda, and it

13
shows the statistical significance of each determinant for each commercialization index.14
The effects of
most variables on commercialization are nonlinear.15
The output commercialization, for example, has a
statistically significant positive correlation with better access to transport infrastructure, consumer
markets, and financial institutions; farm size; value of agricultural and nonagricultural assets; and level of
education of the head of household. The commercialization is negatively correlated with the size of
household, age of the head of household, and women as head of household. Most of the determinants can
be influenced by government policies in the shot run, meaning that the government can accelerate
commercialization by investing in public goods and by improving market-related regulations.
14
The extent of commercialization is also affected by other determinants, in particular research and
advisory services. Yet the data for these determinants is not available, and their impact cannot be tested. 15
See the definition of all variables, description of methodology, results, and representation of additive
fits in O. Nivievskyi, S. von Cramon-Taubadel, and S. Zorya, ―Stages of Agricultural Commercialization
in Uganda: the Role of the Markets,‖ paper prepared for the Inclusive Growth Project and presented at the
Agriculture and Shared Growth Conference at the Brookings Institution, Washington, DC, January 19–
20, 2010.

14
Table 9: The Determinants of Commercialization and Specialization in Uganda: Semiparametric
Regression
Dependent variable Log(output
commercializatio
n)
Log(input
commercializatio
n)
Log (Herfindahl
index)
Estimate Estimate Estimate
Intercept 0.198 0.219*** 0.213***
Transport infrastructure 0.025** -0.023 -0.034***
Sex of head of household 0.038*** -0.028** 0.012***
Off-farm income -0.005 0.025** 0.008***
Financial infrastructure 0.039*** 0.028 0.015*
Semiparametric variables (approximate significance of smooth terms)
p-value p-value p-value
Internal determinants
s(Size of the household) 0.000*** 0.000*** 0.000***
s(Age of the head of household) 0.000*** 0.001*** 0.000***
s(Education of the head of household) 0.000*** 0.067* 0.002***
s(Agricultural cultivated land) 0.000*** 0.000*** 0.000***
s(Log. household agricultural and
nonagricultural assets)
0.000*** 0.009** 0.000***
s(Log. consumption expenditure) 0.013**
External determinants
s(Log. extent of markets) 0.179 0.002*** 0.000***
s(Travel time to common consumer
market)
0.000*** 0.305 0.000***
s(elevation) 0.001*** 0.000*** 0.000***
R2 (adjusted) 32.20% 9.36% 39.70%
Deviance explained 16.10% 6.81% 20.60%
Number of observations 4,187 4,187 4,191
Source: World Bank Staff calculations.
Note: *** significant at the 1 percent level; ** significant at the 5 percent level; and * significant at the 10
percent level.
Small farms in Uganda perform not worse than large farms, which is good given
their limited land resources and very high population density.
22. The question of which farm model is the most appropriate for Uganda has been actively
debated. As shown, the larger farms are indeed more market-oriented by selling a larger share of their
outputs and by buying more inputs—but up to a point. The significant impact of farm size stops after
about 10 acres. In addition, Table 10 indicates that it takes only 0.6 of an acre to be added to the farm
holding of a median poor household to increase the likelihood of that household becoming nonpoor. In
other words, a shift from the poor to the nonpoor farming household in Uganda requires only half an
acre, consistently across all regions. This number is not very large even in land-constrained Uganda,
calling for a flexible land market to help farmers expand if required. Eventually this finding clearly
supports the discussion that increasing farm size alone is not a silver bullet but only one ingredient of the
successful structural transformation in Uganda.
15
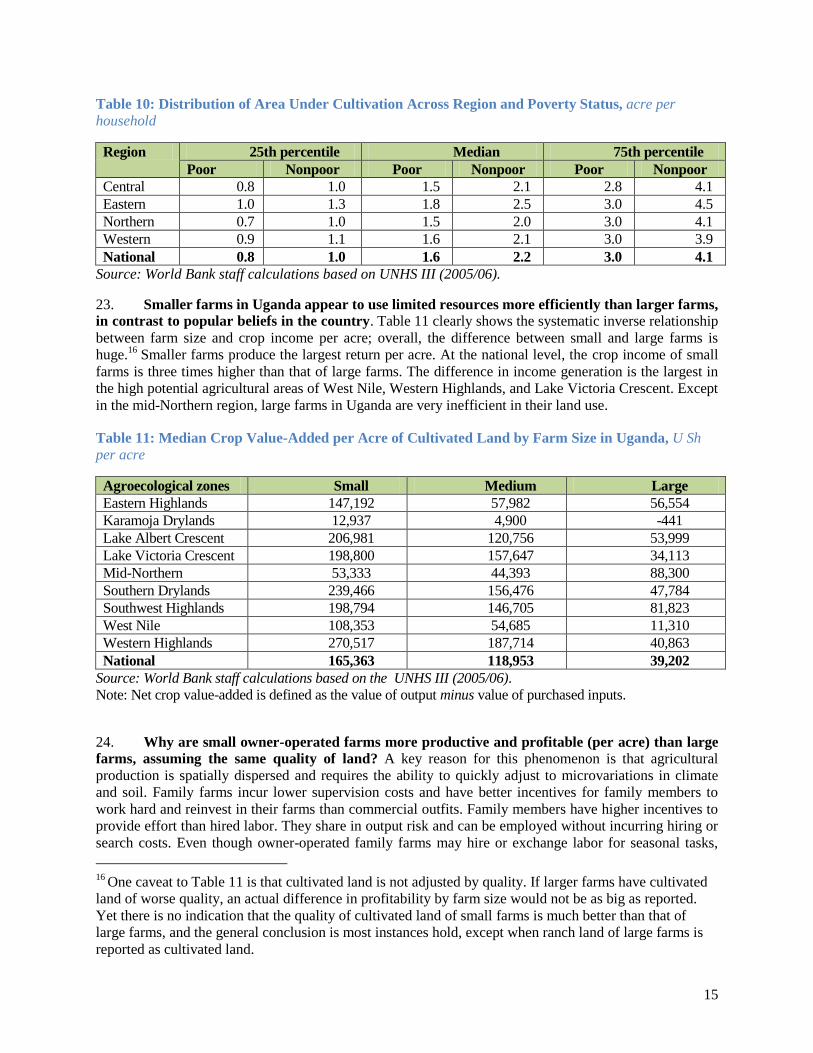
Table 10: Distribution of Area Under Cultivation Across Region and Poverty Status, acre per
household
Region 25th percentile Median 75th percentile
Poor Nonpoor Poor Nonpoor Poor Nonpoor
Central 0.8 1.0 1.5 2.1 2.8 4.1
Eastern 1.0 1.3 1.8 2.5 3.0 4.5
Northern 0.7 1.0 1.5 2.0 3.0 4.1
Western 0.9 1.1 1.6 2.1 3.0 3.9
National 0.8 1.0 1.6 2.2 3.0 4.1
Source: World Bank staff calculations based on UNHS III (2005/06).
23. Smaller farms in Uganda appear to use limited resources more efficiently than larger farms,
in contrast to popular beliefs in the country. Table 11 clearly shows the systematic inverse relationship
between farm size and crop income per acre; overall, the difference between small and large farms is
huge.16
Smaller farms produce the largest return per acre. At the national level, the crop income of small
farms is three times higher than that of large farms. The difference in income generation is the largest in
the high potential agricultural areas of West Nile, Western Highlands, and Lake Victoria Crescent. Except
in the mid-Northern region, large farms in Uganda are very inefficient in their land use.
Table 11: Median Crop Value-Added per Acre of Cultivated Land by Farm Size in Uganda, U Sh
per acre
Agroecological zones Small Medium Large
Eastern Highlands 147,192 57,982 56,554
Karamoja Drylands 12,937 4,900 -441
Lake Albert Crescent 206,981 120,756 53,999
Lake Victoria Crescent 198,800 157,647 34,113
Mid-Northern 53,333 44,393 88,300
Southern Drylands 239,466 156,476 47,784
Southwest Highlands 198,794 146,705 81,823
West Nile 108,353 54,685 11,310
Western Highlands 270,517 187,714 40,863
National 165,363 118,953 39,202
Source: World Bank staff calculations based on the UNHS III (2005/06).
Note: Net crop value-added is defined as the value of output minus value of purchased inputs.
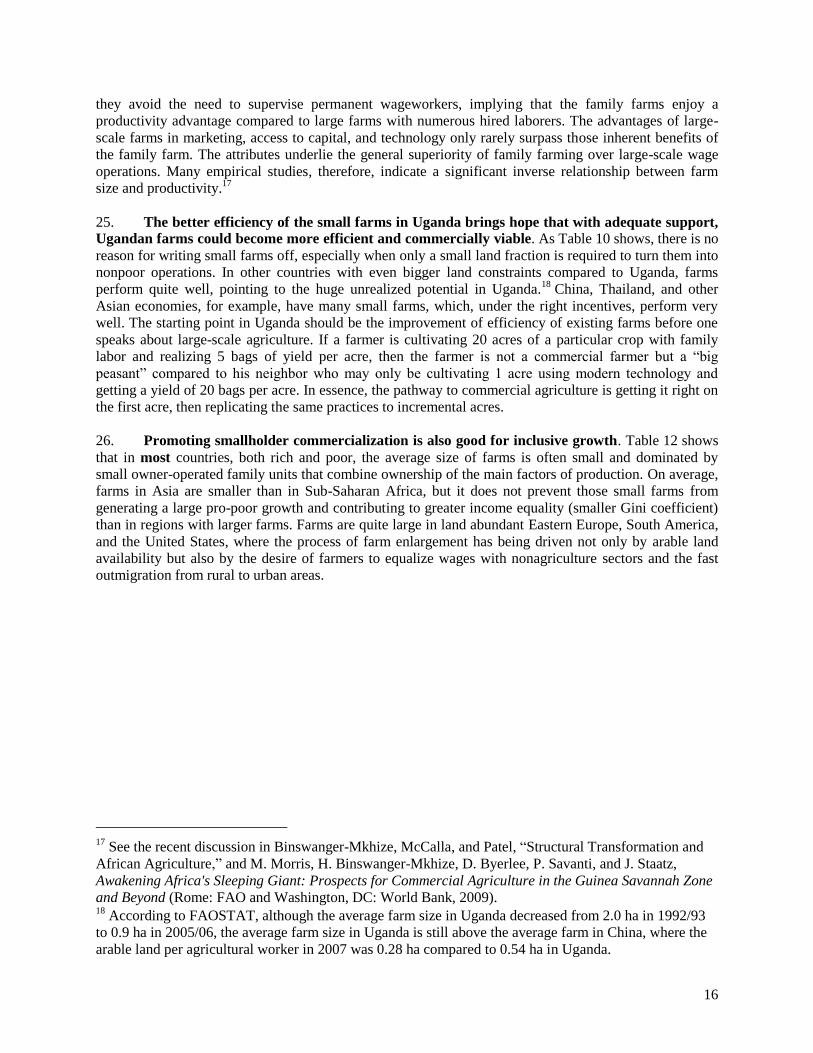
24. Why are small owner-operated farms more productive and profitable (per acre) than large
farms, assuming the same quality of land? A key reason for this phenomenon is that agricultural
production is spatially dispersed and requires the ability to quickly adjust to microvariations in climate
and soil. Family farms incur lower supervision costs and have better incentives for family members to
work hard and reinvest in their farms than commercial outfits. Family members have higher incentives to
provide effort than hired labor. They share in output risk and can be employed without incurring hiring or
search costs. Even though owner-operated family farms may hire or exchange labor for seasonal tasks,
16
One caveat to Table 11 is that cultivated land is not adjusted by quality. If larger farms have cultivated
land of worse quality, an actual difference in profitability by farm size would not be as big as reported.
Yet there is no indication that the quality of cultivated land of small farms is much better than that of
large farms, and the general conclusion is most instances hold, except when ranch land of large farms is
reported as cultivated land.
16
they avoid the need to supervise permanent wageworkers, implying that the family farms enjoy a
productivity advantage compared to large farms with numerous hired laborers. The advantages of large-
scale farms in marketing, access to capital, and technology only rarely surpass those inherent benefits of
the family farm. The attributes underlie the general superiority of family farming over large-scale wage
operations. Many empirical studies, therefore, indicate a significant inverse relationship between farm
size and productivity.17
25. The better efficiency of the small farms in Uganda brings hope that with adequate support,
Ugandan farms could become more efficient and commercially viable. As Table 10 shows, there is no
reason for writing small farms off, especially when only a small land fraction is required to turn them into
nonpoor operations. In other countries with even bigger land constraints compared to Uganda, farms
perform quite well, pointing to the huge unrealized potential in Uganda.18
China, Thailand, and other
Asian economies, for example, have many small farms, which, under the right incentives, perform very
well. The starting point in Uganda should be the improvement of efficiency of existing farms before one
speaks about large-scale agriculture. If a farmer is cultivating 20 acres of a particular crop with family
labor and realizing 5 bags of yield per acre, then the farmer is not a commercial farmer but a ―big
peasant‖ compared to his neighbor who may only be cultivating 1 acre using modern technology and
getting a yield of 20 bags per acre. In essence, the pathway to commercial agriculture is getting it right on
the first acre, then replicating the same practices to incremental acres.
26. Promoting smallholder commercialization is also good for inclusive growth. Table 12 shows
that in most countries, both rich and poor, the average size of farms is often small and dominated by
small owner-operated family units that combine ownership of the main factors of production. On average,
farms in Asia are smaller than in Sub-Saharan Africa, but it does not prevent those small farms from
generating a large pro-poor growth and contributing to greater income equality (smaller Gini coefficient)
than in regions with larger farms. Farms are quite large in land abundant Eastern Europe, South America,
and the United States, where the process of farm enlargement has being driven not only by arable land
availability but also by the desire of farmers to equalize wages with nonagriculture sectors and the fast
outmigration from rural to urban areas.
17
See the recent discussion in Binswanger-Mkhize, McCalla, and Patel, ―Structural Transformation and
African Agriculture,‖ and M. Morris, H. Binswanger-Mkhize, D. Byerlee, P. Savanti, and J. Staatz,
Awakening Africa's Sleeping Giant: Prospects for Commercial Agriculture in the Guinea Savannah Zone
and Beyond (Rome: FAO and Washington, DC: World Bank, 2009). 18
According to FAOSTAT, although the average farm size in Uganda decreased from 2.0 ha in 1992/93
to 0.9 ha in 2005/06, the average farm size in Uganda is still above the average farm in China, where the
arable land per agricultural worker in 2007 was 0.28 ha compared to 0.54 ha in Uganda.

17
Table 12: Mean Farm Sizes and Indications of Operational Holding Sizes in Various Regions
Mean
size (ha)
% < 2 ha Gini coefficient
Sub-Saharan Africa 2.4 69 0.49
South Asia 1.4 78 0.54
East Asia 1.0 79 0.50
Southeast Asia 1.8 57 0.60
Central America 10.7 63 0.75
South America 111.7 36 0.90
Europe 32.3 30 0.60
North America 178.4 4 0.78
Source: R. Eastwood, M. Lipton and A. Newell. 2010. "Farm size." In Pingali, P. L. and R. E. Evenson,
eds., Handbook of agricultural economics. North Holland: Elsevier.
Note: The Gini coefficient ranges from 0 to 1. A low Gini coefficient indicates a more equal distribution,
with 0 corresponding to complete equality, while a higher Gini coefficient indicates a more unequal
distribution, with 1 corresponding to complete inequality.
27. Therefore, smallholder commercialization should be considered a part of an agricultural
transformation process in which individual farms shift from a highly subsistence-oriented production
toward a more specialized production that targets markets for their input procurement and output supply.
In a broader sense, one could see smallholder commercialization as a pathway to the overall economy‘s
structural transformation in which larger proportions of economic output and employment are generated
by the nonagricultural sectors.
C. NEEDED INTERVENTIONS FOR INCLUSIVE GROWTH
28. To date, the policy toward agricultural commercialization in Uganda has mainly
emphasized subsidized technologies through various projects. In addition to the fact that subsidized
inputs are unlikely to boost farm productivity,19
a more comprehensive approach is required to accelerate
agricultural commercialization. That approach includes investments in rural infrastructure, a more flexible
land market, functioning technology transfer between research and advisory services, and rural finance
tailored to the needs of smallholders. Scaling up investments in the North region and tailoring them to its
post-conflict environment are also required to spur inclusive agricultural growth. Furthermore, a better
investment climate is necessary to reduce the costs of doing agribusiness. All those measures would need
to be taken in parallel by many ministries and agencies, thus coordination and leadership by the Ministry
of Finance and Economic Planning is essential. These changes do not necessarily imply the establishment
of new structures in addition to the Plan for Modernization of Agriculture, but rather a consistent effort to
make all public expenditure and policies in Uganda more pro-rural (and thus pro-poor given that most
poor live in rural areas). More road funds need to go to rural areas, more social funds need to go to rural
schools and heath centers, and more agricultural services need to be delivered to rural areas.
29. The sector dominated by smallholders, both poor and nonpoor, requires more support from
the government than the sector dominated by large farms. The provision of agricultural services to
small farmers presents significant coordination challenges and, thus, high transaction costs for the private
19
Subsidized inputs make farmers less efficient by misallocating resources and reduce fiscal space for
investing in public goods.

18
sector. Large farms need a basic enabling environment, which allows them to access the most important
production and marketing support services (capital, inputs, technical and market knowledge, and
marketing contacts) on their own. By contrast, various public interventions are still required to ensure that
those services are provided to smallholders, including through public-private partnerships. This task is
simply more challenging, yet no alternative exists in Uganda, given the severe land constraints.
A better investment climate would reduce costs for agribusinesses and increase
value-added activities for food staples, not just overseas exports.
30. Improving investment climate for agribusinesses is a necessary condition for agricultural
commercialization in Uganda. Currently, most agroprocessing industries (cotton ginning, coffee
processing, dairy processing, grain milling, oilseeds processing, and animal feed milling) are operating at
less than 50 percent use capacity. These firms face high operating costs, in particular electricity, that do
not allow them to pay remunerative prices to farmers, which in turn hampers the farm supply response.20
Although some lead firms succeeded in reducing their costs, offering good market for smallholders, their
success is limited to some crops and locations.21
Until costs are reduced for an industry as a whole, value-
added activities will not take up in a transformational manner.
31. The previous discussion emphasizes the investment climate for agribusiness, not for
farmers, because at the farm level, the price and policy environment in Uganda is very conducive
for undistorted decisions and growth. In other words, agricultural prices are ―just right.‖22
There is no
monopoly in any subsector; once the commodity boards were dismantled, Uganda maintained a free
market environment in agriculture, unlike Kenya and Tanzania, which had policy reversals in this area.
The private sector led agroindustry has created the relatively efficient marketing chains, partially
compensating for the landlocked position of the country. In other words, the marketing margins reflect
competitive costs and are not artificially inflated by government policies. For example, the share of
producer prices for cotton in border lint prices in Uganda is estimated at 70 percent, which is the highest
rate in Africa.23
A Ugandan farmer gets US$0.66 per kilogram of dry cherry Robusta in Rakai compared
to US$0.53 in the neighboring Tanzanian Kagera; with lower production and marketing costs, a Ugandan
farmer obtains profits both at low and high intensity of input use, while a Tanzanian farmer needs to pay
for inefficiencies of cooperatives and highly regulated coffee marketing system, which results in very low
profits.24
The government of Uganda needs to be congratulated for such consistent outward-oriented
policy, which is quite rare in Sub-Saharan Africa.
20
C. Drew, ―Past Successes and Failures in Supporting Agricultural Commercialization in Uganda,‖
report prepared for the World Bank, Uganda Inclusive growth project, June 2010. 21
World Bank and University of Guelph, ―African Smallholders, Higher Value Agrifood Markets, and
Measures to Achieve Compliance with Emerging Standards,‖ research program synthesis, Agriculture
and Rural Development Department, World Bank, Washington, DC, forthcoming. 22
See A. Matthews, P. Claquin, and J. Opolot, ―Distortions to Agricultural Incentives in Uganda,‖ World
Bank Working Paper 51, Washington, DC, December 2007. 23
The share of producer prices in ‗free on truck‘ lint prices between 1990 and 2005 ranged from 43
percent in Mozambique, 62 percent in Tanzania, 64 percent in Benin and Burkina Faso, and 70 percent in
Uganda. See D. Tschirley, C. Poulton, and P. Labaste, eds., Organization and Performance of Cotton
Sectors in Africa: Learning from Reform Experience (Washington, DC: World Bank, 2009). 24
See detailed analysis of prices and costs in J. Keyser, H. Chalu, and F. Namutebi, ―Tanzania and
Uganda: Kagera-Rakai Parallel Value Chain Analyses on Agriculture Products,‖ Poverty Assessment
Phase II, World Bank, Washington, DC, 2010.

19
32. This enabling environment helped induce agricultural growth as described in the previous
section and exploit the country’s resource endowments. Uganda is often presented as having plenty of
fertilize soils, good climate, two growing seasons, and cheap labor. Ugandan exports are largely from the
agriculture sector. Yet, all notable successes of Ugandan agricultural exports have so far occurred in high-
value commodities, with a value of US$1,000 per ton (Table 13). Exports of those products help recoup
the high costs of the Ugandan infrastructure and business environment. In summary, the basic
competitiveness of Uganda still lies more in natural endowment than in created advantage (for example,
lower transport and electricity costs, superior seed technology, and stronger institutions).
33. Now is the time for Uganda to move from relying on its natural advantage (passive agenda)
to creating advantage (active agenda). Just ―getting prices right‖ does not induce broad-based, welfare-
enhancing market participation. Farm households must have access to productive technologies and
adequate public and private goods to produce a marketable surplus. Thus, the government has to get
institutions, infrastructure, endowments, and prices ―just right,‖ as well as to deepen competitiveness and
to unlock constraints for the private sector in order to induce market-based development.
Table 13: Export Prices and Share of Specific Products in Total Exports in 2008, Uganda
Item Prices, US$ per ton % share in total exports
Coffee 1,022 33
Cotton 1,180 5
Tea 1,036 8
Fish products (international) 3,400 21
Maize 212 3
Beans 285 1
Tobacco 1,822 8
Hides and skins 563 3
Simsim 636 1
Flowers 4,484 5
Fish products (regional) 1,028 7
Source: IMF.
Improved rural connectivity would not only reduce farm costs but also increase
farm prices.
34. There is a very strong, empirically proven, positive impact of connectivity on
commercialization and poverty reduction in Uganda. Table 9 presents only one out of many such
empirical proofs.25
Transport costs do not only matter for bulky staple foods, given their low value and
thus higher share of marketing costs in final prices, but also for overseas export products, such as coffee,
cotton, tea, and flowers. Transport costs also matter for input prices and, thus, the use of inputs and
adoption of the improved technologies promoted by the National Agriculture Research Organisation
(NARO), NAADS, the private sector, and various development agencies (Figure 6). Transport costs and
distance to markets are negatively collated with people consumption and, thus, poverty rates. Many
25
See also J. Balat, I. Brambilla and G. Porto, ―Realizing the Gains from Trade: Export Crops, Marketing
Costs, and Poverty,‖ National Bureau of Economic Research Working Paper 13395, Washington, DC,
September 2007; T. Matsumoto and T. Yamano, ―Soil Fertility, Fertilizer, and the Maize Green
Revolution in East Africa,‖ World Bank Policy Research Working Paper 5158, Washington, DC,
December 2009; World Bank, ―Eastern Africa: A Study of the Regional Maize Market and Marketing
Costs,‖ World Bank Africa and Rural Development Report 49831, Washington, DC, December 31, 2009.

20
Ugandan products remain competitive nationally and internationally only because of the favorable natural
conditions, the small size of the country (that compensates for high transport costs per ton-kilometer), and
lower labor wages. Ugandan agriculture will not be able to accelerate commercialization without
substantial reduction in transport costs and prices, and the effects of public expenditure (for agricultural
research, advisory services, and other public goods) on farm productivity will be limited as long as the
transport prices in rural areas remain at the current high level.
Figure 6: Adoption of Improved Seeds by Crop and by Distance to market, kilometer
Source: World Bank staff presentation based on UNHS III (2005/06).
35. In Uganda, contrary to many Sub-Sahara African countries, the government has invested
heavily in the road sector. Road investments remain a priority in the new National Development Plan,
which will further improve connectivity in the country. The past investments in national roads have paid
off, because transport costs have gone down and market integration of regional towns has improved.
However, the integration of rural areas with those towns has not been successful. Figure 7 and
36. Figure 8 shows that variation of farm-gate prices for maize and sweet potatoes is larger within the
agroecological zone than between zones; to reduce the price variations at farm gate, investments in
national roads would not help much. Instead, investments are required in feeder and rural roads (and load
consolidation measures) within the agroecological zones. The condition of most rural roads in Uganda is
highly unsatisfactory, which has been the large impediment for inclusive growth in the country. Distance
to feeder roads, not main roads, has a positive effect on per capita consumption in rural areas, calling for
increased attention to rural roads.26
26
See S. Fan, J. Zhang, and N. Rao, ―Public Expenditure, Growth, and Poverty Reduction in Rural
Uganda,‖ International Food Policy Research Institute DSDG Discussion Paper 4, Washington, DC,
March 2004; and G. Raballand, P. Macchi, D. Merotto, and C. Petracco, ―Revising the Road Investment
Strategy in Rural Areas: An Application for Uganda,‖ World Bank Policy Research Working Paper 5036,
Washington, DC, September 1, 2009.

21
Figure 7: Variation of Maize Prices at Farm Gate in Uganda, 2005/06
Source: World Bank staff presentation based on UNHS III (2005/06).
Figure 8: Variation of Sweet Potato Prices at Farm Gate in Uganda, 2005/06
Source: World Bank staff presentation based on UNHS III (2005/06).
37. The recently prepared 2010 Public Expenditure Review (PER) sets up the framework for
such investments in rural roads in Uganda. Based on that report27
and other analytical work, the
government of Uganda should do the following:
a. More resources need to be allocated for maintenance of the existing roads compared to
construction of new roads. The exception is the North region, where a huge infrastructure gap still exists
and where rural road networks need to be expanded through new capital investments. Current allocations
to most districts in Uganda are sufficient only for routine maintenance; these allocations cannot cover
periodic maintenance and rehabilitation, which means that, even without expansion of the district roads
network, the sustainability of the district networks is questionable without an increase in grant allocations.
Uganda does not look good even in Africa‘s comparison in terms of meeting the maintenance
requirements (Figure 9), and the government‘s ambitious investment plan for rural roads for fiscal year
2008/09 to 2017/18 remains underfinanced (
Table 14).
27
World Bank, Uganda: Public Expenditure Review: Strengthening the Impact of the Roads Budget
(Washington, DC: World Bank, 2010).
0 200 400 600USh/Kg
Western_Highlands
West_Nile
Southwest_Highlands
Southern_Drylands
Mid_Northern
Lake_Victoria_Crescent
Lake_Albert_Crescent
Karamoja_Drylands
Eastern_Highlands
Maize Prices at the Farm-Gate
0 100 200 300 400USh/Kg
Western_Highlands
West_Nile
Southwest_Highlands
Southern_Drylands
Mid_Northern
Lake_Victoria_Crescent
Lake_Albert_Crescent
Karamoja_Drylands
Eastern_Highlands
Sweet Potato Prices at the Farm-Gate

22
Figure 9. Rehabilitation and Maintenance Spending on Roads Relative to Norms in Uganda
and Selected Sub-Sahara African Countries
Source: Africa Infrastructure Country Diagnostic, Africa Infrastructure: A Time for
Transformation. Sectoral Snapshot (Washington, DC: World Bank, 2009).
Table 14. Financing Plan of the Medium Term Expenditure, billion U Sh
Expenditure estimates 2008/09 2009/10 2010/11 2011/12 2012/13 Total
DUCARIP projection 125.5 141.2 156.9 174.2 171.7 769.5
MTEF projections 55.8 75.8 90.8 90.8 90.8 404.0
Shortfall 69.7 65.4 66.1 83.4 80.9 365.5
Source: Ministry of Finance, Planning, and Economic Development MTEF ceiling fiscal years 2007/08–
2012/13.
Note: DUCARIP = District, Urban, and Community Access Roads Investment Plan (a ten-year plan);
MTEF = Medium-Term Expenditure Framework.
b. Rural transport policy and investments should more strongly take into account
agricultural potential. Currently, the agricultural potential is not among the variables for defining
district road allocations, which results in under investment in districts with high agricultural potential,
especially in the North region, and excessive investment in the Southwest.
c. Investing in rural roads should take into account cross-border trade opportunities,
especially with Kenya, Sudan, and Tanzania. A strategy focused on taking advantage of those regional
market opportunities is easier to achieve than one focused on conquering overseas markets. At the same
time, success with such a strategy will help build a basis for subsequently breaking into overseas markets.
The recent road projects along the northeastern corridor (Kenya-Uganda-Rwanda) and the northern
corridor that links northeast Democratic Republic of the Congo, southern Sudan, and Uganda are good
examples of projects that would bring about significant dividends for agricultural growth in Uganda and
the whole east African region. But the investments in trunk roads should be complemented by
investments in feeder roads as discussed earlier.

23
d. Investments in rural roads should be guided by economic potential and load
consolidations. Not all villages have adequate economic potential to produce enough agricultural and
other products to justify the construction of all-weather roads to each village. Currently, the government
uses the rural access index, which measures the proportion of rural people who live within 2 kilometers of
an all-season road, as a benchmark to assess the need for rural transport investments. The analysis in the
2010 PER showed, however, that this index is not a significant determinant of higher consumption in
Uganda. The minimum road connectivity measure is recommended to increase to 8–10 kilometers for
Ugandan rural population, given the problems with load consolidation and high road construction and
maintenance costs in rural areas. The strategy would need to change to build all-weather roads to first
(primary) markets, with sufficient amount of goods consolidated, and to connect them with roads leading
to consumption centers inside and outside of the country. Feeder and tertiary roads to villages from that
primary market can be of lower quality because they are used by intermediate modes of transportation,
not necessarily trucks.
e. Investments in roads should be done more efficiently than has been the case so far.
Policies already being implemented should be consolidated, and increased support needs to be provided
by the Uganda National Road Agency and especially local governments, which are responsible for
investing and maintaining district and rural roads. There are a number of areas where action can be taken
to increase absorption and value for money by focusing on reducing risks and delays in the
implementation of projects and on increasing the efficiency of procedures. Projects are still taking too
long to implement, and cost and time overruns are significantly higher than they should be, as illustrated
in the World Bank‘s 2009 Agricultural PER and the 2010 Rural Roads PER. [[AQ: Give footnote with
full information for these documents?]]
Strengthening land rights would allow increased agricultural productivity.
38. Access to markets is a necessary but not sufficient condition for increased agricultural
commercialization in Uganda as discussed in the previous section. The property rights that farmers
have over natural resources are important in determining whether they take a short- or long-term
perspective in managing resources. Farmers, who feel that their tenure is insecure, with or without formal
rights, are less likely to be interested in conserving resources or in making investments that improve the
long-term productivity of resources. Also, in Uganda, there are often multiple claims to rights over a
given piece of land (for example, farmers and livestock herders) and formal and customary rights overlap.
On a day-to-day basis, the local, including traditional, authorities manage multiple claims, arising mainly
on the mailo tenure system (in Buganda) and the native freehold tenure system (in Ankole and Toro).28
However, a combination of a rapidly rising population, forced changes to livelihood systems, and new
land claims (because of commercial agricultural investment or urbanization), have already begun to upset
the existing equilibrium. The current insecure land tenure and inflexible land market limits land rentals
and, thus, the most cost-efficient way of increasing farm size. Uncertainty over land ownership reduces
the incentives to invest in coffee and other productive trees and in long-term improvements in soil
productivity. Accelerating improvements in land market is a difficult task, but the same is also true in
many other countries. The difference is that, in Uganda, because of the rapid population growth and
limited land availability, failures to address the land market issues will result in the country continuing to
lag behind.
39. Strengthening the security of land tenure would bring many gains. First, it would establish
incentives to invest in higher-value tree crops and sustainable land management. In Uganda, investment
disincentives from the overlapping land property rights are estimated to reduce productivity by 25
28
E. Nsamba-Gayiiya, ―Access to Farmland in Uganda: Status and Outlook,‖ Background Paper prepared
for the World Bank Uganda Inclusive growth project, September 2010.

24
percent.29
Second, clearer property rights would encourage land renting, which is a low-cost solution to
move the land from less to more efficient land users. The difference in the cultivated land endowment
between poor and non poor in Uganda is only 0.6 acre (see Table 10), and a more flexible land market
would help farmers expand (and move out of poverty). Third, enhancing land tenure security would
reduce the need to defend land rights. And last, strengthening security would create the preconditions for
responsible investments in large-scale agriculture, especially in the more land abundant North region,
where the relationship between farm size and productivity appears to be positive in contrast to the rest of
the country (see Table 11).
40. Some of the needed measures are currently included in the draft National Land Policy. It is
necessary to remove land rights uncertainties on tenanted mailo land, which were created by formalizing
multiple and conflicting land rights on the same piece of land in the current land act. To do so, it is
advised to reverse the 2010 amendments to the 1998 Land Act, which imposes heavy penalties on
landlords‘ eviction of tenants, a measure that has greatly discouraged land owners from renting out land
because of fear that renters will not surrender the land at the end of the lease. Enough money should be
placed into the Land Fund (established by the Land Act) for tenants to purchase the residual claims of the
registered landowners, and the options for this fund should be carefully studied. In the customary areas,
certificates of ownership should be issued and registered, empowering the traditional institutions to
manage land and to resolve disputes and conflicts. Removing gender inequality with respect to access,
control, and ownership of land resources must be acted on. These measures are currently discussed in
Uganda and should be incorporated in the new National Land Policy.30
41. Effective implementation of the land legislation is equally important to the legislation itself.
The land registry system in Uganda does not function well and needs to be improved. Only a small
fraction of land is titled in spite of the existence of the legislation. The World Bank is supporting the
government to rehabilitate and modernize the Land Registry and to develop a National Land Information
System, but the progress has been slow and insufficient.
42. Special attention needs to be paid to land issues in the North region. After 20 years of
conflict, the northern part of the country is at a significant transitional moment. Trust among the northern
people over land issues should be cultivated through policies that demonstrate government commitment
to protecting land rights of internally displaced people who are returning. A recent World Bank study
(2009) found a large information gap not only on rights under current law but also on the government‘s
intentions toward land in northern Uganda. Informational campaigns should be launched to inform the
public about land policies, strategies and interventions, and rights and responsibilities of landowners and
users.31
43. There is another emerging land issue worth serious attention: large local and foreign
investments in land. This issue is again more relevant for the North region, which still has some large
29
K. Deininger and D. Ali, ―Do Overlapping Land Rights Reduce Agricultural Investment? Evidence
from Uganda,‖ World Bank Policy Research Working Paper 4310, Washington, DC, August 2007. 30
The government would also need to consider the redistribution of more than 250,000 ha of underused
public land that was leased out to commercial ranches and large chunks of unused lands under
government farms. In the early 1990s, there was a ranches restructuring program whereby some of the
land was allocated to the squatters, but the major part of land remains unused and undistributed. If it were
allocated to the land poor, the benefits from such a program would have been immense.
31 World Bank, ―Uganda: Post-Conflict Land Policy and Administration Options,‖ World Bank
Agriculture and Rural Development Report 46110, Washington, DC, May 2009.
25
tracts of uncultivated land. Recurrent spikes in food and fuel prices, together with expectation of
increased land prices because of a number of factors have recently set off a wave of interest in direct
investment in farming and natural resource–based activities. Foreign investors have also shown interest in
acquiring land in Uganda. Opinions on this issue are divided. Some see it as an opportunity to overcome
long-standing underinvestment in agriculture that could allow countries to gain access to technology and
employment and to create institutional preconditions for sustained and broad-based development. Others
point to the risks where eagerness to attract investors combined with a weak institutional framework
could result in neglect of local rights, conflict, environmental damage, and a resource curse that may
benefit a few but leave a legacy of inequality and resource degradation. The World Bank, jointly with
other international organizations, has formulated key principles for a framework that guides land
investments. A good framework is essential to minimize risks and to maximize benefits from large-scale
investment, in particular (a) to avoid involuntary and permanent loss of assets that could have very
negative consequences for rural households and communities, (b) to attract technically competent
investors who can generate significant economic benefits in line with a country‘s longer-term
development strategy, (c) to encourage the sharing of benefits with local land users who may lack
capacity for negotiation with outsiders, and (d) to ensure adherence to environmental and social
standards.32
Therefore, it is critical to accelerate the improvements in land market to attract large local and
foreign investments in land for inclusive growth in Uganda.
Continued support for research and advisory services is critical to raise agricultural
productivity.
44. Investing in agricultural research and advisory services is necessary to raise still quite low
agricultural productivity in Uganda, thereby promoting agricultural commercialization. The
significant role of research and advisory services in promoting higher agricultural productivity has been
acknowledged worldwide and also in Uganda, which continues to allocate significant resources for these
public goods. They are not only critical in raising agricultural productivity but also in reducing various
risks faced by smallholders ranging from weather events to pests and diseases. Past investments in
research and advisory services in Uganda have yielded significant benefits,33
but the increasing demands
for NAADS to provide more input at the expense of quality advisory services may negate those earlier
benefits. The success of research and advisory services in raising agricultural productivity and reducing
smallholder risks (and, thus, increasing commercialization) will be determined by the efforts to empower
farmers to evaluate service providers, to control grant resources, and to make production and marketing
decisions. In addition, the success will depend on (a) collaboration between research and advisory
services, in particular at the local level; (b) the balance between advisory services and inputs; and (c)
arrangements for delivery of veterinary services outside of NAADS.
45. The weak research-advisory service links continue to be a limiting factor in the transfer of
research outputs to farmers’ fields. The collaboration between NARO and NAADS has been successful
in some locations, but a formal mechanism for collaboration is still missing. NARO Zonal Research
Institutes get poor or no feedback about farmers‘ demands, which constrains the ability to refine
technologies. NARO‘s priority setting does not often capture crucial short-term priorities for enterprise
development and marketing; as a result, there is little match between NARO and NAADS priorities at the
zonal level and, thus, a low overall efficiency of public spending. The foregone revenue just in the coffee
sector from that weak collaboration with the coffee replanting program and fighting coffee welt disease is
32
World Bank, ―The Global Land Rush: Can It Yield Sustainable and Equitable Benefits?‖ World Bank
Report, 2010. [[AQ: Do you have more information for this report?]] 33
World Bank, ―Uganda: National Agricultural Advisory Services Project,‖ World Bank Implementation
Completion and Results Report 1421, Washington, DC, 2010.

26
estimated at US$100 million per year.34
To correct the weaknesses, NARO and NAADS should work
together more effectively. The preparatory work under the Agricultural Technology and Agribusiness
Advisory Services (ATAAS) Project helped identify many entry points for better collaboration. NARO
and NAADS should promote a joint priority setting by planning and implementing on-farm adaptive
research and technology multiplication. Joint capacity building and training programs should improve the
capacity of NAADS district and subcountry staff members in technical and safeguard areas. The two
organizations should also monitor the results of their work and feed management with useful and up-to-
date information, employing the newly available information and communication technologies. All these
activities are planned under ATAAS and should be swiftly implemented to help farmers increase their
productivity and to reduce the risks and effects of pests and diseases.
46. NAADS should not be diverted from its core mandate: to provide information and technical
advice so farmers can increase production and harness market opportunities. The provision of
inputs by NAADS should be limited to demonstrations to encourage a wide adoption of promoted
technologies. If the government wants to subsidize inputs on a large scale, then the subsidy would need to
be delivered through alternative channels, for instance through local governments.35
The provision of
inputs through NAADS, if scaled up from the current small demonstration packages, will be antipoor and
detrimental to the quality of advisory services. Figure 10 shows the previous experience of NAADS with
the integrated support to farmer groups (or input package grants) provided before 2008. The grants were
given to mostly wealthier households (that is, farmers who had the access to commercial credit at full
costs and could afford to purchase inputs on market), thus reducing the inclusiveness of growth. This
contrasts the equal incidence of training, information, and other agricultural advisory services. With the
increased budget for inputs, the bias toward wealthier households would grow. Equally important, the
provision of inputs would significantly distract NAADS service providers from training and delivering
information to farmers. Procurement and management of financial resources for inputs are complex and
time-consuming activities. Limiting the input provision program would free the valuable time of NAADS
field staff members and also eliminate many current problems with corruption and politization of advisory
services.
34
World Bank, ―Uganda Coffee Supply Chain Risk Assessment,‖ presentation of the Agricultural Risk
Management Team, Agricultural and Rural Development, August 27, 2010. 35
To develop such a subsidy program, the government would need first to consider fiscal implications
and then have in place implementation arrangements that do not crowd out but crowd in the private sector
to ensure the sustainability of a temporary public provision of private goods.

27
Figure 10: Incidence of Credits and Public Expenditure of NAADS Members by Wealth Quintile
Source: World Bank, ―Uganda: Agriculture Public Expenditure Review,‖ Report 53704-UG,
World Bank, Washington, DC, February 28, 2010.
47. Finally, better veterinary services are required to support the livestock sector. These
services are outside of NAADS mandate, contrary to current perception in agricultural agencies, and
implementation arrangements for their provision would need to be defined. Public sector actions should
improve animal health and food safety through the provision of public goods and incentives for private
service providers to serve farmers and to induce commercialization. The priority is to define the delivery
mechanisms of such services, the respective roles of national and local governments, and the mandate of
the public sector. Despite many studies, the division of labor between national and local governments and
between NAADS and local governments remains unclear, which is why the veterinary services of the
Ministry of Agriculture, Animal Industry, and Fisheries remain greatly underfunded. Because NAADS
invests large resources in promoting livestock, the clear delivery mechanisms for veterinary services need
to be developed and the structures need to be established to allow the efficient use of public funds.
Enhanced access of smallholders to rural finance would help them invest more and
commercialize some of their activities.
48. Increased access to rural finance is also important. The analysis of the determinants of
agricultural commercialization indicates that farmers with better access to finance tend to sell a larger
share of their production. Commercial banks are unlikely to increase lending to smallholders of their own
accord, so innovative schemes must be developed, taking into consideration that direct credit to
agriculture by the public sector failed in the past. To improve the access to finance, the government would
need to take a number of measures discussed next.
49. The first task is to make savings and credit cooperative organizations (SACCOs) more
effective and efficient financial institutions. SACCOs, along with other microcredit institutions, are
closest to smallholders and have the potential to increase access to affordable finance. SACCOS need to
0
1,00
02,
000
3,00
0
Cred
it, G
rant
s & S
ubsid
ies p
er ca
pita
(USh
)
1 2 3 4 5
Incidence of Credit, Grants & Subsidies over Wealth Quintiles : 2007
Total Credit Support per capita (USh) Total Grant Support per capita (USh)
Total Subsidy Support per capita (USh)
28
be gradually integrated in a regulatory framework, and their internal efficiency needs to be significantly
improved.36
50. The second task is to target agricultural leasing. An independent leasing law needs to be
enacted. A well-drafted leasing law that governs leasing operations would be of substantial benefit to the
industry. Contractual provisions between parties (the lessor and the lessee) currently present challenges
because enforcing them can become an extremely lengthy and costly process. The legislation is
particularly important to small businesses that require simple documentation. This change will ultimately
lead to the simplification and shortening of lease contract documents. Moreover, it is necessary to amend
the Value-Added Tax Act to reduce tax impediments to leasing.
51. The third task is to promote matching grants for farmers. The international experience shows
that matching grants can be an effective tool in promoting access to finance and inducing innovations and
commercialization of small farmers, if designed and implemented properly. NAADS intends to establish
the Commercialization Challenge Fund to provide matching grants to integrate smallholders into value
chains by forging partnerships between smallholders and commercial growers and by promoting
competitiveness of agribusiness. The fund also seeks to encourage progression of farmers from
subsistence and lower initial level of market orientation to commercialization of their farming activities.
During 2010/11–2015/16, NAADS plans to allocate US$52 million to the program. Yet, the success of
the fund will depend on its future implementation arrangements. The fund is still being designed, and it
should rely on the strong existing capacity and professional management specialists in Uganda that have
experience in managing matching grants. Some functions may be outsourced, such as advertising,
proposal invitations, blind reviews and evaluations of proposals, and the impact evaluation of the projects.
These functions will ensure transparency, fairness, and independence in the selection process. Overall,
because this will be the new activity for NAADS, the experience of the first three years should be
carefully assessed before scaling up.
52. The fourth task is to promote the use of warehouse receipts and to manage expectations on
what the receipts can and cannot do. The requirements for warehouse receipts are quite demanding
even if the concept is simple and appealing. There is a need for a standardized and readily implemented
grading system so that commodities can be bulk handled and ownership can be determined merely by
weight and grade. Appropriate storage facilities with sufficient managerial capacity must be available.
Storage managers should be able to read markets to make proper business decisions. Banks should trust
the system and accept warehouse receipts as collateral. Smaller farmers need to be grouped together so
that high volumes of produce are available. And the program needs to cover large areas to limit the
impact of correlated weather and price shocks. In other words, there should be preconditions for active
private storage. Unfortunately, most of the preconditions are not yet met in Uganda and are unlikely to be
met in the near future. The Uganda Commodity Exchange is addressing some of the challenges by
making the system open to all players, starting the system with large warehouses in the major places of
concentration, and rapid profiling of the grades of various storable commodities traded in Uganda so that
the number of qualifying commodities can increase. Much more work still needs to be done to allow the
countrywide implementation and significant effect on commodity trade.
53. Warehouse receipts may, however, be a useful tool for encouraging some local development.
Yet it requires strong donor support. A donor may decide to promote local storage; to create the village
storage bank; to subsidize the costs of collateral management, which typically ranges from US$2,500 to
US$3,000 a month, and to help attract banks through credit guarantees. Such schemes might have a
36
See the detailed analysis and policy recommendations in World Bank, Making Finance Work for
Uganda (Washington, DC: World Bank, Financial and Private Sector Development, Africa Region,
2009).

29
positive impact on communities and might solve some problems such as overselling grain at low prices
and then buying back at high prices. Yet, as the experience of the operation of cereal banks in Western
Africa shows, it requires a continuous donor support and the focus on food access objectives, without
trying to sell stored products for profit and to compete with markets.37
The conclusion is that warehouse
receipts cannot substitute for creating a favorable environment for private storage but they can be
instrumental to push the work in the right direction.
Scaling up of targeted interventions in the North region would bring about many
benefits of shared growth.
54. Northern Uganda requires targeted interventions to catch up with the rest of the country
and to exploit its large agricultural potential. Agriculture in the North region faces many similar
challenges as the rest of the country and must follow the same pathways described in the previous
sections, albeit from a much lower starting point. More of the same things need to be done there, given
the large underinvestment in the past. Yet, success in the region will be achieved not only from scaled-up
investments but also from taking into account particular challenges of the region, namely its particular
vulnerability to food insecurity, the prevalence of land disputes, and the engrained dependency
mentality.38
55. Those challenges must be taken into account when designing the implementation
arrangements of programs in the North. For agricultural programs to be successful, proper
communication in a timely manner on the intent of projects and their expected implementation
arrangements must be made. Returned refugees are used to receiving free aid and inputs, and with scaled-
up NAADS activities, for example, clear communication should be put in place to manage expectations,
in addition to having an adequate staff presence at the district and subcounty levels to implement and
monitor the programs. In some cases, farmer groups would need to be reestablished if they were initially
established in the refugee camps, and their capacity would need to be strengthened not only on production
but also on marketing activities. Finally, the government would need to accelerate the improvement of the
land administration system to minimize risks and to maximize benefits from potential large-scale
investment in the region‘s land.
Implementing the institutional structure that is part of the DSIP will greatly
facilitate the effectiveness of the ongoing and foreseen interventions in the sector
56. A recent completed background study39
concludes that there is no need to revise the
institutional arrangements in the agricultural sector, but that GoU should put in place the overall
institutional structure (see figure 1) that was agreed upon and incorporated in the DSIP in 2010 and do
this without further delay. The 2010 MAAIF restructuring exercise would deal with most of the earlier
identified short coming40
.
37
See World Bank, National Resources Institute, and Food and Agriculture Organization, ―Missing Food:
The Case of Postharvest Losses in Sub-Saharan Africa,‖ Report 60371, Washington, DC, 2011. 38
D. Fiocco, ―Social Capital and Market Participation in Northern Uganda,‖ study funded by the U.S.
Department of State and the International Institute of Education‘s Fulbright Fellowship Program, 2009. 39
World Bank Mimeo “Making growth more inclusive: agricultural sector institutional reforms and
restructuring report” May 2011. 40
See Final report on restructuring and reform of MAAIF 2010

30
Figure 11: Illustration of institutional arrangements in the agriculture sector
Source: Report on the Functional and Institutional Analysis of PMA, 2010
57. However, there is a need to improve coordination among the various institutions, in and
outside of Government, to minimize overlap and duplication which dissipates effort, consumes
additional resources and thus undermines efficiency and value for money. This is the task of MAAIF
under its ministerial mandate, which MAAIF appears to have abdicated in particular with respect to
agencies which have their own financial Vote. Intra sectoral coordination should be an integral part of the
work program of the PS of MAAIF and its management team, while inter sectoral coordination could be
usefully handled by the PMA secretariat.

31
58. The configuration of the agreed macro structure of MAAIF (see figure 2) would greatly
facilitate the implementation of the DSIP. Delay in and or failure to implement the new MAAIF
structure is likely to have an adverse impact on the overall implementation of the DSIP given that its
structure was designed to provide responsibility and accountability for its various programmes and sub-
programmes.
Figure 12: Configuration of the proposed MAAIF Marco Structure
Source: Final report on restructuring and reform of MAAIF 2010
59. Consequently, MAAIF could usefully undertake a number of interim actions to
demonstrate its commitment to the new structure. These actions are:
Establishing Restructuring Implementation Team (RIT): There is no real compelling reason
why the RIT has not been established and why it is not functional. The RIT was intended to make
detailed plans for the implementation and actualization of the new structure and these activities
could be performed regardless of other delays. Establishing the RIT would have made the
strongest statement possible of MAAIF‘s intentions and commitment for the new structure.
Dissemination of information on the new structure: The assessment is that MAAIF‘s efforts to
disseminate information on the new structure could have been more vigourous and done with
conviction. It is understood that this is partly due to the fact that although the new structure was
approved by the ASWG, there has since been some dissentions and this has blunted or
undermined the enthusiasm for the new structure. Concerted effort to disseminate the new
structure would have not only demonstrated MAAIF‘s commitment for the new structure but
would have been a way to lobby for the support of other key ministries such as MoPS and
MoFPED.
Directorate of
Crop
Resources
Directorate of
Livestock
Resources
DSIP
Objectives
fulfilled
Directorate of
Policy, Planning
& Support
Services
Agricultural
Infrastructure &
Water
Policy & Planning
Agribusiness &
Sustainable Markets
Directorate of
Fisheries
Resources
Finance & Administration; Internal Audit; Public Procurement &
Disposal
MAAIF Sector agencies, LGAs, Related GoU Ministries, DPs and
Private sector

32
Review and reassignment of staff: While clearly the finalisation of this action would depend on
MoPS, a number of actions could have been taken in preparation of that final approval. The staff
audit remains necessary, whether or not the new structure is in place, to map out the current
disposition of staff including their location, roles, responsibilities, and capabilities.
Identification of staff development needs: Again this can and should be done notwithstanding
developments in other areas. Even if there was no new structure, it is very important to identify
and address the development needs of staff in order to ensure that the institution has the right
calibre of staff to perform its responsibilities and fulfil its mandate.
Beyond coordination, the challenge of human resource capacities within the various
institutions and in particular in MAAIF will need to be addressed
60. The public sector involved in agriculture faces both common and unique challenges related
to human resources. The common challenges are those that are faced by most public sector institutions
and these include poor attraction and retention rates owning mostly to poor remuneration practices and
working conditions; low productivity due to low morale and motivation of officers and inefficient
organisation management systems and processes; high vacancy to establishment ratios owing to a
combination of the above and other factors. These problems cannot be resolved by the agricultural sector
on its own and require government-wide interventions to reform the public sector as a whole.
61. The MAAIF restructuring report of 2010 observed that MAAIF is afflicted by the
tendencies and incidences of the sector agencies, in particular PMUs attracting staff from MAAIF
HQ because they have far more competitive and attractive rewards structures. In this regard
MAAIF is seen as a recruiting ground for these agencies, read PMUs leaving the ministry with less
qualified staff. Henceforth, MAAIF could usefully to take ownership of its projects and abolish the
practice of setting up a PMU for each project it initiates. Related to this, some of these agencies have
become more ―powerful‖ than the mother ministry and function autonomously in a manner which
increasingly makes them appear like parallel institutions, which are detached from the parent ministry.
This has adversely impacted on the management of human resources in the sector.
62. This is compounded by the fact that there are chronic staff shortages MAAIF and sector
agencies. In 2010, MAAIF was operating at approximately 68 percent of its authorized establishment
while for its sector agencies, excluding NAADS for which no data was available, vacancy ratios ranged
from 8 to 28 percent as of September 2010. It will be important to agree on a recruitment plan in
collaboration with MoFPED as to ensure adequate funding of these recurrent costs.
63. Even though the institutional structures are supportive of the planned interventions in the
sector, it will be critical to ensure that the right staffs with the right skills are occupying the correct
positions. A skills audit could usefully help identify staff training and development needs as a means to
assist with effective human resources management and ultimately with the overall effectiveness of service
delivery in the sector. Quite often countries outsource such an exercise, but certainly in the case of
Uganda this undertaking could best be done in house, by MoPS or under the auspicien of MoFPED.