Inclusive Growth Analysis - United Nations · Macroeconomic Stability, Inclusive Growth and Poverty...
34
Macroeconomic Stability, Inclusive Growth and Poverty Reduction: emerging challenges in a post-2015 development agenda Presentation by Gilles Alfandari, World Bank EGM for the Advancement of the Post-2015 UN Development Agenda, New York February 29, 2012
Transcript of Inclusive Growth Analysis - United Nations · Macroeconomic Stability, Inclusive Growth and Poverty...

Macroeconomic Stability, Inclusive Growth and Poverty Reduction:
emerging challenges in a post-2015 development agenda
Presentation by Gilles Alfandari, World Bank
EGM for the Advancement of the Post-2015 UN Development Agenda, New York
February 29, 2012

1. Can the link between the global and the national levels help create policy
space for developing countries?

2. Priorities for the post-2015 agenda

Economic growth is critical to attain the MDGs
4

Economic and policy environment tumbles during downswings
5

MDG prospects depend on global macroeconomic developments
Source: WDI; World Bank staff projections
Real GDP growth (% p.a.)

These developments are not good: Growth forecasts have been downgraded
repeatedly since January 2011
-6
-4
-2
0
2
4
6
8
10
2005 2006 2007 2008 2009 2010 2011 2012 2013
June 2011 baseline
January 2011 baseline
Developing High-income World
Projected growth
7 Source: World Bank, Global Economic Prospects, 2012A.

0
5
10
15
20
25
30
Jan-09 Jun-09 Nov-09 Apr-10 Sep-10 Feb-11 Jul-11 Dec-11
Bond issuance Equity placement
Syndicated bank loan
Gross capital flows to developing countries down 50 percent in second half of 2011
3-month moving average ($ billion)
8 Source: World Bank, Global Economic Prospects, 2012A.

Developing countries are more vulnerable to a renewed crisis than in 2008
• Turmoil since August has affected financial conditions in developing countries and economic activity worldwide
• Policy response constrained by limited policy buffers, with reduced fiscal space and maturing debt, for active countercyclical policies
• Countries with large amounts of ST and maturing LT debt should seek to refinance early to limit effects of a potential freezing of capital markets (impact from bank deleveraging in high-income world).
• Countries should stress-test their banking systems, especially if credit has grown rapidly in recent years or they are heavily reliant on wholesale financing.
• Commodity exporters could be hurt by collapse in commodity prices.
• Other exporters are facing weaker export demand
• Remittance dependent countries may also be vulnerable
• Natural Disasters, particularly in East Asia Pacific: >70% of world's natural disasters; 13 of the 30 most climate affected countries.
• Much more serious consequences could be envisaged, if financial-sector solvency is affected or a market-induced credit event occurs. It could potentially be as significant as in 2008/09.
9

Fiscal deficits have risen sharply in many developing countries
0
5
10
15
20
25
30
35
-15 -10 -8 -6 -4 -2 0 2 4 More
2007
2010
Share of countries with deficit > 4% of GDP: In 2007 – 18 percent In 2010 – 42 percent
10
Perc
ent
of
dev
elo
pin
g co
un
trie
s
Government balance (% of GDP)
Source: World Bank DEC Prospects Group

Remittances could fall by more than 6% if situation in the Eurozone deteriorates
-5.0 -4.5 -4.0 -3.5 -3.0 -2.5 -2.0 -1.5 -1.0 -0.5 0.0
Armenia Nepal
Gambia, The Samoa
El Salvador Lesotho
Moldova Nicaragua
Kyrgyz Republic Tajikistan
Severe Crisis Moderate Crisis
-10.0 -8.0 -6.0 -4.0 -2.0 0.0
South Asia Middle-East and North Africa
Sub-Saharan Africa Latin America and Caribbean
East Asia and Pacific Europe and Central Asia
Percent change in remittances (from baseline)
Change in remittances (from baseline), % of GDP
Source: World Bank, Global Economic Prospects, 2012A.

High levels of external short- or maturing long-term debt place countries at risk
0.0 5.0 10.0 15.0 20.0
Bulgaria Latvia
Lebanon Lithuania Romania
Kazakhstan Jamaica Ukraine
Chile Malaysia
Albania Turkey
El Salvador Georgia
Macedonia, FYR Belarus
Peru Vietnam
India Guatemala
Uruguay Moldova
Nicaragua Paraguay
Philippines
Short-term debt (includes trade finance)
Long-term debt coming due in 2012
Short-term and maturing long- term external debt in 2012 (% of GDP)
Source: World Bank calculations using Debt Reporting System and BIS. 12

Should we be concerned about debt or growth?
• Moderate debt and limited budget deficits improve welfare and enhance growth. – Investment-savings intermediation (private).
– Provision of public goods and countercyclical policies (public).
– Managing volatility of incomes, sales, and revenues.
• Excessive debt and large budget imbalances hamper growth and threaten financial stability. – Higher interest rates and cost of capital.
– Increase taxation to repay debt.
– Less fiscal space for countercyclical policies.
– Vulnerability to macro shocks.

Some better news: ODA increased by a real 6.3% to $127.3 billion in 2010
(0.32% of GNI) ODA targeting has continued to improve, with more disbursements to countries furthest from the MDGs
120 124
177
147
187 197
72 79
66
0
50
100
150
200
250
1990-1992 2000-2002 2008-2010
Net ODA received per capita by number of targets achieved or on track (constant 2009 US$)
0-2 targets
3-5 targets
6-10 targets

low-income countries have decoupled from advanced economies (but no cyclical decoupling
for emerging economies)
-6
-4
-2
0
2
4
6
8
10
2000 2001 2002 2003 2004 2005 2006 2007 2008 2009 2010 2011 2012 2013
World Low-income Middle-income High-income
Source: WDI; World Bank staff projections
Real GDP growth (% p.a.)

Emerging economies are driving global growth – in an increasingly multipolar world economy
Developing countries‘ share in world GDP
0%
10%
20%
30%
40%
50%
1980 1985 1990 1995 2000 2005 2010
at market exchange rates at PPP
Developing countries’ contribution to growth in world GDP
-20%
0%
20%
40%
60%
80%
100%
120%
1981–85 1986–90 1991–95 1996–2000 2001–05 2006–10
HICs DCs ex-BRICs Brazil Russia India China
At market exchange rates
Source: World Bank WDI database

… and are driving world trade
0%
10%
20%
30%
40%
50%
1990 1994 1998 2002 2006 2010
DCs' share in world imports
DCs' share in HIC exports
Intra-DC imports as share of total DC imports
0%
20%
40%
60%
80%
100%
1991–95 1996–2000 2001–05 2006–10
HICs' share in growth in world imports
DCs' share in growth in world imports
Source: World Bank WITS, IMF DOTS
Developing countries’ share in world and South-South trade
Developing countries’ contribution to growth in world trade

Emerging economies now hold two-thirds of total international reserves
0
2000
4000
6000
8000
10000
12000
International Reserves (in billions of US dollars)
Advanced Economies Emerging Economies excl. China China
Source: IFS; Q2 data reported for 2011

Channeling more global savings to investment in developing countries would raise global growth
and reduce imbalances
GDP: % deviation
-5
0
5
10
15
20
25
30
35
2010 2012 2014 2016 2018 2020 2022
World High Income Developing
Trade balance: % GDP deviation
-6
-4
-2
0
2
4
6
8
2010 2012 2014 2016 2018 2020 2022
United States China
Source: Simulations with G-cubed model. All results are expressed as percent deviations from baseline.
Scenario showing potential gains from fiscal consolidation in advanced economies and redirection of global savings to investment in infrastructure in developing countries
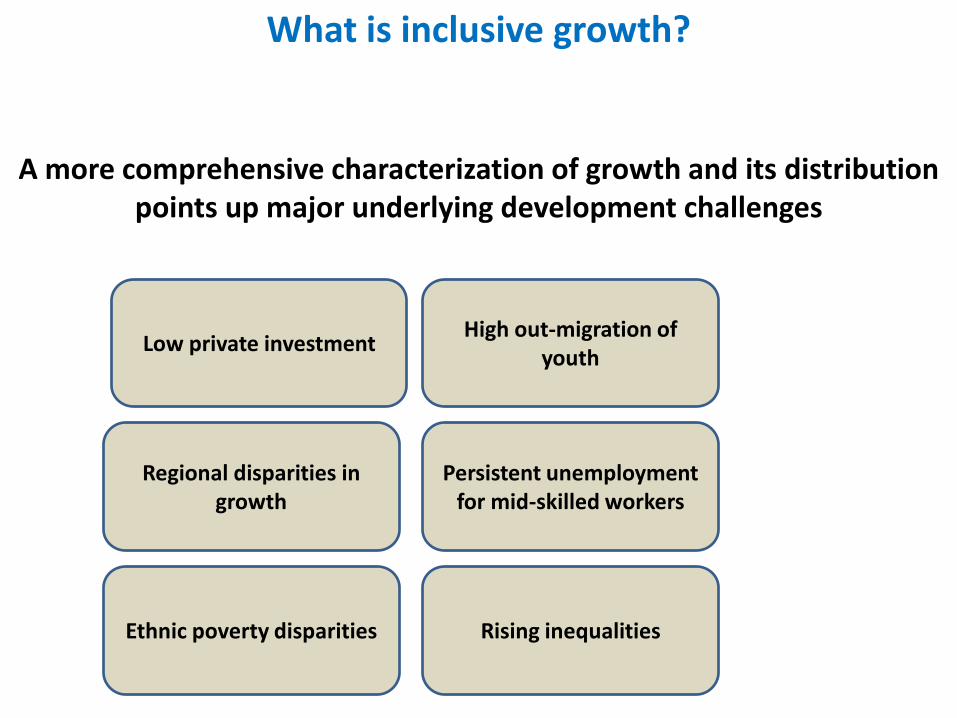
A more comprehensive characterization of growth and its distribution points up major underlying development challenges
Low private investment High out-migration of
youth
Regional disparities in growth
Persistent unemployment for mid-skilled workers
Ethnic poverty disparities Rising inequalities
What is inclusive growth?

Why inclusive growth?
• It moves the focus beyond the pace of economic growth to the pattern of growth
• It involves both overall economic growth and some metric of distribution
• It moves from ex-post redistribution to a focus on the ex-ante distribution of production potential
• The proceeds from economic growth (from the accumulation of productive assets to their utilization in productive processes to the benefits received in the process) be shared throughout the population

Growth-Poverty & Inequality linkages
Poverty reduction and redistribution are not spontaneous by-products of growth Corrections of macroeconomic imbalances or improvements in macroeconomic policies and governance might not be sufficient to address poverty

While rapid growth is necessary for substantial poverty reduction, there is considerable variation
in the poverty impact of growth…
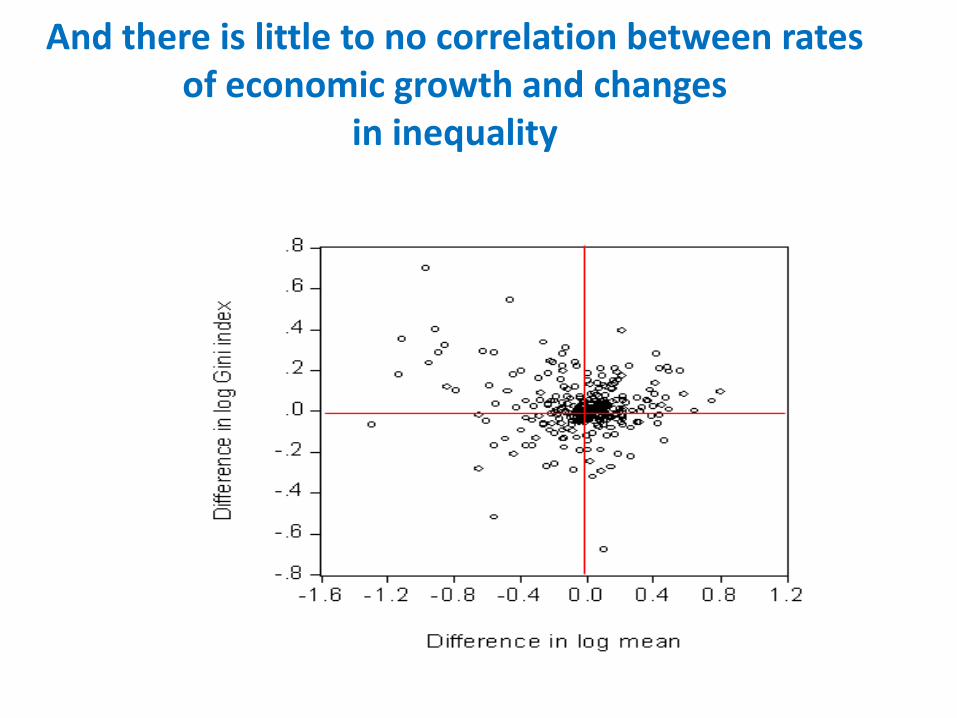
And there is little to no correlation between rates of economic growth and changes
in inequality

Root causes of poverty and in inequality are country specific
• Increasing awareness that inequality – not just poverty – can fuel social tensions, impeding growth
• But the ways in which inequality impacts growth are country-
specific
• The dynamics of inequality are by no means inevitable, depending upon
• Endowment effects • Price effects • Occupational choice effects
Percentage of Population
Φ(y)
Percentage
of Income
Line of Perfect
Equality (LPE)
Lorenz Curve
L(y) - LC
F (y)
B
A

For example, lessons from Brazil show that: (i) more pro-poor social policies can sustain poverty reduction, even in low-growth environment (ii) sensible macroeconomic and trade policies need not hurt the poor
Policy prescriptions are country-specific as well

In East Asia, continued gains in poverty reduction are at stake
as more than 450m people still live on<$2/day
27
52
43 37
32
26
22
54
48 47
40 36
33
20
25
30
35
40
45
50
55
60
20
02
20
04
20
06
20
08
20
10
20
12
East Asia
East Asia ex China
China, 267.4m
108.4m
36.1m
29.5
Thailand 1.8m
Malaysia, 0.6m
IBRD Blend, 11.6m
Pacific, 3.6m
Indonesia
Philippines
Vietnam
Thailand
Malaysia
Middle-income Countries
% of population living <$2/day
459 million people living <$2/day in 2012
Source: World Bank.

… addressing regional development challenges, here too, is country specific
28
Upper MICS •Value chain •Skills and innovation •Social safety nets •Public Sector Performance
China •Improving social safety nets •Rebalancing growth •Green Growth/natural resource management •Adjusting to expanded world role
Lower MICs and LICs •Progress on MDGs and skills •Business climate •Sustainable natural resources management • Fiscal Management and Service Delivery
Pacific Island & Small States •Small state and isolation challenges •Economic reform and business climate •Managing natural resources sustainably
1) Upper MICs include Indonesia, Philippines, Thailand and Malaysia 2) Lower MICs are Mongolia and Vietnam; 3) LICs include Cambodia and Laos

% of countries by region on target to achieve MDGs
0%
20%
40%
60%
80%
100%
East Asia & Pacific
Number of countries: 24
Europe & Central Asia
Number of countries: 22
Latin America & Caribbean
Number of countries: 30
Middle East & North Africa
Number of countries: 13
South Asia
Number of countries: 8
Sub-Saharan Africa
Number of countries: 47
Poverty Undernourishment Completion
Gender (primary and secondary) Child mortality Maternal mortality
Water Sanitation
Sub-Saharan Africa is distinctively behind targets on its MDGs
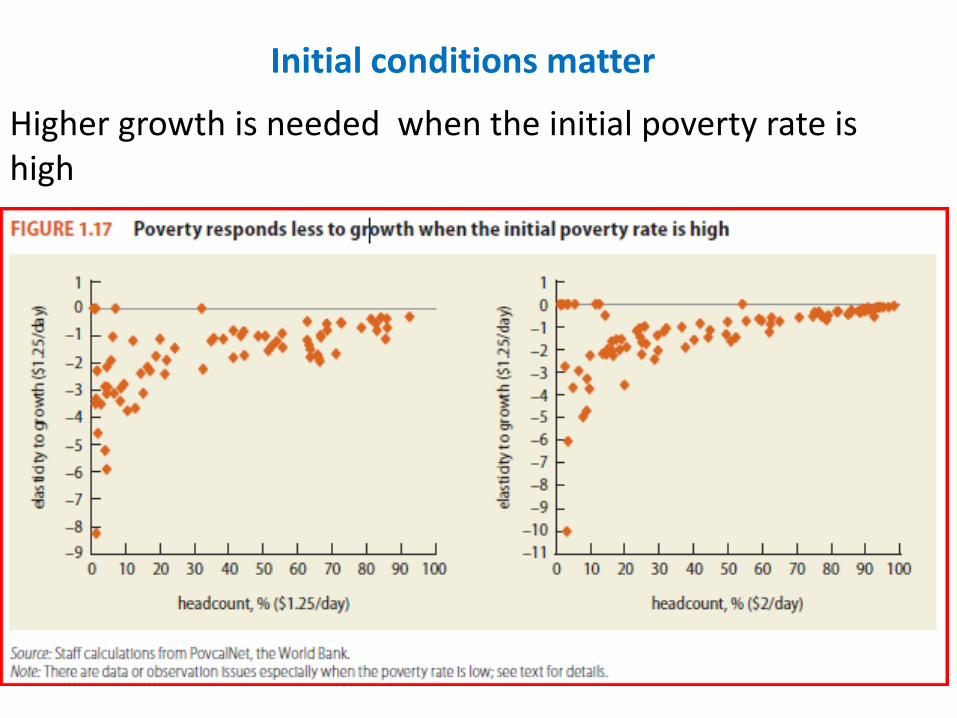
Initial conditions matter
Higher growth is needed when the initial poverty rate is high

Reducing poverty is more difficult in Sub-Saharan Africa
Depth of poverty or its incidence is also higher in poorer countries

Conclusion: Achieving the MDGs
Rapid pace of growth is necessary for substantial poverty reduction, but for this growth to be sustainable in the long run, it should be broad-based across sectors, and inclusive of the large part of the country’s labor force
Low income and other developing countries need to rebuild buffers so as to guard against future shocks.
Structural reforms adapted to the country context and initial conditions can more directly address development challenges – this country-based model should be given more prominence in the post-2015 development agenda

THANK YOU

References
• Global Economic Prospects, January 2012
• Global Monitoring Report 2010, The MDGs after the crisis
• Global Monitoring Report 2011, Improving the Odds of Achieving the MDGs
• Jennifer Keller: Inclusive Growth Diagnostic Analysis, New approaches to determining country priorities, presentation in Nairobi, Kenya, September 28, 2011
• Zia Qureshi: The Role of Rising Powers in Managing Economic Crises, presentation at the University of Cambridge, February 24, 2012