Inclusion Of Crack Face Pressure - 2H Offshore
20
Transcript of Inclusion Of Crack Face Pressure - 2H Offshore


Inclusion Of Crack Face Pressure In Reference Stress For Thick Walled Risers And Flowlines
OMAE2013-11021
12 June 2012
Mark Cerkovnik -2H Offshore
Learn more at www.2hoffshore.com

3 of ##
Outline
Background and Motivation
Where this fits in the general FFS problem
Reference Stress Method for Fracture of Ductile Steel
Method for Accounting for Crack Face Pressure:
Results for a Practical Application
Learn more at www.2hoffshore.com

4 of ##
The evaluation of defects in fatigue loaded structure
Risers and other parts of subsea architecture face the double threats of fatigue and corrosion
Corrosion pits in fatigue loaded risers are areas of stress concentration and hydrogen charging can increase crack growth rates and lower toughness.
Irregular morphology of the pits makes calculation of the SCFs problematic.
Production Risers are subject to wellhead pressure which can be quite high .
Learn more at www.2hoffshore.com

5 of ##
Fitness for Service Methods for Evaluating Remaining Fatigue Life
SN Method
SN curves in corrosive environments are difficult to establish because of frequency effects
SCFs depend upon a good measurement of the radius of curvature which is nearly impossible to obtain.
Load histograms
Fatigue Crack Growth Method (FCG)
Requires an initial flaw size
Requires knowledge of crack growth rates in the corrosion regime
Required knowledge of toughness
Load histograms
Extreme load to evaluate the possibility of unstable fracture or plastic collapse.
BS7910 or API 579
Learn more at www.2hoffshore.com
7 of ##
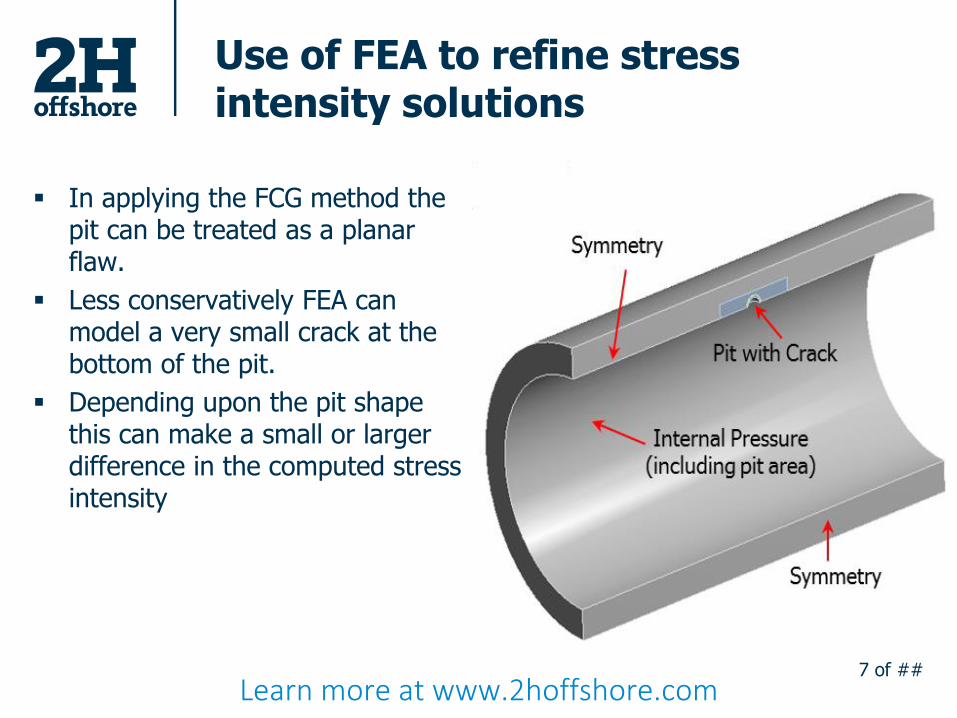
Use of FEA to refine stress intensity solutions
In applying the FCG method the pit can be treated as a planar flaw.
Less conservatively FEA can model a very small crack at the bottom of the pit.
Depending upon the pit shape this can make a small or larger difference in the computed stress intensity
Learn more at www.2hoffshore.com

9 of ##
Learn more at www.2hoffshore.com

10 of ##
Failure Assessment Diagram
Fracture and plastic collapse is judged using the FAD approach
𝐾𝑟 =𝐾
𝐾𝑚𝑎𝑡
𝐿𝑟 =𝜎𝑟𝑒𝑓
𝜎𝑦
yL
y
refaP
P
,
L
yref
PP
PP
21
21
,
,
Learn more at www.2hoffshore.com

Non Linear Response of CTODf at high plasticity
The shape of the FAD reflects the non linear increase in crack tip opening as the plastic region ahead of the crack expands.
The behavior is very dependent upon the stress strain curve and particularly the hardening exponent.
Typically seamless pipe, is different than DSAW pipe and the weld metal and heat affected zones also have their own characteristics.
* [1] Kim, et al, Elasto Plastic Estimates Of J and CTOD for axial through wall cracked pipe… Learn more at www.2hoffshore.com

12 of ##
Reference Stress Approaches
Learn more at www.2hoffshore.com

13 of ##
Thick Pipe and Crack Face Pressure
High Pressure 70 MPa to 100 MPa
Corrosion allowance 4 mm to 8mm
Result is thick pipe with D/t of 6 to 8.
No BS 7910 solutions for CFP for K or reference stress
API 579 has CFP K solution but ignores CFP reference stress.
Solution is needed to fill the
gap.
Learn more at www.2hoffshore.com

14 of ##
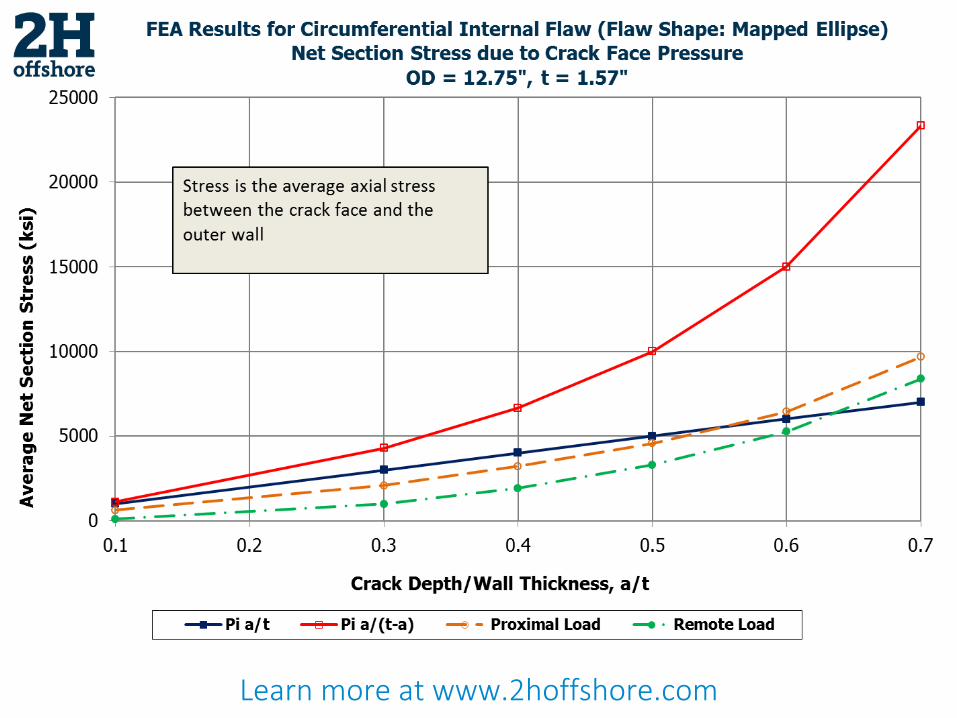
Stress caused by crack face pressure for internal surface flaws
Pressure is applied to crack face in FEA model. Reference stress component is taken as the stress normal to the crack, half way between the crack tip and the outer surface.
FEA is compared against closed form solutions
𝜎𝑟𝑒𝑓 =𝑃𝑎
𝑡
𝜎𝑟𝑒𝑓 =𝑃𝑎
𝑡−𝑎
a is the crack depth
Far field stress (as calculated by classical equations)
Learn more at www.2hoffshore.com
15 of ##
Learn more at www.2hoffshore.com

Learn more at www.2hoffshore.com

y = 4.389x3 - 3.0481x2 + 1.4422x - 0.0579 (Equation 8)R² = 0.9991
y = 5.7461x3 - 3.8116x2 + 1.7206x - 0.0823 (Equation 7)R² = 0.9997
0.00
0.20
0.40
0.60
0.80
1.00
0.0 0.1 0.2 0.3 0.4 0.5 0.6 0.7 0.8
No
rma
lize
d A
ve
rag
e N
et
Se
cti
on
Str
ess
Crack Depth/Wall Thickness, a/t
FEA Results for Internal Flaws (Circumferential and Axial Orientation)Average Net Section Stress due to Crack Face Pressure
FEA, Circ. Flaw FEA, Axial Flaw
Learn more at www.2hoffshore.com

0
5
10
15
20
25
30
35
10 210 410 610 810 1010 1210 1410 1610
Fla
w D
ep
th (
mm
)
Pit Length (mm)
UNSTABLE FRACTURE LIMIT (WITH AND WITHOUT CRACK FACE PRESSURE)Pipe OD = 323.85 mm, Wall Thickness = 40 mm,
Pm = 325 MPa, Pb = -55 MPa, Based On API-579-FFS
No Crack Face Pressure With Crack Face PressureLearn more at www.2hoffshore.com

Learn more at www.2hoffshore.com

20 of ##
Conclusions
The crack face pressure has a significant effect in the evaluation of flaws for FFS and for ECA in thick walled risers and flowlines in high pressure service.
API gives good guidance for accounting for CFP in calculation of K for thick pipes; BS7910 does not.
Neither code addresses the effect of crack face pressure directly in the determination of reference stress.
A formulation for reference stress due to CFP must account for the proximity of the load to the ligament.
As a practical matter, the local ligament stress formulations should provide sufficient conservatism to cover the effects of crack face pressure.
A rational way to estimate the effect of crack face pressure on the reference stress is developed in this paper.
Learn more at www.2hoffshore.com

Questions?
Learn more at www.2hoffshore.com