Lessons from empirical studies on incentive regulation
31
Institute for Transport Studies FACULTY OF ENVIRONMENT Lessons from empirical studies on incentive regulation Second economic conference of the French railway regulatory body Dr Andrew Smith Institute for Transport Studies, University of Leeds May 26 th 2014 - Paris
-
Upload
institute-for-transport-studies-its -
Category
Education
-
view
208 -
download
1
Transcript of Lessons from empirical studies on incentive regulation
Institute for Transport StudiesFACULTY OF ENVIRONMENT
Lessons from empirical studies on incentive regulation
Second economic conference of the French railway regulatory body
Dr Andrew Smith
Institute for Transport Studies, University of Leeds
May 26th 2014 - Paris

Agenda
• Top-down international benchmarking using econometric methods:– National data (UIC LICB data)
– Regional international data (collected by / through ORR)
• Lessons / issues / future challenges
• Conclusions
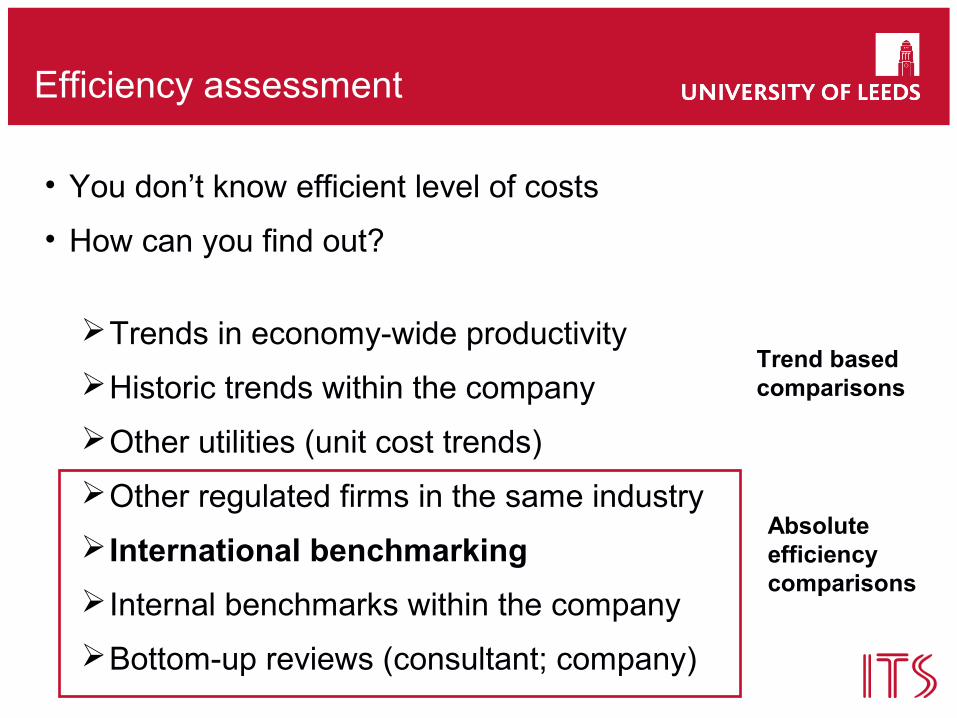
Efficiency assessment
• You don’t know efficient level of costs
• How can you find out?
Trends in economy-wide productivity
Historic trends within the company
Other utilities (unit cost trends)
Other regulated firms in the same industry
International benchmarking
Internal benchmarks within the company
Bottom-up reviews (consultant; company)
Trend based comparisons
Absolute efficiency comparisons
The background
• Re-wind to 2005 – what was the situation facing ORR?
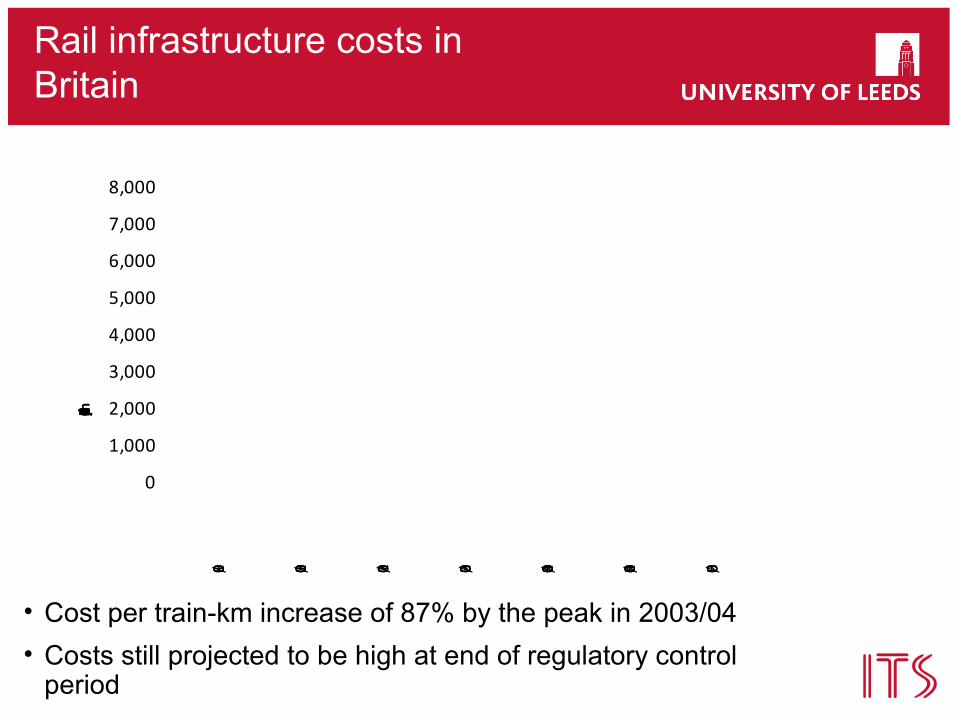
Rail infrastructure costs in Britain
• Cost per train-km increase of 87% by the peak in 2003/04
• Costs still projected to be high at end of regulatory controlperiod
0
1,000
2,000
3,000
4,000
5,000
6,000
7,000
8,000
1999/00 2000/01 2001/02 2002/03 2003/04 2004/05 2005/06
£m, 2007/08 prices
The background
• Re-wind to 2005 – what was the situation facing ORR?
• Benchmarking done – bottom-up studies; internal benchmarking
• No top-down benchmarking based on external data
• Of course, lack of external domestic comparators
• International benchmarking became top of the agenda
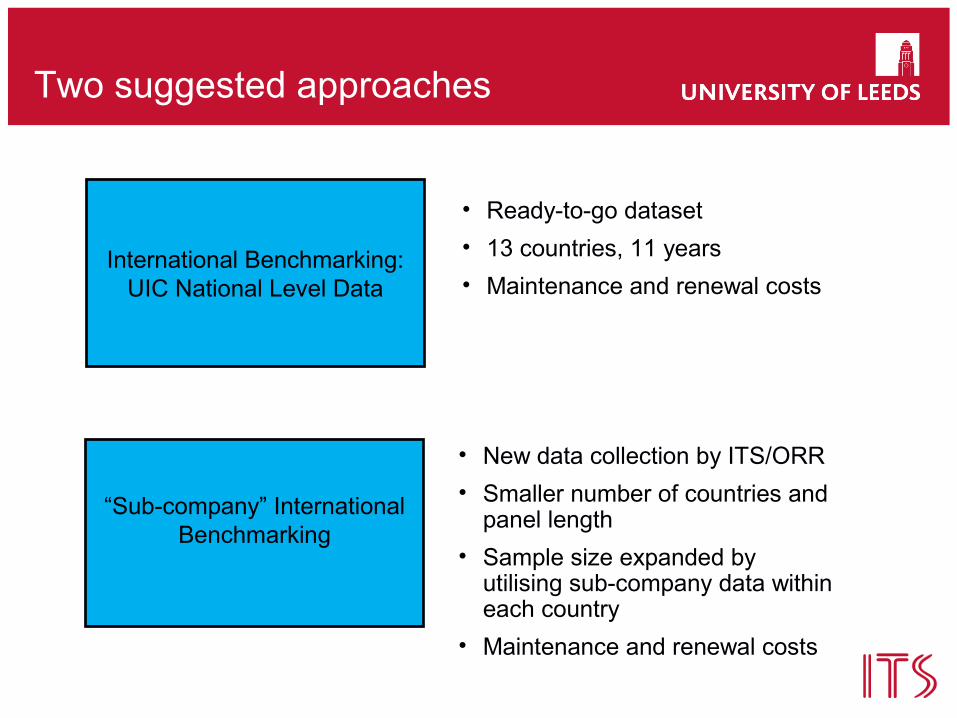
Two suggested approaches
International Benchmarking:UIC National Level Data
“Sub-company” International Benchmarking
• Ready-to-go dataset
• 13 countries, 11 years
• Maintenance and renewal costs
• New data collection by ITS/ORR
• Smaller number of countries and panel length
• Sample size expanded by utilising sub-company data within each country
• Maintenance and renewal costs
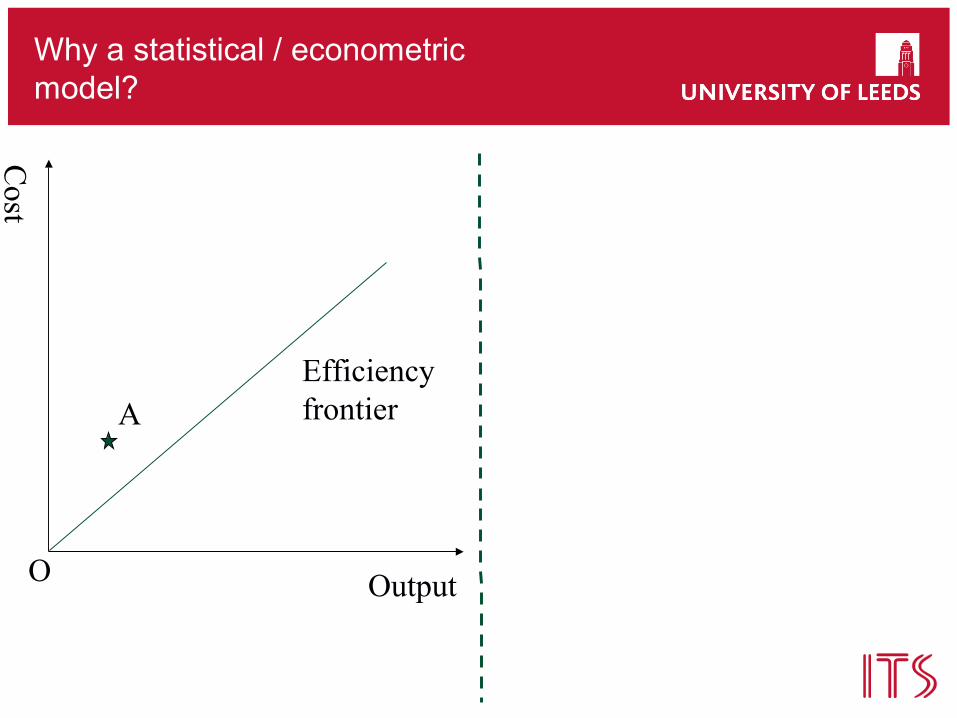
Why a statistical / econometric model?
Output
Cost
A
O
Efficiency frontier
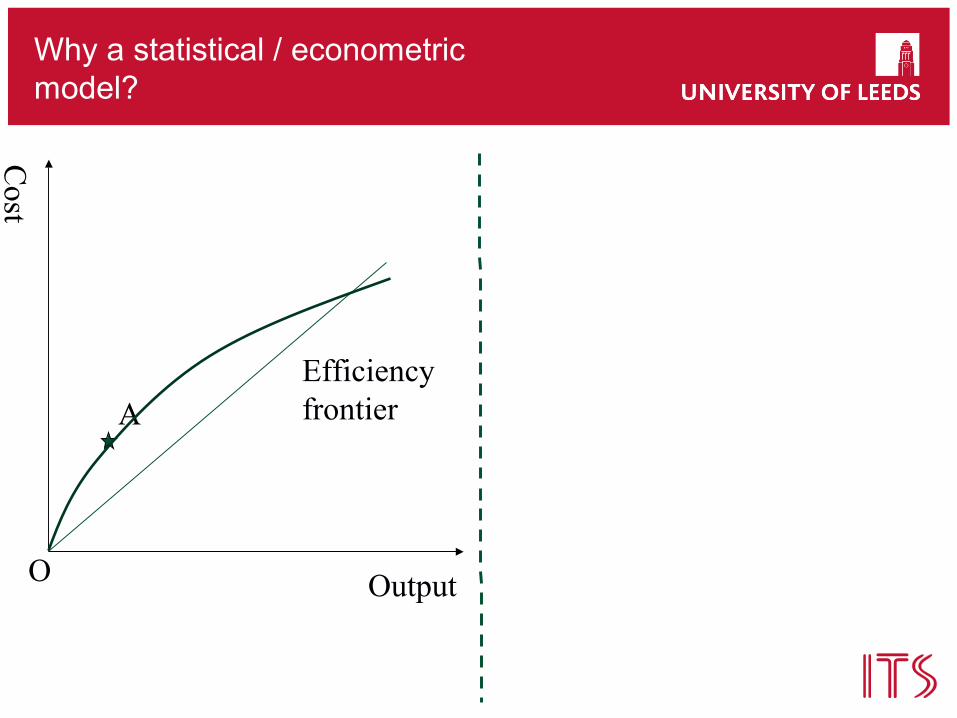
Why a statistical / econometric model?
Output
Cost
A
O
Efficiency frontier

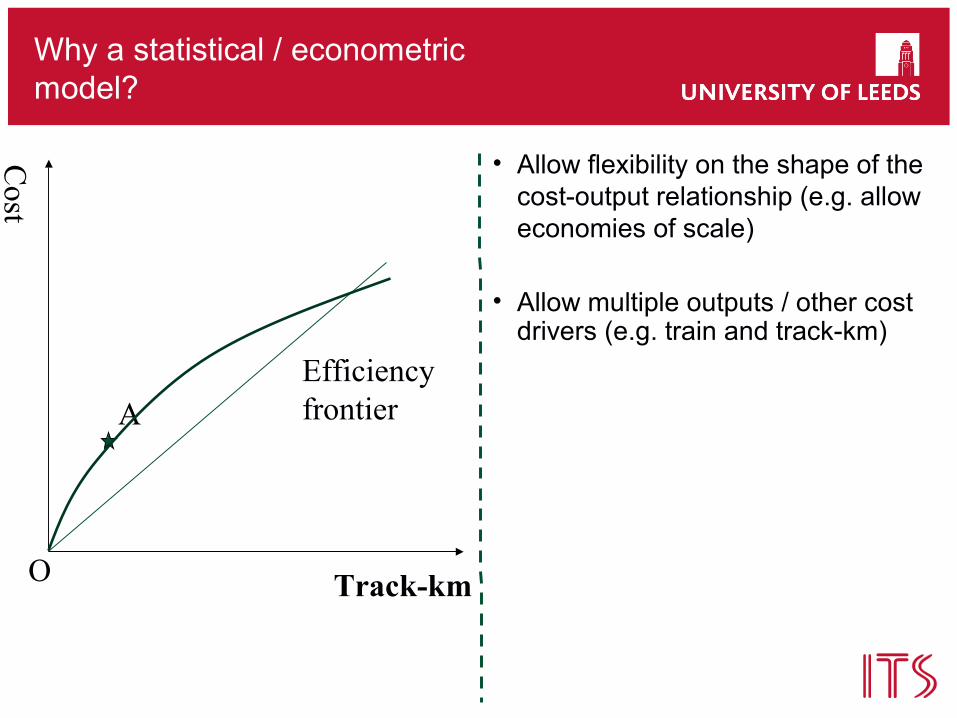
Why a statistical / econometric model?
Train-km
Cost
A
O
Efficiency frontier
• Allow flexibility on the shape of the cost-output relationship (e.g. allow economies of scale)
• Allow multiple outputs / other cost drivers (e.g. train and track-km)
Why a statistical / econometric model?
Cost
A
O
Efficiency frontier
• Allow flexibility on the shape of the cost-output relationship (e.g. allow economies of scale)
• Allow multiple outputs / other cost drivers (e.g. train and track-km)
Track-km
Why a statistical / econometric model?
Output
Cost
A
O
Efficiency frontier
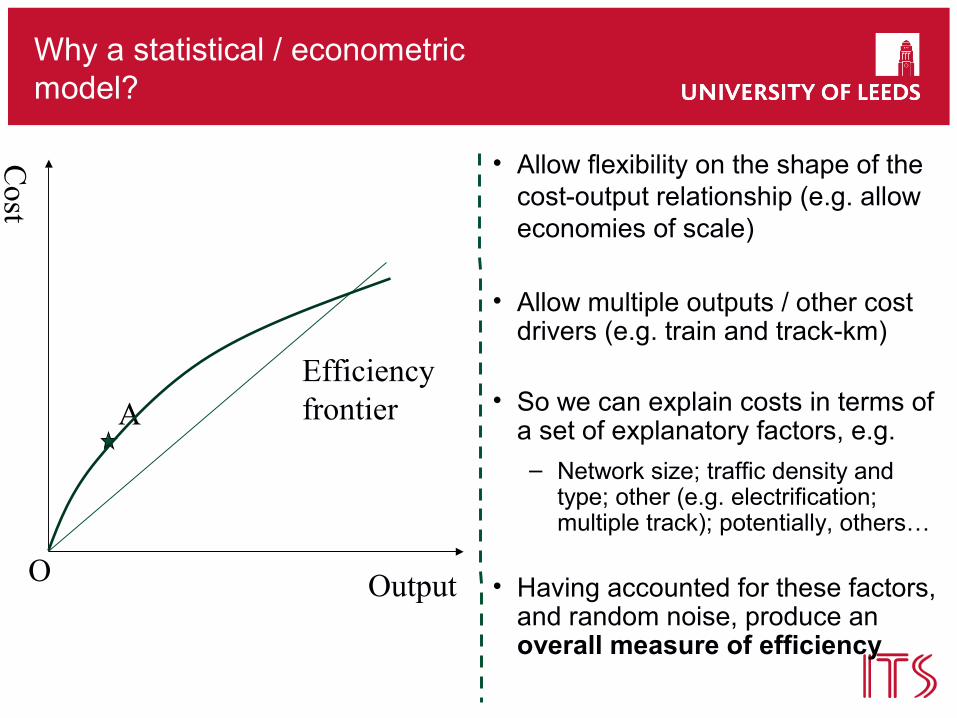
• Allow flexibility on the shape of the cost-output relationship (e.g. allow economies of scale)
• Allow multiple outputs / other cost drivers (e.g. train and track-km)
• So we can explain costs in terms of a set of explanatory factors, e.g.
– Network size; traffic density and type; other (e.g. electrification; multiple track); potentially, others…
• Having accounted for these factors, and random noise, produce an overall measure of efficiency
International benchmarking study: national data – frontier parameters
• Source: Smith (2012)
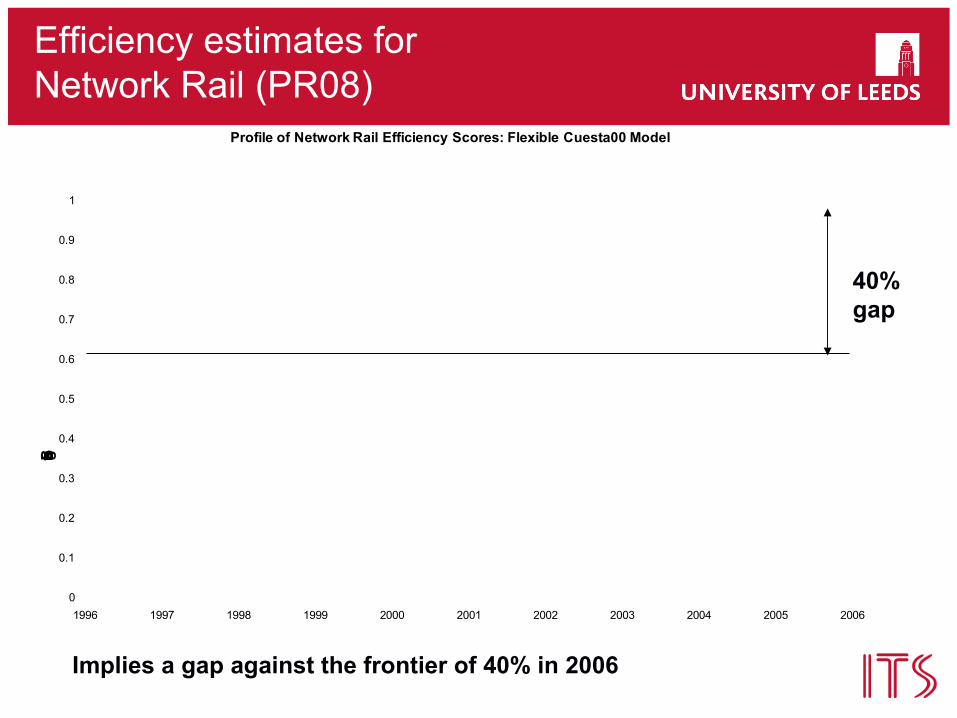
Efficiency estimates for Network Rail (PR08)
Implies a gap against the frontier of 40% in 2006
40%gap
0
0.1
0.2
0.3
0.4
0.5
0.6
0.7
0.8
0.9
1
1996 1997 1998 1999 2000 2001 2002 2003 2004 2005 2006
Score against frontier
Profile of Network Rail Efficiency Scores: Flexible Cuesta00 Model

Dual Level Inefficiency Model
• Source: Smith and Wheat (2012)
International regional benchmarking study: illustrative outputs
Dataset of infrastructure managers, supplemented by regional / business unit data for each IM
International regional benchmarking study: illustrative outputs
Dataset of infrastructure managers, supplemented by regional / business unit data for each IM
Investigate efficiency differences between countries as well as within countries in the same model
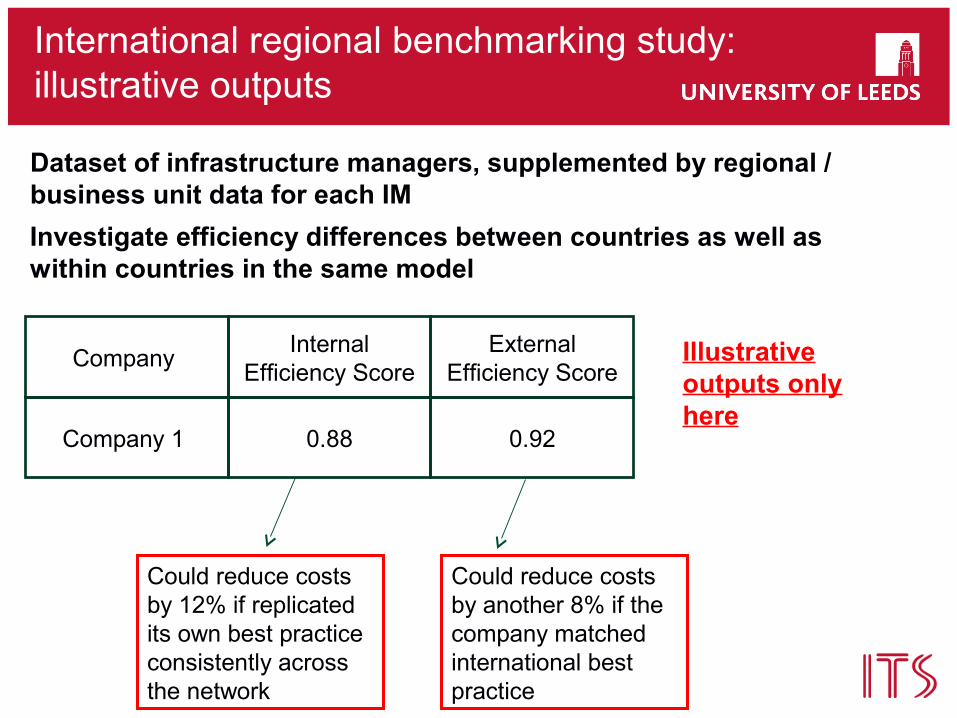
International regional benchmarking study: illustrative outputs
Company
Company 1
Could reduce costs by 12% if replicated its own best practice consistently across the network
Could reduce costs by another 8% if the company matched international best practice
Dataset of infrastructure managers, supplemented by regional / business unit data for each IM
Investigate efficiency differences between countries as well as within countries in the same model
Internal Efficiency Score
0.88
External Efficiency Score
0.92
Illustrative outputs only here
Challenges
• Data quality / number of data points?
• How to deal with lumpy / cyclical capital costs?
• Modelling fundamental differences in characteristics and quality of railways
• Understanding uncertainty in efficiency modelling?
Data issues
• Regulators face small number of firms (N) usually
• Can be expanded by having several years (T): N*T data points
• Or if have regional data as well: N*T*S
• Quality and consistency of data is key (over time; between firms) – some issues found with LICB data though still used by ORR
• Time consuming to collect your own data set – requires commitment over many years from the industry
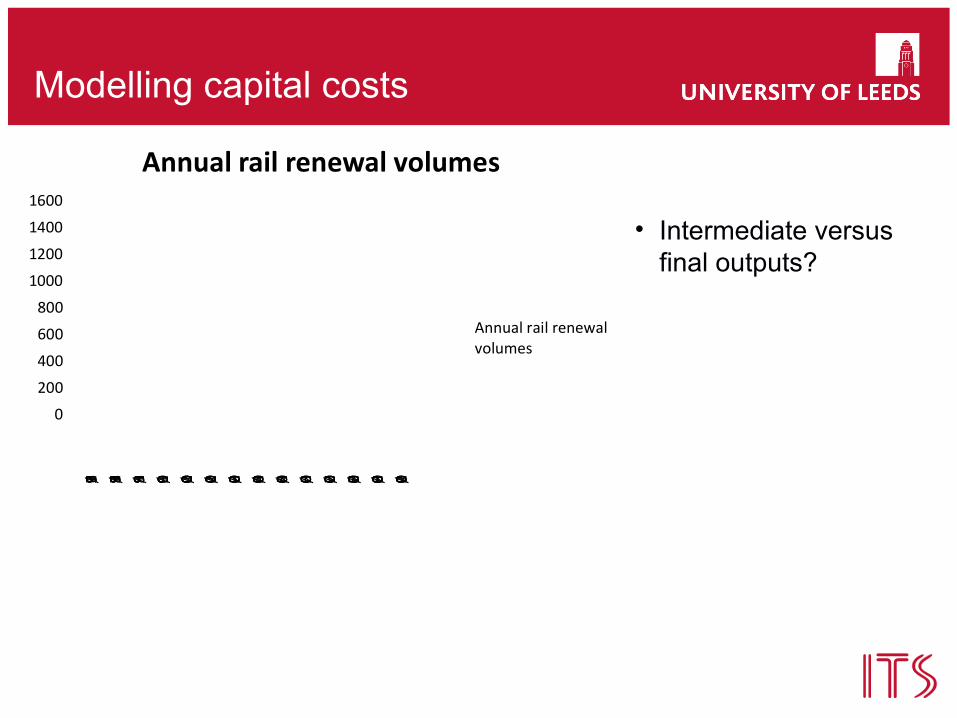
Modelling capital costs
0
200
400
600
800
1000
1200
1400
1600
1996/97 1997/98 1998/99 1999/00 2000/01 2001/02 2002/03 2003/04 2004/05 2005/06 2006/07 2007/08 2008/09 2009/10
Annual rail renewal volumes
Annual rail renewalvolumes
• Intermediate versus final outputs?
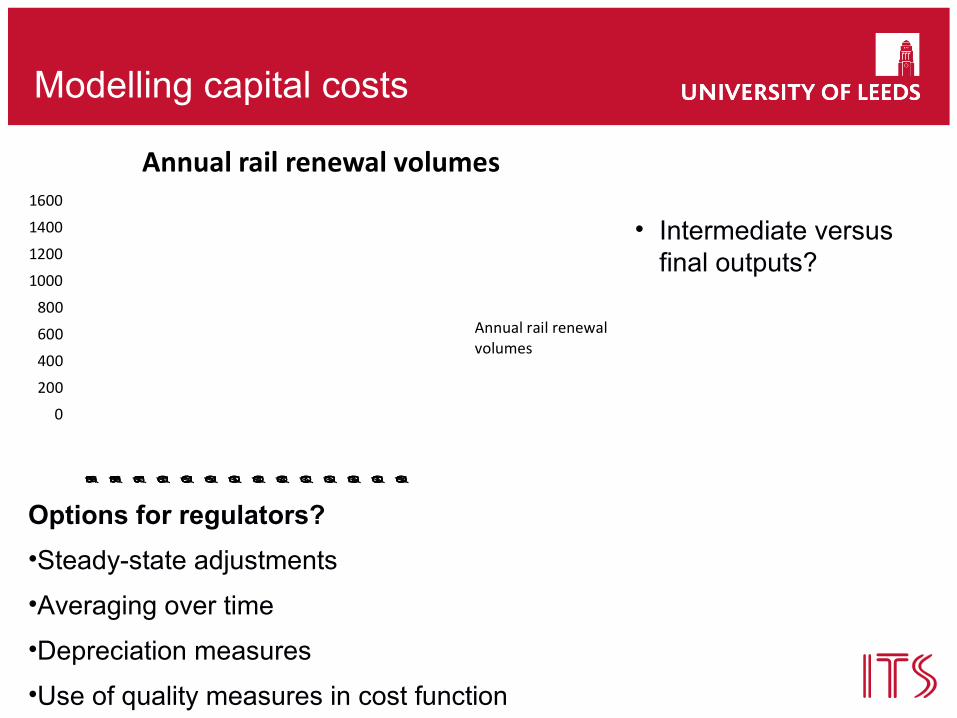
Modelling capital costs
Options for regulators?
•Steady-state adjustments
•Averaging over time
•Depreciation measures
•Use of quality measures in cost function
0
200
400
600
800
1000
1200
1400
1600
1996/97 1997/98 1998/99 1999/00 2000/01 2001/02 2002/03 2003/04 2004/05 2005/06 2006/07 2007/08 2008/09 2009/10
Annual rail renewal volumes
Annual rail renewalvolumes
• Intermediate versus final outputs?

Modelling differences in characteristics and quality
• Simplified representation:
C = f( N + Y/N + D + Q)
Network Size
TrafficDensity
e.g.•Proportion electrified•Single / multiple track•Capability (speed; axle load)•Topography•Weather…Others
e.g.•Delay minutes•Asset Failures•Track geometry•Asset age•Broken rails•……Others
Can be modelled: ideally with data but for some aspects even without! Some challenges though…
Understanding uncertainty
• Sources of uncertainty in efficiency models?
• Point estimates of inefficiency are used – intervals rarely computed (this is true of the academic literature as well)
• Two sources of uncertainty in stochastic frontier models:
– Splitting the residual into random noise and inefficiency
– Uncertainty about the parameters estimated (e.g. the coefficient on track-km)
• Wheat, Greene and Smith (2013):
– Developed method to capture both aspects
– Intervals wider when take account of parameter uncertainty
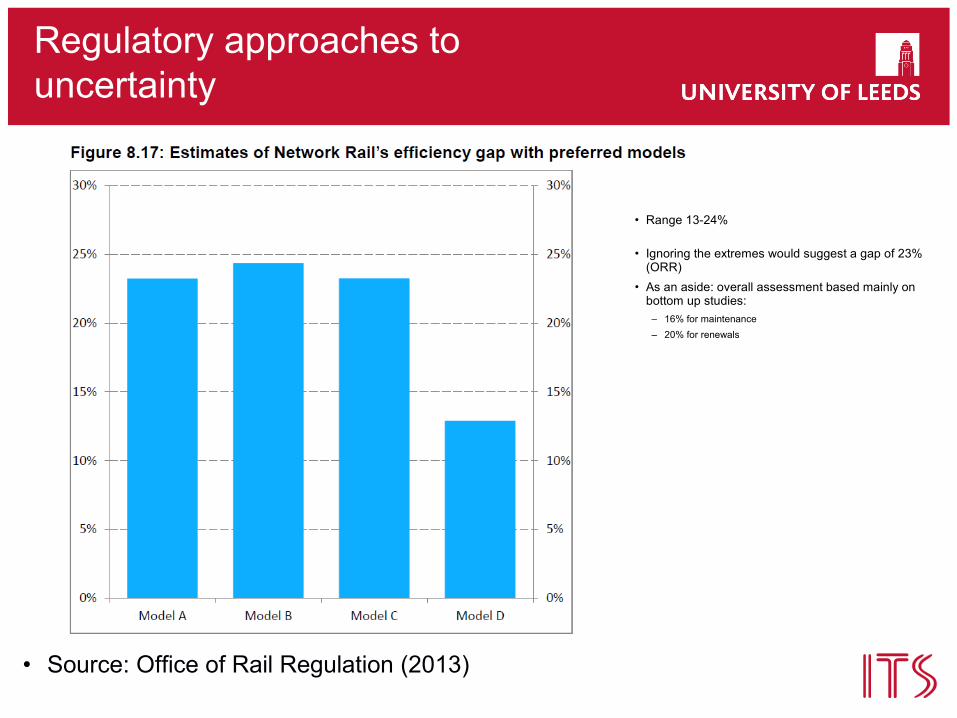
Regulatory approaches to uncertainty
• Source: Office of Rail Regulation (2013)
• Range 13-24%
• Ignoring the extremes would suggest a gap of 23% (ORR)
• As an aside: overall assessment based mainly on bottom up studies:
– 16% for maintenance
– 20% for renewals
Concluding remarks
• International benchmarking is key for rail infrastructure
• Main challenge for top-down benchmarking is data:
– Number of data points (companies; time; regions)
– Comparability of data over time and between countries
– Needs to incorporate quality and other factors in the model
• Collecting good quality data takes time and commitment – ideally economic regulators / Ministries need to co-ordinate
• Other wider challenges:
– Dealing with capital and uncertainty in analyses
– Value and cost of resilience (e.g. to climate change)
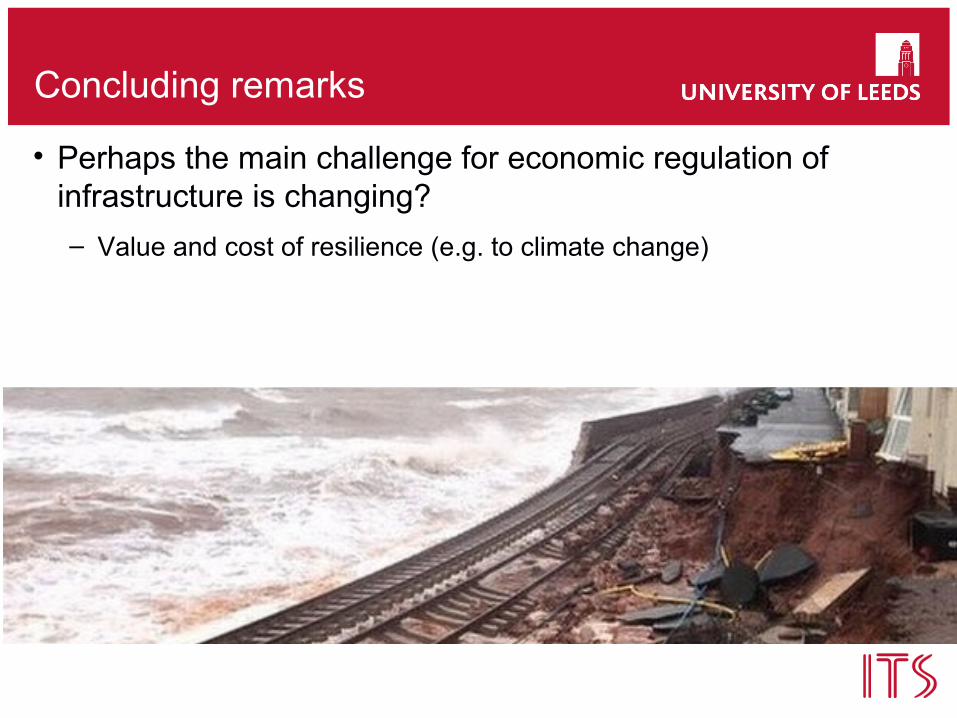
Concluding remarks
• Perhaps the main challenge for economic regulation of infrastructure is changing?
– Value and cost of resilience (e.g. to climate change)
Thank you for your attention
Dr Andrew Smith

Contact details
Dr Andrew Smith
Institute for Transport Studies (ITS) and Leeds University Business School
Tel (direct): + 44 (0) 113 34 36654
Email: [email protected]
Web site: www.its.leeds.ac.uk

References
• Smith, A.S.J. and Wheat, P.E. (2012), ‘Estimation of Cost Inefficiency in Panel Data Models with Firm Specific and Sub-Company Specific Effects, Journal of Productivity Analysis, vol. 37, pp. 27-40.
• Smith, A.S.J (2012), ‘The application of stochastic frontier panel models in economic regulation: Experience from the European rail sector’, Transportation Research Part E, 48, pp. 503–515.
• Wheat, P.E., Greene, W, and Smith, A.S.J. (2013), Understanding prediction intervals for firm specific inefficiency scores from parametric Stochastic Frontier Models. Journal of Productivity Analysis (published online 10th May 2013).