
In the Mohawk Valley Paul Hagstrom - Hamilton College · The Fiscal Impact of Refugee Resettlement...
46
The Fiscal Impact of Refugee Resettlement In the Mohawk Valley Paul Hagstrom Hamilton College June 2000 This work was supported by Hamilton College and the Arthur Levitt Center for Public Affairs. I would like to thank Ani Drescher for providing research assistance. The findings, judgments, and opinions expressed in the study are the author’s and do not represent the opinions of Hamilton College or the Arthur Levitt Center.
-
Upload
phungkhanh -
Category
Documents
-
view
215 -
download
0
Transcript of In the Mohawk Valley Paul Hagstrom - Hamilton College · The Fiscal Impact of Refugee Resettlement...

The Fiscal Impact of Refugee ResettlementIn the Mohawk Valley
Paul HagstromHamilton College
June 2000
This work was supported by Hamilton College and the Arthur Levitt Center for Public Affairs.I would like to thank Ani Drescher for providing research assistance. The findings, judgments,and opinions expressed in the study are the author’s and do not represent the opinions ofHamilton College or the Arthur Levitt Center.
2
Executive Summary
Since 1975, Oneida county and the city of Utica, New York have welcomed thousands ofrefugees from around the world. Through 1999, the Mohawk Valley Resource Center forRefugees, had resettled 8,759 refugees in the Utica area, arranging housing, education,employment, and social services for incoming refugees. The refugees have come from 22countries with about 40% coming from Bosnia, 21% from the former Soviet Union, and 14%from Vietnam.
While the humanitarian benefits are clear, there is less consensus as to whether the refugees area net benefit or cost to the local economy. Refugees add to the workforce and broaden thelocal tax base, providing employers with quality low-wage workers. At the same time,refugees use social and educational services, potentially adding to the burden shared by localtaxpayers. Yet neither the benefits or costs have been seriously addressed in a comprehensivestudy of the impact of the refugees on the local economy.
The present study accounts for the fiscal benefits and fiscal costs of refugee resettlement in theMohawk Valley. A fiscal analysis differs from a benefit-cost analysis and the more commoneconomic impact studies in that a fiscal analysis tracks the flow of public resources used andcreated from a particular policy. The study is addresses the question of whether refugeeresettlement costs area residents more in public costs than is raised through additional taxrevenue.
The main findings in the study are listed below.
• Refugees are a net cost in the early years and then yield benefits for many years tocome. In the long run, evidence suggests that efforts to resettle refugees in Utica, quiteapart from any non-fiscal benefits or costs, is a net fiscal benefit to the community.
• Assuming a typical flow of about 750 refugees per year, simulations show net annualbenefits become positive after 15 years while the cumulative benefit becomes positivein year 23. After 23 years of operation, the total fiscal effect of continual waves of 233refugee households per year will be and will remain positive.
• The costs of refugee resettlement are front-loaded. After 13 years, the cumulative netbenefit of a single household becomes positive and remains positive every year after. Thisdoes not imply that the costs of such factors as Medicaid and TANF are reduced to zero.These costs remain, although they do diminish somewhat over time. Rather, other positivebenefits due to increased participation in labor and real estate markets now outweigh thenegatives.
• The first year net cost of a single refugee household is about $4,413, with

3
education costs making up 40%, TANF 34 %, and Medicaid 26% of the totaltaxpayers costs for refugee households. Over time, the TANF costs drop quickly,children move out of the school systems. Although Medicaid participation does diminishsomewhat, it remains high. For refugees households who have been in the area for at least4 years, 6 percent are reported to be on TANF while 36 percent receive Medicaid. About18 percent receive Food Stamps, benefits which are fully paid by the federal government.
• The primary fiscal benefits accruing from refugees stems from their participation inlabor markets (and therefore consumption of local goods) and real estate markets.Direct benefits are derived from sales and property taxes, while indirect benefits accruethrough positive effects on local real estate markets.
• The costs and benefits depend on the composition of the households and on theirwillingness to stay in the Utica area. The average refugee household in our study haslived in the area for about 5 years, has 3.22 people, including 1.27 kids and 1.95 adults.The average age of the adults in the household is less than 30 years of age, while theaverage age of the children in the household is 9.2 years of age. Only 3.7 percent of allrefugees who arrive are greater than 65 years of age.
• Most, but not all, refugees’ first jobs are in traditionally low-wage jobs requiring littleformal training and relatively low levels of English proficiency. The average startingwage rate is $7.18 per hour and less than 2 percent of refugees start out in jobs paying$10/hour or more. Small manufacturing assembly work is easily the most common workfor refugees, accounting for about 27 percent of all refugee jobs. Another 15 percent wentinto sewing jobs. The remaining 58 percent of jobs were more evenly distributed withproduction workers and machine operators being the next most common jobs.
• There is little evidence that refugees have hurt the employment opportunities ofnative workers. Native workers now face the lowest unemployment rates in the last 20years. To the degree that crowding out is real, that refugees have displaced native workers,it would have to be in the small assembly and sewing jobs and to an even lesser degree inthe production and machine operator jobs, jobs which pay generally low wages. A similarargument applies to the question of the impact of refugees on wages. Such impacts, if any,are likely small, likely localized to a small sector of Oneida County, and likely localized toa small sub-sector labor market.

4
Outline
1. The Need
2. Purpose and Approach2.1 A Fiscal Analysis2.2 Scope of Study2.3 The time frame for analysis2.4 Unit of Analysis
3. Background Research and Previous Findings3.1 Labor Market and Migration Effects3.2 Fiscal Impacts
4. An Overview of the Utica/Rome Economy4.1 Population Changes and Components of Change
Table 1: Demographics by Geographic Definition4.2 Changes in Industry and Occupational Structure
Table 2: Employees by Industry, Oneida CountyTable 3: Number of Employees by Occupation
4.3 Change in Wages and Unemployment, and Public Assistance CaseloadsTable 4: Labor Force and Employment 1977-1998, Oneida CountyTable 5: Oneida County Public Assistance Spending and Average Monthly
Caseloads, 1987 - 1998 (1997 dollars)
5. The Impact of Refugees on Local Labor MarketsTable 6: Most common Job Titles (N= 2986)Table 7: Top Ten Paying Job TitlesTable 8: Job Openings, Seekers, and Refugee Workers
6. An Accounting of the Fiscal Benefits and Costs6.1 Composite Household
Table 9: The Composite Refugee Household6.2 Refugee Center
Table 10: Overview of the 1999 MVRCR Budget6.3 Education6.4 Public assistance
Table 11: Participation in Public Assistance ProgramsTable 12: Probit Model of Program participation
6.5 Fiscal Benefits:
7. Simulation ResultsTable 13: Simulated Annual and Cumulative Discounted Net Benefits
8. Sensitivity Analysis9. Concluding Remarks

5
1: The Need
Since 1975, Utica, through the efforts of the Mohawk Valley Resource Center for Refugees,have been welcoming and resettling refugees from around the world. The Refugee Center wasestablished and is sponsored by the Lutheran Immigration Refugee Service. Through 1999, theRefugee Center has resettled 8,759 refugees in the Utica area, arranging housing, education,employment, and social services for incoming refugees. The refugees have come from 22countries with about 40% coming from Bosnia, 21% from the former Soviet Union, and 14%from Vietnam.
While the humanitarian benefits are clear, there is less consensus as to whether the refugees area net benefit or cost to the local economy. The refugees add to the workforce and broaden thelocal tax base, one that has been declining for many years, providing employers with qualitylow-wage workers. At the same time, refugees use social services, potentially adding to theburden shared by local taxpayers. Yet neither the benefits or costs have been seriouslyaddressed in a comprehensive study of the impact of the refugees on the local economy.
In 1999, associates of the Arthur Levitt Public Policy Center at Hamilton College becameinterested in local refugee resettlement and made this a topic for broader study. This report isone product of a larger study funded by the Levitt Center. The findings, judgements, andopinions expressed in the study are the author’s and do not represent the opinions of HamiltonCollege or the Arthur Levitt Public Policy Center.
2. Purpose and Approach
2.1 A Fiscal Analysis
The present study is intended to be a first attempt to account for the fiscal benefits and fiscalcosts of refugee resettlement in the Mohawk Valley. A fiscal analysis differs from a benefit-cost analysis and the more common economic impact studies in that a fiscal analysis tracks theflow of public resources used and created from a particular experiment or policy. For thisstudy, we define the policy as the future resettlement of refugees in the Utica area. In contrast,a benefit-cost study attempts to determine the impact of a policy on the overall well being of acommunity. Economic impact studies tend to estimate the overall changes in spending in aneconomy, but typically ignore the effect of an event on government spending and revenues. Afiscal analysis may be considered a first step in more comprehensive benefit-cost analysiswhich must also weigh and account for the change in the well-being of the population due tothe policy. Consider the opening of a new restaurant. A fiscal analysis should account foradditional public costs of the restaurant such as increased sanitation costs and increased taxrevenues. On the other hand, a benefit-cost study would not only account for these fiscalfactors but also weigh the value to the community of having a new restaurant, perhaps of a typethat adds to the variety of dining options available, and therefore, one that increases the utilityof the population apart from its fiscal impact.

6
Therefore, the present study is not intended to determine whether refugee resettlement in theMohawk Valley is a worthwhile endeavor. Such a judgment goes far beyond the present study,and requires an accounting of the total impact of the policy on total well-being of thepopulation of the Mohawk Valley. Rather, the study is intended to address the question ofwhether refugee resettlement costs area residents more in public costs than is raised throughadditional tax revenue. In other words, do refugees and the economic activity they bring, paymore in taxes than they cost in public services?
2.2 Scope of Study
Because there are several levels of governmental authority, all which have the power to tax andall of which spend money on their citizens, the results of a fiscal study may differ widelydepending how one defines the geographic region of analysis. For example, if the policy inquestion involves the flow of resources from one region (say the state of New York) to another(Utica), whether the flow results in a benefit depends on one’s point of view. If the unit ofanalysis is the state of New York, a $1 million grant from the state of New York to the City ofUtica would be defined as a mere transfer of resources from residents in one part of the state toother residents in the same state. Some have more money while others have less, yet the neteffect is a zero. We call this a pure transfer. However, if the unit of analysis is the MohawkValley, the $1 million dollar grant is a pure benefit (at least the portion not raised from taxespaid by MV residents). So the same policy leads to very different results, depending on thedefinition of the geographic region of analysis.
The present study chooses the Utica/Rome Metropolitan Statistical Area, which includesOneida and Herkimer counties, as the region of analysis. While most of the refugees relocatedby the Refugee Center settle in Utica, a broader unit of analysis is required for at three reasons.First, due to the ease of transportation and the close proximity of the many towns and villagesnear Utica, the local labor markets in which the refugees work are not consistent with the Cityboundaries. Second, the unit of measurement for the cost of social services is at the countylevel. Third, most federally collected data use the Utica/Rome MSA as the smallest unit ofdisaggregation. Therefore, much of the required data are available and most reliable at theMSA level.
This local perspective differentiates this study from most others done on the fiscal effects ofimmigration, some of which are reviewed below. This local unit of analysis requires care betaken to distinguish the local taxes from state and federal taxes and local expenditures fromstate and federal expenditures. Certainly, not all benefits paid to refugees by the county comefrom county funding, just as not all taxes paid by refugees benefit the county. An increase insales tax revenue due to the refugee influx is a clear benefit to the county, while income taxespaid to the state and federal governments do not directly benefit the county budget. Similarly,public assistance programs have differing degrees of county contribution. Some, like foodstamps, are funded completely at the federal level. Although local taxpayers pay for federallydistributed public assistance benefits through federal taxes, the tax payments would be thesame no matter where in the U.S. the refugees settled. Therefore, the local cost of federallyfunded benefits is virtually zero.

7
The flow of federal and state money into the Utica-Rome area may provide additional taxrevenue at the local level. To the extent that external spending increases non-food and non-housing consumption, local governments may benefit from federal and state government publicassistance transfers. The benefits, however, would be much less than the dollar value of thegovernment transfer. It may even be insignificant in magnitude given the small share thatleaks into county revenue. It would be tempting to label federal benefits, say $100 inSupplemental Security Income (SSI), as a benefit to the local MSA. Indeed, the typicaleconomic impact study would count the benefit and any additional spending that happens as aresult of the transfer. This is commonly referred to as the multiplier effect. However, thebenefit of the $100 in SSI goes directly to the recipient, while the county benefits only to thedegree that there are leakages, through sales and property taxes, from the all additionalspending caused by the initial transfer.
2.3 The time frame for analysis
The fiscal benefits and costs of refugee relocation are likely to accrue at different points intime. Many of the costs, such as the use of medical services and cash transfers, are incurredduring the first several months after the refugees arrive. The benefits, such as increased taxrevenue, may accrue over the lifetime of the refugee. Because the benefits and costs do notaccrue at the same, future benefits and costs must be discounted to their present value, wherethe present value may be defined as how much an asset or stream of payments received in thefuture is worth to someone today. Choosing the discount factor by which future benefits andcosts are discounted back to their present value is a crucial stage in any benefit cost study.Following other studies, we use a 4 percent discount rate (Lee and Miller, 2000), but given thatthe results may be sensitive to this choice, the final results are calculated over a range ofdiscount rates. Generally, economists agree that social discount rates from 2.5 to 5.0 percentcover the range of rates that should be used to discount public benefits and costs.
The time frame over which one counts benefits and costs may also impact the outcome of afiscal analysis. Because the benefits of refugee resettlement accrue over the working life ofincoming refugees, a short time span may not appropriately account for future benefits. Thisstudy uses a period of 60 years. As such, the study account for benefits throughout theworking lives of the current refugees and their children. While some children may workbeyond 60 years, benefits that far into the future will be so heavily discounted as to be ofinsignificant magnitude.
2.4 Unit of Analysis
The primary unit of analysis is the refugee household. Previous studies find different resultsdepending on whether the unit of analysis is the individual immigrant (refugee in this case) orthe household, or the household plus children born to immigrants in the United States. Studiesof individuals tend to focus on individuals who come during their working years (or older),thereby minimizing the costs of education. We choose the household which includes allrefugees born prior to arriving in the area. A study incorporating the benefits and costs ofchildren of refugees born in the U.S. would require assumptions about fertility patterns,

8
something we know very little about with respect to refugees who settle in the Utica/ Romearea.
The analysis will be done in two ways. The first method is to follow a single cohort ofrefugees through the time period of analysis, 50 years. This analysis takes into considerationthe age, sex, and education composition of arriving refugees using the average characteristicsof refugees who arrived over the last ten years. In addition to demographics, I estimate wageprofiles and public assistance use profiles. This portion of the analysis seeks to answer thequestion, do refugees pay in more than they take out of the economy?
Refugee resettlement, however, is not a one-time event. New refugees arrive every year. Thesecond method of analysis estimates the fiscal impact of a continuous flow of refugees.Obviously, the total effect on the economy from refugee resettlement must take into accountthe cumulative impact of new waves of refugees as they arrive. Therefore, this second methodanalysis better identifies the time necessary for the fiscal benefits to outweigh the costs of acontinual stream of refugees.
3. Background Research and Previous Findings
The economic impact of immigration has been a topic of considerable interest for the last 30years. While this study concerns refugees, whose impact may be distinct from immigrants ingeneral (Refugees make up about 15 percent of immigrants.), the immigrant literature givesguidance, highlighting the important issues and providing results which may serve as abenchmark. In addition to summarizing some of this literature, this section also draws on thesmaller body of research focusing on economic effects of refugees on local and national
economies1.
3.1 Labor Market and Migration Effects
Economists have put a large share of their research efforts into understanding the effects ofimmigration on labor market, specifically the wages and employment of immigrant and nativeworkers. Despite the size of the literature, the results are mixed. For example, studies usingolder cohorts of immigrants commonly find that immigrants, although they typically had lowerstarting wages, had on average greater lifetime earnings than average native workers. Yetmore recent studies find that immigrant workers, mostly due to a decline in skills andeducation, can expect to earn lower wages throughout their working years (Borjas, JEL 1994).It has long been recognized that immigration may impact native workers, althoughtheoretically the direction of the impact is indeterminate. Just as any entrant into a labormarket may displace another worker already in that market, immigrants have the potential todisplace native workers or drive down wages for those who keep their jobs. In this caseimmigrants would be considered substitutes for native workers.
1 There is a growing literature on the well-being of refugees and the process ofresettlement. See Potacky (1997) for a review of this literature.

9
It is also possible that immigration has positive effects on native workers. Those espousingthis theory argue that immigrants are entrepreneurial and accumulate productive capital at ahigher rate than native workers (Greenwood and Hunt, 1995). Alternatively, immigrants fillless desirable jobs that natives avoid and thereby complement native workers. In this case,immigrants would not tend to decrease either wages or the probability of employment. Theeffects of such theories depend on the skill levels of immigrant workers. To the degree thatimmigrants are relatively low-skilled workers, they may have adverse or substitution effects onnative low skilled workers and positive or complementary effects for higher skilled workers.Finally, since immigration leads to an increased demand for goods, the demand for labor mayincrease leading to positive effects for both native and immigrant workers.
The actual impact of immigration on wages and employment is therefore an empiricalquestion, and one which a number of studies have attempted to answer. The findings in theempirical literature, of which Friedberg and Hunt (1995) and Borjas (1994) providecomprehensive reviews, are far from unanimous. Across studies using a wide variety ofmethodologies and data sources, the most common finding is that immigrants do tend tosubstitute for native workers, although the magnitudes of the effects on employment and wagesare typically quite small. Borjas (1994), for example, finds no studies that increasejoblessness or decrease wages among natives by more than two percent. Wilson and Jaynes(1997), a cross industry study which pays particular attention to the concentration ofimmigrants, report small negative impacts on native employment but positive effects on nativewages in industries and geographic regions with higher concentrations of immigrants, otherthings equal.
Frey ( 1997) offers one possible explanation for the small magnitude of the negative impacts.He argues that immigration leads to an out-migration of low-skilled native workers. If this istrue, empirical studies may understate the full impact of immigration on employment andwages, depending on the composition of leavers. However, a recent study by Card andDiNardo (2000) finds that areas that have had population growth through immigration alsotend to see an increase in the flow of low-skilled native workers into the area, a finding insharp contradiction to Frey’s theory and findings.
One conclusion that appears rather robust across studies is that the strongest negative labormarket effects seem to fall on other foreign born workers, and most strongly on recentimmigrants. Greenwood and Hunt ( 1995) find that the wage effect of immigration on foreignborn workers is roughly two and one-half times the effect on native workers. Economistsattribute this finding to the continual flow of new immigrants into industries and regions withhigh concentrations of foreign born workers.
Unfortunately, a comparable literature does not exist on the labor market impacts of refugeeson U.S. labor markets. However, since the effects of immigration are typically measurableonly in areas with high concentrations of immigrants, one may conclude that refugees, a smallsubset of all immigrants, would have even smaller effects. This does not mean there are noeffects. If refugees, due to common skills or lack of English proficiency, tend to concentrate ina particular industry or small geographic area, local effects may be noticeable.

10
Recent years have witnessed a growing literature on the factors contributing to the economicsuccess of refugees. Refugees are by-and-large involuntary immigrants and face greaterobstacles than most immigrants. Potacky-Tripodi (1999) reviews several large studies on theeconomics success of refugees and extends previous studies. She concludes that refugees withmore education, greater facility with the English language, greater length of stay in the U.S.,and who live in families headed by a married couple tend to have higher levels of employment,greater household income, and a lower probability of public assistance utilization. Thepresence of children and adults over 65 years of age tends to hamper economic status.
3.2 Fiscal Impacts
A second body of literature relevant for this study addresses the broader fiscal impact ofimmigration. Again this literature tends not to separate refugees from other immigrants, butthe findings are instructive. The key question in this literature is how much do immigrantscontribute through taxes of all kinds relative to the costs they impose through the services andbenefits they receive? The literature in this area is both younger and smaller than the labormarket impact literature, probably due more to the lack of data, lack of consensus on methods,and difficulties in several key definitions than to lack of interest. Some of the difficulties indefining family units and the relevant time frames for such analyses will show up later in thisreport.
Several studies, notably Borjas (1994), Fix and Passel (1994), Smith and Edmonston (1997),and Moore (1998) attempt to determine the net fiscal impact of immigration. Fix and Passel’sresults are representative of the common finding that immigrants pay more in taxes that theyreceive in government services. Moore (1998) concludes that the net present value of benefitsless costs is between $20,000 and $80,000 for each immigrant. Borjas (1995) points out,however, that more recent immigrants, due to a deterioration in skills among those admitted,are not likely to present such a positive picture. In calculations he would qualify as rough, heestimates that in 1990, immigrant households in the U.S. cost taxpayers about $16 billion.Such single-year estimates may be not be useful as benefits and costs are incurred at differentpoints in time and the number and composition of immigrants changes over time.
Because the funding for the public services, including cash assistance and in-kind benefits, isnot shared equally across federal, state, and local governments, the fiscal impacts of immigrantand refugee resettlement will differ. For example, Social Security is a federal programrequiring no local contributions. Medicaid and cash assistance through Temporary Assistancefor Needy Families (TANF) requires a state and local contribution. Oneida County pays 25%of the benefit costs for these programs. Lee and Miller (2000), using CPS and Census data,project the fiscal impacts of immigration on federal, state and local governments. They findthat immigration is an overall net benefit for the country, but a net loser for state and localgovernments, at least in the short run. One way to compare the differential impacts is tocompare the time it takes to break even. Lee and Miller find that it would take 10 years for asingle immigrant to become a net contributor to the U.S. economy, 16 years if we consider thechildren of immigrants. However, for state and local governments the breakeven time horizonis about 45 years. It should be emphasized that such an exercise requires a number of

11
assumptions which make generalizing these results to a specific county unreasonable. Forexample, suppose an immigrant settles in County A, has children, and lives there for 20 years.After 20 years the children move to County B. County B will reap the benefits of theeducation investment in the children, while County A will not.
3.2.1 Costs
The costs of immigration tend to be easier to identify and measure than the benefits. Theprimary costs of immigration are incurred through the costs and congestion of the services theyuse (such as cash transfer programs, health care, and education) and the indirect costs on nativeworkers. While the U.S. has a relatively clear immigration policy, it has few assistanceprograms targeted at immigrants. Fix and Zimmerman (1995) review the programs availableto immigrants. Generally, immigrants use the same programs available to natives. Refugees,however, do benefit from several programs that provide health care, public assistance and jobassistance as established in the Refugee Act of 1980. The Act makes economic adaptation ofrefugees a prime goal, where economic adaptation is unsatisfactorily defined as beingemployed and not receiving means-tested cash assistance. Funding of the Act has beenseriously eroded by inflation since its passing, from over $7,000 per immigrant in 1984 toabout $2,000 per immigrant in 1994 (Espenshade, Fix, Zimmerman, and Corbett, 1997). Thefederal government also provides funding for language training through the elementary andsecondary school system and for adults.
The Emergency Immigrant Education Act offers some financial support for local governmentsthat can demonstrate significant economic strain due to immigration. The policy is designed tooffset costs. Unfortunately, the name of the Act is somewhat deceiving as the educationassistance available through the act is minimal. Most of the emergency assistance is dedicatedto offset the costs of incarcerating criminal aliens.
Borjas (1994) finds the probability of welfare assistance among immigrants to have increasedsince 1970, largely due to a decrease in the average skill and education levels of more recentimmigrants. In 1990, immigrants participated in cash assistance programs at a rate 2.5percentage points above the native population, a finding which is exacerbated when othernoncash public assistance programs are also considered (Borjas and Hilton, 1996). Using theMarch 1995 Current Population Survey, Bean et al (1997) find 10.6 percent of immigranthouseholds receive some sort of cash assistance compared to 8.1 percent for native households.In New York State, the differential increases to 6 percentage points, from 17 percent forimmigrants compared to 11 percent for natives (Passell and Clark, 1998). Removing refugees from the pool of immigrants decreases the proportion of immigrantsreceiving cash assistance (Fix and Passell, 1994). Of course, this implies that refugees receivebenefits at a higher rate than other immigrants. Immigrant participation rates also vary widelydepending on country of origin. For example, Asian and Mexican/Central Americanimmigrants receive cash benefits at rates much higher than natives, while European immigrants(not necessarily refugees or even recent immigrants) receive benefits at lower rates than natives(Bean et al., 1997).

12
Education is a major cost of immigration just as it is for natives. Most immigrants arrive asworking age adults, having already completed school in their home country. Immigrants whoarrive as adults require relatively little education spending. However, providing education forthe children of immigrants is a burden that falls heavily on state and local governments.Refugees and their children are more likely to have had their formal schooling interrupted dueto political turmoil in their home country, and may have lower levels of language proficiencyupon arrival. Spending on education, whether on children or adults, is costly, but it is also aninvestment. Educating immigrants pays off if they stay in the country (or county) and areproductive taxpayers throughout their working years. While educating immigrant children ismore expensive than educating immigrant adults, the children typically have a longer workinglife. In fact, revenue from the children of immigrants in their working years is the largest fiscalbenefit of immigration (Lee and Miller, 2000).
3.2.2 Benefits
The fiscal benefits to immigration have been widely discussed but tend to be harder to quantifythan the costs which are typically government expenditures. As stated earlier, immigrationincreases the national income by more than what it costs to employ them (Borjas, 1995).Immigrants are consumers so they expand market size and provide valuable inputs toproduction. Expanded markets means some resources that would be unemployed orunderemployed are more likely to be put into use. To the degree that these increased activitiesincrease tax payments, they generate fiscal benefits. Also, because new immigrants aretypically of working age, some have even discussed using immigration policy as means tofinance Social Security for the aging U.S. population.
A larger population of working age households broadens the pool of tax payers. Certainly themost tangible benefits of immigration are the taxes paid by immigrants and their children.Income taxes are levied by the federal government, most state governments, and sometimes bylocal governments. Even though local governments typically don’t levy income taxes, theymay still benefit from increased allocations from state budgets. Local governments benefitmore directly from taxes placed on consumer goods and on personal and business properties.The benefits of immigration are strongly affected by the age profile of arriving immigrants. Tothe degree that the arriving immigrants are of working age, they will be able to move morequickly into the workforce, meaning more immediate benefits. This is not to suggest thatmoving immigrants quickly into the work force is an optimal strategy. Another key factor indetermining the benefits of immigration is the skill level of immigrants. Because higherwages leads to increased tax revenues, there is an incentive to admit higher skilled immigrantsand to train those who arrive to use the skills they bring.
3.2.3 Implications for Refugees
At a minimum, the preceding literature review suggests that the issues involved in determiningthe fiscal benefits and costs of refugee resettlement are complex. If refugee resettlementaffects the economic activity of others, then simply adding up the taxes paid by refugees andsubtracting the local cost of the public services they use will not suffice. Refugees may affectthe income (and therefore consumption and tax paying) prospects of native workers.

13
Past studies suggest that influx of refugees can have both positive and negative effects on locallabor markets. To determine the impacts, some assessment must be made as to the effect ofrefugees on the wages and migration effects on native workers. Are refugees a substitute forlocal workers, driving down wages and forcing out native workers? Or does the refugeeworkforce lead to reduced production costs, perhaps attracting specific types of industry? Acareful look at the trends in the Utica/Rome labor markets will give some clues to answer thesequestions.
As for the net fiscal impact, the literature suggests that immigration is beneficial at a nationallevel but costly for states and local governments. If the local economy could be called typical,then we might expect the results of the fiscal analysis to be negative. However, none of thestudies cited address the impact of refugees or the impact of immigration on a specific localregion. They are, therefore, average results. As we will see below, the economic anddemographic circumstances Mohawk Valley are far from typical, and the question as to the netfiscal impacts of refugee resettlement are wide open.
4. An Overview of the Utica/Rome Economy
Before discussing the impact of the flow of refugees, it is necessary to describe, at least inbrief, the economy into which they are coming. Once described as a thriving, the economy ofUtica and its surrounding communities has struggled in the 1980's and 1990's. The exodus ofmajor employers such as General Electric (later Martin Marietta) and the closing of the Griffissair base were among the shocks which have had painful and lasting impacts on the localcommunity. While recently there have been improvements which give reason for optimism,the economy into which refugees arrive is vastly different from late 1980s whenunemployment rates were falling and the workforce was growing. This section describes thosechanges deemed most relevant for this study.
4.1 Population Changes and Components of Change
Labor is a crucial resource for any economy. While the population in most U.S. cities,counties, and Metropolitan Statistical Areas (MSAs) has been growing over the last twodecades, the Utica-Rome MSA has seen its population decrease. In 1970, the Utica-RomeMSA boasted 340,477 people. The population decreased by nearly twenty thousand people inthe 1970s to 320,700 in 1980. The rate of decrease lessened in the 1980s but had reached316,886 in 1990. By 1998 the MSA population had fallen to 294,677, a drop of more than 13percent over nearly two decades. A significant share of the drop in the 90s occurred after theannouncement and ultimate closing of the Griffiss Airbase in 1994.
Similar population patterns hold for Oneida County and are even more extreme for the city ofUtica. For example, the Oneida county population dropped from 253,465 in 1980 to 236,437in 1998. Population decreased by 5.7 percent from 1990 to 1998. The City of Utica lost 9.2percent of its population in the 1980s and continued to lose another 10.5 percent from 1990 to1998. In 1998 the Utica population was estimated to be 61,368, down from 75,632 in 1980.

14
Because the Utica population decreased at a faster rate than Oneida County, Utica’s share ofthe county’s population also fell in the 1980's and 1990's. Whereas Utica made up nearly 30percent of the Oneida county population in 1980, the share had fallen to roughly 21 percent in1998.
Without international immigration, not all of which is attributable to refugees, the out-migration numbers would be far more extreme. Estimates from the Bureau of Census show netdomestic immigration for the Utica-Rome MSA from 1991 to 1998 of -32,874, 82 percent ofwhich was from Oneida county. However, over the same period international immigrationadded (on net) 4,282 to the MSA population. In other words, to some extent, the migration out of the MSA is mitigated by international migration into the area. On average, about 4,100natives were leaving the area while an average of 535 international immigrants arrived in theMSA.
Table 1: Demographics by Geographic Definition
Utica-RomeMSA
OneidaCounty
City of Utica
Population 1980 320,180 253,836 75,632Population 1990 316,866 251,030 68,637Population, 1998 294,677 230,628 61,368
(1996)Average Household size, 1998 2.48 2.50 2.36Net native immigration, 1991-1998 -32,874 -27,225 NANet International immigration1991-1998
4,282 3,531 NA
Percent White, not Hispanic, 1998 90.6 89.4 80.4Percent Black, not Hispanic, 1998 5.1 5.8 12.6Percent Hispanic (1995 3.0 3.3 5.0Percent without H.S. Diploma,1995
21.8 22.2
Percent H.S. graduates, 1995 31.8 29.3People all ages in Poverty, 1995 14.1People under age 18 inPoverty,1995
22.4
Median Age,1980 31.7 31.6 34.0Median Age, 1990 34.0 33.8 34.4Median Age, 1998 36.1 35.7 35.4Median Household Income, 1998 $31,426 $32,424 $23,434Median Family Income,1998 $40,748 $41,400 $33,026Sources: U.S. Bureau of Census; Marketview Comparison Report (Clarities, Inc.);Technical Assistance Center, SUNY at Plattsburgh.
One of the key questions regarding the migration out of the area is who is moving away. Thedemographics tell part of the story. As we see in Table 1, since 1980 the Utica and Oneida

15
populations have become older, increasing in all three geographic definitions to approximately34 years of age with the share of population over 65 increasing significantly. Over the sametime period the average household size decreased, suggesting that movers out of the area tendto be larger working age households.
4.2 Changes in Industry and Occupational Structure
Utica’s refugees enter into a local economy that has undergone considerable structural changeover the last twenty years. Since 1980, the industrial mix in the Mohawk Valley has evolved,and the most significant trend, one not unique to the Mohawk Valley, has been a movementaway from manufacturing and toward a greater reliance on the service sector. Using data fromthe State of New York on those workers covered by unemployment insurance, data on most butnot all workers, we can track the change in industry structure over time. These trends areplotted in Figure 2. In 1980, 30.6 thousand workers, or about 26.7 percent of all workers, inthe area worked in the manufacturing sector of the economy. The numbers were slightly lowerthan in 1979 when the manufacturing sector was at its largest. Of course, not all the workers inthe manufacturing sector were involved in the manufacturing process itself. Some wereaccountants or were in sales or management. Yet their livelihood was dependent on theproduction of a physical product. At the same time, at 20.6 thousand workers the serviceindustries employed roughly two-thirds as many workers as the manufacturing sector.
As it has across the country, employment in the manufacturing sector has diminished in sizewhile the service industries in the Mohawk Valley have grown appreciably since 1980, both interms of employment and as a share of the entire local economy. From 1980 to 1998,employment in the manufacturing sector decreased by 33 percent and by nearly 15 percent inthe1990s alone (Table 3). From 1980 to 1998, the share of workers in manufacturingdecreased from nearly 26.7 percent to 15.6 percent. The decrease in manufacturingemployment was matched with even larger increases in the service sector. In the 1990s, theservice sector saw employment increase by 38 percent, from 18 percent of workers to over 30percent. In fact, the service and insurance and real estate industries are the only sectors thatexperienced growth in the 1990s.

16
Table 2: Employees by Industry, Oneida County
Occupations
Because people tend to look for certain types of jobs and train for occupations, not industries, thechange in industry structure tells only part of the story. It says little about what the workers areactually doing on the job. Within the manufacturing industry, some are managers orprofessionals (say an accountant) while others are classified as service providers (such as thejanitorial staff).
Table 3 reports that of the roughly 134 thousand workers employed in the Utica/Rome MSA in1994, 15.8 percent work in service occupations. Another 28 percent work as managers,administrators or in professional and technical occupations, a category that would include suchoccupations as office managers, engineers, architects, teachers, lawyers, and health technologists.More than another quarter of employees, work in wholesale and retail sales positions or inadministrative support. Other than administrative support, all of these occupations are projected
1980 1990 1998 Change 1990-1998Industry
Number of
Employees
Percentof
Employees
Numberof
Employees
Percentof
Employees
Numberof
Employees
Share ofEmploye
es
Numberof
Employees
PercentChange
inEmploy
ees
PercentageChang
e inShare
Total,Non-agricultural
114.6 100.0 128.5 100.0 129.7 100.0 1.2 0.9 --
Manufacturing
30.6 26.7 23.7 18.4 20.2 15.6 -3.5 -14.8 -2.9
Transpor-tation andUtilities
3.9 3.4 4.4 3.4 3.9 3.0 -0.5 -11.4 -0.4
Trade 22.1 19.3 28.0 21.8 26.3 20.3 -1.7 -6.1 -1.5Insurance,RealEstate
5.5 4.8 7.5 5.8 8.2 6.3 0.7 9.3 0.5
Services 20.6 18.0 28.8 22.4 39.8 30.7 11.0 38.2 8.3TotalGovern-ment
29.0 25.3 31.8 24.7 27.9 21.5 -3.9 -12.3 -3.2
EstimatedPopulation
320.2 -- 316.6 -- 294.7 -- -6.9 --
Source: U.S. Bureau of Census. County Business Patterns.

17
by Department of Labor economists to be growing occupations for upstate New York. Of thegrowing occupations, the professional, technical and sales occupations are projected toexperience the greatest growth.
Unfortunately labor demand is not projected to grow for all occupations. Employment in theprecision production and craft occupations, which include mechanics, repairers and the
Table 3: Number of Employees by OccupationUtica/ Rome North Country Region*
OccupationEmploy-ment1994
Percentof TotalEmploy-ment
Employ-ment1995
ProjectedEmploy-
ment 1998Net
Openings1998
ProjEmploy.Change
1994-2004
Proj. %Change1994-2004
Total, AllOccupations
134,019
100.0 210,770 213,800 5,830 2,450 1.2
Managers andAdministrators
13,158 9.8 11,700 11,900 290 400 3.7
Professional andTechnical
24,392 18.2 50,150 51,610 1,390 3,070 6.2
Marketing andSales
14,389 10.7 25,260 26,230 1,180 1,520 6.5
AdministrativeSupport
23,035 17.2 37,630 37,140 720 -2,910 -7.9
Service 21,138 15.8 38,600 40,110 1,590 1,940 5.0Agricultural,Forestry,Fishing
3,410 2.5 1,690 1,760 50 30 1.8
PrecisionProduction,Craft
15,363 11.5 18,930 18,990 400 -280 -1.5
Operators,Fabricators, andLaborers
19,134 14.3 26,620 25,900 610 -1,300 -4.8
* The North Country is defined to include Oneida, Madison, Herkimer, Fulton,Montgomery, and Schoharie counties.Source: U.S. Bureau of Census. County Business Patterns; Technical Assistance Center,SUNY at Plattsburgh. Technical Assistance Center, SUNY at Plattsburgh.
construction trades is expected to decrease by 1.5 percent from 1994-2004, what may be called amodest decrease. However, the bottom row of Table 3 reports a greater projected employmentdecrease of nearly 5 percent for the operator, fabricator and laborer occupations. This categoryincludes machine operators and assemblers, transportation workers and material movingoccupations, handlers, equipment cleaners, and general laborers.

18
4.3 Change in Wages and Unemployment, and Public Assistance Caseloads
The labor force in Oneida County peaked in 1990. After being relatively stable from 1977 to1988, the labor force grew rapidly in the late 1980s. Employment also boomed in the late 1980swith unemployment dropping from 9.1 percent in 1983 to 4.7 percent in 1990. Similar to thenational trend, the recession of 1991-1992, along with corporate downsizing, led to a rapidincrease in unemployment in the Oneida County unemployment with the number of unemployedincreasing by 50 percent from 1990 to 1991 from 6.8 thousand to 10.3 thousand people. Theresult was an increase in the unemployment from 4.7 to 7.1 percent in 1991 and to 7.4 percent in1992. Perhaps more important, this episode also spurred another decrease in the local laborforce.
Table 4: Labor Force and Employment 1977-1998, Oneida County
year Labor force Employed Unemployed Unemployment Rate
EstimatedPopulation
(000's)1977 134.2 121.3 12.9 9.6 326.91978 134.5 125.1 9.4 7.0 325.61979 137.4 129.0 8.3 6.1 323.71980 136.2 126.2 10.0 7.4 320.21981 135.2 124.9 10.3 7.6 319.81982 133.2 121.2 12.0 9.0 319.81983 133.6 121.5 12.1 9.1 320.41984 134.3 124.7 9.6 7.1 320.11985 133.7 123.8 9.9 7.4 319.41986 134.6 125.1 9.5 7.0 317.01987 133.6 126.4 7.2 5.4 316.21988 135.7 129.2 6.5 4.8 315.31989 138.9 131.4 7.5 5.4 316.11990 145.6 138.8 6.8 4.7 316.61991 144.3 134.0 10.3 7.1 318.61992 143.2 132.6 10.6 7.4 319.01993 143.6 134.4 9.2 6.4 317.71994 144.0 136.0 8.1 5.6 315.41995 143.4 135.4 8.0 5.6 308.31996 141.2 133.7 7.5 5.3 302.41997 142.8 135.3 7.5 5.2 297.91998 142.4 136 6.5 4.5 294.71999 4.3Source: New York State Department of Labor.

19
Since 1992, the economic picture for Oneida County has shown signs of improvement.Although the population continues to fall, the level of employment has actually increased. Agood share of the population exodus can be linked to the closing of the Griffiss Airbase. Sincemilitary employees are not counted in the labor force statistics, the labor force and employmentstatistics show little response to the closing of the base, while population decreased by 13thousand people from 1994 to 1996. In part, the exodus of spouses and family of militarypersonnel may have opened employment possibilities and drawn previously discouraged workersinto the labor force. In 1999, the rate of unemployment in Oneida County stood at 4.3 percent,the lowest rate in at least 22 years.
Participation in public assistance programs tends to follow the unemployment rate, but in OneidaCounty, public assistance participation tells a more mixed story. A combination of fallingunemployment rates in the 1990s and the Personal Responsibility and Work OpportunityReconciliation Act (PRWORA) of 1996 resulted in shrinking caseloads for TemporaryAssistance for Need Families (TANF), New York State Safety Net (SN)/Home Relief (HR), andthe Food Stamp Program (FS). The Food Stamp Program and Aid to Families with DependentChildren (AFDC), which was replaced by TANF, reached their peak participation in the 1990s in1994 while SN/HR peaked in 1991. As shown in Table 6, TANF caseloads (measured inhouseholds) dropped by 30 percent from 1994 to 1998. Using recently updated data, 1999
average monthly caseloads were 33 percent lower than in 19942. Oneida county residents, whofund 25 percent of TANF and Medicaid benefits, saw their tax burden from TANF drop by 36%.Food stamp usage also declined after 1994, though at a more modest rate. In 1998, food stamp
participation was 13 percent lower than in 19943. Home Relief, New York’s version of GeneralAssistance, fell throughout the 1990s. From 1990 to 1998, HR participation fell by 56 percent.
2 National Studies attribute roughly 2/3 of the drop in TANF caseloads since PRWORA tothe strong economy and the remaining 1/3 to changes in program changes.3 Food stamps benefits are federally funded and therefore are not paid for out of local taxrevenues. Participation numbers are shown here as an indication of the general economic healthof the region, not as a measure of local financial burden.

20
Table 5: Oneida County Public Assistance Spending and Caseloads, 1987 - 1998 (1997 dollars)
Year Medicaid* TANF/ADFC*Safety
Net/HomeRelief**
FoodStamps*
PublicAssistance
Share of O.C.Spending
1987 $14,415,914(9500)
$5,246,773(3524)
1707 0(9440)
0
1988 $14,537,348(9878)
$5,170,779(3273)
1551 0(8821)
0
1989 $14,288,841(10056)
$4,863,931(3170)
1754 0(8421)
0
1990 $16,660,713(11093)
$5,844,563(3212)
1803 0(8544)
0
1991 $19,048,813(12119)
$6,851,377(3594)
1905 0(9299)
0
1992 $20,336,699(13535)
$6,514,413(3416)
1638 0(10165)
0
1993 $22,542,062(14666)
$6,287,828(3563)
1812 0(11035)
0
1994 $23,896,860(15173)
$6,193,503(3604)
1658 0(11316)
0
1995 $24,189,745(15290)
$5,999,611(3425)
995 0(11113)
0
1996 $22,505,857(15290)
$4,900,031(3037)
837 0(11117)
07741
1997 $23,616,757(15830)
$2,686,829(2637)
831 0(10481)
0(7423)
1998 $25,474,854(15804)
$3,959,402(2529)
795 0(9794)
0
* Participation numbers are correspond to the monthly average number of participants.** The Home Relief participation numbers are for the month of December in each year.Source: Oneida County Department of Social Services.
While participation and spending on TANF, HR, and FS all declined after 1994, Medicaidcaseloads continued to increase as they have throughout the 1990s. Adjusting for inflation,Oneida County’s share of Medicaid benefits was 53% more in 1998 than in 1990. The 15,804average participants per month in 1998 was up by 4,711 over 1990, an increase of 42%. On theone hand, one should not be surprised at these numbers. The PRWORA of 1996 decoupledTANF and Medicaid making it easier for households not participating in TANF to qualify forMedicaid coverage. The large increase in participation from 1996 to 1997 supports thishypothesis. On the other hand, the other components Oneida County’s public assistance appearto be improving at the same time more families are needing and using Medicaid. Totalemployment is up, unemployment is low, and reliance on TANF and food stamps is falling. Incombination, these observations lead to several possible explanations, and there may be sometruth to all of them. First, health insurance is becoming harder and harder for the average or lowwage worker to afford, leading to higher rates of Medicaid usage. Second, while employment is

21
high, wages for new jobs are not sufficient to pay for health insurance. Finally, while healthinsurance used to be automatic, employers may be cutting back on fringe benefits, forcingworkers to make the choice between buying health insurance or not. In any case, the Medicaidnumbers indicate a significant and growing share of Oneida County residents without privatehealth insurance.
5. The Impact of Refugees on Local Labor Markets
The impact of refugees on the local economy depends largely on how refugees fit into the locallabor markets. While data are insufficient to provided precise answers, this section addressesthe questions: What types of jobs and wages are refugees getting? Are refugees crowdingnatives out of the labor market? Does the increase in labor supply appear to be driving wages fornative workers down?
5.1 Types of Jobs
Refugees come with a wide range of skills, education, training, and work experience. Yet,moving directly into those occupations is difficult for most refugees, especially in the short term.Insufficient language skills, occupational licensing, and regulations form significant barriers tosmooth transition into local labor markets. For example, someone trained as a lawyer in Bosniacannot simply begin to practice law in Utica, NY. At a minimum it requires taking the state barexam and probably requires additional schooling because of differences both in the educationalrequirements and the content of law between U.S. law and law in their country of origin. Suchdifficulties exist for a wide array of occupations from nursing to plumbing.
When refugees arrive in Utica, they sign contracts agreeing to accept work whenever they areable and whenever jobs are available. While all refugees receive intensive English training, theduration of such education depends, in part, on the availability of employment. When jobs areeasy to find, ESL training may be as short as two months, a time period far too short for mostrefugees to become proficient in the English language. This limited English training has atremendous impact on the types of jobs that refugees tend to take.
The MVRCR keeps data on every refugee who comes to Utica, including information on the jobsinto which they are placed. While preserving worker confidentiality, they were kind enough toprovide data on the types of jobs and wages for every refugee in their database, which begins in1989. Because some refugees were placed in jobs more than once, I use only the most recentjob for each individual, resulting in a database of 2986 jobs. Table 6 presents the numbers ofjobs, percent of jobs, and hourly wages for the ten most common job titles. The table is sortedfrom the most common job to the least (among the top ten). All told the top ten job typesaccount for 73 percent of all jobs. The remaining 27 percent are spread among a large number ofjob titles and employers.
It is important to keep in mind that these jobs are the initial jobs for Utica’s refugees. TheMVRCR keeps no formal records after the first year, so it is difficult to estimate the share ofworkers who remain at their initial jobs, the average duration of the initial job, or the types ofjobs into which these workers transition. Work by Coughlan and Owens-Manley, which focuses

22
on refugees who have become citizens or who have purchased houses, suggests considerablelabor mobility among these subgroups. However, their research also suggests that there remainsa serious mismatching of refugee skills and jobs four and five years after arriving in the area.
The most common initial jobs for refugees are jobs that require little training and relatively lowlevels of English proficiency. Small manufacturing assembly work is easily the most commonwork for refugees. Of the nearly 3000 jobs, 26.7 percent of all refugees went into assembly jobs.Another 15 percent went into sewing jobs. The remaining 60 percent of jobs were more evenlydistributed with production workers and machine operators being the next most common jobs.The sixth through tenth most common job titles each accounted for roughly three percent ofinitial jobs.
Table 6: Ten Most Common Refugee Job TitlesJob Title Number of
RefugeeWorkers Placed
Percent of allRefugee Jobs
Average 1999 Wagesfor Refugee Workers
Assembler 798 26.7% $6.50Sewer 445 14.9% $6.25Productionworker
206 6.9% $7.25
Machine Operator 166 5.5% $7.50Presser 114 3.8% $6.82Nurse Aide 100 3.3% $7.25GreenhouseWorker
98 3.3% $5.54
Folder 96 3.2% $6.00Meat Cutter 91 3.0% $6.50 * 1998 dataLaborer 87 2.9% $6.80 * 1998 dataTotal 2201 73.7%2986 jobs recorded.Source: Mohawk Valley Resource Center for Refugees.
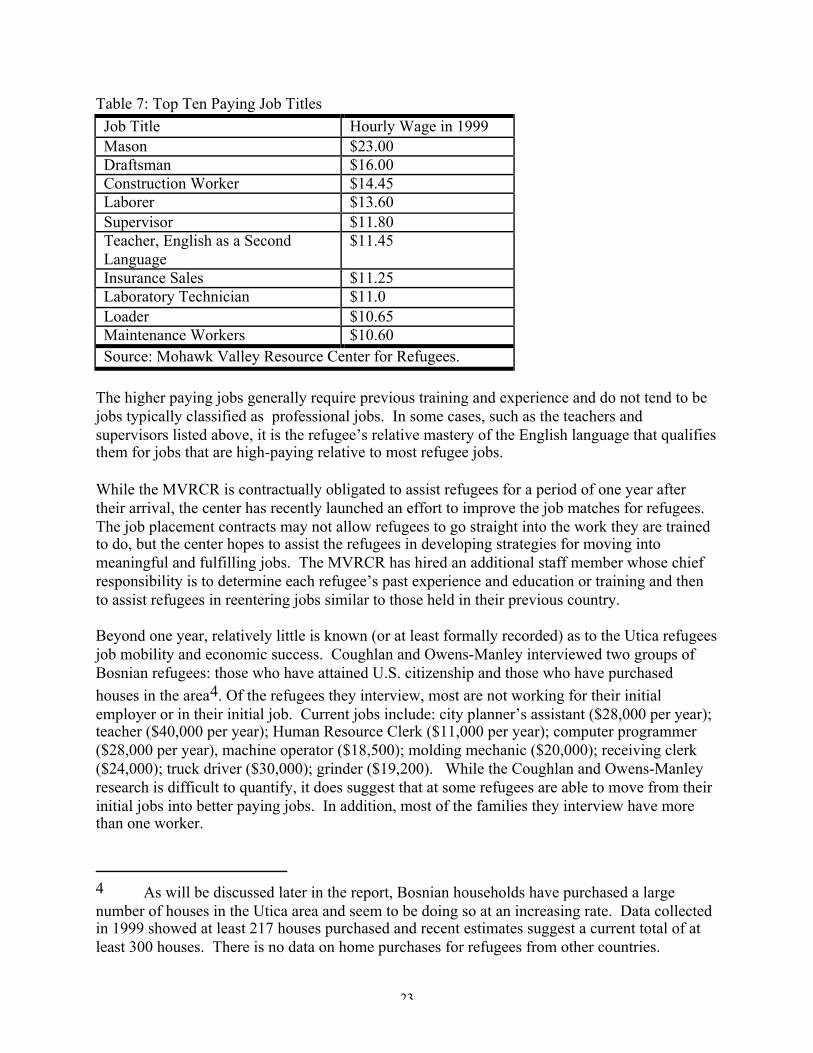
It should come as little surprise that the wage rates for these initial jobs is relatively low, rangingfrom $5.54 for greenhouse workers to $7.50 for jobs as machine operators. These jobs requirelittle if any experience and the training investment is minimal. It should be emphasized againthat these jobs are initial jobs. To the degree that refugee workers are mobile, a topic aboutwhich little is known, the table should not be used to imply the total number working in theseoccupations. Most, but not all, refugees’ first jobs are in traditionally low-wage jobs requiringlittle formal training. Some refugees do find higher paying jobs, although less than 2 percent ofrefugees start out in jobs paying $10/hour or more. Among those jobs that do pay well, there isno job title paying more than $10/hour in which more than 3 refugees are employed. The top 10paying job titles for refugees’ initial jobs are listed below in Table 7.
23
Table 7: Top Ten Paying Job Titles
Job Title Hourly Wage in 1999Mason $23.00Draftsman $16.00Construction Worker $14.45Laborer $13.60Supervisor $11.80Teacher, English as a SecondLanguage
$11.45
Insurance Sales $11.25Laboratory Technician $11.0Loader $10.65Maintenance Workers $10.60Source: Mohawk Valley Resource Center for Refugees.
The higher paying jobs generally require previous training and experience and do not tend to bejobs typically classified as professional jobs. In some cases, such as the teachers andsupervisors listed above, it is the refugee’s relative mastery of the English language that qualifiesthem for jobs that are high-paying relative to most refugee jobs.
While the MVRCR is contractually obligated to assist refugees for a period of one year aftertheir arrival, the center has recently launched an effort to improve the job matches for refugees.The job placement contracts may not allow refugees to go straight into the work they are trainedto do, but the center hopes to assist the refugees in developing strategies for moving intomeaningful and fulfilling jobs. The MVRCR has hired an additional staff member whose chiefresponsibility is to determine each refugee’s past experience and education or training and thento assist refugees in reentering jobs similar to those held in their previous country.
Beyond one year, relatively little is known (or at least formally recorded) as to the Utica refugeesjob mobility and economic success. Coughlan and Owens-Manley interviewed two groups ofBosnian refugees: those who have attained U.S. citizenship and those who have purchased
houses in the area4. Of the refugees they interview, most are not working for their initialemployer or in their initial job. Current jobs include: city planner’s assistant ($28,000 per year);teacher ($40,000 per year); Human Resource Clerk ($11,000 per year); computer programmer($28,000 per year), machine operator ($18,500); molding mechanic ($20,000); receiving clerk($24,000); truck driver ($30,000); grinder ($19,200). While the Coughlan and Owens-Manleyresearch is difficult to quantify, it does suggest that at some refugees are able to move from theirinitial jobs into better paying jobs. In addition, most of the families they interview have morethan one worker.
4 As will be discussed later in the report, Bosnian households have purchased a largenumber of houses in the Utica area and seem to be doing so at an increasing rate. Data collectedin 1999 showed at least 217 houses purchased and recent estimates suggest a current total of atleast 300 houses. There is no data on home purchases for refugees from other countries.
24
Local newspaper articles and letters to the editor have expressed the obvious concern thatrefugees may crowd natives out of the local labor market. Others theorize that the availability ofrefugee labor will attract employers to the area. Such new businesses would not only employrefugees, but also employ natives and may potentially bring new taxpayers into the area. A directand thorough answer to the question of crowding out would require a level of data not currentlyavailable. For example, time series data on population show the area population decreasing overthe last 20 years. Some of the population decreases can be traced to major corporate shutdownsand to the closing of the Griffiss Airbase. We know little, however, about the demographics andsocioeconomic characteristics of those who leave. Unfortunately, households who leave the areaare not questioned as to their reasons for leaving. And those businesses that have moved into thearea are reluctant to list the availability of refugee labor as a reason for coming to the Mohawk
Valley5.
To address the question indirectly, I use data from the New York State Department of Labor onjob openings in June 1999 and a separate database on registered jobs seekers in the same month.The data represent only a share of the total number of opening and job seekers as not allemployers contact the NYS job placement offices and not all job seekers register for employmentservices with the DOL job placement services. However, the DOL is the largest databaseavailable for this purpose and all people receiving unemployment benefits are registered for with
the job placement service automatically6. Moreover, not all job seekers are unemployed; someare simply looking for better work. Nonetheless the Department of Labor data are instructive. InTable 8 I present the June 1999 job openings and job seekers data by occupation and combinethis with the initial jobs data on refugees’ first jobs over the last ten years. The table attemptsto show where the refugees tend to find jobs relative to the rest of the job-seeking pool and to thenumber of openings in the various occupational classes.
Whereas a large proportion of job seekers are looking for managerial, professional, or technicalor sales positions, refugees rarely enter into these positions. Table 8 shows that 46 percent (topthree rows) of job seekers are seeking jobs in these three occupational categories. Only 5 percentof refugees find managerial, professional, or technical or sales positions. In fact only 11 refugeeshave ever been placed directly into managerial or professional jobs. About 40 percent of the jobopenings are in the service sector. This was the only sector where the number of opening was
5 Attempts were made to contact Utica businesses. These effort were abandoned whenbusinesses refused to answer.6 There are many business providing employment services in the Mohawk Valley, butadding the databases together would double count businesses or individuals registered with morethan one service.

25
Table 8: Job Openings, Seekers, and Refugee Workers
Occupation CurrentOpenings inJune 1999
CurrentSeekers inJune 1999
Seekers/openings,June 1999
InitialRefugee
Jobs since1989
InitialRefugee
jobs/Current
OpeningsManagerial 107 304 2.84 2 0.02Professional 120 365 3.04 9 0.08Technical, Sales, AdminSupp
723 1539 2.13 148 0.20
Service 1141 820 0.72 315 0.28Farming 3 46 15.33 114 38.00Precision Production 251 501 2.00 490 1.95Operatives 529 1182 2.23 1901 3.59
2874 4757 1.66 2979 1.04
Sources: New York State Department of Labor and Mohawk Valley Resource Center forRefugees.
greater than the number of seekers. The final column shows that the total number of refugeeswho have taken service jobs is less than 30 percent of the number of jobs advertised in a singlemonth. In contrast, refugees appear to take a larger share of the job openings in the agriculturaloccupations. Most of these agricultural jobs are at local greenhouses, jobs that pay among thelowest of all refugee jobs.
A vast majority of refugees gain jobs in the precision production or operative and laborerscategories. In fact 80 percent of refugees have been placed in jobs in one of these twocategories. Again, the language requirements for these jobs explains a large share of the reasonrefugees are taking these jobs. About 35 percent of job seekers, who also include refugeesregistered through the state employment service, are looking for these production, machineoperator, and laborer jobs. While it is impossible to determine if refugees have increasedunemployment among natives, if such substitution has taken place, you expect it to be in theprecision production or operative and laborer occupations.
There is little evidence that refugees have hurt the employment opportunities of native workers.As shown in Table 4, employment has been relatively stable in the late 1990s while thepopulation has decreased. The result has been declining unemployment rates. Native workersnow face the lowest unemployment rates in the last 20 years. Some may counter that therefugees effect is being under counted since many of those pushed out of jobs have left the area.It cannot be said with any certainty, that native population outflows would have been lower hadthe refugees not been coming. Yet the native outflows have so far outnumbered the inflow ofrefugees.
To the degree that crowding out is real, that refugees have displaced native workers, it wouldhave to be in the small assembly and sewing jobs and to an even lesser degree in the productionand machine operator jobs, jobs which pay generally low wages. A similar argument applies to

26
the question of the impact of refugees on wages. Such impacts are likely small, likely localizedto a small sector of Oneida County, and likely localized to a small sub-sector labor market.
One final piece of information is helpful in sorting out the crowding out puzzle. The MVRCRworks hard to place refugees only in jobs that provide health insurance benefits. Given thatmany smaller employers cannot provide health insurance benefits and that jobs that payrelatively low wages are much less likely to offer health insurance benefits, refugees take a veryselective share of the low wage jobs available. This may be viewed in two ways. First, one mayconclude that the refugee impact, to the degree that there is one, is on an even smaller sector ofthe labor market. Or, one may conclude that in that smaller area, the impact must be evenstronger. Disentangling this puzzle would require far more data than is currently available.
6. An Accounting of the Fiscal Benefits and Costs
6.1 Composite Household
To predict the costs of future waves of refugees, I use the average characteristics of all refugeeshouseholds arriving between 1990 and 1999 to define the typical or composite household.Naturally, as refugees come their families or households differ in many ways. Some may haveone adult while others have three or 4 adults and several children. Finding the exact cost foreach family type would be cumbersome. Because the purpose is to predict future costs, andbecause
Table 9: Means and Descriptive Statistics for Composite Refugee Household
Variable Mean Std.Dev. Min Max
Tenure in U.S. (In Years) 4.80 3.07 0.68 11.52Household Size 3.23 2.22 0 19Number of Children 1.27 1.67 0 15Number of Adults 1.95 1.07 0 8Age of Householder 29.72 14.22 0.09 89.84Householder > 60 years ofAge
0.05 0.21 0 1
HouseholderMarried
0.53 0.50 0 1
From Bosnian 0.47 0.50 0 1From USSR 0.26 0.44 0 1From Vietnam 0.22 0.41 0 1From Eastern Europe 0.02 0.13 0 1From Africa 0.02 0.13 0 1From Cuba 0.01 0.09 0 1N= 1415 householdsSource: Calculations based on data from the Mohawk Valley Resource Center for Refugees.
we have no information on the characteristics of future refugees, our best guess is that futurehouseholds will be, on average, similar to the refugees who arrived from 1990 to 1999.
The data on refugees come from the Mohawk Valley Resource Center for Refugees. The dataset includes limited information on most refugees who arrived in Utica between 1989 and 1999,and who did not move out of the area. Altogether there are 1415 households in the sample and4567 individuals. A household is defined as all people living together at a particular address or

27
dwelling. The average tenure in the U.S. of those in the data is about 4.8 years. Table 9displays the mean characteristics of the households in the data.
The composite household has 3.22 people, including 1.27 kids and 1.95 adults. The average ageof the adults in the household is less than 30 years of age, while the average age of the childrenin the household is 9.2 years of age. Only 4 percent of the households are headed by an elderlyperson and only 3.7 percent of all refugees who arrive are greater than 65 years of age. Aboutone-half of the adult householders are married. Finally, the composite household is 48 percentBosnian, 26 percent Russian (former Soviet Union), and 21 percent Vietnamese.
6.2 The Refugee Center
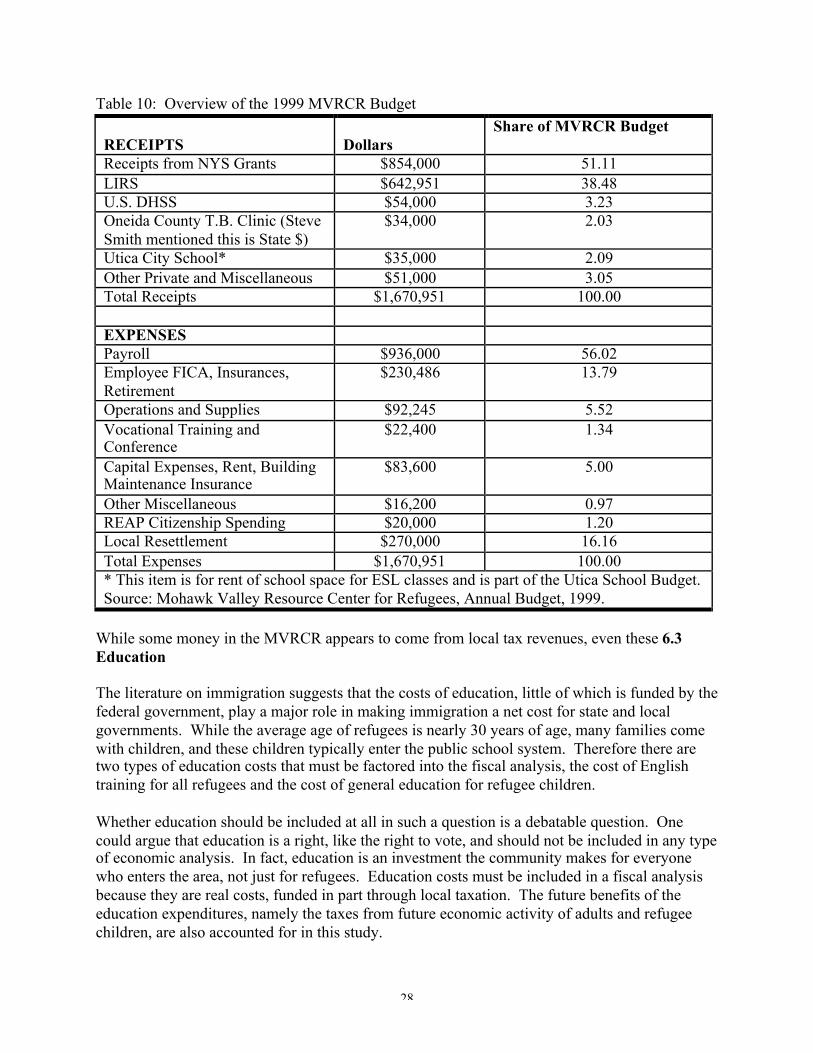
The Mohawk Valley Resource Center for Refugees is an affiliate of the Lutheran Immigrationand Refugee Service (LIRS). Given its nearly $1.7 million budget (1999), one may ask whetherthe operation of the refugee center itself is a cost to the community. Certainly newspaper articlesin the Observer Dispatch have suggested that County tax dollars help support the refugeecenter’s operations. In fact, the operation of the refugee center, apart from the flow of refugeewho come because of it, is more likely to be a benefit than a cost to the community.
The MVRCR operates largely on private donations from outside the Mohawk Valley and frompublic and private grants. The primary funding comes from two sources, the LIRS and StateGrants which transfer competitive state and federal funds to the refugee center. The LIRSadministers funding from the Office of Refugee Resettlement (ORR) for all the localresettlement costs of refugees, $270,000 in 1999, and an additional $370,000 for operations.Resettlement costs include the first month’s rent on an apartment, furniture, food, hygiene kits,and a small amount of cash intended to get the families through the first couple of weeks inUtica. Money from the LIRS funds 38 percent of the MVRCR expenses.
A majority of the New York State grants, which finance over one-half the expenses of therefugee center, are federal dollars. More than 50% of the state funding comes from the U.S. statedepartment budget. Another $250,000 or 30 percent of the NY funding, comes from federalblock grants for targeted assistance. This funding is distributed based on the percentage ofrefugees in the county population. These federal monies are allocated to the 30 counties in theU.S. with the greatest percent of new refugee arrivals in the last three years. The money isavailable strictly for employment services.
revenues come originally from state and federal revenues. Roughly 2 percent of the MVRCRbudget comes from the Oneida County Health Department to fund translators for the county’stuberculosis clinic. However, this money comes from the State of New York HealthDepartment from monies which they receive from the federal government’s Center for DiseaseControl. Another 2 percent of the center’s budget comes from the Utica City School District forthe rent and janitorial expenses of the classroom space used by the school district for ESLtraining. Again, this particular funding come from New York State Employment PreparationEducation grants to the Utica School District. In both cases, what appear to be costs to localtaxpayers turn out to be dollars flowing into Oneida County from the outside.
28
Table 10: Overview of the 1999 MVRCR Budget
RECEIPTS DollarsShare of MVRCR Budget
Receipts from NYS Grants $854,000 51.11LIRS $642,951 38.48U.S. DHSS $54,000 3.23Oneida County T.B. Clinic (SteveSmith mentioned this is State $)
$34,000 2.03
Utica City School* $35,000 2.09Other Private and Miscellaneous $51,000 3.05Total Receipts $1,670,951 100.00
EXPENSESPayroll $936,000 56.02Employee FICA, Insurances,Retirement
$230,486 13.79
Operations and Supplies $92,245 5.52Vocational Training andConference
$22,400 1.34
Capital Expenses, Rent, BuildingMaintenance Insurance
$83,600 5.00
Other Miscellaneous $16,200 0.97REAP Citizenship Spending $20,000 1.20Local Resettlement $270,000 16.16Total Expenses $1,670,951 100.00* This item is for rent of school space for ESL classes and is part of the Utica School Budget.Source: Mohawk Valley Resource Center for Refugees, Annual Budget, 1999.
While some money in the MVRCR appears to come from local tax revenues, even these 6.3Education
The literature on immigration suggests that the costs of education, little of which is funded by thefederal government, play a major role in making immigration a net cost for state and localgovernments. While the average age of refugees is nearly 30 years of age, many families comewith children, and these children typically enter the public school system. Therefore there aretwo types of education costs that must be factored into the fiscal analysis, the cost of Englishtraining for all refugees and the cost of general education for refugee children.
Whether education should be included at all in such a question is a debatable question. Onecould argue that education is a right, like the right to vote, and should not be included in any typeof economic analysis. In fact, education is an investment the community makes for everyonewho enters the area, not just for refugees. Education costs must be included in a fiscal analysisbecause they are real costs, funded in part through local taxation. The future benefits of theeducation expenditures, namely the taxes from future economic activity of adults and refugeechildren, are also accounted for in this study.

29
I assume that all refugees needing education reside in the Utica school district. However, theUtica/Rome community does not bear the full cost of educating refugees and their children.State and federal dollars also fund local education. Because the goal of this study is to determinethe local fiscal impact, it is crucial to isolate those costs that are borne by local population. Forexample, according to data from the U.S. Department of Education, in 1999, 36.3 percent of theUtica City school district expenditures on education were paid through locally raised revenue,well below the national average for local contribution of 45.5 percent.
Typically, studies use the average per-pupil cost of education to estimate the cost of addingadditional students. With this method, doubling the number of students would double totaleducation costs, a concept that economists call constant returns to scale. I, however, find strongsupport for the argument that adding additional refugees to the school district increases costs byless than the per student average. Finding the marginal or additional cost of each student addedis also a difficult task because it would vary depending on whether the additional studentrequired the hiring of an additional teacher or the building of an additional classroom.
I use a modified average per-pupil cost that acknowledges that there are some costs which areunlikely to change when an additional student is added. It is unlikely, for example that addingadditional students will lead to the hiring of an additional superintendent, additional principals oradditional custodial or building maintenance staff. Furthermore, given the decreasing Uticapopulation, the refugee influx has not added significant strain on the number of classrooms orbuildings. Therefore, building and maintenance costs would be approximately the same whetherthe refugees came or not. A close review of the Utica School District 1999-2000 annual budgetreveals that only 69.5 percent of the expenditures were likely to be affected by the refugeepopulation. These expenditures included teachers’ salaries, transportation, special programs andabout 86 percent of employee benefits.
The adjusted per-pupil average cost is calculated by multiplying the 69.5 percent adjustmentfactor by the local share of total expenditures and dividing this number by the number of studentsenrolled. Using 1999 number, the total local share of school expenditures was $21.87 millionincluding local taxes receivable, payments in lieu of taxes, and taxes on consumer utility bills.Using the October 1999 enrollment of 8,319 students, the adjusted per-pupil local cost is $1827.
In addition to the per-pupil cost above, the special needs of refugees may require additionalexpenditures, possibly from local funds. Most if not all refugees require extra language training
due to low levels of proficiency with the English language, typically for a three year period7.The Utica school district currently provides English as a Second Language (ESL) assistance toapproximately 1000 students throughout the district, 90 percent of which are refugees. Suchtraining requires additional teaching staff, space, and materials which would not be purchased ifnot for the influx of refugees.
7 A 1999 memo to the Utica School Board by Betsy LaPorte, the ESL coordinator for theUtica school district, reports that 90 percent of Limited English Proficient students complete ESLinstruction within three years. The remaining finish in the fourth year.

30
In the 1998-1999 school year, the Utica School District spent an additional $1,467,648 oninstruction for students needing language training. Of this, only a small share is funded from thelocal tax dollars. After deducting Federal funds given through the Emergency ImmigrationEducation Program and Title 1 and the New York State funding from Part 154, local taxpayerspaid an additional $158,239 to provide ESL instruction for 882 students. The per pupil costscome to $179 per student per year above the general education costs described above.
Using our profile of the typical refugee family with 1.27 children and the age distribution of thearriving children, the average cost of one year of education for the composite refugee family is$2,548. Again this is the amount paid out of local taxes for the typical refugee household. Thesimulation result presented later in this report uses the actual age distribution for refugee childrenupon arrival in Utica to determine the number of years of schooling required for refugeechildren. As we will see, education is the single greatest current expense of the influx of refugeeinto the Mohawk Valley.
6.4 Public Assistance
Newly arriving refugees come with few belongings and no means of support. Therefore, for awhile they must depend on public assistance to meet their financial needs. The Refugee Centerworks with DSS to sign refugees up for TANF, Food stamps, medicaid, and any other aid forwhich they may qualify.
To the degree that local taxes pay for these programs, local taxpayers are picking up the bill forrefugee resettlement. (Of course significant numbers of refugees are also working and payingthe taxes supporting public assistance also. This will be accounted for in the discussion ofbenefits.)In New York, counties contribute about 25 percent of the benefit costs for TANF and Medicaid.Food stamp benefits and benefits through Supplemental Security Insurance, a program for theelderly and disabled, are paid for by the federal government. To the degree that local residentspay for food stamps and SSI, such costs would be the same for local residents no matter where in
the U.S. the refugees were located8. In addition to benefits, such programs carry significantadministrative costs; again, these costs are shared. Because the public assistance programswould be in place without refugees, the addition to administrative costs are likely to benegligible. This section explains the computation of public assistance costs.
To calculated public assistance costs, I estimated program participation equations usingadministrative data from the Oneida County Department of Social Services. Three separateprobit equations are estimated to predict the probability of participation in TANF, Medicaid, andFood Stamps. I estimate program participation as a function of tenure (time since arrival),
8 No data are available regarding SSI participation among refugees. Only 4 percent ofrefugees are elderly and most of these live with families. No data are available on the disabilitystatus of refugees. While food stamps and SSI are not locally funded, they may be relevant whendiscussing the benefits of refugee resettlement. This will be discussed below in section 7.

31
Table 11: Participation in Public Assistance Programs
Sample SizePercent Participating
TANF Medicaid FS
OVERALL 1415 9.5 35.9 14.4 Bosnia 663 10.4 32.9 8.9 F o r m e r S o v i e tUnion
368 12.5 52.4 26.3
Vietnam 311 5.8 27 13.8 Other 73 2.7 19.2 6.8
Less Than 4 Years 736 12.8 35.9 10.7 Bosnia 560 10.7 33.6 9.1 F o r m e r S o v i e tUnion
95 30.5 63.1 20
Vietnam 63 7.9 23.8 12.7 Other 18 0 5.5 5.5
More than 4 years 679 6 36.1 18.4 Bosnia 103 8.7 29.1 7.8 F o r m e r S o v i e tUnion
273 6.2 48.7 28.6
Vietnam 248 5.2 27.8 14.1 Other 55 3.6 23.6 7.3
Household size 1 to 2 people 619 6.3 27.9 14.7 2 to 4 people 490 9.6 39 14.1 5 to 6 people 190 12.1 44.7 14.7 More than 6people
74 24.3 50 13.5
Source: Oneida County Department of Social Services.
household size, and age of the householder. The estimated equation is then used to predict theprobability of participation for our composite household. The key variable in the equation istenure. As expected, the probability of participation in TANF and Medicaid decreases with time.Tenure does not have a statistically significant relationship to food stamp participation. The totalcost of TANF and Medicaid for the composite refugee household is assumed to be the product ofthe probability of participation in a year, the average number of months on TANF or Medicaidfor those who participate, and average monthly benefit for those who participate. Averagemonthly benefits were calculated from a small random and anonymous sample provide by theOneida DSS. Alternative approaches may have been to use the maximum grants available for aparticular family size or the average grant size for all participants. However, to the degree that

32
refugees are employed and earning income, benefits may be significantly less than the maximumgrant and may be different from the typical program participant.
Medicaid is clearly the most heavily used of the part-county financed programs. However, forthose households receiving Medicaid benefits, one cannot assume that the entire householdreceives the benefit. Nearly all refugees are placed in jobs providing health insurance for theemployee. In most cases, the refugee has the option to pay for family coverage although at asignificant cost. Therefore, many of the households receiving Medicaid receive benefits forthose not covered by the employer’s policy.
Table 12: Probit Estimates of Refugee Program Participation
TANF Medicaid Food StampsLog of months in U.S. -.3624
(-5.278)-.0895
(-1.809)-.0361
(-0.685)Household size .1119
5.707.0920
(5.863).0623
(3.867)Age of Householder inYears
-.0049-1.400
.0138(5.815)
.0137(5.545)
Constant -.2219(-0.777)
-.7384(-3.470)
-1.199(-5.287)
Observations 1415 1415 1415Log Likelihood Ratio,Chi2(3)
63.98 75.99 47.52
Log likelihood -413.550 -886.363 -755.324Pseudo R2 0.0718 0.0411 0.0305
As with education, program benefits are projected over time for the typical household and thenmultiplied by the typical cohort size to determine the local share of the total public assistancecosts. These costs are then discounted back to the present. One obvious problem with thisapproach is that family composition changes over time. In ten years, many of the refugeechildren will form their own households (which also have some probability of participating inpublic assistance programs) making the existing households smaller. At the same time, refugeehouseholds may have additional children, increasing household size. To avoid having to makeassumptions about fertility, family formation patterns and welfare use among yet to be formedhouseholds, I assume that the current composite household stays together for the next 50 years.
I am sure that some will think of other costs, some of which will be real costs to local taxpayers,some of which will not. For example public housing and public health costs such as the TBclinic through the Oneida County Health Department are services which benefit refugees and forwhich they do not pay. Yet neither involves city or county taxes. The maintenance andsubsidies for public housing are federal dollars which come through the Municipal HousingAuthority. The TB clinic mentioned above receives money from the state health departmentwhich again distributes federal monies. For these and any other perceived costs, it must beshown to use actual local tax revenues to be of significant cost to local taxpayers.

33
6.5 Fiscal Benefits
To qualify as a fiscal benefit, any perceived benefit must pass the same test as the costs; it mustresult in an increase in local tax revenues over that which would exist in the absence of therefugees. For example, increased sales (and therefore tax revenues) at one store, say one ownedby a refugee, is not a benefit if sales are reduced at another store in the tax jurisdiction.Similarly, employing an individual (who would then pay taxes on local consumption) cannot becounted as a benefit if that individual would be employed somewhere else. In both cases,however, if the spending in the area increases, then they would qualify as true benefits.
Unfortunately, benefits are harder to quantify than costs. We know that children go to schooland the rate of participation in public assistance programs. Nonetheless, there are some clearand some potential benefits to resettling the refugee population in Utica. For example, to thedegree that the refugees increase total taxable consumption in the area, sales taxes revenuesincrease, lessening the burden on native taxpayers. Refugees also buy houses and pay propertytaxes. This section describes the fiscal benefits to the community and lays out the assumptionsand rationales for these benefits.
Earnings
Of course, one of the key determinants of the economic contribution of refugees to the localfiscal picture is the degree to which refugees participate in the labor markets. Refugee earningsare not a direct benefit to the community, but assumptions on earnings are necessary todetermine the degree to which the refugees benefit the local economy. Ideally, such data wouldbe available from a large cross-section of refugees who have been in Utica for varying periods oftime or a panel data which follows the same refugee households over time. With such data wecould observe employment rates and average wages as a function of tenure in the U.S.Unfortunately, little direct information is available regarding the employment and wage pictureof the refugees.
We know most about the employment situation of refugees when they first begin working. Afterseveral months of English as a Second Language training, all working age adults must enter thelabor market and must accept any job that comes their way. The employment office at theMVRCR works hard to place the refugees with employers offering health benefits (notnecessarily paid by the employer) and in jobs with possibilities of advancement, a tough standardconsidering the language barriers the refugees must still overcome. Unfortunately, many of thejobs offer little possibility of advancement.
Using data provided by the refugee center, I can identify the first employment situation,including their hourly wage and job title. Typically, refugees retain the first job, at least throughthe first year during which the refugee center remains in relatively close contact. After the firstyear, very little is known about the labor supply of refugees. We must, therefore, develop wageprofiles based on indirect information such as job titles and public assistance participation. Forexample, knowing that roughly 35 percent of households participate in Medicaid tells us that themedian household income is above the poverty line, the cutoff for Medicaid.

34
Other recent research about a small subset of local refugees also gives clues. Coughlan andOwens-Manley conducted interviews with two groups of successful refugees, those who havegained citizenship and those who have purchased housing. Although this research samples thosewho have been most successful, the research demonstrates that some refugees are finding higherpaying jobs. For example, they interview refugees who work as a paralegal, a city planner, anaccountant, a part-time teacher at SUNY/IT, an educational coordinator, a realtor, and acomputer programmer. These positions pay between $21,000 - $40,000 per year.
The Coughlan and Owens-Manley research does not demonstrate the typical earnings path, but itdoes demonstrate that many refugees do relatively well in local labor markets. Instead, thesimulations below use the typical wages from the jobs data provided by the MVRCR. It shouldbe emphasized that the jobs database contains information only on the first job that each refugeetakes, or in some instances a second job if people switch jobs during the first year. In 1999, theaverage starting pays was $6.40, while in 2000 (January through April) starting wages averaged$7.18. Therefore, we assume that the starting wage of our composite individual is $7.18 in year1 which translates to an annual income of $14,360. Following the previous literature onimmigrants, I assume that wages will increase by three percent per year (in real terms).
Household income depends not only on the wage rate but on the number of workers and thenumber of hours worked. The number of potential workers for this study is1.95, the number ofadults in our composite refugee household. Coughlan and Owens-Manley find that a highpercentage of families with two adults have both adults working, typically full time. Initially,nearly all adult refugees work full time, and many work more than one job. Long term, less isknown.
Given little is known, I make assumptions as to the employment rate and hours worked for thefirst adult and the remaining .95 adults in the composite household. The simulation assumes anemployment rate of 95 percent for the first adult in the household. We know that about ninepercent of the refugee households receive TANF and data on a sample of those on TANFsuggests that roughly one-half of those on TANF are also employed. The remaining five percentare unemployed. I assume an employment rate of .80 for the remaining adult (actually .95 of anadult). All workers are assumed to work 40 hours per week. At this rate, our compositehouseholds are predicted to earn an average of $26,000 per year.
Sales Taxes
The most direct fiscal benefit of refugee resettlement is the tax revenue the county and citycollects on taxable consumption. In Oneida county, food, and medications are exempt from localsales taxes. Therefore, refugees pay sales taxes on the portion of their incomes spent on itemsother than housing, food and health care. Nationally, low-income households spentapproximately 20% of their budget on food. In addition, of the 65 percent of households not onmedicaid, the typical health insurance contributions are an estimated $1500 per year. Inaddition, housing expenditures for the typical household of 3.22 people is estimated to be thecost of a two-bedroom apartment in Utica, $335 per month or $4020 annually. Given the localshare of sales taxes is 2 percent, sales taxes from a single refugee household are calculated usingthe following formula: Sales Tax = [ 80 percent of Earnings - $1500 - $4020] x 2 percent.
35
Property Taxes
Over the last five years, hundreds of refugees have purchased houses, mostly within Utica.Many of theses houses were off the tax rolls or in danger of falling off. The refugees alsoimprove the houses they buy, raising not only their own property values but also the value of theentire housing stock.
Predicting future benefits depends not only on the number of houses already purchased, but onthe future demand. The most accurate data available concerns homes purchased by Bosnianrefugees in Utica. As of October 1999, 217 Bosnian refugee households had purchased housesin Utica, roughly one-third of all Bosnian households. Since October, Bosnian families havecontinued to buy houses at a rapid rate, boosting unofficial estimates to roughly 300 homepurchases. If no other refugees had purchased houses, this would mean that 20 percent of the1415 refugee families in our database had purchased houses. There is plenty of anecdotalevidence that other refugees are buying houses, although the Bosnian refugees may be buying ata higher rate.
The net fiscal benefit simulations for refugee households, including future households fromunknown countries of origin, use relatively modest estimates of home ownership. I assume thatthe probability that a composite refugee buys a house in Utica is zero for the first three years. Inyear four the probability of owning a house jumps to .20 and increases by .02 annually until itreaches a maximum of .60 in year 24. The probability remains at 0.60 for the rest of thehousehold’s lifetime.
The children of refugees may also purchase houses. The stream of children’s home purchases ismore complex due to the age distribution, years of education, probability of renting and theprobability that they leave the area. After all these assumption are made, the simulations assumethat it takes 20 years for home ownership among children to reach 40 percent. Given rates ofexodus, home ownership among children is maxed at 50 percent rather than the 60 percent forthe adults. I assume a typical annual property tax of $2000 per house owned. Given theseassumptions, the composite refugee household pays an annual property tax of $650 in year five.
Those not living in owner-occupied housing either live in private apartments or in publichousing. It is reasonable to assume that those in privately owned apartments share a portion ofthe rent paid by the landlords. Certainly, if 1,000 refugee households who rent were to leaveUtica tomorrow, tax collections on these properties would be affected, particularly because thenative population is also leaving the area. The simulations attribute a 20 percent share of theproperty taxes on rental units to the refugee renters.
The total property tax paid by the composite household is the sum of the owner-occupied andrenter’s share of property tax. Total property tax revenues from the original family unit start at$340 per household in year one and reach $1000 per household in year 14. The children’sproperty tax in year 14 adds another $156 to the original household’s annual property taxcontributions.
36
Increased Property Values
Whereas adding one refugee household to the pool of home buyers may not affect housing pricesin Utica, adding a large number of households each year will. Refugees represent the fastest(and perhaps, only) growing segment of the local population of home buying age. Not only dorefugees buy houses, they affect the property values of other home owners. Utica’s housingmarket has suffered many years of population decline, migration to the suburbs, and increasinginner city poverty rates. Combined, these factors have had adverse effects on property values inthe city. Anecdotes abound as to the positive effect that refugees home purchases are having onthe community. Dilapidated homes are being renovated, and once failing neighborhoods arebeing beautified. Yet, placing a value on the impact of such changes on property values is animprecise exercise.
Using the Utica City School Board budget, I estimate the total value of taxable property to be$1.13 billion. The estimate is based on collections of $19.1 million with a school tax rate of16.37 per thousand. I speculate that property values are 1 percent higher in Utica due to the flowof refugees into the area. In some neighborhoods the impact may be much higher while in othersthe refugee effect may be negligible. The willingness of refugees to buy inner city homes mayincrease demand for houses outside of the Utica City School District. The simulations assumethere is no effect on housing values outside of Utica.
Tax Leakages on Public Assistance
Refugees bring with them an array of outside monies from sources such as food stamps, SSI, andOn-the-Job Training grants. While spending on these programs cannot be counted as benefits tothe community (they are consumed by the refugees), there may be local tax leakages from theadditional spending. The simulation adds up the estimated benefits from the primary transferprograms and assumes that 80 percent is spent on taxable consumption which is taxed at a 2percent rate. The result is a small annual benefit in the range of $10-15 per household.
The Refugee Center
The refugee center itself contributes to the fiscal health of the community. It employsapproximately 40 people, adding to total employment in the area. The simulation counts taxleakages from MVRCR payroll spending as benefit to the community.
How Many Would Have Left?
The million dollar question, perhaps literally, is what would have happened if the refugees hadnot come to Utica. Would more or fewer people have left? Would wages be higher or lower?Would there be fewer business? These are central, not peripheral questions. Yet answering anyof these questions precisely would be impossible. I simply point out that the simulationspresented below are intended to add information to the decision-maker’s pool of knowledge. It isalways the reader’s prerogative to add information where crucial items have been omitted.

37
For example, perhaps the flow of refugees has encouraged one employer of 100 people to remainin the area. Holding on to that one employer saves local taxpayers money that would have goneto TANF, Home Relief, or making up for lost property taxes. A firm of 100 people paying anaverage of $25,000 per year would add nearly $1.6 million in spending on taxable items resultingin sales taxes of $31,168. In addition, property taxes on the business and perhaps lost propertytaxes on other real estate would add to the loss. Adding in this type of savings, say $65,000 peryear for this one business establishment, would result in greater benefits than the simulationsshow.
7. Simulation Results
he ultimate question concerns whether refugees are a net fiscal benefit or net fiscal cost to thenatives of the Mohawk Valley. This study finds the resettlement of refugees in Utica to besimilar to any major investment; refugees are a net cost in the early years and then yield benefitsfor many years to come. In the long run, the MVRCR’s efforts to resettle refugees in Utica,quite apart from any non-fiscal benefits, is a net fiscal benefit to the community. To reach thisconclusion, I simulate the benefits and costs over time for the composite household. Because therefugees come in large numbers each year, I also simulate what I would call a typical year, a yearin which 750 refugees arrive. Using our composite household of 3.22 people, this equates to 233households. Finally, because such cohorts arrive each year, I simulate overlapping waves of 233households per year. The results are presented below in Table 13.
Table 13 presents results for each of the three simulations. For each, I present a stream of 50years of predicted net benefit. Benefits are adjusted for inflation and expressed in discounted orpresent value terms. The discounting reflects the reality that any money invested in refugeeresettlement could have been invested otherwise. For example, given the choice and assumingzero inflation, most people would rather have $10,000 today than $10,000 ten years from now.If given $10,000 today, it could be invested and be worth far more than $10,000 in ten years.Therefore, I discount all future benefits and costs to present value terms.
The single household results simulate the net benefits for the composite household. Thehousehold is assumed to stay in Oneida County and results are projected out 50 years. In theearly years, the household is a net cost to the community, although the net cost diminishes eachyear. The cost diminishes over time for a number of reasons. First, public assistanceparticipation declines slightly over time. Second, the number of refugee children in schooldeclines as the older children graduate. This becomes stronger over time as initially youngerrefugees enter school as the older children leave school. Rising wages and increased probabilityof home ownership also lead to smaller net costs over time. Annual net benefits become positivefor the individual household in the thirteenth year. The cumulative discounted benefits remainnegative for the first 30 years.
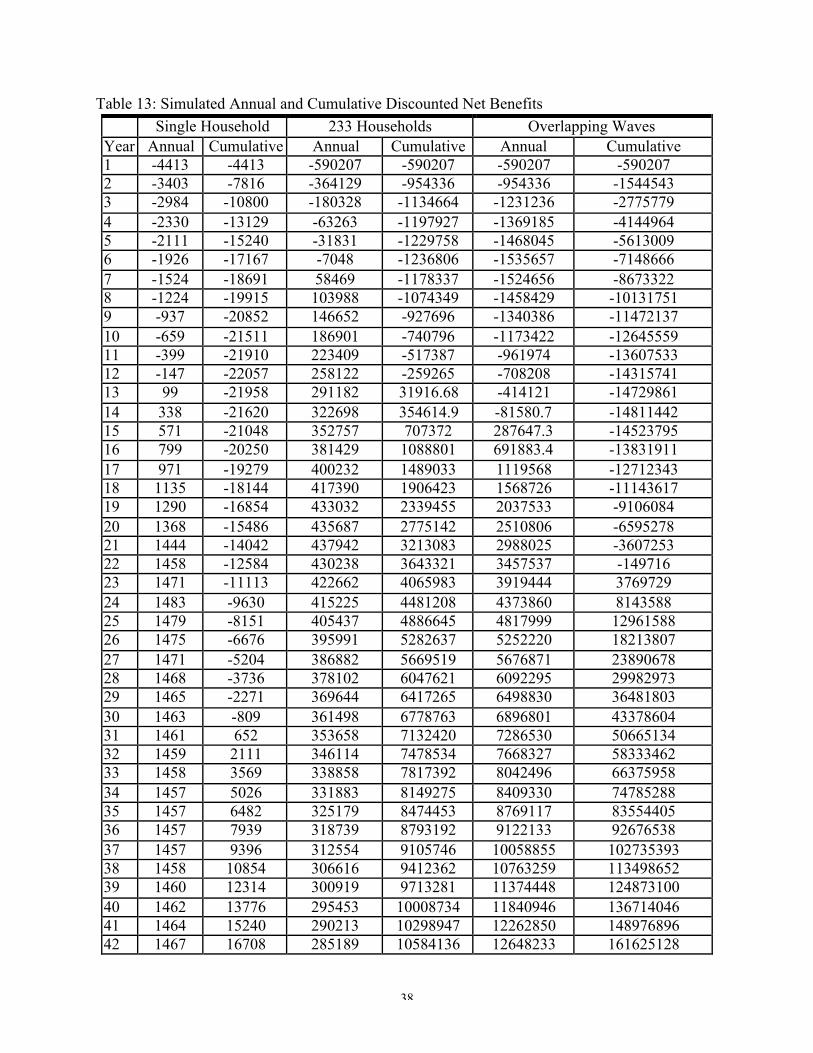
38
Table 13: Simulated Annual and Cumulative Discounted Net Benefits
Single Household 233 Households Overlapping WavesYear Annual Cumulative Annual Cumulative Annual Cumulative1 -4413 -4413 -590207 -590207 -590207 -5902072 -3403 -7816 -364129 -954336 -954336 -15445433 -2984 -10800 -180328 -1134664 -1231236 -27757794 -2330 -13129 -63263 -1197927 -1369185 -41449645 -2111 -15240 -31831 -1229758 -1468045 -56130096 -1926 -17167 -7048 -1236806 -1535657 -71486667 -1524 -18691 58469 -1178337 -1524656 -86733228 -1224 -19915 103988 -1074349 -1458429 -101317519 -937 -20852 146652 -927696 -1340386 -1147213710 -659 -21511 186901 -740796 -1173422 -1264555911 -399 -21910 223409 -517387 -961974 -1360753312 -147 -22057 258122 -259265 -708208 -1431574113 99 -21958 291182 31916.68 -414121 -1472986114 338 -21620 322698 354614.9 -81580.7 -1481144215 571 -21048 352757 707372 287647.3 -1452379516 799 -20250 381429 1088801 691883.4 -1383191117 971 -19279 400232 1489033 1119568 -1271234318 1135 -18144 417390 1906423 1568726 -1114361719 1290 -16854 433032 2339455 2037533 -910608420 1368 -15486 435687 2775142 2510806 -659527821 1444 -14042 437942 3213083 2988025 -360725322 1458 -12584 430238 3643321 3457537 -14971623 1471 -11113 422662 4065983 3919444 376972924 1483 -9630 415225 4481208 4373860 814358825 1479 -8151 405437 4886645 4817999 1296158826 1475 -6676 395991 5282637 5252220 1821380727 1471 -5204 386882 5669519 5676871 2389067828 1468 -3736 378102 6047621 6092295 2998297329 1465 -2271 369644 6417265 6498830 3648180330 1463 -809 361498 6778763 6896801 4337860431 1461 652 353658 7132420 7286530 5066513432 1459 2111 346114 7478534 7668327 5833346233 1458 3569 338858 7817392 8042496 6637595834 1457 5026 331883 8149275 8409330 7478528835 1457 6482 325179 8474453 8769117 8355440536 1457 7939 318739 8793192 9122133 9267653837 1457 9396 312554 9105746 10058855 10273539338 1458 10854 306616 9412362 10763259 11349865239 1460 12314 300919 9713281 11374448 12487310040 1462 13776 295453 10008734 11840946 13671404641 1464 15240 290213 10298947 12262850 14897689642 1467 16708 285189 10584136 12648233 161625128

39
43 1471 18178 280376 10864512 12949953 17457508144 1475 19653 275767 11140279 13191612 18776669345 1479 21132 271354 11411632 13376829 20114352246 1484 22616 267131 11678764 13508701 21465222347 1489 24105 263093 11941856 13591859 22824408148 1495 25601 259232 12201089 13628659 24187274049 1502 27102 255544 12456632 13621281 25549402150 1509 28611 252021 12708653 13571769 269065790Source: Author’s calculations.
The single household simulations do not take into account the fiscal benefit of the MVRCR orthe effect of the refugee influx on property tax collections. These two effects require largenumbers to come into play. If I convert property tax revenue increases and increased sales taxesdue to the refugee center into per household terms, then an individual household becomes anannual net contributor to the fiscal picture in year 7 and becomes a cumulative contributor in thetwelfth year in the Utica area.
The second set of simulations accounts for the fact that in a typical year we can expect upwardsof 750 refugees to arrive. Using 750 people, there are 233 composite households in the typicalyear. These full cohort simulations now incorporate the property value effects and factor in thebenefits of the refugee center itself. Furthermore, the assumption that the household stays inUtica is now relaxed by allowing 15 percent of refugees to leave the area after the first two years.As with the single household simulations, 80 percent of the children are expected to stay in thearea.
The annual net benefit for a full cohort is negative for the first six years and positive every yearafterwards. Again, the education and public assistance costs overwhelm benefits in the earlyyears. After six years, the annual benefits become stronger than the annual costs. This does notimply that the costs of such factors as Medicaid and TANF are reduced to zero. These costsremain, although they do diminish somewhat over time. Rather, other positive benefits due toincreased participation in labor and real estate markets now become stronger than the negatives.After 13 years, the cumulative net benefit becomes positive and continues to increase for everyyear after. The final two columns of Table 13 report simulation results for overlapping waves of refugees,such that 233 households arrive every year. These simulations probably best depict Utica’sreality. In this case, the period of negative net annual benefits is longer than for the single cohortbecause the largest costs come in the early years. In this simulation the cumulative benefit isnegative for 22 years and becomes positive in year 23. This suggests that after 23 of operation,the total effect of a continual flow of 233 refugee households per year will be and will remainpositive.

40
8. Sensitivity Analysis
The results in any analysis are based on a combination of observed data and a set assumptionsmade by the researcher. Some assumptions must be made to capture the best guess as to presentand future conditions and simplify analysis. For example, I assume that future cohorts ofrefugees will be similar to the composite household, the average of all past waves of refugees.Of course, not a single cohort will look exactly like the composite, but it is my best guess as tothe typical characteristics of future refugees.
Given that the simulations make use of a long list of assumptions, the results are likely to beaffected by the reasonableness of such assumptions. If it is more reasonable to assume thatfuture waves of refugees will look more like the refugees of the past 5 years rather than thosearriving more than five years ago, then the assumption is open to criticism. One way ofdetermining the degree to which assumptions affect the final results is to run the analysis undervarious assumptions. If the final results don’t change when we change an assumption, say byusing the characteristics of recent arrivals, then we have determine that the results not sensitiveto that particular assumption.
The major assumptions for this study are listed in Appendix 1, and some may be morecontentious than others. Some of the major assumptions concern the rate of wage increases, thedegree of labor market participation, the stability of patterns of public assistance usage, thepropensity to move outside the area, the impact on local real estate prices, and the appropriaterate of discounting of future benefits and costs.I conduct sensitivity analyses on three types of assumptions: the social discount rate, the rate offuture wage increases, and the impact of refugees on local real estate markets.
The discount rate is a key parameter in any analysis. Determining the discount rate is akin toasking how much society values receiving a sum of money, say $100, at some time in the future.If the current value is less than the $100, then some mechanism must be put in place to discountfuture benefits and costs. I run the simulations at three alternative values (three, four, and fivepercent) that roughly define the range considered reasonable in the benefit-cost literature. Theresults are relatively robust to a change in the discount rate. Lowering discount rate to threepercent shifts the first year of positive net benefits to year 15 rather than year 13. Increasing thediscount rate to five percent has no effect on the break-even year, but reduces the estimated long-term benefits.
Results are quite sensitive to the effect on local housing prices. I assume a 1 percent increase inhousing prices after the 3rd year of residence. This is a cumulative effect and is assumed to befixed over time. Removing the price effect reduces the most significant benefit of the refugeeinflux. As opposed to a single cohort breaking even in 7 years, with no real estate effect it takes13 years to break even. When I apply this to a model overlapping cohort it takes 35 years toreach the first positive net-benefit year. Cumulatively it would take much longer to break even.In a market with higher housing prices or a smaller share of low-priced housing we would beunlikely to see the positive effects of refugee immigration.
41
Finally, I reran the model with a variety of assumptions on wage growth and labor forceparticipation. Given the “best guess” model assumes real (above inflation) wage growth rates of4 percent for the main earner and 3 percent for the second (partial) earner. To determine thesensitivity of the results to the wage growth assumptions, I also try wage growth rates of zeroand six percent. As expected, slowing the wage growth rate to zero increases the break-evenyear, extending it from 13 to 15 years. Increasing the wage growth rate steepens the net-benefitprofile, but does not change the break-even year. The relatively small effect of these changessuggest that small changes in the wage growth rate will have little effect on the overall resultspresented in the report.
9. Concluding Remarks
For 25 years, the Mohawk Valley Resource Center for Refugees has been welcoming refugees toUtica. The refugees come with few possessions and with little, if any, preparation for the lifethat awaits them in central New York. Yet this humanitarian effort also involves the entirecommunity as these refugees become users of publicly funded services and contributors to thepayment of those services. This report attempts to do what no previous research has done,determine whether refugees ultimately contribute more than they take out of local tax payments.
While the returns are slow and modest in magnitude, this research finds refugees to be netcontributors. The initial costs which local taxpayers fund are significant and include costs foreducation and public assistance. In the first year in Utica, education costs make up 40%,Medicaid 26%, and TANF 34 % of the total taxpayers costs for refugee households. Over time,the TANF costs drop quickly, children move out of the school systems, and Medicaid usagedrops although not as quickly as some might hope. At the same time, their participation in labormarkets (and therefore consumption of local goods) and real estate markets leads to growingbenefits for the community. Simulations which add together all the identified and quantifiablefiscal costs and benefits finds that refugees ultimately give more to the community than they takeaway.
If the simulations are accurate, the fact that the refugee center has been operating for 25 yearssuggests that we have recently reached the point where cumulative fiscal benefit of the influx ofrefugees positive. While new waves of refugees bring new costs, the net annual and cumulativebenefits will remain positive from now on.

42
Figure 1: Component of Population Change, Utica-Rome MSA
-10000
-8000
-6000
-4000
-2000
0
2000
4000
6000
1991 1992 1993 1994 1995 1996 1997 1998 1999
Year
Num
ber
of P
eopl
e
Total Change Births Deaths Net Intl Migration Net Domestic Migration
Figure 2: Number of Employees by Industry
0
5
1 0
1 5
2 0
2 5
3 0
3 5
4 0
4 5
Y e a r
m a n u f t r an s/u t i l t r a d e ins/real es s e r v i c e s tot govt

43
Figure 3: Unemployment and Unemployment Rate: Utica-Rome SMA
0
2
4
6
8
10
12
14
1977 1978 1979 1980 1981 1982 1983 1984 1985 1986 1987 1988 1989 1990 1991 1992 1993 1994 1995 1996 1997 1998
Unemployed Unemployment Rate

44
Figure 4: Annual Net Cost For a Single Household that Stays
- 5 0 0 0
- 4 0 0 0
- 3 0 0 0
- 2 0 0 0
- 1 0 0 0
0
1 0 0 0
2 0 0 0
Years in Utica
Figure 5: Discounted Annual Benefits for Overlapping Cohorts: Alternative Discount Rates
-2000000
0
2000000
4000000
6000000
8000000
10000000
d i s coun t=3 d i s coun t=4 d i s coun t=5

45
References
Frank Bean et al. (1997). “Public Assistance Use by Immigrants: What can the U.S. Census tellus?,” FOCUS, University of Wisconsin-Madison, Institute for Research on Poverty, Volume 18,Number 2, 41-46.
Borjas, George, (1994). “The Economics of Immigration,” Journal of Economic Literature, 32,1667-717.
Borjas, George, (1995). “The Economic Benefits from Immigration,” Journal of EconomicPerspectives, Volume 9, Number 2, 3-22.
Borjas, George and Lynette Hilton, (1996)."Immigration and the Welfare State: ImmigrantParticipation in Means-Tested Entitlement Programs," Quarterly Journal of Economics, Volume111, Number 2, 575-604.
Card, David and John DiNardo, (2000). “Do Immigrant Inflows Lead to Native Outflows?,”National Bureau of Economic Research, NBER Working Paper 7578.
Espenshade, Thomas, Michael Fix, Wendy Zimmerman and Thomas Corbett (1997),“Immigration and Social Policy: New Interest in and Old Issue,” FOCUS, University ofWisconsin-Madison, Institute for Research on Poverty, Volume 18, Number 2, 1-10.
Fix, Michael and Jim Passel (1994). Immigration and Immigrants: Setting the Record Straight.Washington D.C.: The Urban Institute.
Fix, Michael and Wendy Zimmerman (1995). “Immigrant Families and Public Policy: ADeepening Divide,” Immigrant Policy Program. Washington, D.C.: The Urban Institute.
Frey, William (1997). FOCUS, University of Wisconsin-Madison, Institute for Research onPoverty, Volume 18, Number 2..
Friedberg, Rachel and Jennifer Hunt (1995) “The Impact of Immigration on Host CountryWages, Employment, and Growth,” Journal of Economic Perspectives, Volume 9, Number 2,23-44.
Greenwood, Michael and Gary Hunt (1995). “Economic Effects of Immigrants on Native andForeign-Born Workers: Complementarity, Substitutability, and Other Channels of Influence,”Southern-Economic-Journal;61(4), 1076-97..
Lee, Ronald and Timothy Miller, (2000). Immigration, Social Security, and Broader FiscalImpacts” Unpublished Manuscript, Berkeley University.
Moore, Stephen, (1998). “A Fiscal Portrait of the Newest Americans.” National ImmigrationForum and the Cato Institute.

46
Passel, Jeffrey S. and Rebecca L. Clark (1998). “Immigrants in New York: Their Legal Status,Incomes, and Taxes,” Urban Institute, Washington, D.C..
Potacky, Miriam, (1997). “Predictors of Refugee Economic Status: A Replication,” Journal ofSocial Service Research, Volume 23, Number 1, 41-70.
Potacky-Tripodi, Miriam (1999). “Micro and Macro Determinants of Refugee EconomicStatus,” Unpublished Manuscript, Florida International University.
Smith and Edmonston (1997). The New Americans: Economic, Demographic, and Fiscal Effectsof Immigration. Washington, D.C.: National Academy Press.
Wilson, Franklin and Gerald Jaynes, (1997). “Immigration and Labor Market Outcomes forNative Workers,” FOCUS, University of Wisconsin-Madison, Institute for Research on Poverty,Volume 18, Number 2, 30-34.