In Situ Defect Detection Using Three Color Spectroscopy in ...
15
Wright State University Wright State University CORE Scholar CORE Scholar The University Honors Program Academic Affairs 4-26-2018 In Situ Defect Detection Using Three Color Spectroscopy in Laser In Situ Defect Detection Using Three Color Spectroscopy in Laser Powder Bed Additive Manufacturing Powder Bed Additive Manufacturing Andrew Drieling Wright State University - Main Campus Follow this and additional works at: https://corescholar.libraries.wright.edu/honors Part of the Engineering Science and Materials Commons, and the Mechanical Engineering Commons Repository Citation Repository Citation Drieling, A. (2018). In Situ Defect Detection Using Three Color Spectroscopy in Laser Powder Bed Additive Manufacturing. Wright State University, Dayton, Ohio. This Thesis is brought to you for free and open access by the Academic Affairs at CORE Scholar. It has been accepted for inclusion in The University Honors Program by an authorized administrator of CORE Scholar. For more information, please contact [email protected].
Transcript of In Situ Defect Detection Using Three Color Spectroscopy in ...

Wright State University Wright State University
CORE Scholar CORE Scholar
The University Honors Program Academic Affairs
4-26-2018
In Situ Defect Detection Using Three Color Spectroscopy in Laser In Situ Defect Detection Using Three Color Spectroscopy in Laser
Powder Bed Additive Manufacturing Powder Bed Additive Manufacturing
Andrew Drieling Wright State University - Main Campus
Follow this and additional works at: https://corescholar.libraries.wright.edu/honors
Part of the Engineering Science and Materials Commons, and the Mechanical Engineering Commons
Repository Citation Repository Citation Drieling, A. (2018). In Situ Defect Detection Using Three Color Spectroscopy in Laser Powder Bed Additive Manufacturing. Wright State University, Dayton, Ohio.
This Thesis is brought to you for free and open access by the Academic Affairs at CORE Scholar. It has been accepted for inclusion in The University Honors Program by an authorized administrator of CORE Scholar. For more information, please contact [email protected].

In Situ Defect Detection Using Three
Color Spectroscopy in Laser Powder
Bed Additive Manufacturing
By
Andrew Drieling

Abstract
Additive Manufacturing (AM) provides a way to create parts that would be extremely difficult or
impossible with conventional manufacturing processes. However, AM also introduces defects,
which are detrimental to the mechanical performance. These defects are potentially unknown
until post-processing inspection and testing, wasting time and resources on an unusable part or
initiating unexpected failure. Historically, spectroscopy has successfully been used for in situ
monitoring of laser welding, using changing parameters in the generated plume to predict
defects. In situ monitoring using a visible spectrometer for fabrication of Alloy 718 on a test bed
laser powder bed fusion system is performed. AM defects, such as keyhole porosity and unfused
powder, are detected in the sensor output and a physics-based modeling approach is used to
predict defect occurrence. Spectroscopy can provide near real-time monitoring, allowing defects
to be predicted, and potentially corrected before the completion of the part, saving time and
resources.

Contents 1. Additive Manufacturing .......................................................................................................... 5
2. Laser Powder Bed Fusion ........................................................................................................ 6
3. Defects in Laser Powder Bed Additive Manufacturing ........................................................... 6
4. Spectroscopy in General .......................................................................................................... 7
5. Defects in Laser Welding ........................................................................................................ 8
6. Monitoring and Closed Loop Control ..................................................................................... 8
7. Motivation ............................................................................................................................... 9
8. AM System .............................................................................................................................. 9
9. Experiment Set-up ................................................................................................................. 10
10. Data Processing .................................................................................................................. 10
11. Results ................................................................................................................................ 10
12. Conclusions ........................................................................................................................ 12
13. Future Work ....................................................................................................................... 13
14. Works Cited ....................................................................................................................... 14

Table of Figures Figure 1: Diagram of laser powder bed fusion system ................................................................... 6 Figure 2: Processing parameters and beam layout ........................................................................ 10
Figure 3: Effects of varying processing parameters on bead quality ............................................ 11 Figure 4: Intensity plot for all three beads of interest ................................................................... 12

1. Additive Manufacturing
Additive manufacturing is the creation of a part by building it up layer by layer. A wide
range of materials can be used in additive manufacturing including: plastics, metals, concrete,
paper and even certain types of food. There are many different types of additive manufacturing
techniques, but they can be sorted into seven main categories: vat photopolymerization, material
jetting, binder jetting, material extrusion, powder bed fusion, sheet lamination, and directed
energy deposition [1] [2].
Vat photopolymerization uses photopolymer resin that cures when exposed to a specific
wavelength of light. The light is directed to cure the resin one layer at a time. Normally, once the
part is done, it must have a final curing with UV light to fully harden the resin. One of the
advantages of this method is its ability to produce very fine details due to the concentrated area
of light used to produce the part.
Material jetting uses a printhead with many small nozzles to dispense material layer by layer.
As the name implies, this process is similar to inkjet printing processes. Like vat
photopolymerization, material jetting uses photopolymers that cured by UV light to produce the
part. Due to the nature of the print process, multi-material printing is easily achieved and can be
used to produce prints with multiple materials or soluble supports to ease post processing.
Binder jetting uses a similar process to material jetting but instead of depositing the print
material, a binding agent is selectively applied to a powder bed of material. Once the binding
agent has been applied, a thin layer of powder is spread over the bed to form the next layer. This
process is repeated until the part is complete. This process is typically used for showcase pieces
and not functional prototypes, due to reduced mechanical performance.
Material extrusion is most likely what comes to mind when the topic of additive
manufacturing, or 3D printing, comes up. This is due to it being the most common form of
additive manufacturing and what most hobbyist grade machines are. To build the part up,
material is forced through a heated nozzle, melting it. The nozzle is moved around to deposit
material where it is needed until the layer is done. By this point the material has cooled and
hardened, and the nozzle advances to the next layer. This technique is used for rapid prototyping
and can be used to make functional parts.
Powder bed fusion is similar to binder jetting in the fact that there is a powder bed of the
material used to construct the part. However, instead of selectively applying a binding agent,
energy is selectively put into the powder to fuse it together to form the part. Powder bed fusion
has the ability to produce plastic or metal parts depending on the system. It is the most well
established process to produce metal additively manufactured parts.
Sheet lamination uses solid sheets of material to form the layers of the part. The sheets can be
cut before or after being added to the part. The most common materials are either metal sheets,
which are then ultrasonically welded together, or paper, which is bound together with an
adhesive. Like the binder jetting process, sheet lamination additive manufacturing is used more
towards producing aesthetically pleasing models, not structural parts.
Directed energy deposition is a technique that brings both the material and the energy to the
build site. It is best described as using a wire feed welder to build a part using welds, although
the material can be in powder form and the energy usually comes from a laser or other directed
energy source. A major advantage of this additive manufacturing technique is its ability to repair
existing components due to the use of a four or five axis arm being used to move the print
nozzle.
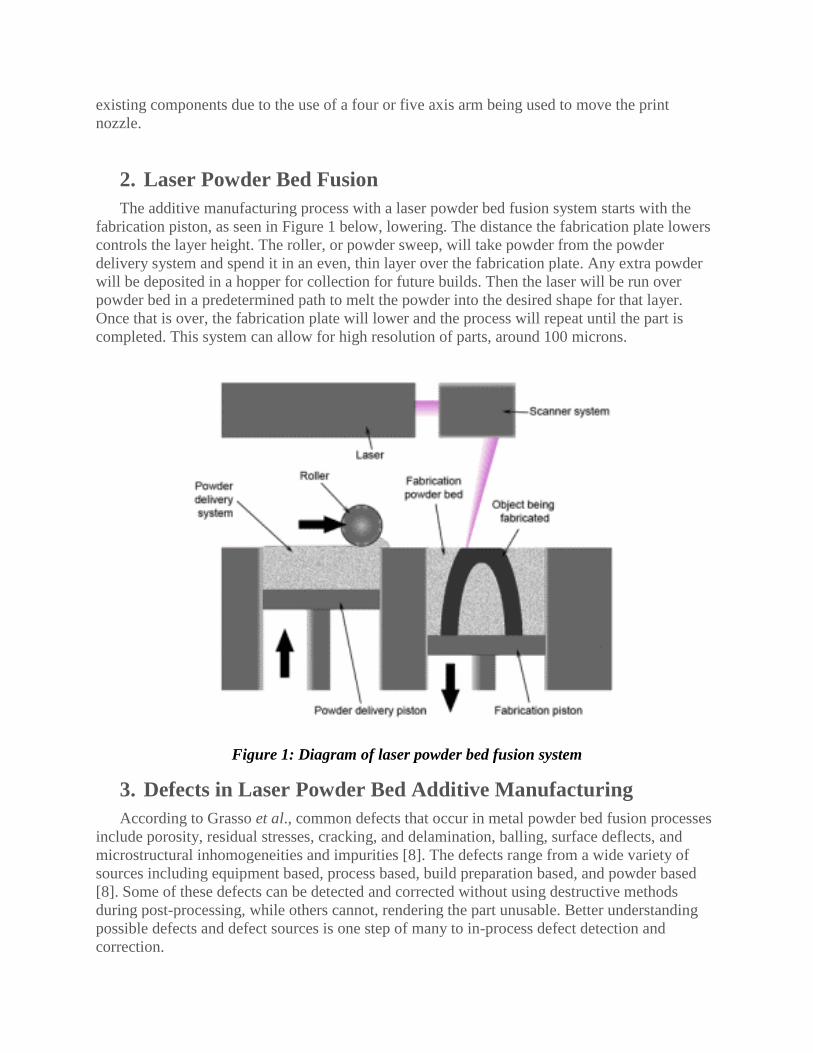
2. Laser Powder Bed Fusion
The additive manufacturing process with a laser powder bed fusion system starts with the
fabrication piston, as seen in Figure 1 below, lowering. The distance the fabrication plate lowers
controls the layer height. The roller, or powder sweep, will take powder from the powder
delivery system and spend it in an even, thin layer over the fabrication plate. Any extra powder
will be deposited in a hopper for collection for future builds. Then the laser will be run over
powder bed in a predetermined path to melt the powder into the desired shape for that layer.
Once that is over, the fabrication plate will lower and the process will repeat until the part is
completed. This system can allow for high resolution of parts, around 100 microns.
Figure 1: Diagram of laser powder bed fusion system
3. Defects in Laser Powder Bed Additive Manufacturing
According to Grasso et al., common defects that occur in metal powder bed fusion processes
include porosity, residual stresses, cracking, and delamination, balling, surface deflects, and
microstructural inhomogeneities and impurities [8]. The defects range from a wide variety of
sources including equipment based, process based, build preparation based, and powder based
[8]. Some of these defects can be detected and corrected without using destructive methods
during post-processing, while others cannot, rendering the part unusable. Better understanding
possible defects and defect sources is one step of many to in-process defect detection and
correction.

Porosity, or voids within the part, can be found in one of three locations in an additively
manufactured part: within the layer, between two adjacent layers, or on the surface. Porosity
greatly impacts the fatigue life and crack growth characteristics of the part, resulting in further
investigation on the subject.
Residual stress, cracking and delamination result from the heating and cooling of the part in
different locations at different rates. Since the laser provides concentrated heat into the part,
small areas of the part will heat up more than their surroundings. Laser scan strategies can also
impact this as different scan strategies can concentrate more heat into a small local area of the
part longer than others. Material compositions have been found to play a role in this as well.
Materials that have large amounts of a secondary element can be affected by different thermal
coefficients and expansion rates. Delamination is a special case of cracking where the crack
starts and grow in between layers.
Balling is a phenomenon driven by surface tension. It occurs when the molten material in the
melt pool forms into balls instead of flattening out over the previous layer. This causes many
problems such as internal porosity between the balls, increase in surface roughness, or
interference with the recoating system if the balls are large enough.
Geometric defects and dimensional accuracy are exactly what they sound like. This can
include part shrinkage, warping, curling and super elevated edges. Other areas affects by this
include thin walls, due to the increase in heat input from the reduction of part area. Overhanging
surfaces without proper supports also suffer due to the different thermal characteristics of the
powder.
Surface roughness has two main contributors: the effect from being manufactured layer by
layer, and the actual roughness of the surface. Final surface finish depends on orientation to the
build direction. An up-ward surface, downward surface and sideways surface with all have
different surface properties. While these can be post processed to improve surface quality, they
will still have an influence on fatigue properties.
Due to the high heat and localized inputs for a short time during the powder bed fusion
process, the microstructure is significantly affected. Non-uniformity of the microstructure affects
the mechanical performance of the part. This can be caused by: impurities, grain size
characteristics, and crystallographic textures. Impurities can include unfused powder, surface
oxides, and other contaminants. The presence of these impurities affect fracture behavior.
4. Spectroscopy in General
According to the Encyclopædia Britannica, spectroscopy is the “study of the adsorption and
emission of light and other radiation by matter, as related to the dependence of these processes
on the wavelength of the radiation… spectroscopy is actually a measure of the interaction of
photons with matter as a function of the photon energy.” [1]. Going to the basics of atoms, every
atom has a certain number of electrons in energy levels, dependent on what element it is. These
electrons want to be in the lowest energy state possible. However, when excited, they will jump
to a higher energy level. The amount of energy required to make an electron jump energy levels
corresponds to a specific frequency of electromagnetic radiation when it returns to its lowest
state. Every element has a unique set of wavelengths, or spectrum, associated with it, making a
spectroscopy a viable means of determining chemical composition.

5. Defects in Laser Welding
The most common defects in laser welding are cracks, porosity, incomplete penetration,
undercut, underfill and spatters [2]. Other defects include root sagging, reinforcement, root
concavity, and blowouts [3]. D. Y. You et al. [2] only lists undercut, blowouts, cracks and spatter
as defects that can be detected with spectrometry, the main focus of this research. However,
spectrometry has been used to monitor and control penetration depth as well, indicating there are
possible applications that extend past their research. This will be discussed in more detail in a
later section.
Porosity will easily form in a laser weld that has a deep penetration depth and slow welding
speed [4]. Under these conditions, the keyhole is likely to collapse, leaving a liquid wall under
the laser. The pressure of evaporation of material from the collapsed wall causes a downward
melt flow, potentially leading to pores. When welding speeds are increased, the plume ejects
upwards and maintains a stable keyhole to prevent bubble formation.
Incomplete penetration results from not enough energy being put into the weld to achieve the
required penetration depth. This can be the result one of two phenomenon. First, the welding
speed could be set too high. With this, the laser passes over the weld site too quickly, not
allowing enough time for the weld to form at the proper penetration depth. Second, the laser
power could be set too low to achieve proper penetration depth. This will not put enough energy
into the weld to fulfill the desired parameters.
Undercut and underfill are two defects that are very similar, but occur in different parts of the
weld. Both can be defined as a lack of material in the upper weld zone. Undercut is defined as a
lack of material in the base metal adjacent to the weld, while underfill occurs in the weld
material. In laser welding, there might not be as clear a division since weld material isn’t always
added during the welding process. However, it is most likely safe to say that undercut is when
the edge of the base material is melted away without being replaced, while underfill is a lack of
material in the weld itself.
Spatter is the release of molten material from the weld pool. A result of molten material
being ejected from the weld site is that undercut, underfill or blowouts can occur in the weld if
too much material is lost. Blowouts, or craters, are similar to underfill, however only occur in a
small location of the weld rather than along the length of it.
Root sagging and reinforcement are similar in the fact that there is too much material at the
weld site. However, root sagging occurs in the lower weld zone and reinforcement occurs in the
upper weld zone. Root concavity is similar to underfill in that it is a lack of material, however it
occurs in the lower weld zone like root sagging.
6. Monitoring and Closed Loop Control
Research has been done on using spectroscopy for defect detection and closed loop control of
laser welding processes. Sibillano et al. [5] reported in their article that by monitoring the
electron temperature and the correlation between specific spectral lines with spectroscopy, real-
time defect detection could be achieve in the laser welding process. To calculate the electron
temperature, the application of the Boltzmann plot method and the relative intensity of a selected
set of spectral lines were used to provide a simpler calculation that is easy to use in real-time
measurements. By conducting some base-line testing using ideal welding parameters, they were
able to determine the expected electron temperature value of an ideal weld and acceptable
thresholds such that when values were recorded outside of these thresholds, they could be
confident they had record of a defect. Monitoring the correlation between certain spectral lines
also detected defects related to the speed of the laser welding process. Variations in welding
speed would affect correlation values between different elements present in the process.
Different correlation values were analyzed and related to different processing problems or
correct processing parameters.
These concepts were used by Sibillano et al. [6] and Konuk et al. [7] to conduct closed loop
control of the penetration depth of laser welding. The electron temperature was calculated using
data from the spectrometer and used maintain a predetermined penetration depth. This was
possible due to the experimental setup. The collimator used to collect the emission data was
directed to record data at a fixed location. This lead to the discovery that the plume generated
will shift with the depth of the keyhole. At an increased penetration depth, this caused the
collimator to be focused on the weaker, outer shell of the plume, causing decreased values of the
electron temperature. Due to the shift in plume location with penetration depth, once the optimal
welding parameters are determined, the optimal electron temperature value can be recorded,
allowing for closed loop control. Threshold values above and below the optimal value determine
the sensitivity of the in-situ monitoring.
7. Motivation
“A one cubic inch LBPF cube is equal to five miles of weld.” If defect detection is important
in laser welding, where it is only a single pass and the surface of the entire weld can be seen,
then it is even more important in laser powder bed fusion where most of the welds are hidden by
the top surface. The defects found in laser powder bed fusion are determinately to part
performance and current methods to detect defects cannot be employed until fabrication of the
part is complete, even then, not all defects can found by nondestructive methods. With current
methods, the part must be completely fabricated, then if unacceptable defects are detected, all the
time and resources put into that part have been wasted. If the defects go undetected, then they
can initiate unexpected failure, leading to potentially dangerous situations. Spectroscopy can
provide real-time monitoring of the fabrication process, allowing defect detection and potentially
correction, saving time and resources that would be otherwise wasted on useless parts.
8. AM System
The additive manufacturing system used for this project is a custom built laser powder bed
fusion system by Universal Technology Corporation. This is an open system, meaning that not
only do the sides allow viewing of the process, but it is flexible to allow different sensor setups
and more flexible than most systems in regards to controlling build parameters. The system used
a 500 watt laser and argon shielding gas. Data is recorded by an array of sensors including
High speed camera (Phantom V9.1) for high speed visible data
Profilometer (Keyence laser profilometer) for height measurements of the build
Visible and Thermal cameras (Basler acA1920-155um) for visible and thermal data
Spectrometer (PDA36A-Si switchable gain detector) for spectroscopy data
o Three sensors are run, with 520, 530, and 640 nm filters, one on each
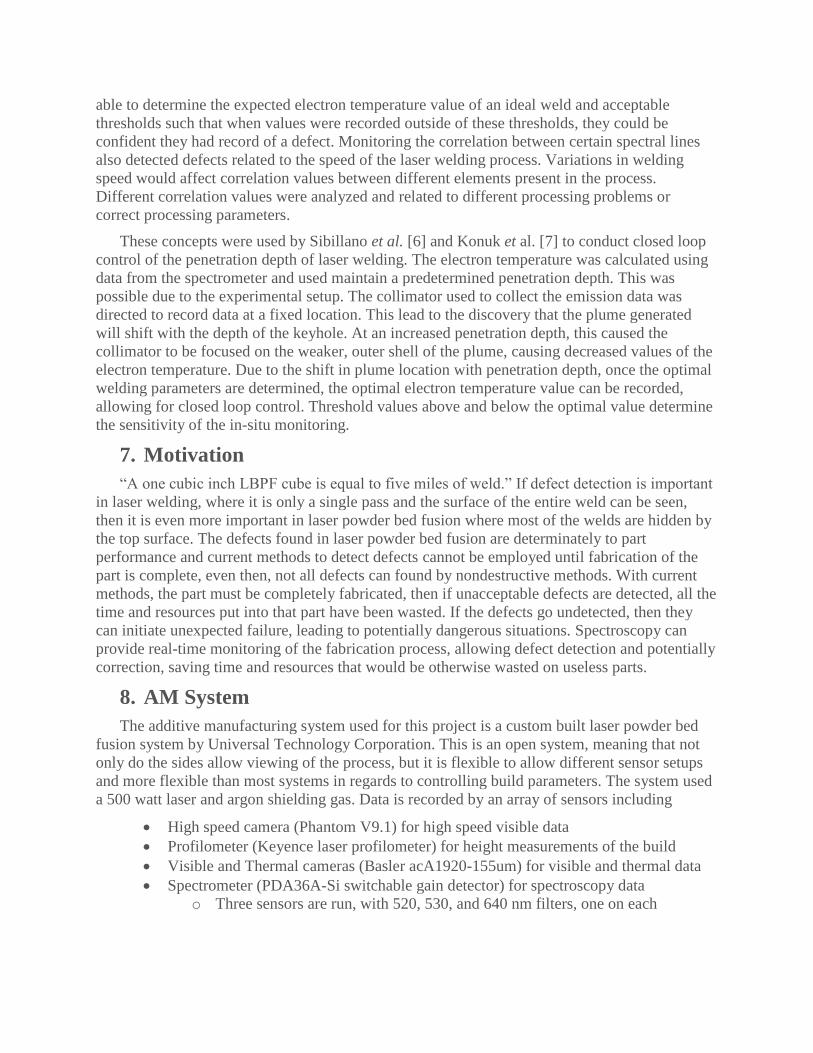
9. Experiment Set-up
The experiment was set up to run 15 individual beads while varying the parameters of speed
and power. Three speeds settings were chosen of 500 mm/s, 1000 mm/s and 1500 mm/s. Five
power levels where chosen of 150 W, 225 W, 300 W, 375 W, and 450 W. The combination of
processing parameters and beam layout can be seen in Figure 2 below.
Figure 2: Processing parameters and beam layout
10. Data Processing
Two forms of data were collected for this experiment. First, there was the sensor data from
the spectrometer. It outputted data as a table of values. This tables of values was imported into
MATLAB where custom code was implemented to sort and plot the data. Second, there was the
experiment data, which in this case was the beads themselves. They were looked at under a
microscope, where they were photographed and measured.
11. Results
Once the experiment was complete, the beads were examined under a microscope and
accessed for quality. All fifteen beads using different combinations of speed and power can be
seen in Figure 3 below. The top set of five were run at 500 mm/s, the middle at 1000 mm/s and
the bottom at 1500 mm/s. Within each group, the top bead was run at 450 watts, running down
through the power levels to 150 watts for the bottom bead.

Figure 3: Effects of varying processing parameters on bead quality
As can be seen from the image above, the effect of varying the processing parameters on
the bead quality is evident. The clearest evidence of this can be seen by comparing the 1000
mm/s beads with the 1500 mm/s beads. While the 1000 mm/s bead look fairly consistent across
their length, aside from the 150 watt bead, the 1500 mm/s, high power beads show balling across
their length. This is demonstrated by the inconsistent bead width.
While the beads were being examined under the microscope, three features were being
looked for to conduct further examination upon: keyholing, balling, and highest quality of bead.
Keyholing was most prominent in the 500 mm/s, 450 watt “High Power” bead. The 1500 mm/s,
375 watt “Low Power” bead was chosen for balling features. It should be noted that the 1500
mm/s, 430 watt bead exhibited worse balling behavior, however it wasn’t able to maintain a
continuous bead, therefore it wasn’t chosen. The 1000 mm/s, 225 watt “Nominal” bead was
chosen for having the highest observable quality in terms of bead width and consistency. These
three beads were further examined using the spectroscopy data.
The spectroscopy data for the three beads was pulled from the readings taken with the
640 nm filter, due to that data having the least amount of noise. The three sets of data were
plotted on the same plot to compare intensity, namely, average intensity and the intensity range
for each bead. The data plot can be seen below in
10 mm
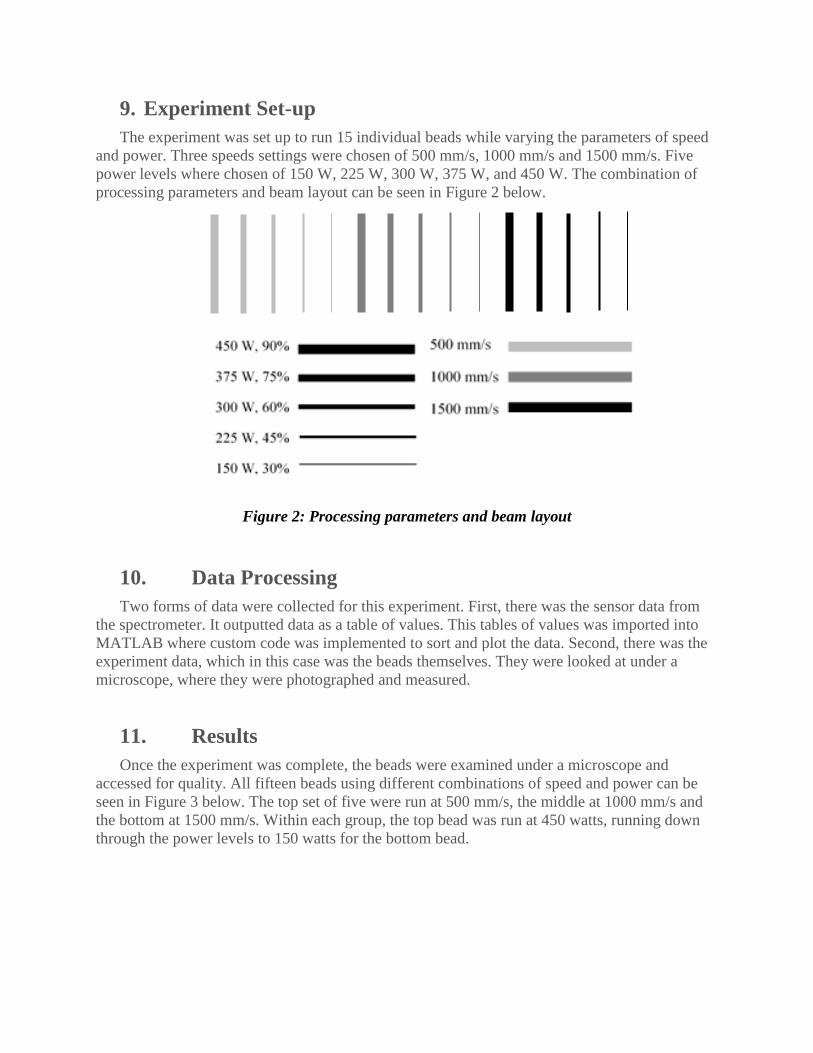
Figure 4: Intensity plot for all three beads of interest
From the plot, it can be seen that intensity values and intensity ranges vary with regards
to processing parameters. The low power bead had an average intensity around 0.04 and covered
a range totaling about 0.45. The nominal bead had an average intensity around 0.02 and covered
a range totaling about 0.25. The high power bead had an average intensity around 0.01 and
covered a range totaling about 0.15. A common way to compare energy input being varying
speeds and powers is the take the ratio of power to speed. Evaluating this ratio for the three
beads, the high power bead had a ratio of 0.9, the low power bead had a ratio of 0.25, and the
nominal bead had a ratio of 0.225. It is interesting to note that while the low power and nominal
beads had similar ratios, the intensity data plotted for them varied in average value and range,
indicating that inputted power is not the only factor changing the intensity data between beads.
Another point of interest from studying the data is the variation in the density of data
points between processing parameters. The sensors are collecting data at a fixed rate. Therefore,
at the faster build speeds, the bead is completed in less time, meaning less data is collected at it.
Comparing the high power data to the low power data, there is a larger quantity of smaller peaks
and valleys between the bigger ones than in the low power data. This indicates that there could
be missing peaks and valleys in the low power data due to the faster rate at which the bead was
constructed.
12. Conclusions
This project was conducted to determine if spectroscopy could be used to conduct in situ
monitoring on laser powder bed additive manufacturing. Research was conducted on laser
powder bed fusion processing and defects and compared to laser welding processing and defects.
Prior work was found using spectroscopy as a monitoring and control loop for laser welding. An
experiment was set up and run to determine if varying the processing parameters had any effect
on the spectroscopy data. Varying the processing parameters showed a wide range of defects in
the produced beads and analysis of the spectroscopy data revealed that the intensity values varied
for the various defects. It was also determined that the energy input is not the only factor varying

the intensity data, as two beads studied had similar energy inputs and different intensity readings.
All these results show that closed loop control of laser powder bed fusion is possible with
spectroscopy.
13. Future Work
While some interesting and exciting results were obtained from this project and experiment,
it was just the beginning of a longer series meant to further define this area of research. There
were many areas of this project that left room to expand upon at a later date. First, instead
plotting intensity, the data will be converted to a physical quantity such as temperature or energy.
All the beads will be investigated and statistical analysis done on the data, instead of focusing on
three beads and pulling observations from the plots themselves. Next, the spectroscopy data will
be correlated to the other data collected during the experiment, such as the high speed camera, to
determine if areas of interest in the spectroscopy data are also areas of interest in other data sets.
In addition to a deeper investigation of the sensor data, the experiment data, in terms of the beads
themselves, will be further investigated by sectioning the plate to examine the sub surfaces and
cross sections. Physics based modeling will be done to provide a way to make predictions about
how processing parameters will affect build quality. Eventually, the build will be expanded to
larger geometries, such as cubes or geometries that pose unique problems, such as the transition
from a wide cross section to a thin wall.

14. Works Cited
[1] B. Redwood, "Additive Manufacturing Technologies: An Overview," 3D Hubs, [Online].
Available: https://www.3dhubs.com/knowledge-base/additive-manufacturing-technologies-
overview. [Accessed April 2018].
[2] "Additive Manufacturing Research Group," Loughborough University, [Online]. Available:
http://www.lboro.ac.uk/research/amrg/about/the7categoriesofadditivemanufacturing/.
[Accessed April 2018].
[3] M. Grasso and B. M. Colosimo, "Process defects and in situ monitoring methods in metal
powder bed fusion: a review," Measurement Science and Technology, vol. 28, no. 4, 2017.
[4] J. D. Graybeal, J. O. Stoner, G. S. Hurst and S. Chu, "Spectroscopy," Encyclopædia
Britannica, 26 July 1999. [Online]. Available:
https://www.britannica.com/science/spectroscopy. [Accessed 16 March 2018].
[5] D. Y. You, X. D. Gao and S. Katayama, "Review of laser welding monitoring," Science
and Technology of Welding and Joining, vol. 19, pp. 181-201, 2013.
[6] P. Norman, J. KArlsson and A. Kaplan, "Monitoring undercut, blowouts and root sagging
during laser beam welding," in Fifth International WLT-Conference on Lasers in
Manufacturing, Munich, 2009.
[7] S. Katayama, Y. Kawahito and M. Mizutani, "Elucidation of laser welding phenomena and
factors affecting weld penetration and welding defects," Physics Procedia, vol. 5, pp. 9-17,
2010.
[8] T. Sibillano, A. Ancona, V. Berardi and P. M. Lugara, "A Real-Time Spectroscopic Sensor
for Monitoring Lser Welding Processes," Sensors, vol. 9, pp. 3376-3385, 2009.
[9] T. Sibillano, A. Ancona, D. Rizza, F. Mezzapesa and A. R. e. a. Konuk, "Spectroscopic
closed loop control of penetration depth in laser beam welding process," in Proceedings of
Spie, San Francisco, 2012.
[10] A. Konuk, R. Aarts, A. Huis in 't Veld, T. Sibillano, D. Rizzi and A. Ancona, "Process
Control of Stainless Steel Laser Welding using an Optical Spectroscopic Sensor," Physics
Procedia, vol. 12, pp. 744-751, 2011.