
In Situ Studies by X-ray Absorption Spectroscopy
230
1 Molecular Mechanisms during Amplification of Chirality in Organometallic Systems: In Situ Studies by X-ray Absorption Spectroscopy A thesis submitted to the University of Manchester for the degree of Doctor of Philosophy in the Faculty of Engineering and Physical Sciences. 2010 Luanga Nforba Nchari School of Chemical Engineering and Analytical Science The University of Manchester
Transcript of In Situ Studies by X-ray Absorption Spectroscopy
1
Molecular Mechanisms during
Amplification of Chirality in Organometallic Systems:
In Situ Studies by X-ray Absorption Spectroscopy
A thesis submitted to the University of Manchester for the degree of Doctor of
Philosophy in the Faculty of Engineering and Physical Sciences.
2010
Luanga Nforba Nchari
School of Chemical Engineering and Analytical Science
The University of Manchester

2
Table of Contents
LIST OF FIGURES ............................................................................................................................. 5
LIST OF TABLES ............................................................................................................................. 11
LIST OF ABBREVIATIONS ............................................................................................................ 12
ABSTRACT ........................................................................................................................................ 13
DECLARATION ................................................................................................................................ 14
ACKNOWLEDGEMENTS ............................................................................................................... 15
1. INTRODUCTION ............................................................................................................ 17
1.1 ENANTIOMERS AND CHIRAL MOLECULES ..................................................................................... 17
1.2 ENANTIOMERISM: THE DISCOVERY............................................................................................... 21
1.3 THE BIOLOGICAL IMPORTANCE OF CHIRALITY .............................................................................. 22
1.4 THE PHYSICAL PROPERTIES OF STEREOISOMERS ........................................................................... 24
1.5 CHEMICAL PROPERTIES OF ENANTIOMERS .................................................................................... 27
1.6 METHODS OF OBTAINING OPTICALLY ACTIVE COMPOUNDS .......................................................... 28
1.6.1 The Chiral Pool ....................................................................................................................... 30
1.6.2 Separation of enantiomers ....................................................................................................... 31
1.6.3 Resolution by chromatography on chiral materials................................................................. 34
R enantiomer reaches the ............................................................................................................... 34
1.6.4 Asymmetric synthesis ............................................................................................................... 35
2. ASYMMETRIC AUTOCATALYSIS ............................................................................ 36
2.1 NONLINEAR EFFECTS IN ASYMMETRICAL STEREOSELECTIVE REACTIONS ................................... 37
2.1.1 The Frank Model ..................................................................................................................... 38
2.1.2 The Kagan Model .................................................................................................................... 41
2.1.3 The Noyori Model .................................................................................................................... 44
2.2 THE SOAI AUTOCATALYTIC REACTION ........................................................................................ 46
2.2.1 Introduction ............................................................................................................................. 46
2.2.2 Discovery and development of highly enantioselective asymmetric autocatalysis .................. 48
3. MECHANISTIC APPROACHES TO UNDERSTANDING THE SOAI
AUTOCATALYTIC REACTION .................................................................................................... 52
3.1 THE BLACKMOND MODEL ........................................................................................................... 52
3.1.1 Dimer Model ............................................................................................................................ 52
3.1.2 Tetramer .................................................................................................................................. 64
3.2 THE SOAI MODEL ......................................................................................................................... 65
3.3 THE BUHSE MODEL ...................................................................................................................... 70
3.4 THE BROWN MODEL ..................................................................................................................... 73

3
3.5 RESEARCH OBJECTIVE .................................................................................................................. 84
4. EXPERIMENTAL ........................................................................................................... 86
4.1 X-RAY ABSORPTION SPECTROSCOPY (XAS) ................................................................................ 86
4.1.1 Principles of X-ray absorption spectroscopy ........................................................................... 86
4.1.2 XANES and EXAFS .................................................................................................................. 88
4.1.3 Physical principles ................................................................................................................... 90
4.1.4 EXAFS equation....................................................................................................................... 91
4.1.5 Data analysis ........................................................................................................................... 91
4.2 MINIATURIZED CONTINUOUS FLOW REACTION VESSELS ............................................................... 96
4.2.1 Introduction ............................................................................................................................. 96
4.2.2 Fabrication of microreactors ................................................................................................... 97
4.2.3 Microfluidic handling and effects of downsizing ..................................................................... 98
4.3 XAFS MEASUREMENT EXPERIMENTAL SET UP ........................................................................... 100
4.3.1 The influence of ambient conditions on XAFS study of dialkylzinc .............................................
4.3.2 Non-flow Reactor for XAFS Studies of Organometallic Reactions ..............................................
4.3.3 Continuous flow Reactor for XAFS Studies of Organometallic Reactions ............................ 108
4.3.4 Continuous Tubular Reactor for XAFS Studies of Organometallic Reactions:
Possibilities and Limitations for Studies of the Soai Reaction............................................... 109
4.4 UV MEASUREMENTS .................................................................................................................. 116
5. THE INFLUENCE OF SOLVENTS ON ASYMMETRIC AMPLIFICATION ...... 120
5.1 INTRODUCTION .......................................................................................................................... 120
5.2 EXPERIMENTAL .......................................................................................................................... 123
5.3 RESULTS AND DISCUSSION ......................................................................................................... 124
5.3.1 i-Pr2Zn in toluene and THF ................................................................................................... 124
5.3.2 Diethylzinc in different THF/toluene ratios ........................................................................... 132
5.3.3 Diethylzinc in THF at different concentrations ..................................................................... 136
5.3.4 Concentration versus solvent ratio of diethylzinc .................................................................. 138
5.3.5 Interaction of dialkylzincs with different solvent ................................................................... 140
5.3.6 Comparing diethylzinc in THF and toluene at ESRF, ANKA and APS ................................. 141
5.3.7 Comparing the XANES of diethyl-, dimethyl- and diisopropylzinc ........................................ 143
5.3.8 EXAFS analysis of diethylzinc in solvents ............................................................................. 145
5.3.9 Kinetic simulation studies of diethylzinc in solvents .............................................................. 152
5.4 CONCLUSION .............................................................................................................................. 154
6. CHARACTERISATION OF A LIGAND AND ALKYLZINC COMPLEX ............ 156
6.1 INTRODUCTION .......................................................................................................................... 156
6.2 EXPERIMENTAL .......................................................................................................................... 159
6.3 RESULTS AND DISCUSSION ......................................................................................................... 159
4
6.3.1 i-Pr2Zn and 2-Butanol ........................................................................................................... 159
6.3.2 Et2Zn and DMAE ................................................................................................................... 163
6.4 CONCLUSION .............................................................................................................................. 169
7. CHARACTERISATION OF THE ALKYLATION OF ALDEHYDES ................... 171
7.1 INTRODUCTION .......................................................................................................................... 171
7.2 EXPERIMENTAL .......................................................................................................................... 173
7.3 RESULTS AND DISCUSSION ......................................................................................................... 173
7.3.1 i-Pr2Zn and Benzaldehyde ..................................................................................................... 173
7.3.2 i-Pr2Zn and pyrimidyl aldehyde ............................................................................................. 175
7.3.3 Et2Zn and pyrimidyl aldehyde ................................................................................................ 185
7.3.4 Et2Zn, DMAE and cinnamaldehyde ....................................................................................... 192
7.3.5 Characterisation of dimer species formed in the Soai reaction ............................................. 198
7.4 CONCLUSION .............................................................................................................................. 204
8. ADDITIONAL WORK .................................................................................................. 207
8.1 EXPERIMENTAL .......................................................................................................................... 207
8.2 RESULTS AND DISCUSSION ......................................................................................................... 210
8.2.1 Alkylating agents ................................................................................................................... 210
8.2.2 Solvent effect .......................................................................................................................... 211
8.2.3 Ethylation with paracyclophane based and dimethylaminoethanol ligands .......................... 213
8.2.4 Diethylzinc addition to Imines ............................................................................................... 215
8.2.5 EXAFS Refinement of ANKA data ......................................................................................... 217
8.3 CONCLUSION .............................................................................................................................. 217
9. SUMMARY..................................................................................................................... 220
10. FUTURE WORK ........................................................................................................... 224
11. PEER REVIEWED WORK .......................................................................................... 226
12. REFERENCES ............................................................................................................... 227
5
List of figures
Figure 1.1: Soai autocatalytic reaction[1]
............................................................................................ 17
Figure 1.2: Subdivision of isomers.[3]
.................................................................................................. 19
Figure 1.3: (a) Models of 2-Butanol enantiomers. (b) Non superimposable models ........................... 20
Figure 1.4: Relationship of enantiomers .............................................................................................. 21
Figure 1.5 Chiral forms of Thalidomide .............................................................................................. 23
Figure 1.6: Chiral forms of Limonene in Lemon and Orange ............................................................. 24
Figure 1.7 S-Stereoconfiguration of alanine[11]
................................................................................... 25
Figure 1.8 Schematic of a polarimeter ................................................................................................. 26
Figure 1.9: Schematic of polarimeter[13]
.............................................................................................. 26
Figure 1.10: (S)-Ibuprofen (left), antiinflammatory and (R)-Fluoxetine (right), antidepressant.[13]
... 27
Figure 1.11: Structure and shape of hexachloroethane (left) and cyclooctane (right).[13]
.................. 28
Figure 1.12: Methods of producing optically active compounds.[8]
..................................................... 30
Figure 1.13 Preparation of α – Methyl-L-Dopa[9]
............................................................................... 32
Figure 1.14: Epoxidation reaction of only one enantiomer[9]
.............................................................. 33
Figure 1.15: Separation of enantiomers by chromatography.[15]
......................................................... 34
Figure 1.16: Asymmetric synthesis scheme .......................................................................................... 35
Figure 2.1: Non-linear effects with partially resolved chiral auxiliaries[17]
........................................ 37
Figure 2.2: Sketch of general form of solutions of equations 2.2 and 2.3[16]
....................................... 40
Figure 2.3: Outline of Kagan ML2 mechanism .................................................................................... 41
Figure 2.4: Illustration of the mechanism developed by Noyori et al to explain amplification of ee... 45
Figure 2.5: An example of the Soai autocatalytic reaction[1]
............................................................... 47
Figure 2.6: Dialkylzinc addition to aldehydes using chiral catalysts.[22]
............................................ 48
Figure 2.7 Enantioselective addition of dialkylzincs to pyridine aldehydes.[22]
................................... 49
Figure 2.8: Enantioselective alkylation of pyrimidine aldehyde[22]
..................................................... 50
Figure 2.9: Practically perfect asymmetric autocatalysis in which the product is used as the
asymmetric autocatalyst for the next run.[22]
........................................................................................ 50
Figure 2.10: Consecutive asymmetric autocatalysis of (S)-16 with amplification of enantiomeric
excess.[22]
.............................................................................................................................................. 51
Figure 3.1: Reaction heat flow against time of differing enantiomeric excess: 97%, 43% and 0%[42]
53
Figure 3.2: Simplified Kagan and Noyori mechanisms.[43]
.................................................................. 54
Figure 3.3: Amplification of enantiomeric excess in a 1 molar solution of S and R monomers through
RS heterodimer formation (Noyori model). The lines represent increasing values of the equilibrium
constant Khetero for heterodimer formation (see inset for values of Khetero). .......................................... 56
Figure 3.4 : Blackmond’s proposed active metal catalyst.[42]
.............................................................. 61
Figure 3.5: Formation of dimer species from monomeric alkoxides.[45]
.............................................. 62
Figure 3.6: Experimental kinetic data and dimer model calculations for reactions at 22% and 6%
initial ee Initial concentrations [A] = 0.2M; [Z] = 0.4M; catalyst 10%.[44]
........................................ 62

6
Figure 3.7: Blackmond’s dimer model.[44]
........................................................................................... 63
Figure 3.8: Reaction rate as a function of aldehyde. Blue circles: Experimental data; dash black line:
Equation 3.1; solid pink line: Equation 3.2.[40]
.................................................................................... 64
Figure 3.9: Aldehyde- iPr2Zn complex[40]
............................................................................................ 65
Figure 3.10: Scheme proposed by Soai and coworkers[19]
................................................................... 65
Figure 3.11: Comparison of simulation (solid lines) with experimental points. T = 273K;
A0=2.08X10⁻² M; Z0 = 3.13X10⁻² M; P0 = 2.08X10⁻⁴ M. Broken line represents simulation assuming
a first-order autocatalytic reaction.[19]
................................................................................................ 67
Figure 3.12: Model proposed by Soai and coworkers.[32]
.................................................................... 68
Figure 3.13: Comparison of simulation [yield: broken line; ee: solid line] with experimental points
[yield: hollow circles; ee: filled circle] on asymmetric autocatalysis with initial ee of 59.4% at -
250C.
[32] ................................................................................................................................................ 70
Figure 3.14: Proposed kinetic model. k:rate constant[47]
..................................................................... 71
Figure 3.15: Frank model.[48]
............................................................................................................... 72
Figure 3.16: Noyori model.[48]
............................................................................................................. 72
Figure 3.17: Kagan model[48]
............................................................................................................... 73
Figure 3.18: Fundamentals of Noyori and Kitamura model[51]
........................................................... 74
Figure 3.19: Double resonance from homochiral to heterochiral[51]
.................................................. 75
Figure 3.20: Proposed square planar homo- and hetero- dimer[50]
..................................................... 76
Figure 3.21: Dynamic exchange between homo- and hetero- dimer a) A: Observed B: Calculated b)
Arrhenius plot. Half life approx. 14s at 293 K.[51]
............................................................................... 77
Figure 3.22: Chemical shift of binding of diisopropylzinc to pyrimidine aldehyde.[51]
........................ 78
Figure 3.23: Enthalpy of binding ZnMe2 to pyrimidine aldehyde (Units: kcal/mol). N- preferred over
O- complexation.[51]
............................................................................................................................. 79
Figure 3.24: Closed cyclic dimers derived by DFT.[51]
........................................................................ 80
Figure 3.25: DFT calculated ground state conformations (preferred) of iPr2Zn derived homo- (Ar, Ar`
syn) and hetero- (Ar, Ar` anti) dimers.[51, 52]
........................................................................................ 81
Figure 3.26: (a) Four closed tetramers with alkyl substituents removed; (b) Space filling model of
cube and square-capped macrocycle (both homochiral).[51, 52]
............................................................ 82
Figure 4.1: Illustration of X-ray absorption process in an atom[55]
..................................................... 86
Figure 4.2: Spectrum of photon energy in wavelength and frequency[55]
............................................ 87
Figure 4.3: Plot of XANES and EXAFS region.[54]
.............................................................................. 89
Figure 4.4: (a) Photoelectric effect in terms of excitation of different orbital or different energy levels.
(b) Illustration of neighbouring shells of atoms about the absorber. Interference between outgoing
photoelectron wave and backscattered off neighbouring atoms shell.[56]
............................................ 90
Figure 4.5: a) Pt edge fluorescence data for Pt complex. The µvic function better represents the ‘fall
off’ of the atomic background absorption µ0 with increasing energy than µspline. b) Transmission L
egde data showing that µspline can be a good approximation to µvic and µ0.[59]
.................................... 94
7
Figure 4.6: Radial distribution function after Fourier transformation of Pt foil. Absolute (full line)
and imaginary (- - - -).[56]
..................................................................................................................... 95
Figure 4.7: Photolithographic fabrication of channel networks in glass.[67]
....................................... 97
Figure 4.8: (a) Microreactors used in chemical synthesis; (b) dependence of the product yields from
the reaction time.[63]
............................................................................................................................. 99
Figure 4.9: Schematic of XAS experiment[69]
..................................................................................... 101
Figure 4.10: Optics and detectors[69]
................................................................................................. 101
Figure 4.11: XANES spectra of dialkylzincs in toluene and water. ................................................... 102
Figure 4.12: Zinc K-edge EXAFS spectra of decomposed Et2Zn exposed to air. Fit with zinc hydroxide
coordination numbers fixed. Dash lines are the experimental data and the solid lines are the best
theoretical fit. ..................................................................................................................................... 104
Figure 4.13: Zinc K edge EXAFS spectra of decomposed Et2Zn exposed to air. Fit with zinc oxide
coordination numbers fixed. Dotted lines are the experimental data and the solid lines are the best
theoretical fit. ..................................................................................................................................... 105
Figure 4.14: XANES spectra of 0.1 M Et2Zn in non-flow reactor (microcentrifuge) over 2 days ..... 107
Figure 4.15: Testing the continuous flow Al reactor with colour dyes. ............................................. 108
Figure 4.16: Schematic arrangement of the PTFE tubular flow reactor mounted on a heatable Al
frame; also shown are representative in situ Zn K-edge FY XANES data taken at positions A1, D2 and
C4 during the Soai reaction with a 1:1 volume mixture of 0.1 mol L1
diisopropylzinc and pyrimidyl
aldehyde solutions. ............................................................................................................................. 110
Figure 4.17: Tubular flow reactor assembled at station 9.3, SRS Daresbury, UK. ........................... 110
Figure 4.18: Electron microscopy and EDX analysis of the organozinc wall deposit on the inside of
the PTFE reactor tube. ....................................................................................................................... 112
Figure 4.19: In situ transmission XANES (BM29, ESRF) obtained in microcentrifuge tubes. From top
to bottom: Zn K-edge XANES spectra of a toluene solution containing 0.1 M diisopropylzinc; the
supernatant of a solution formed by reacting 0.1 M diisopropylzinc and 0.1 M pyrimidine aldehyde in
toluene; the sediment formed in this solution; a toluene solution containing 0.1 M diisopropylzinc and
2 M pyrimidine aldehyde; the spectrum labelled C4 in figure 1 (measured at the SRS); a spectrum of
ZnO. ................................................................................................................................................... 114
Figure 4.20: Overview of ‘5 cuvette’ platform, (a) camera, (b) flow cuvettes in aluminium frame, (c)
collimating lens, (d) monochromator & light source, (e and f) syringe pump dosing system with stock
solutions and (g) control PC.[73]
......................................................................................................... 117
Figure 4.21: Aluminium frame containing cuvettes[73]
...................................................................... 118
Figure 4.22: Image of monochromatic light through five sample cells[73]
......................................... 118
Figure 4.23: Determination of light intensity through sample cells at a range of wavelengths by image
analysis software.[73]
.......................................................................................................................... 119
Figure 5.1: Product ee against initial catalyst ee in toluene, diethylether, Et2O/toluene and THF.[45]
............................................................................................................................................................ 121
Figure 5.2: Zn K-egde XANES spectra of 0.1 M i-Pr2Zn in toluene, THF and toluene/THF (1:1). ... 125
8
Figure 5.3: Zn K-edge EXAFS spectra and FT of i-Pr2Zn in toluene. Dash lines: Experimental data
and solid lines: best theoretical fit. .................................................................................................... 126
Figure 5.4: Zn K-edge EXAFS spectra and FT of i-Pr2Zn in toluene and THF. Dash lines:
experimental data and solid lines: best theoretical fit. ...................................................................... 127
Figure 5.5: Models of iPr2Zn in toluene and THF from EXAFS calculations ................................... 129
Figure 5.6: Ligand field splitting of Zn2+
4p orbitals as a function of site geometry.[79]
................... 131
Figure 5.7: XANES spectra of 0.1M DEZ at different THF/toluene ratios ........................................ 133
Figure 5.8: XANES spectra of 0.1 M DEZ in toluene and THF. Calculated XANES in 1:1
(toluene:THF) included. ..................................................................................................................... 134
Figure 5.9: Comparing the experimental and fitted XANES of 0.1 M Et2Zn at different THF/toluene
ratios (vol %). .................................................................................................................................... 135
Figure 5.10: XANES spectra of DEZ in THF at different concentrations .......................................... 137
Figure 5.11: XANES spectra of DEZ in THF/toluene mixture at different concentrations ................ 139
Figure 5.12: XANES spectra of 0.1 M dialkylzincs in THF, toluene and water. ................................ 140
Figure 5.13: Comparing the dipole moment of water, THF, diethyl ether and toluene. .................... 141
Figure 5.14: Comparing the XANES spectra of 0.1M DEZ obtained at different synchrotrons. ....... 142
Figure 5.15: Zn K-edge spectra of 0.1 M dimethyl-, diethyl and diisoproylzinc in toluene ............... 144
Figure 5.16: Zinc K edge EXAFS spectra of Et2Zn in Toluene. Dotted lines are the experimental data
and the solid lines are the best theoretical fit. .................................................................................... 145
Figure 5.17: Model of diethyl zinc in toluene from EXAFS calculations. .......................................... 147
Figure 5.18: EXAFS fits of diethylzinc in THF (a) linear (b) dimer and (c) tetramer. ...................... 148
Figure 5.19: Structural calculated model of diethylzinc in THF (Dimer model). .............................. 149
Figure 5.20: Structural calculated model of diethylzinc in THF (Tetramer model). ......................... 150
Figure 5.21: Kinetic simulation of DEZ, solvent and the complex. Initial concentration 0.1mol/l .... 153
Figure 6.1: Catalytic cycle proposed by Noyori.[18]
........................................................................... 157
Figure 6.2: Noyori’s DAIB and the dimer-monomer equilibrium of homochiral zinc chelate
complexes.[87]
..................................................................................................................................... 157
Figure 6.3: XANES Zn K-edge spectra of 0.1 M i-Pr2Zn : 2-butanol molar ratios. ........................... 160
Figure 6.4: Zinc K edge EXAFS spectra of 0.1M i-Pr2Zn with 2-butanol in 1:1 molar ratio in toluene
(dimer and tetramer). Dotted lines are the experimental data and the solid lines are the best
theoretical fit. ..................................................................................................................................... 161
Figure 6.5: EXAFS calculated structural dimer and tetramer model of i-Pr2Zn with 2-butanol in 1:1
molar ratio. ........................................................................................................................................ 163
Figure 6.6: XANES Zn K-edge spectra of 0.1 M Et2Zn and DMAE. .................................................. 165
Figure 6.7: Structure of 2-butanol (left) and DMAE (right). ............................................................. 166
Figure 6.8: Zn K-edge EXAFS of 0.1 M Et2Zn/DMAE in 1:1 ratio (toluene) in k and R space. (a)
monomer (b) dimer (c) tetramer. Dash lines are the experimental data and the solid lines are the best
theoretical fit. ..................................................................................................................................... 167

9
Figure 6.9: Zn K-edge EXAFS parameters of 0.1 M Et2Zn/DMAE in 1:1 ratio in toluene (different
models). .............................................................................................................................................. 168
Figure 6.10: Monomer, Dimer and Tetramer structural models proposed from EXAFS parameters of
0.1 M Et2Zn/DMAE in 1:1 ratio (toluene). ......................................................................................... 169
Figure 7.1: The increase in the amounts of S and R pyrimidyl alcohol in consecutive asymmetric
autocatalysis.[102]
................................................................................................................................ 172
Figure 7.2: Zinc K-edge of 0.1 M i-Pr2Zn:BA in toluene. .................................................................. 174
Figure 7.3: Zinc K-edge spectra of 0.1 M i-Pr2Zn:PA in toluene. ..................................................... 176
Figure 7.4: Zinc k-edge EXAFS spectra of i-Pr2Zn with pyrimidyl aldehyde in 1:1 molar ratio
(toluene). Dash lines are the experimental data and the solid lines are the best theoretical fit......... 177
Figure 7.5: Zinc K edge EXAFS spectra of i-Pr2Zn with pyrimidyl aldehyde in 1:1 molar ratio
(precipitate). Dotted lines are the experimental data and the solid lines are the best theoretical fit. 179
Figure 7.6: EXAFS model of i-Pr2Zn with pyrimidyl aldehyde in 1:1 molar ratio. Model of dimer
alkoxide in solution. ........................................................................................................................... 180
Figure 7.7: Zinc K edge EXAFS spectra of i-Pr2Zn with pyrimidyl aldehyde in 2:1 molar ratio
(solution) at t0 (initial). Dotted lines are the experimental data and the solid lines are the best
theoretical fit. ..................................................................................................................................... 181
Figure 7.8: Zinc K edge EXAFS spectra of i-Pr2Zn with pyrimidyl aldehyde in 2:1 molar ratio
(solution) after 3 hours. Dash lines are the experimental data and the solid lines are the best
theoretical fit. ..................................................................................................................................... 182
Figure 7.9: EXAFS model of i-Pr2Zn with pyrimidyl aldehyde in 2:1 molar ratio in solution at start
and after 3 hours. ............................................................................................................................... 183
Figure 7.10: Zinc K edge EXAFS spectra of i-Pr2Zn with pyrimidyl aldehyde in 1:2 molar ratio
(precipitate). Dash lines are the experimental data and the solid lines are the best theoretical fit. .. 184
Figure 7.11: EXAFS model of i-Pr2Zn with pyrimidyl aldehyde in 1:2 molar ratio (precipitate). .... 185
Figure 7.12: Zinc K-edge XANES spectra of 0.1 M DEZ:PA in toluene. ........................................... 186
Figure 7.13: Zinc k edge EXAFS spectra of 0.1 M DEZ with pyrimidyl aldehyde in 1:1 molar ratio
(toluene). Dotted lines are the experimental data and the solid lines are the best theoretical fit. ..... 187
Figure 7.14: EXAFS model of DEZ with pyrimidyl aldehyde in 1:1 molar ratio (solution). ............. 189
Figure 7.15: Zinc k edge EXAFS spectra of DEZ with pyrimidyl aldehyde in 2:1 molar ratio (toluene).
Dotted lines are the experimental data and the solid lines are the best theoretical fit. ..................... 190
Figure 7.16: EXAFS model of DEZ with pyrimidyl aldehyde in 2:1 molar ratio (solution). ............. 191
Figure 7.17: Possible model of DEZ with surplus pyrimidyl aldehyde in solution. ........................... 192
Figure 7.18: Zinc k-edge spectra of 0.1 M DEZ:DMAE:CA in toluene. ............................................ 193
Figure 7.19: Absorption Spectra of reaction of DMAE and cinnamaldehyde ................................... 195
Figure 7.20: Absorption Spectra of reaction of DMAE, cinnamaldehyde and DEZ .......................... 196
Figure 7.21: Zinc K edge EXAFS spectra of 0.1 M DEZ:DMAE:CA (2:1:2) in toluene. Dotted lines
are the experimental data and the solid lines are the best theoretical fit. .......................................... 197
10
Figure 7.22: Zinc K-edge spectra of 0.05M iPr2Zn and different aldehydes (molar ratio 1:1 in
toluene). Reaction products of i-Pr2Zn with A: pyrimidyl- B: methoxypyrimidyl- C: methoxypyridyl-
D: benzaldehyde (APS). ..................................................................................................................... 199
Figure 7.23: Structure of the different aldehydes. A: pyrimidyl- B: methoxypyrimidyl- C:
methoxypyridyl- D: benzaldehyde. .................................................................................................... 200
Figure 7.24: Zn K-edge EXAFS and Fourier Transform of 0.5 M iPr2Zn and different aldehydes (A, B,
C and D) in 1:1 molar ratio in k and R space in toluene. .................................................................. 202
Figure 7.25: EXAFS model of alkoxide model from i-Pr2Zn with pyrimidyl aldehyde in 1:1 molar
ratio. Pyrimidylalkoxide dimer (APS). ............................................................................................... 203
Figure 8.1: (a) Ionisation chambers(IC) (b) Sample holder between IC ........................................... 208
Figure 8.2: Air free sample preparing set up ..................................................................................... 209
Figure 8.3: XANES of different alkylzincs in Toluene. APS-labeled; ANKA-unlabeled .................... 210
Figure 8.4: Comparing XANES of diethylzinc in Toluene and THF. (APS/ANKA data) ................... 212
Figure 8.5: XANES spectra of 0.1 M diethylzinc with ligands and Ketone (ANKA data). ................. 214
Figure 8.6: XANES spectra of diethylzinc addition to imines (ANKA data). ..................................... 216

11
List of tables
Table 1.1 Representative substances from the chiral pool[9]
................................................................ 31
Table 1.2: Drugs prepared via Classical Resolution[9]
........................................................................ 33
Table 3.1: Binding enthalpies of tetrameric compared to dimeric structures[52]
................................. 83
Table 4.1: EXAFS parameters of exposed DEZ in air (set as zinc hydroxide solid) .......................... 103
Table 4.2: EXAFS of DEZ in toluene exposed in air (set as zinc oxide) ............................................ 104
Table 4.3: Local structure of ZnO and Zn(OH)2 derived from this EXAFS and other studies ........... 106
Table 5.1: Asymmetric autocatalysis reaction with autocatalytic reaction with (S)- and (R)-2 with >
99.5% ee.[36]
....................................................................................................................................... 120
Table 5.2: Comparing the ee and % product in solution and the precipitate for the Soai reaction.[45]
............................................................................................................................................................ 122
Table 5.3: Zinc K edge EXAFS parameters of i-Pr2Zn in toluene and THF ...................................... 128
Table 5.4: Comparison of bond distances in i-Pr2Zn gas phase and solution. Gas phase: Haaland’s
study,[78]
Solution: EXAFS calculation............................................................................................... 130
Table 5.5: EXAFS parameters of diethylzinc in toluene .................................................................... 146
Table 5.6: EXAFS parameters of diethylzinc in THF ......................................................................... 149
Table 6.1: Effect of aldehyde: dialkylzinc: DAIB ratio on reactivity.[18]
........................................... 158
Table 6.2: Zn K-edge EXAFS parameter of 0.1 M i-Pr2Zn with 2-Butanol in 1:1 molar ratio in toluene
............................................................................................................................................................ 162
Table 7.1: Zn K-edge EXAFS parameter of 0.1 M i-Pr2Zn with PA in 1:1 molar ratio in toluene. ... 177
Table 7.2: Zinc K edge EXAFS parameters of i-Pr2Zn with pyrimidyl aldehyde in 1:1 molar ratio
(precipitate). ....................................................................................................................................... 178
Table 7.3: Zinc K edge EXAFS parameter of i-Pr2Zn with pyrimidyl aldehyde in 2:1 molar ratio
(solution) at t0 (initial)........................................................................................................................ 181
Table 7.4: Zinc K-edge EXAFS spectra of i-Pr2Zn with pyrimidyl aldehyde in 2:1 molar ratio
(solution) after 3 hours. ...................................................................................................................... 182
Table 7.5: Zinc K edge EXAFS spectra of i-Pr2Zn with pyrimidyl aldehyde in 1:2 molar ratio
(precipitate). ....................................................................................................................................... 183
Table 7.6: Zinc K edge EXAFS spectra of DEZ with pyrimidyl aldehyde in 1:1 molar ratio (toluene).
............................................................................................................................................................ 188
Table 7.7: Zinc K edge EXAFS spectra of DEZ with pyrimidyl aldehyde in 2:1 molar ratio (toluene).
............................................................................................................................................................ 190
Table 7.8: Colour change at different molar ratios of DEZ:DMAE:CA after 36 hours .................... 194
Table 7.9: Zinc K edge EXAFS spectra of DEZ, DMAE and CA. ...................................................... 198
Table 7.10: Zn K-edge EXAFS parameters of iPr2Zn and aldehyde A. s: fixed ................................. 204
Table 8.1: Chemicals used during experiment ................................................................................... 209
Table 9.1: Comparing the 1st shell coordination number analysed by the XANES and EXAFS. ....... 223
12
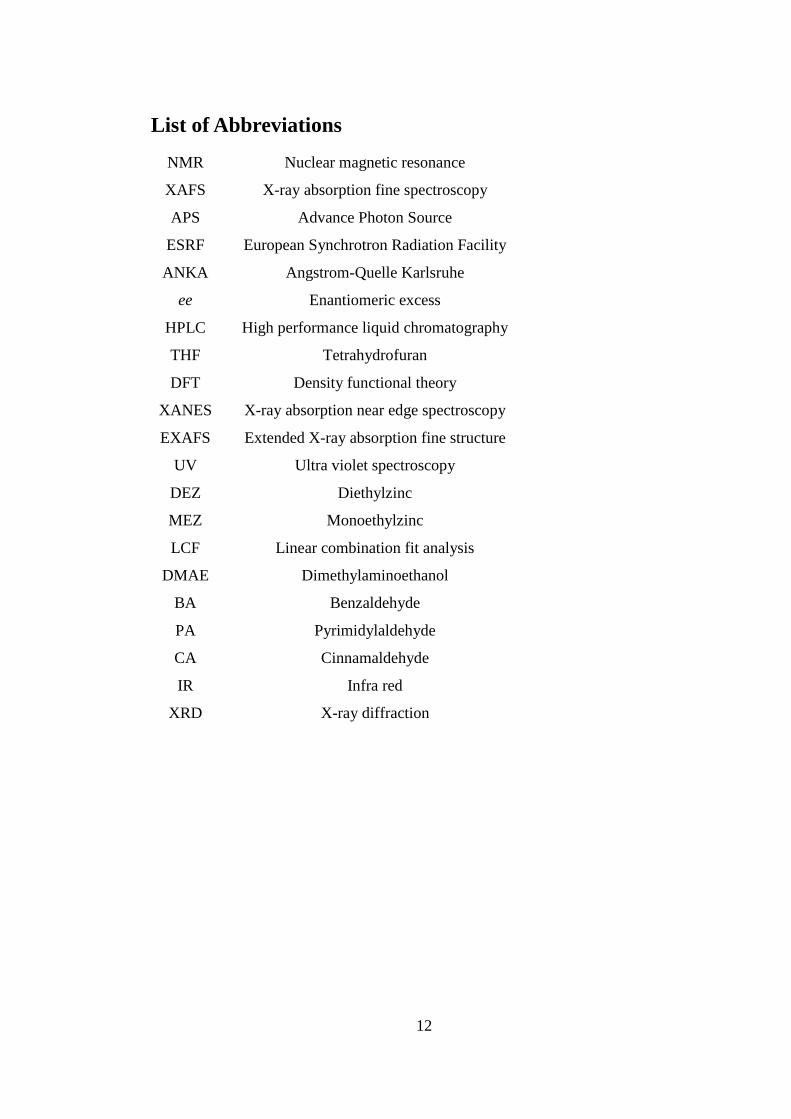
List of Abbreviations
NMR Nuclear magnetic resonance
XAFS X-ray absorption fine spectroscopy
APS Advance Photon Source
ESRF European Synchrotron Radiation Facility
ANKA Angstrom-Quelle Karlsruhe
ee Enantiomeric excess
HPLC High performance liquid chromatography
THF Tetrahydrofuran
DFT Density functional theory
XANES X-ray absorption near edge spectroscopy
EXAFS Extended X-ray absorption fine structure
UV Ultra violet spectroscopy
DEZ Diethylzinc
MEZ Monoethylzinc
LCF Linear combination fit analysis
DMAE Dimethylaminoethanol
BA Benzaldehyde
PA Pyrimidylaldehyde
CA Cinnamaldehyde
IR Infra red
XRD X-ray diffraction
13
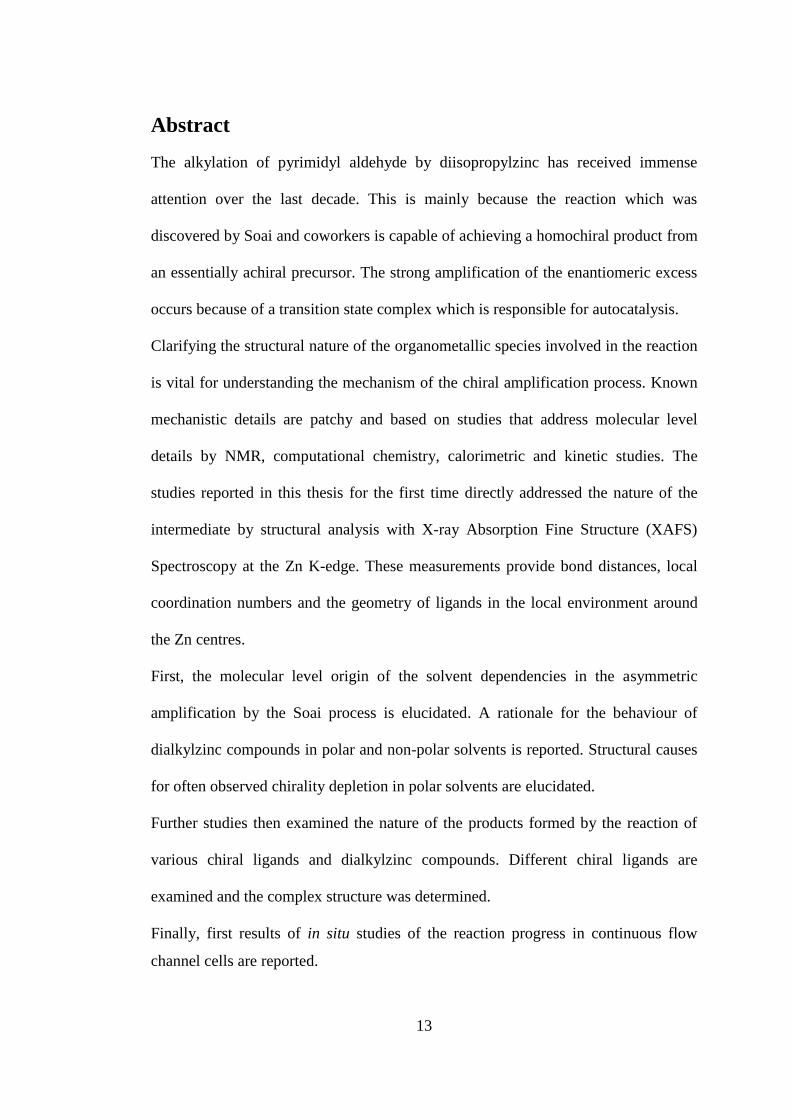
Abstract
The alkylation of pyrimidyl aldehyde by diisopropylzinc has received immense
attention over the last decade. This is mainly because the reaction which was
discovered by Soai and coworkers is capable of achieving a homochiral product from
an essentially achiral precursor. The strong amplification of the enantiomeric excess
occurs because of a transition state complex which is responsible for autocatalysis.
Clarifying the structural nature of the organometallic species involved in the reaction
is vital for understanding the mechanism of the chiral amplification process. Known
mechanistic details are patchy and based on studies that address molecular level
details by NMR, computational chemistry, calorimetric and kinetic studies. The
studies reported in this thesis for the first time directly addressed the nature of the
intermediate by structural analysis with X-ray Absorption Fine Structure (XAFS)
Spectroscopy at the Zn K-edge. These measurements provide bond distances, local
coordination numbers and the geometry of ligands in the local environment around
the Zn centres.
First, the molecular level origin of the solvent dependencies in the asymmetric
amplification by the Soai process is elucidated. A rationale for the behaviour of
dialkylzinc compounds in polar and non-polar solvents is reported. Structural causes
for often observed chirality depletion in polar solvents are elucidated.
Further studies then examined the nature of the products formed by the reaction of
various chiral ligands and dialkylzinc compounds. Different chiral ligands are
examined and the complex structure was determined.
Finally, first results of in situ studies of the reaction progress in continuous flow
channel cells are reported.

14
Declaration
The following four notes on copyright and the ownership of intellectual property
rights must be included as written below:
(1) The author of this thesis (including any appendices and/or schedules to this
thesis) owns certain copyright or related rights in it (the “Copyright”) and
s/he has given the University of Manchester certain rights to use such
Copyright, including for administrative purposes.
(2) Copies of this thesis, either in full or in extracts and whether in hard or
electronic copy, may be made only in accordance with Copyright, Designs
and Patents Act 1988 (as amended) and regulations issued under it or where
appropriate, in accordance with licensing agreements which the University
has from time to time. This Page must form part of any such copies made.
(3) The ownership of certain Copyright patents, designs, trademarks and any and
all other intellectual property rights except for the copyright (the “Intellectual
Property Rights”) and any reproductions of copyright works, for example
graphs and tables (“Reproductions”), which may be described in this thesis,
may not be owned by the author and may be owned by thirds parties. Such
Intellectual Property Rights and Reproductions cannot and must not be made
available for use without the prior written permission of the owner(s) of the
relevant Intellectual Property Rights and/or Reproductions.
(4) Further information on the conditions under which disclosures and
commercialization of this thesis, the Copyright and any Intellectual Property
and/or Reproductions described in it may take place is available in the
University IP policy (see
http:/www.campus.manchester.ac.uk/medialibrary/policies/intellectualpropert
y.pdf) in any relevant Thesis restriction declarations deposited in the
University Library. The University Library‟s regulation (see
http:www.manchester.ac.uk/library/aboutus/regulations) and in the
University's policy on presentation of theses.
15
Acknowledgements
I dedicate this work to my parents Anthony Nforba Nchari of blessed memory and
Mary Kinyuy Nchari.
I owe my deepest gratitude to my honorific supervisor, Dr Sven L.M. Schroeder who
accepted me as a PhD student in his group. His wisdom, knowledge and commitment
inspired and motivated me.
I extend thanks to the Engineering and Physical Science Research Council for
awarding me a scholarship to pursue this research degree. This opportunity has given
me the possibility to engage in funded research.
I also appreciate the support of the International Union of Crystallography and the
University of Manchester in granting me a scholarship to attend and present during
the XAFS 14 International Conference in Camerino, Italy. I also appreciate
supported provided by Leech trust towards my PhD.
I am grateful to Drs Guy Hembury, Angela Beesley, Nick Lockyer and Norbert
Weiher. Their mentorship was paramount in providing a well rounded experience.
I am also indebted to Professors Pat Bailey and his research assistants in the
University of Manchester: Dr Ben Lam and Dr Richard Price. My access to their
laboratory and resources was vital in appreciating the chemistry of the Soai reaction.
I am also thankful to Professor Stephan Braese and Sefer Ay of the Technical
University of Karlsruhe, Germany for their excellent collaboration.
Special thanks goes to the beam line scientists at APS (Argonne-USA), ESRF
(Grenoble-France), ANKA (Karlsruhe-Germany), SRS (Daresbury-UK) and Maxlab
(Lund-Sweden) who provided immense assistance.

16
Special thanks as well to my PhD student colleagues: David Meehan, Matthew
Thomason, Hamizah Mohd Zaki, Joanna Stevens, Vicky Fawcett, Matthew Hudson,
Nikolaos Tsapataris, Hamid Esfahanian who created a fun and stimulating
environment necessary for growth in learning.
I appreciate the collaboration of MSc students I supervised: Devon Indar and
Mahmoud Gawish. They both worked intensively on the kinetic simulation of the
Soai Autocatalytic Reaction and showed keen interest.
I owe great thanks to my family and friends. This especially goes to my lovely wife,
daughter, brother, sister, cousins and in laws, who have been a great source of
encouragement and enthusiasm.

17
1. Introduction
The remarkable Soai autocatalytic reaction which is capable of amplifying chirality
is the main focus of this project. This thesis for the first time examines the
mechanism underlying chiral amplification in asymmetric synthesis mainly using X-
ray absorption spectroscopy. This reaction which has intrigued numerous scientists
begins with a very minute enantiomeric excess in the chiral initiator (4) which
catalyses its own formation in greatly amplified enantiomeric excess (4).[1-6]
Figure 1.1: Soai autocatalytic reaction[1]
Prior to the details of this research, this chapter embarks on the principles of
stereoisomerism and conventional approaches of generating chiral compounds.
1.1 Enantiomers and chiral molecules
Stereochemistry (Greek: stereos, solid) considers the geometry of molecules in three
dimensions. Stereoisomerism describes compounds that have the same chemical
formula but a geometrically different arrangement of the atoms in space.
Enantiomers are a subset of stereoisomers as seen in the classification below (Figure
1.2)[2]
. An enantiomer is one of two stereoisomers that are chiral, i.e., they are mirror
18
images of each other are "non-superposable" (not identical), similar to one's left and
right hands are "the same" but opposite. The word chiral is derived from the Greek
word cheir, which meanings “hand.” The expression chiral, describes molecules of
enantiomers since they are related in the same manner that a right hand is related to a
left hand.[3]
Samples with molecules of the same chirality are enantiopure compounds.
Enantiomers can be distinguished using different nomenclature. The nomenclature
initially used was (+) and (-) signs or d(dextro) or l(levo). (+) or d(dextro) implies
rotation of plane polarized light to the right (clockwise) and (-) or l(levo) to the left
or anticlockwise. The notation which has almost replaced the d/l notation is the
Cahn-Ingold-Prelog (CIP) convention. Instead R and S are assigned according to CIP
in which the order of priority of the substituents on the centre of chirality is
determined on the basis of decrease in the atomic number of the atoms directly
bonded to the centre of chirality. The heaviest atomic number is given the highest
priority.[4]
19
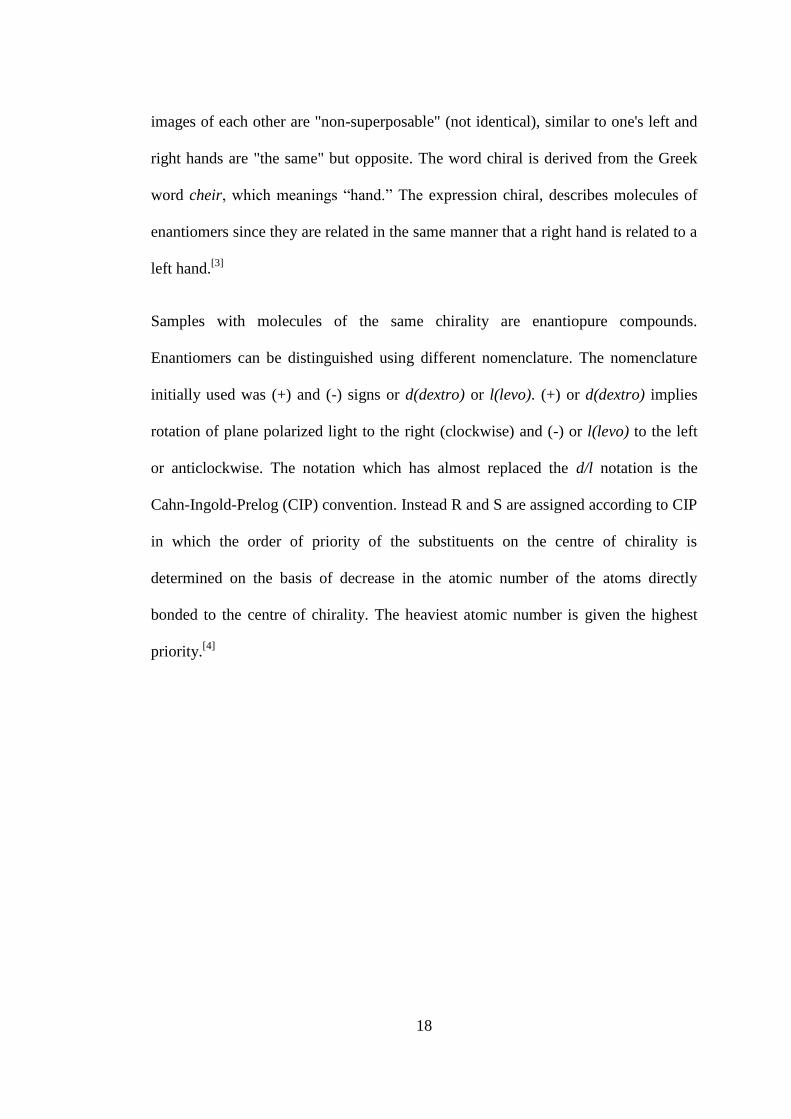
Figure 1.2: Subdivision of isomers.[3]
The chirality of simple molecules can be illustrated with 2-butanol,
CH3CH(OH)CH2CH3. Molecules of 2-butanol are chiral because their enantiomers
are non-superimposable as shown in the models in Fig. 1.3.
ISOMERS
(Different compounds with same molecular
formula)
STEREOISOMERS
(Isomers that have the same connectivity but
differ in the arrangement of their atoms in space)
ENANTIOMERS
(Stereoisomers that are nonsuperposable mirror images of each other)
DIASTEREOMERS
(Stereoisomers that are not mirror images of each
other)
CONSTITUTIONAL ISOMERS
(Isomers whose atoms have different connectivity)

20
Figure 1.3: (a) Models of 2-Butanol enantiomers. (b) Non superimposable models
A pair of enantiomers can be recognized by the attachment of four different groups
to the stereocenter which in the illustration above is carbon (blue). One enantiomer is
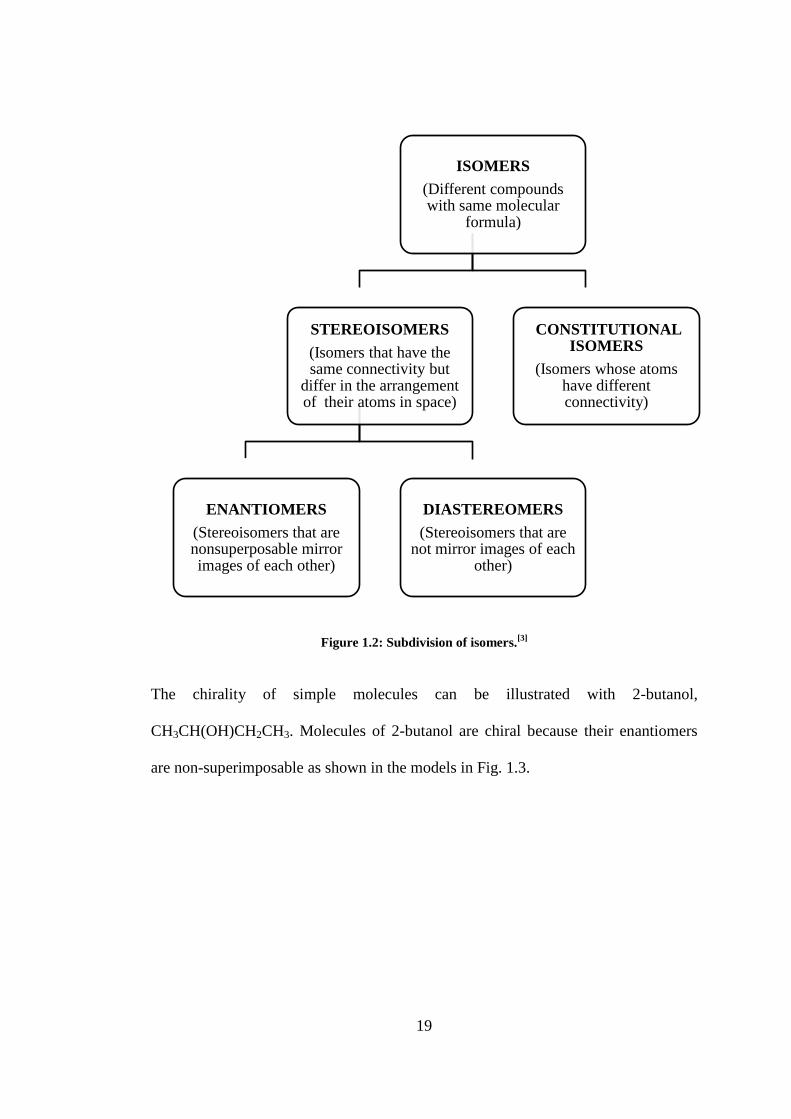
21
a non-superimposable mirror image of the other as seen in the three dimensional
illustration below.
Mirror
Figure 1.4: Relationship of enantiomers
Both enantiomers have different spatial arrangements and consequently cannot be
superimposed on each other.
1.2 Enantiomerism: the discovery
Optical isomerism was discovered by the French chemist Jean-Baptiste and has been
known since 1815. Louis Pasteur discovered enantiomerism and is the founder of
stereochemistry. His discovery resulted from the separation of a racemic form of
tartaric acid in 1848 at Ecole Normale in Paris. Pasteur repeated the early work of a
chemist on salts of tartaric acid and found something nobody had noticed. He found
that optically inactive ammonium tartrate existed as a mixture of two types of
crystals which were mirror images of each other. Pasteur used a hand lens and a pair
of tweezers to separate the mixture into two: one right handed and the other left
handed crystals. The original mixture was found optically inactive, the separated
piles of crystals dissolved in water were found to be active. In addition it was noticed
that the specific rotation of both solutions were equal but opposite in sign. Pasteur
concluded that it was a property not of the crystals but the molecules since the
22
distinction in optical activity was noticed in solution. He then proposed that the two
piles of crystals were composed of molecules which were mirror images to each
other. Pasteur proposed the existence of isomers that have differing mirror images
with a difference in the direction of rotation of plane polarized light. The discovery
of enantiomerism by Louis Pasteur led to the proposal of a tetrahedral structure of
carbon by van‟t Hoff and Le Bel in 1874. Van‟t Hoff in 1901 was the first recipient
of the Nobel Prize in Chemistry.[2, 3]
1.3 The biological importance of chirality
Out of the 20 amino acids that make up naturally occurring proteins all but one are
chiral. All naturally occurring amino acids are left handed. On the other hand
naturally occurring sugars are right handed.[3, 5-7]
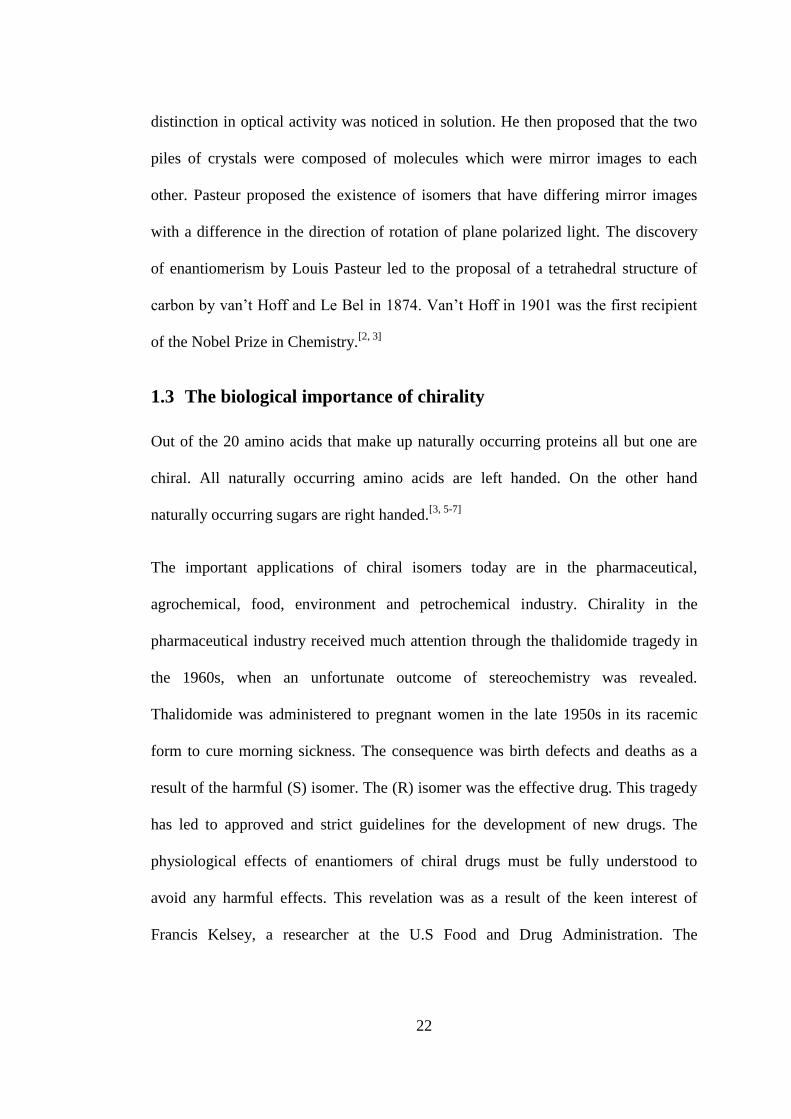
The important applications of chiral isomers today are in the pharmaceutical,
agrochemical, food, environment and petrochemical industry. Chirality in the
pharmaceutical industry received much attention through the thalidomide tragedy in
the 1960s, when an unfortunate outcome of stereochemistry was revealed.
Thalidomide was administered to pregnant women in the late 1950s in its racemic
form to cure morning sickness. The consequence was birth defects and deaths as a
result of the harmful (S) isomer. The (R) isomer was the effective drug. This tragedy
has led to approved and strict guidelines for the development of new drugs. The
physiological effects of enantiomers of chiral drugs must be fully understood to
avoid any harmful effects. This revelation was as a result of the keen interest of
Francis Kelsey, a researcher at the U.S Food and Drug Administration. The
23
restriction of thalidomide from the work of Kelsey was due the high rate of abortions
in rats.[8-10]
(S) – Thalidomide (R) - Thalidomide
Figure 1.5 Chiral forms of Thalidomide
Some reasons for synthesizing optically active pure materials are:
i. The biologically activity may be attributed to only one enantiomer.
ii. The separation of effects of differing enantiomers; both of which may be
beneficial or one may be beneficial and the other not.
iii. Some optical active compounds are twice as active as the racemate due to
antagonism.
iv. Some enantiomers, when compared to their racemates, possess physical
properties which may give development and formulation advantages.
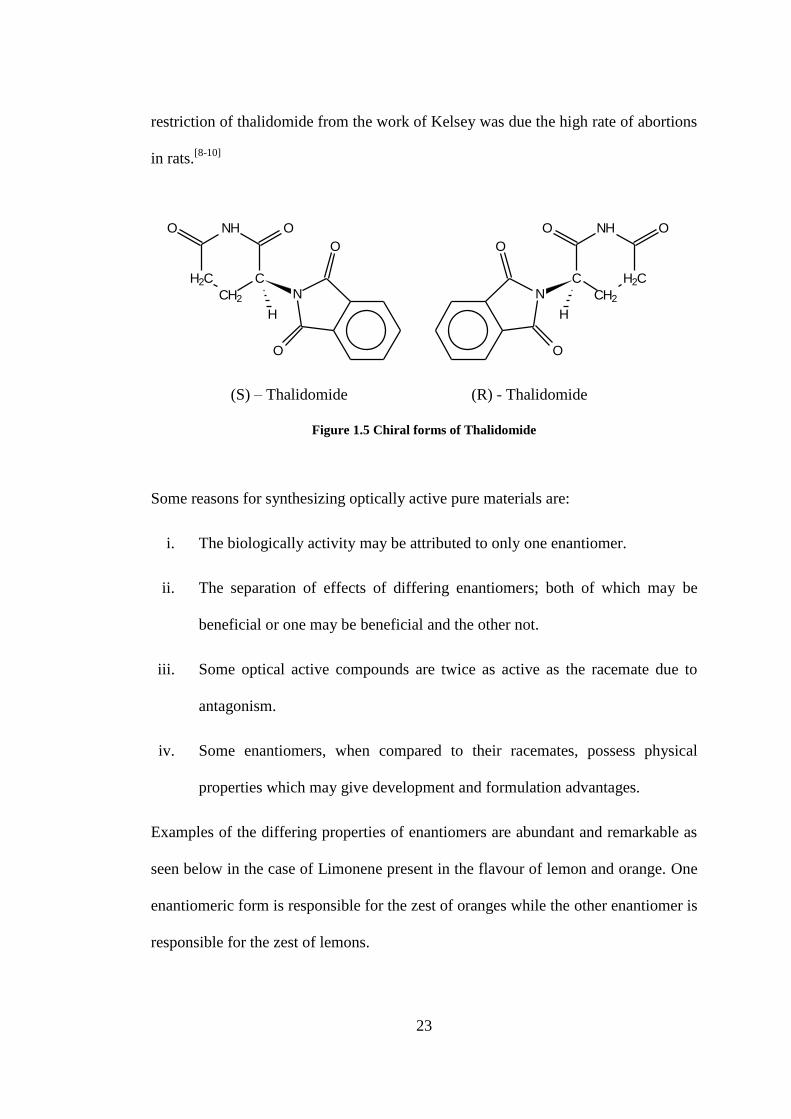
Examples of the differing properties of enantiomers are abundant and remarkable as
seen below in the case of Limonene present in the flavour of lemon and orange. One
enantiomeric form is responsible for the zest of oranges while the other enantiomer is
responsible for the zest of lemons.
H2C
CH2
C
NH OO
H
N
O
O
H2C
CH2
C
NHO O
H
N
O
O
24
R-Limonene (Lemon) S-Limonene (Orange)
Figure 1.6: Chiral forms of Limonene in Lemon and Orange
1.4 The physical properties of stereoisomers
Two enantiomers possess different physical properties which include melting point,
boiling point, solubility, similar IR and NMR spectra. These properties do not
include how they differ in plane polarized light. As previously seen, chiral molecules
have non superimposable mirror images contrary to achiral compounds which are
superimposable.[9]
Several compounds may be found in two forms with a different
molecular three dimensional geometry that are mirror images. Both forms are
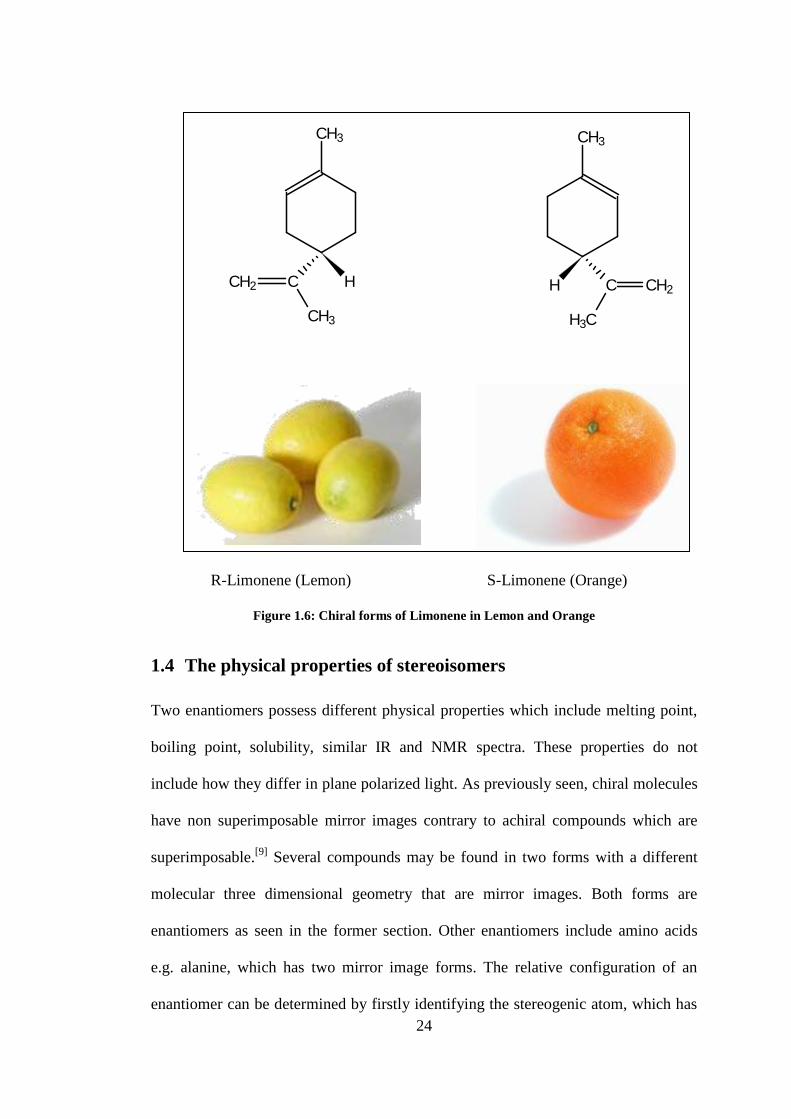
enantiomers as seen in the former section. Other enantiomers include amino acids
e.g. alanine, which has two mirror image forms. The relative configuration of an
enantiomer can be determined by firstly identifying the stereogenic atom, which has
CH3
HCCH2
CH3
CH3
H C CH2
H3C
25
non identical groups attached. In the case of alanine, the central carbon atom bears
four different groups.[11-13]
Figure 1.7 S-Stereoconfiguration of alanine[11]
Enantiomers however differ in the rotation of plane polarized light and this is the
basis of the nomenclature of enantiomers. Plane polarized light rotation is measured
by a polarimeter as seen below, where the angle of rotation (α) is defined as:
[α]D = αobs/lc 1.1
[α]D is the specific rotation at a specific temperature of the D-line of sodium light;
αobs is the observed angle of rotation; l is the length of the medium (decimetres) and c
is the concentration of the medium (g/dm3).
HNH2
H2NCOH2NCOCH2 COOH
26
Figure 1.8 Schematic of a polarimeter
The enantiomeric excess, which is often used to measure the optical purity of chiral
compounds, is calculated as following equation where [R] > [S]:
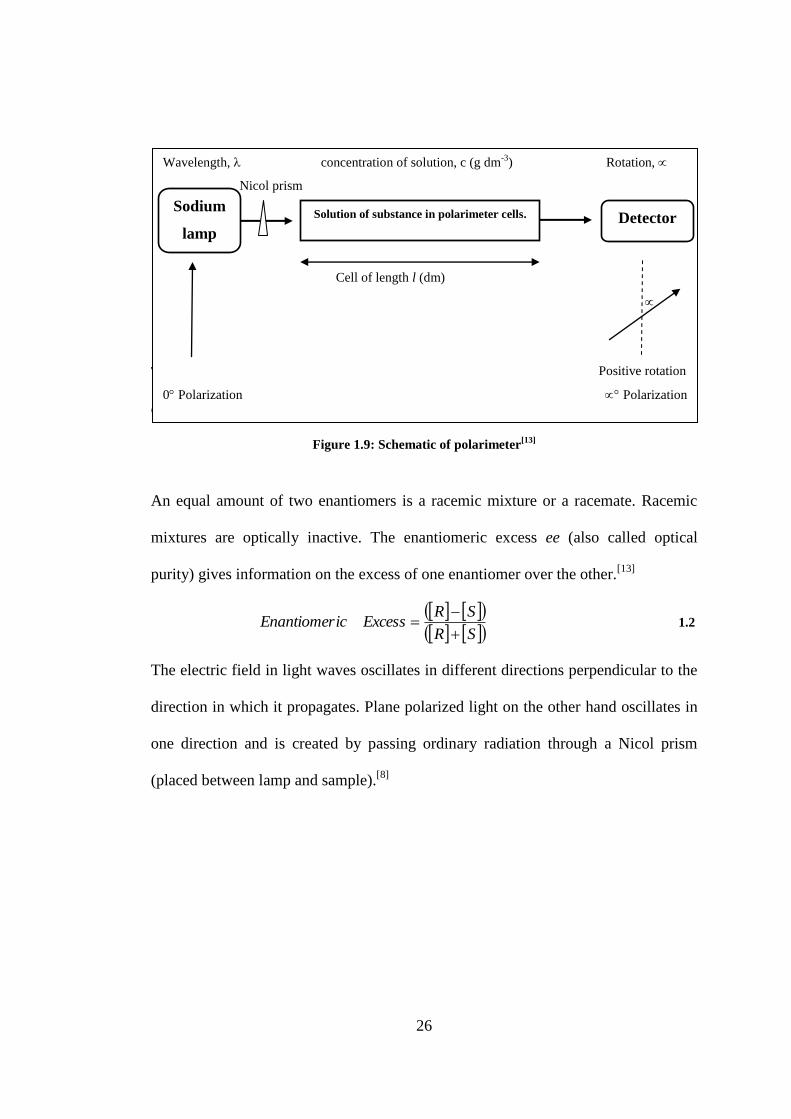
Figure 1.9: Schematic of polarimeter[13]
An equal amount of two enantiomers is a racemic mixture or a racemate. Racemic
mixtures are optically inactive. The enantiomeric excess ee (also called optical
purity) gives information on the excess of one enantiomer over the other.[13]
SR
SRExcessicEnantiomer
1.2
The electric field in light waves oscillates in different directions perpendicular to the
direction in which it propagates. Plane polarized light on the other hand oscillates in
one direction and is created by passing ordinary radiation through a Nicol prism
(placed between lamp and sample).[8]
Wavelength, concentration of solution, c (g dm-3
) Rotation,
Nicol prism
Cell of length l (dm)
Positive rotation
0 Polarization Polarization
Sodium
lamp Detector Solution of substance in polarimeter cells.

27
1.5 Chemical properties of enantiomers
The rate of reaction of two enantiomers with an achiral molecule is the same.
However, the rate of reaction changes when they react with chiral or non racemic
reagents. In this section some applications will be visited. Living organisms are
composed of chiral molecules. Most drugs which are chiral must interact with a
chiral receptor or chiral enzyme to be effective. One enantiomer has the potential of
curing an illness whereas the other does not. (S)-Ibuprofen is the active substance in
Motrin and Advil (both anti inflammatory agents). (R)-Fluoxetine is the active
ingredient of Prozac (antidepressant).
Figure 1.10: (S)-Ibuprofen (left), antiinflammatory and (R)-Fluoxetine (right),
antidepressant.[13]
(S)-Naproxen is also an anti-inflammatory agent, but the (R) enantiomer has been
established to be harmful to the liver. Because of the change in orientation of both
enantiomers the biological activity is modified leading to unwanted side effects. The
sale of chiral drugs would be preferred to be delivered as the single active
enantiomer. The process of separating from a racemic mixture is rather expensive
and would be reflected on the sale of chiral drugs.
O
OH
O
CF3
NHMe

28
In addition to chiral drugs, enantiomers have a specific odour. This is caused by their
shape. Hexachloroethane and cyclophane are dissimilar in structure but have a
similar odour because of their similarity in shape.
Figure 1.11: Structure and shape of hexachloroethane (left) and cyclooctane (right).[13]
The difference in smell is caused by the difference in interaction of the enantiomers
with chiral receptors in the nose. An example is seen in Figure 1.6 which shows the
chiral forms of limonene found in lemon and orange. The enantiomers are
responsible for the difference in odour and taste.
1.6 Methods of obtaining optically active compounds
The pharmaceutical industry remains the key driver for chiral compound
development with an estimated 80% of chiral intermediates and related products
going into the pharmaceutical market.[8]
15% of optical active intermediates are used
in chemical building blocks, auxiliaries or advanced intermediates. The fraction of
chiral compounds in the pharmaceutical industry will increase with the enforcement
of the stricter regulations by the US Food and Drug Administration (FDA).
Authorities responsible for the registration of new active compounds have
emphasized the demand to increase the targeted synthesis of one enantiomer. The
FDA and the European Committee for Proprietary Medicinal Products since 1992
have stipulated that the physiological action of each enantiomer must be fully

29
understood. In addition since 1997 the emergence of the fast track single isomer
program of FDA has been a driving force for pharmaceutical companies to convert
racemic active compounds into enantiomerically pure forms. This trend is also found
in the agrochemical industry in order to improve economics and reduce quantities
applied, thus reducing the environmental impact.
The synthesis of active pharmaceutical and agricultural products can be achieved
from optically active important compounds which include amines, alcohols and
carboxylic acids. The development of new technologies focuses on large scale
industrial processes prior to previous times. This has opened up new opportunities
and economically attractive methods for the production of optically active
compounds.[14]
Three primary sources of pure enantiomers include:
i. Extraction of naturally occuring molecules from plants.
ii. By the de novo fermentation process of inexpensive available
feedstocks.
iii. Synthesis of optically active compounds from the above two or
prochiral starting materials.
The above three methods are schematically characterized below.
30
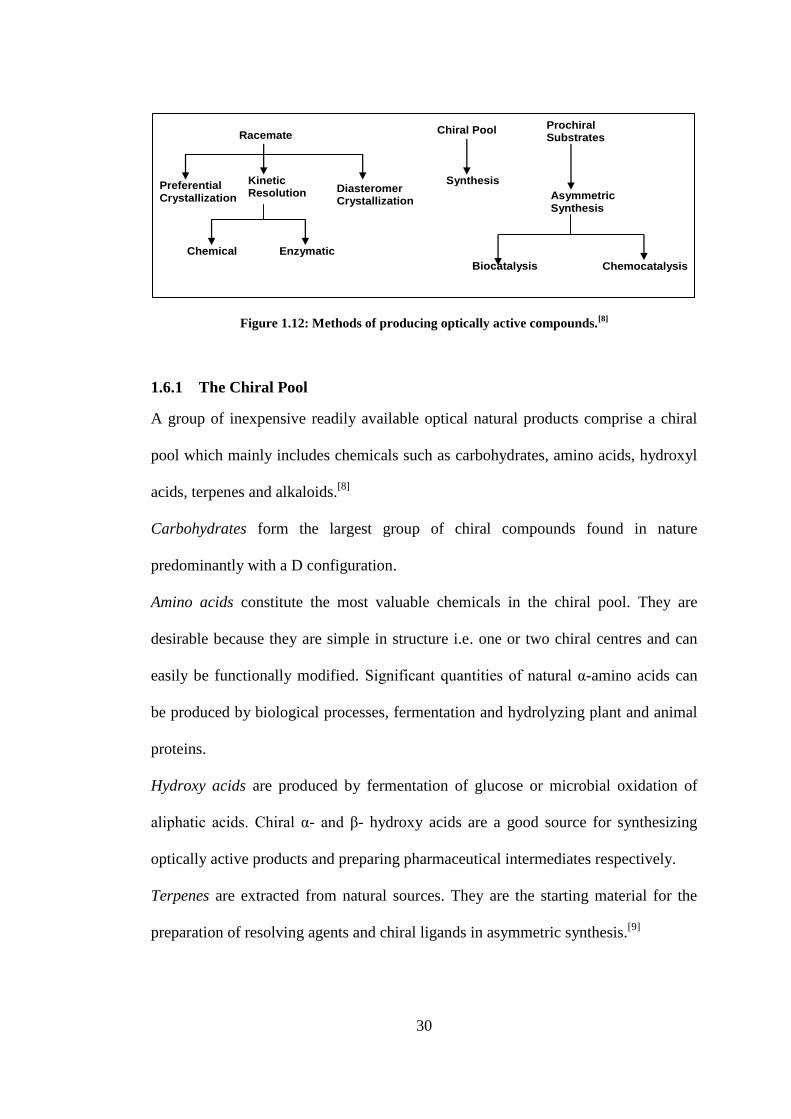
Figure 1.12: Methods of producing optically active compounds.[8]
1.6.1 The Chiral Pool
A group of inexpensive readily available optical natural products comprise a chiral
pool which mainly includes chemicals such as carbohydrates, amino acids, hydroxyl
acids, terpenes and alkaloids.[8]
Carbohydrates form the largest group of chiral compounds found in nature
predominantly with a D configuration.
Amino acids constitute the most valuable chemicals in the chiral pool. They are
desirable because they are simple in structure i.e. one or two chiral centres and can
easily be functionally modified. Significant quantities of natural α-amino acids can
be produced by biological processes, fermentation and hydrolyzing plant and animal
proteins.
Hydroxy acids are produced by fermentation of glucose or microbial oxidation of
aliphatic acids. Chiral α- and β- hydroxy acids are a good source for synthesizing
optically active products and preparing pharmaceutical intermediates respectively.
Terpenes are extracted from natural sources. They are the starting material for the
preparation of resolving agents and chiral ligands in asymmetric synthesis.[9]
Racemate
Preferential Crystallization
Kinetic Resolution Diasteromer
Crystallization
Chemical Enzymatic
Chiral Pool
Synthesis
Prochiral Substrates
Asymmetric Synthesis
Biocatalysis Chemocatalysis

31
Alkaloids are the most expensive compounds of the chiral pool. They are extracted
from plants and are used primarily in resolving racemic mixtures. Their use in
asymmetric synthesis as chiral ligands is growing.
Table 1.1 Representative substances from the chiral pool[9]
1.6.2 Separation of enantiomers
The separation of enantiomers can be achieved by four resolution processes which
include preferential crystallization, diastereomeric salt crystallization, kinetic
resolution and HPLC.
Preferential crystallization, separates racemates that exist as a conglomerate. Only
10% of all compounds, exists as conglomerates implying that this technique is not
usable for the other 90% of racemates referred to as racemic compounds. The
process involves the pumping of a supersaturated solution through chambers in
contact with crystals of the pure isomers responsible for seeding. The removed
Compound Price, US ($/kg)
Ascorbic acid 13
(+)- Calcium pantothenate 16
(-)- Carvone 23
Ephedrinehydrochloride 62
(+)- Limonene 3
L-Lysine 3.2
L-Tryptophan 68
Quinidine sulphate 130
Quinine sulphate 75
L-Threonine 12-50
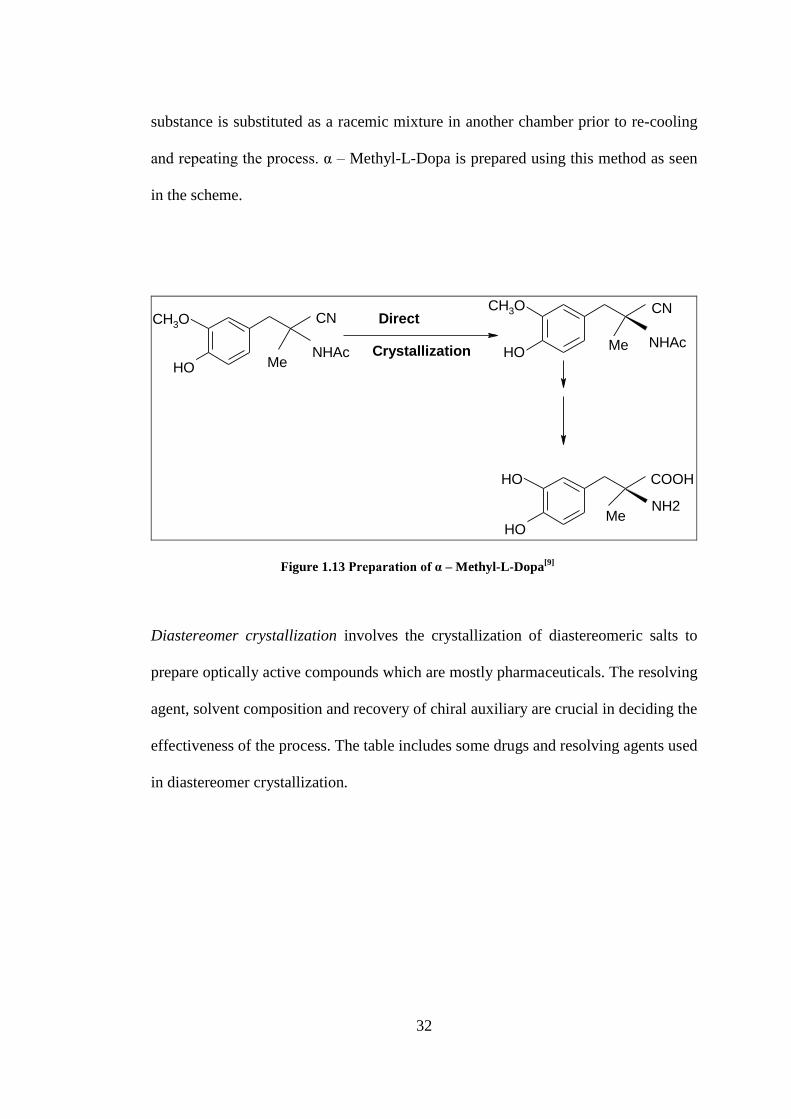
32
substance is substituted as a racemic mixture in another chamber prior to re-cooling
and repeating the process. α – Methyl-L-Dopa is prepared using this method as seen
in the scheme.
NHAc
CN
HO
CH3O Direct
CrystallizationMe
Me NHAc
CN
NH2
HO
HOMe
COOH
CH3O
HO
Figure 1.13 Preparation of α – Methyl-L-Dopa[9]
Diastereomer crystallization involves the crystallization of diastereomeric salts to
prepare optically active compounds which are mostly pharmaceuticals. The resolving
agent, solvent composition and recovery of chiral auxiliary are crucial in deciding the
effectiveness of the process. The table includes some drugs and resolving agents used
in diastereomer crystallization.

33
Drug Resolving Agent Activity
Ampicillin D-camphosulfonic
Acid
Antibiotic
Ethambutol L-(+)-tartaric Acid Tuberculostatic
Choramphenicol D-camphosulfonic
Acid
Anti-infective
Fosfomycin R-(+)-phenethylamine Antibiotic
Thiampenicol D-(-)-tartaric Acid Antiinfective
Naproxen Cinchonidine Anti-
inflammatory
Diltiazem R-(+)-phenethylamine Calcium
antagonist
Table 1.2: Drugs prepared via Classical Resolution[9]
Kinetic resolution is another method of resolving enantiomers. One enantiomer
reacts quicker than the other resulting in two products i.e. an unreacted enantiomer
and a formation of a new product. The purity of the wanted enantiomer is influenced
by the degree of conversion. This method is both chemically and enzymatically
possible. An example of this is Sharpless epoxidation as seen in the scheme below.
OHOH
H+
TBHP
Ti(OiPr4)
DIPTH
OH
>96%
TBHP = t-butylhydroperoxideTi(OiPr4) = titanium (IV) isoproxideDIPT = diisopropyl tartrate
O
Figure 1.14: Epoxidation reaction of only one enantiomer[9]
34
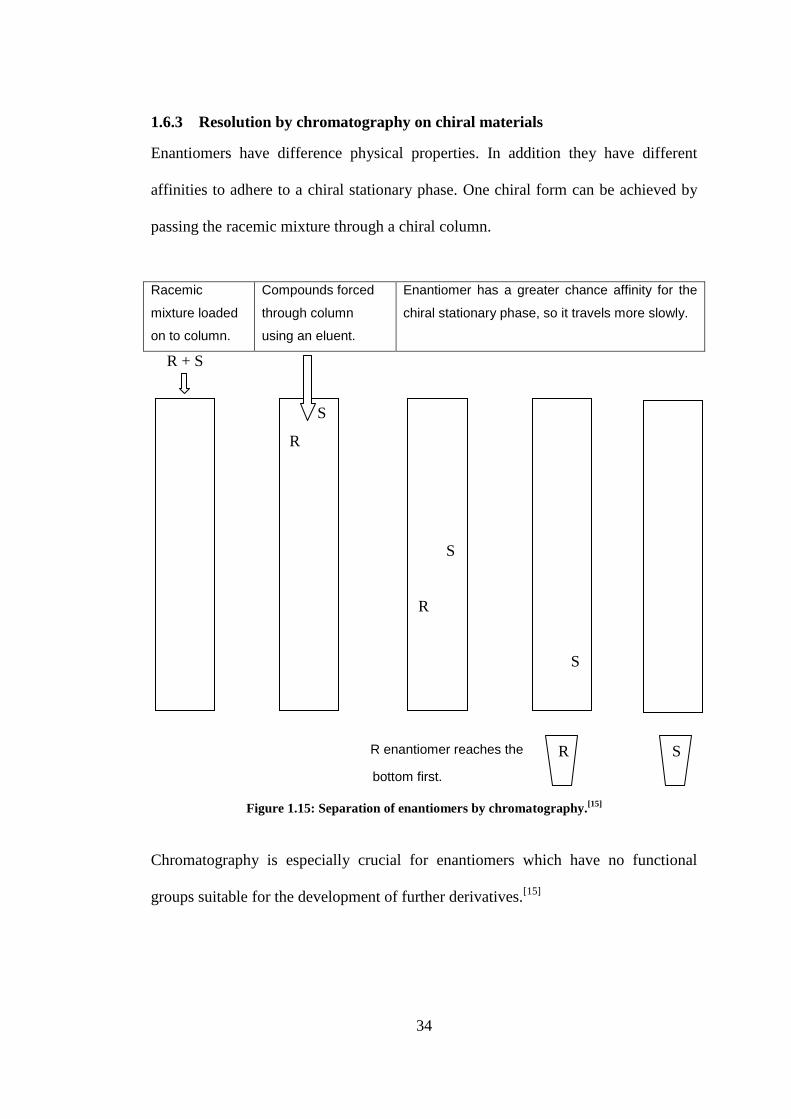
1.6.3 Resolution by chromatography on chiral materials
Enantiomers have difference physical properties. In addition they have different
affinities to adhere to a chiral stationary phase. One chiral form can be achieved by
passing the racemic mixture through a chiral column.
Racemic
mixture loaded
on to column.
Compounds forced
through column
using an eluent.
Enantiomer has a greater chance affinity for the
chiral stationary phase, so it travels more slowly.
R + S
R enantiomer reaches the
bottom first.
Figure 1.15: Separation of enantiomers by chromatography.[15]
Chromatography is especially crucial for enantiomers which have no functional
groups suitable for the development of further derivatives.[15]
S
R
S
S
R
R S

35
1.6.4 Asymmetric synthesis
Asymmetric synthesis is the main method studied in this research study. Prochiral
substrates are converted into optically active compounds.
Figure 1.16: Asymmetric synthesis scheme
This reaction could either be homogeneous or heterogeneous. Organometallic
catalysts have a wider reactivity application compared to enzymes. Catalysts are
more stable and have higher levels of enantioselectivity. Transition metals are
predominantly used as catalysts in asymmetric synthesis for the following reasons:
i. The existence of several different oxidation states permits the addition and
elimination of substrates, reactants and products.
ii. Transition metals coordinate to ligands and ascertain stereo- and
regioselectivity.
They possess the ability to stabilize reactive intermediates which are not
probable via other synthetic methods.
R
A
AR1
R
A
R1 B
XR
R1
+ AB
R
R1
A
X B
36
2. Asymmetric Autocatalysis
This section explains the principles of asymmetric autocatalysis and some important
reaction examples. It includes different models that describe the process of
amplifying chirality. Frank postulated an autocatalytic process for the amplification
of chirality in the 1950s, even though no actual reaction capable of amplifying
chirality was known at the time.[16]
Kagan and coworkers later discovered the first
examples of reactions in which positive nonlinear effects achieve the amplification of
chirality.[17]
Noyori successfully studied the positive nonlinear effect of the
alkylation of benzaldehyde in the presence of a chiral catalyst.[18]
Finally, the
autocatalytic asymmetric reaction developed by Soai and coworkers will be explored
because it is the focus of the investigations in this thesis.[1, 19-27]
Central to a discussion of chiral amplification is the concept of the enantiomeric
excess, ee (see equation 1.2). It can vary from 0 (100% racemic) to 1 (100%
enantiopure). In asymmetrical stereoselective synthesis, enantiomeric excess of the
product (eeprod) is not always proportional to that of the auxiliary (eeaux), as shown in
the equation below.
2.1
Whereby,
eeprod = ee in reaction product
ee0 = ee in reaction product if enantiopure reagents are used (normally 100%)
eeaux = ee of chiral auxiliary
A graphical representation is shown below that illustrates the linear relationship.[17]
auxprod eeeeee 0

37
Figure 2.1: Non-linear effects with partially resolved chiral auxiliaries[17]
From the above illustration, the deviation from linearity is either positive
(amplification) if the eeprod is higher than eeaux as seen in red curve or negative
(depletion) if the eeprod is lower than eeaux as seen in the green curve. The blue curve
represents the proportionality between eeprod and eeaux.
Systems that deviate from the linear relationship have a Non Linear Effect (NLE).
An excess in the ee of the product over the chiral catalysts is known as Positive
NLEs or (+)-NLEs. The studies presented in this thesis focus on such a system,
which possesses the potential of amplifying ee. The negative NLEs or (-)-NLEs on
the other hand represents a system with the chiral product having a lower ee than the
chiral catalyst as seen in the above figure.
2.1 Nonlinear Effects in Asymmetrical Stereoselective Reactions
The enantiomeric excess of the product, eeprod is not directly proportional to the
enantiomeric excess of the auxiliary, eeaux for most asymmetrical stereoselective
0
20
40
60
80
100
0 20 40 60 80 100
ee
pro
d/%
eeaux/%
Linear (proportionality between ee)
(+) nonlinear (asymmetric amplification)
(-) nonlinear (asymmetric depletion)
38
synthesis. The models below represent the special cases were non-linear
amplification effects are present.
2.1.1 The Frank Model
Frank proposed a mechanism for asymmetric autocatalysis decades before the Soai
reaction was discovered. His work led the way to feasible mechanism for asymmetric
autocatalysis. The mechanism was purely theoretical and not designed for any
particular chemical reaction.[16]
This mechanism is a plausible explanation of
homochirality as well as amplification of chirality in the Soai autocatalytic reaction.
Frank‟s mechanism describes the process as “a chemical substance which is a
catalyst for its own production and an anti-catalyst for the production of its optical
antimer.”[16]
His postulate suggests that if it is possible to suppress one reaction route
compared to the other, the ee multiplies increasingly as autocatalytic amplification
emphasizes. He describes the rate of increase of each enantiomer with the following
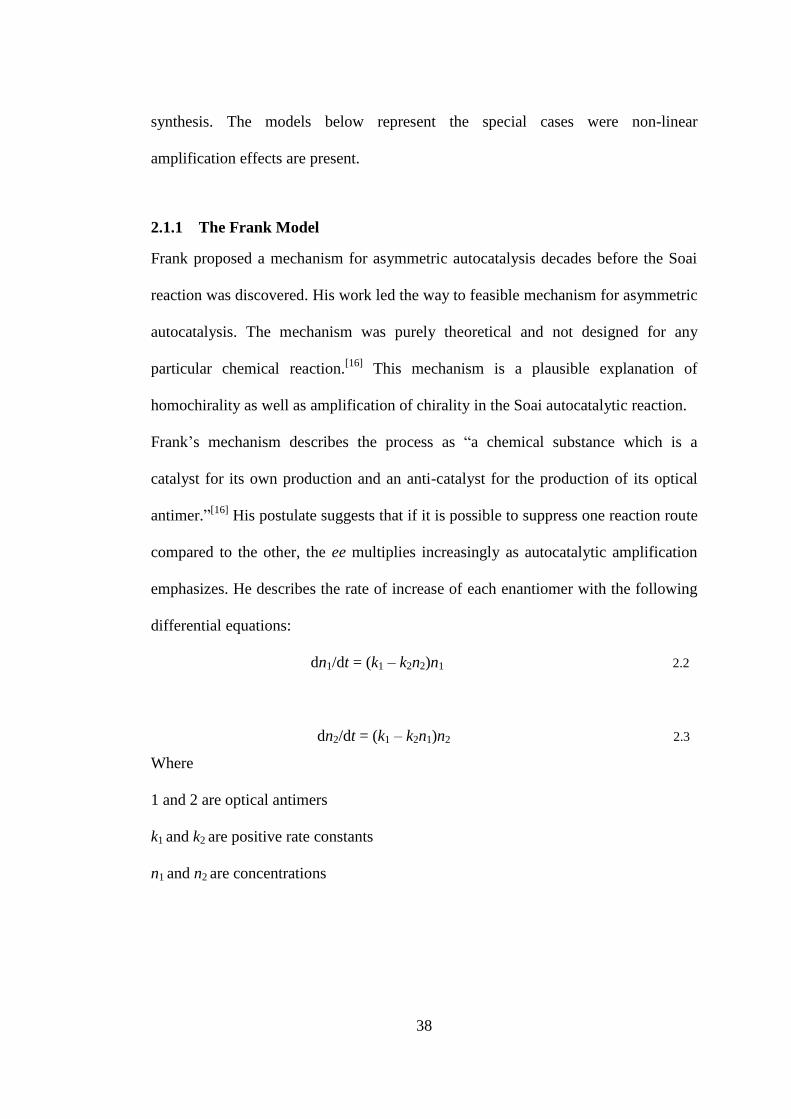
differential equations:
dn1/dt = (k1 – k2n2)n1 2.2
dn2/dt = (k1 – k2n1)n2 2.3
Where
1 and 2 are optical antimers
k1 and k2 are positive rate constants
n1 and n2 are concentrations
39
The negative terms of both equations represent the interaction parameters of the
enantiomers which may be considered for each enantiomer to decrease the rate of
formation of the opposite enantiomer.
Subtracting the above two equations we get:
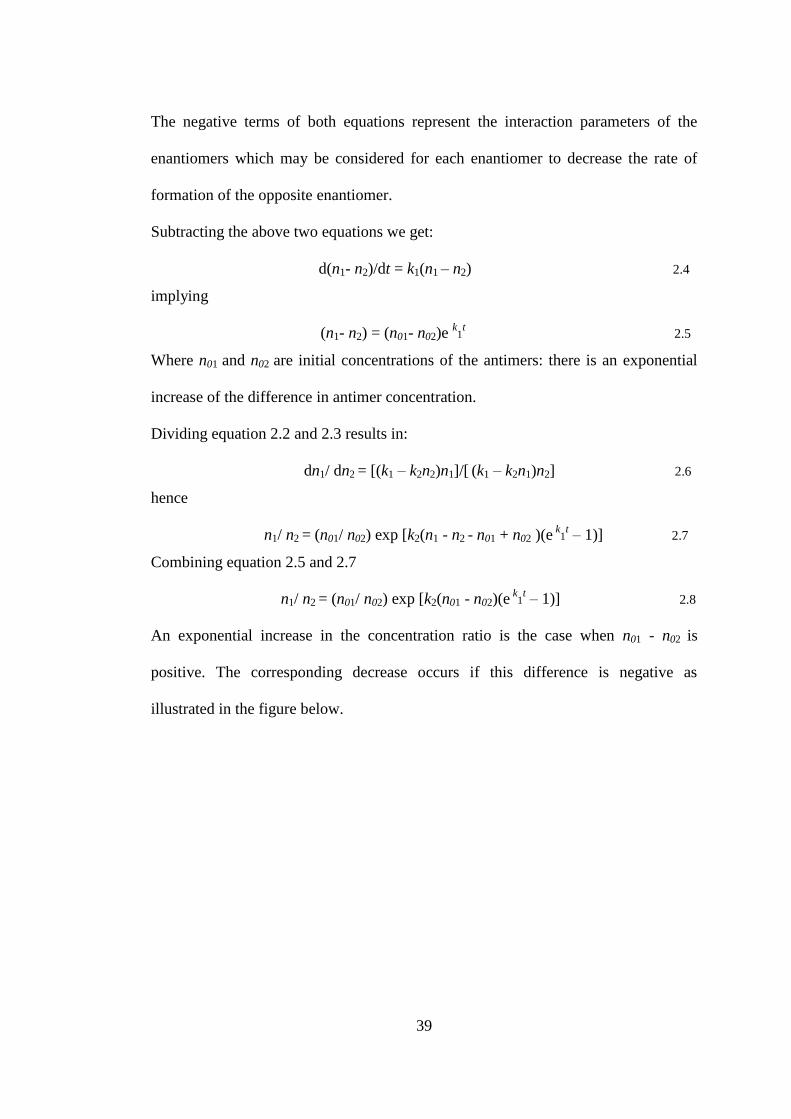
d(n1- n2)/dt = k1(n1 – n2) 2.4
implying
(n1- n2) = (n01- n02)e k1
t 2.5
Where n01 and n02 are initial concentrations of the antimers: there is an exponential
increase of the difference in antimer concentration.
Dividing equation 2.2 and 2.3 results in:
dn1/ dn2 = [(k1 – k2n2)n1]/[ (k1 – k2n1)n2] 2.6
hence
n1/ n2 = (n01/ n02) exp [k2(n1 - n2 - n01 + n02 )(e k
1t – 1)] 2.7
Combining equation 2.5 and 2.7
n1/ n2 = (n01/ n02) exp [k2(n01 - n02)(e k
1t – 1)] 2.8
An exponential increase in the concentration ratio is the case when n01 - n02 is
positive. The corresponding decrease occurs if this difference is negative as
illustrated in the figure below.

40
Figure 2.2: Sketch of general form of solutions of equations 2.2 and 2.3[16]
The above plot shows the relationship of time to the logarithm of the distance and the
distance from the line n1 = n2. The difference n1 – n2 increases significantly, however
there is always the possibility of a reverse in the sign of the difference. An analogy
demonstrating this statistical fluctuation is a marble running downhill which is likely
to find itself in the gutter on either side of the road. The marble on its path may
encounter pebbles which will displace to the opposite side, however it is likely to end
up at the side where it is at that time. Even though the travelling path of the marble
before finishing off in the gutter is infinite its statistical variation is very limited.[16,
28]
41
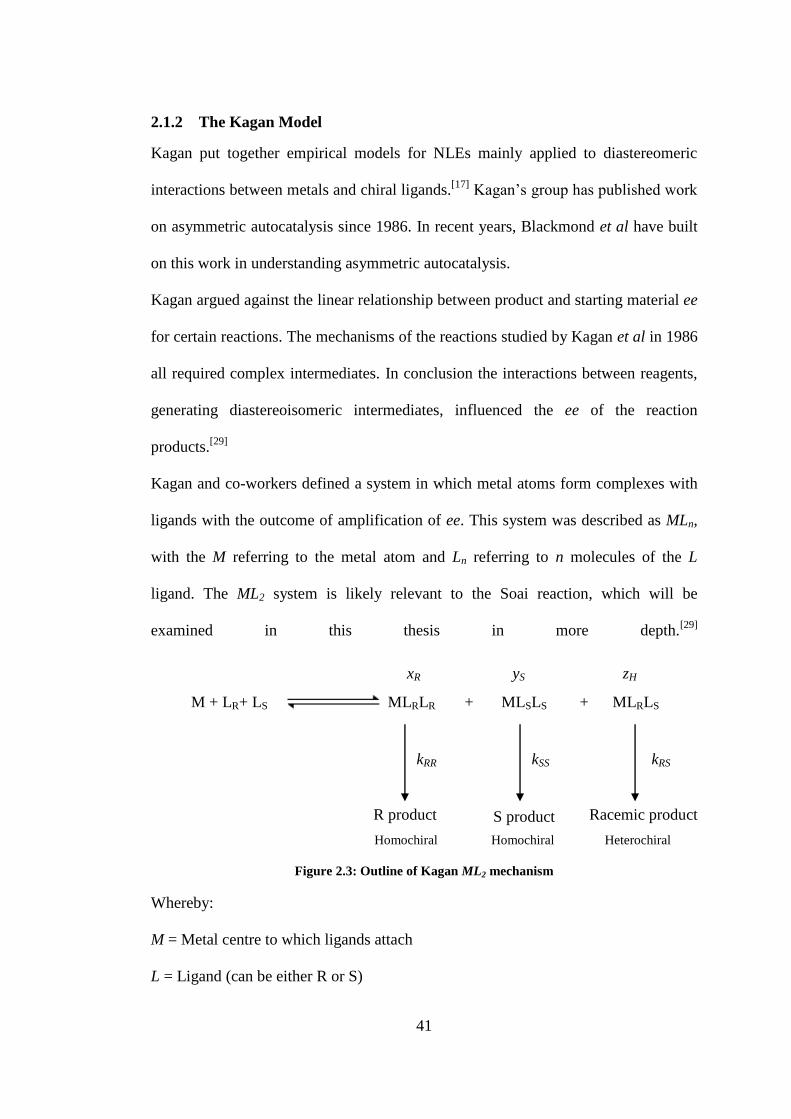
2.1.2 The Kagan Model
Kagan put together empirical models for NLEs mainly applied to diastereomeric
interactions between metals and chiral ligands.[17]
Kagan‟s group has published work
on asymmetric autocatalysis since 1986. In recent years, Blackmond et al have built
on this work in understanding asymmetric autocatalysis.
Kagan argued against the linear relationship between product and starting material ee
for certain reactions. The mechanisms of the reactions studied by Kagan et al in 1986
all required complex intermediates. In conclusion the interactions between reagents,
generating diastereoisomeric intermediates, influenced the ee of the reaction
products.[29]
Kagan and co-workers defined a system in which metal atoms form complexes with
ligands with the outcome of amplification of ee. This system was described as MLn,
with the M referring to the metal atom and Ln referring to n molecules of the L
ligand. The ML2 system is likely relevant to the Soai reaction, which will be
examined in this thesis in more depth.[29]
Homochiral Homochiral Heterochiral
Figure 2.3: Outline of Kagan ML2 mechanism
Whereby:
M = Metal centre to which ligands attach
L = Ligand (can be either R or S)
M + LR+ LS MLRLR + MLSLS + MLRLS
R product
S product
kRR kSS kRS
xR yS zH
Racemic product
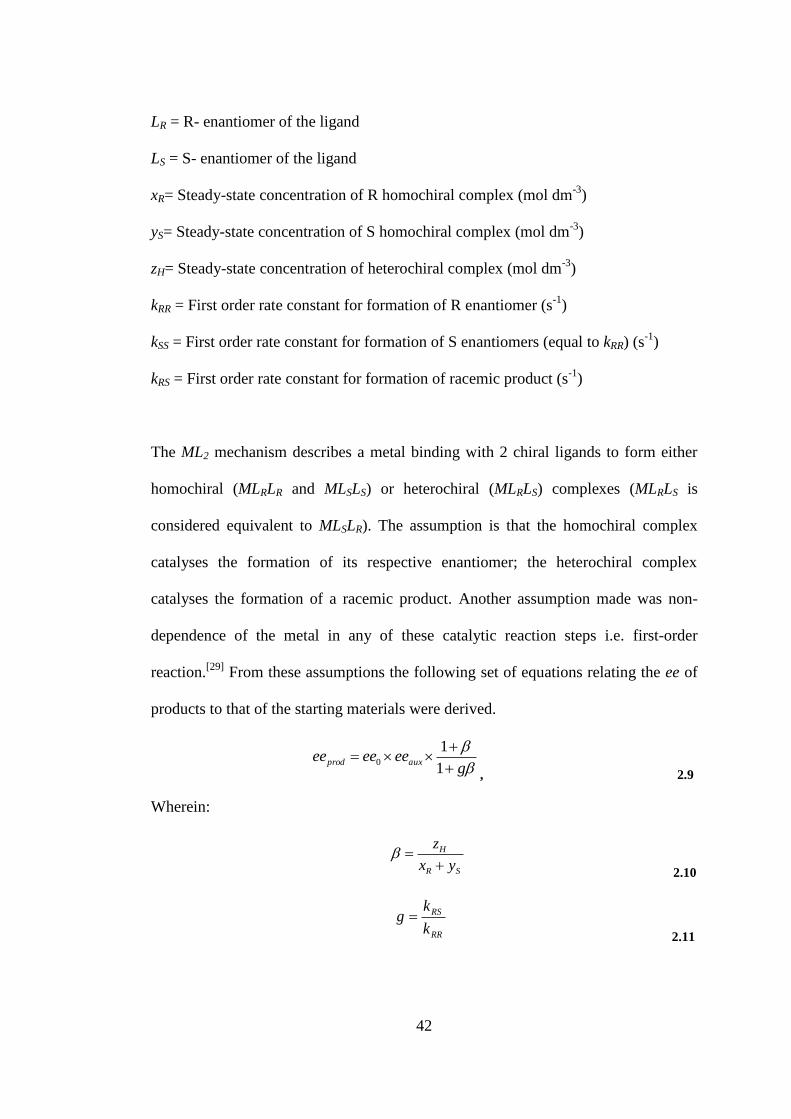
42
LR = R- enantiomer of the ligand
LS = S- enantiomer of the ligand
xR= Steady-state concentration of R homochiral complex (mol dm-3
)
yS= Steady-state concentration of S homochiral complex (mol dm-3
)
zH= Steady-state concentration of heterochiral complex (mol dm-3
)
kRR = First order rate constant for formation of R enantiomer (s-1
)
kSS = First order rate constant for formation of S enantiomers (equal to kRR) (s-1
)
kRS = First order rate constant for formation of racemic product (s-1
)
The ML2 mechanism describes a metal binding with 2 chiral ligands to form either
homochiral (MLRLR and MLSLS) or heterochiral (MLRLS) complexes (MLRLS is
considered equivalent to MLSLR). The assumption is that the homochiral complex
catalyses the formation of its respective enantiomer; the heterochiral complex
catalyses the formation of a racemic product. Another assumption made was non-
dependence of the metal in any of these catalytic reaction steps i.e. first-order
reaction.[29]
From these assumptions the following set of equations relating the ee of
products to that of the starting materials were derived.
, 2.9
Wherein:
2.10
2.11
geeeeee auxprod
1
10
SR
H
yx
z
RR
RS
k
kg
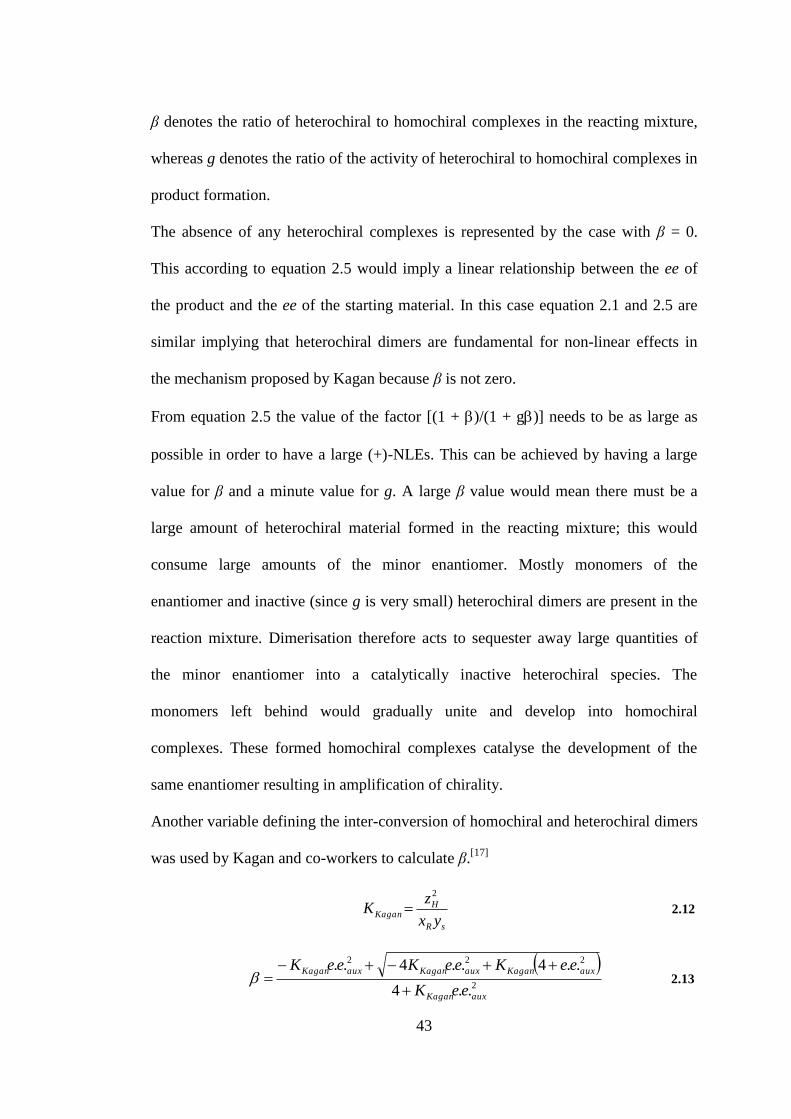
43
β denotes the ratio of heterochiral to homochiral complexes in the reacting mixture,
whereas g denotes the ratio of the activity of heterochiral to homochiral complexes in
product formation.
The absence of any heterochiral complexes is represented by the case with β = 0.
This according to equation 2.5 would imply a linear relationship between the ee of
the product and the ee of the starting material. In this case equation 2.1 and 2.5 are
similar implying that heterochiral dimers are fundamental for non-linear effects in
the mechanism proposed by Kagan because β is not zero.
From equation 2.5 the value of the factor [(1 + )/(1 + g)] needs to be as large as
possible in order to have a large (+)-NLEs. This can be achieved by having a large
value for β and a minute value for g. A large β value would mean there must be a
large amount of heterochiral material formed in the reacting mixture; this would
consume large amounts of the minor enantiomer. Mostly monomers of the
enantiomer and inactive (since g is very small) heterochiral dimers are present in the
reaction mixture. Dimerisation therefore acts to sequester away large quantities of
the minor enantiomer into a catalytically inactive heterochiral species. The
monomers left behind would gradually unite and develop into homochiral
complexes. These formed homochiral complexes catalyse the development of the
same enantiomer resulting in amplification of chirality.
Another variable defining the inter-conversion of homochiral and heterochiral dimers
was used by Kagan and co-workers to calculate β.[17]
sR
HKagan
yx
zK
2
2.12
2
222
..4
..4..4..
auxKagan
auxKaganauxKaganauxKagan
eeK
eeKeeKeeK
2.13

44
Prior to the above calculation of β, Kagan et al suggested a purely statistical
distribution of ligands, KKagan = 4. Substituting KKagan = 4 in equation 2.13:
2.14
Further combination of equation 2.10 and 2.5 acquires:
2.15
The above derived equation demonstrates that for a statistical distribution of ligands
a non-linear effect exists except in cases where g = 1. Small values of g imply large
(+)-NLEs; as g tends to 1, the probability of producing racemic products increases.
2.1.3 The Noyori Model
The reaction mechanism of the addition of dialkylzinc compounds to aldehydes using
(-)-3-exo-(dimethylamino)isoborneol [commonly called (-)- DAIB] as a chiral
catalyst was studied by Noyori and co-workers in 1989.[18]
The proposed mechanism
involves the reaction of DIAB and dialkylzinc to form a product which can either be
R or S. Further combination of these products leads either to the formation of
homochiral (RR or SS) or heterochiral (RS equivalent to SR) dimeric complexes.
The suggested mechanism is different from the Kagan scheme (Figure 2.3) because
the monomeric species in the mechanism act as catalysts and the dimeric species are
totally inactive. Kagan describes the dimeric species as catalytically active whereas
the monomers are inactive.
2
2
1
1
aux
aux
ee
ee
20)1(1
2
aux
auxprodeegg
eeeeee

45
Figure 2.4: Illustration of the mechanism developed by Noyori et al to explain amplification of
ee.
Whereby:
KN,hom = Equilibrium constant for the dissociation of homochiral dimers (mol dm-3
)
KN,het = Equilibrium constant for the dissociation of heterochiral dimers (mol dm-3
)
SS = S-homochiral dimer
RR = R-homochiral dimer
SR = Heterochiral dimer
From Figure 2.4 the dissociation constant values of KN,hom and KN,het are extremely
important. Noyori et al established that if KN,hom = 2KN,het, the system confirms a
linear effect; no amplification or depletion of ee. is the case. A positive non-linear
effect is observed when KN,hom> 2KN,het and the ee of the product is amplified.[30]
For KN,hom>>KN,het, the homochiral dimers are less stable than heterochiral dimers.
Heterochiral dimers form stable, catalytically inactive species, which would consume
most of the minor enantiomer. Mostly inactive heterochiral dimers would be present
in the resulting solution with a small amount of active monomers. These active
S R R Product
KN,hom
½ SS
S Product
KN,het
½ RR
+
SR
46
monomers are derived primarily from the enantiomer which was initially in excess,
since the enantiomer which was not in excess would be consumed in heterochiral
dimer formation. Dimer formation is therefore necessary in sequestering away the
minor enantiomer into an inactive heterochiral species.
Summarily, the required condition of KN,hom> 2KN,het in the Noyori et al model is
similar to the required condition of β>>1 in the Kagan et al mechanisms. The
formation of dimers is preferred to monomers in both mechanisms, because the
heterochiral dimers sequester away the minor enantiomer. In the Kagan et al
mechanisms, the heterochiral dimers are inert, while the homochiral dimers are
active catalysts. In the Noyori et al mechanism, both heterochiral and homochiral
dimers are inert; monomers are the active catalysts.[18]
2.2 The Soai Autocatalytic Reaction
2.2.1 Introduction
The Soai Autocatalytic reaction is an example of asymmetric synthesis seen in the
previous section. Considerable attention has been paid to understanding the
mechanism of this reaction, which was discovered by Kenso Soai and coworkers
over a decade ago.[1, 19-27, 31-33]
Unlike ordinary asymmetric catalysis, the Soai autocatalytic reaction is special
because the chiral auxiliary and the product are identical. As a result, amplification
of chirality is possible because the chiral product serves as the catalyst for its own
generation. The enantiomeric excess ee can therefore be amplified to extremely high
values, close to 99%.
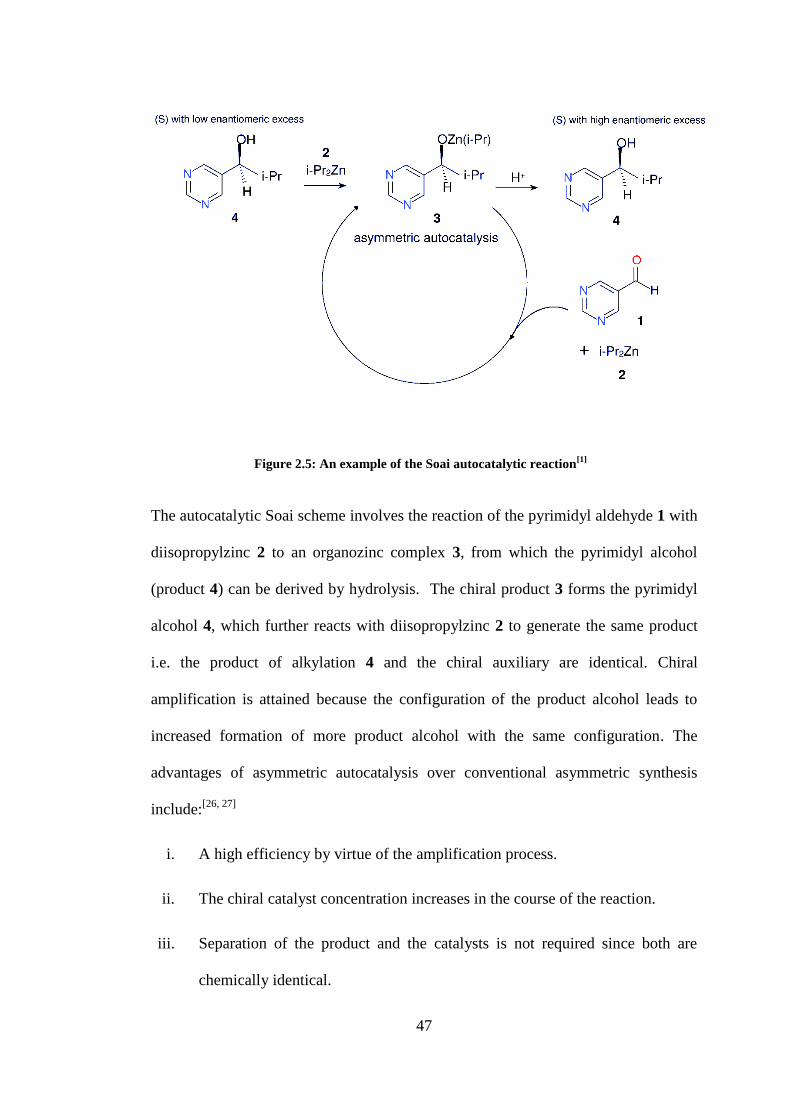
47
Figure 2.5: An example of the Soai autocatalytic reaction[1]
The autocatalytic Soai scheme involves the reaction of the pyrimidyl aldehyde 1 with
diisopropylzinc 2 to an organozinc complex 3, from which the pyrimidyl alcohol
(product 4) can be derived by hydrolysis. The chiral product 3 forms the pyrimidyl
alcohol 4, which further reacts with diisopropylzinc 2 to generate the same product
i.e. the product of alkylation 4 and the chiral auxiliary are identical. Chiral
amplification is attained because the configuration of the product alcohol leads to
increased formation of more product alcohol with the same configuration. The
advantages of asymmetric autocatalysis over conventional asymmetric synthesis
include:[26, 27]
i. A high efficiency by virtue of the amplification process.
ii. The chiral catalyst concentration increases in the course of the reaction.
iii. Separation of the product and the catalysts is not required since both are
chemically identical.

48
2.2.2 Discovery and development of highly enantioselective asymmetric
autocatalysis
Enormous developments in asymmetric synthesis have been realized over the last
decades.[26, 27, 34-38]
Development is targeted towards achieving high
enantioselectivity by designing precursors and chiral catalysts. Within this field of
synthetic chemistry research, the automultiplication of chiral compounds has been
regarded as kind of molecular replication that has attracted scientists including Soai
and co-workers.
Soai and co-workers reacted aldehydes with dialkylzincs in the presence of β-amino
alcohols as chiral catalysts. Examples of such chiral catalysts include N,N-
dibutylnorephedrine (DBNE) 1, 1-phenyl-2-(1-pyrrolidinyl)-1-propanol (PPP) 2 and
diphenyl(1-methylpyrrolidin-2-yl)methanol (DPMPM) 3.[22]
Figure 2.6: Dialkylzinc addition to aldehydes using chiral catalysts.[22]
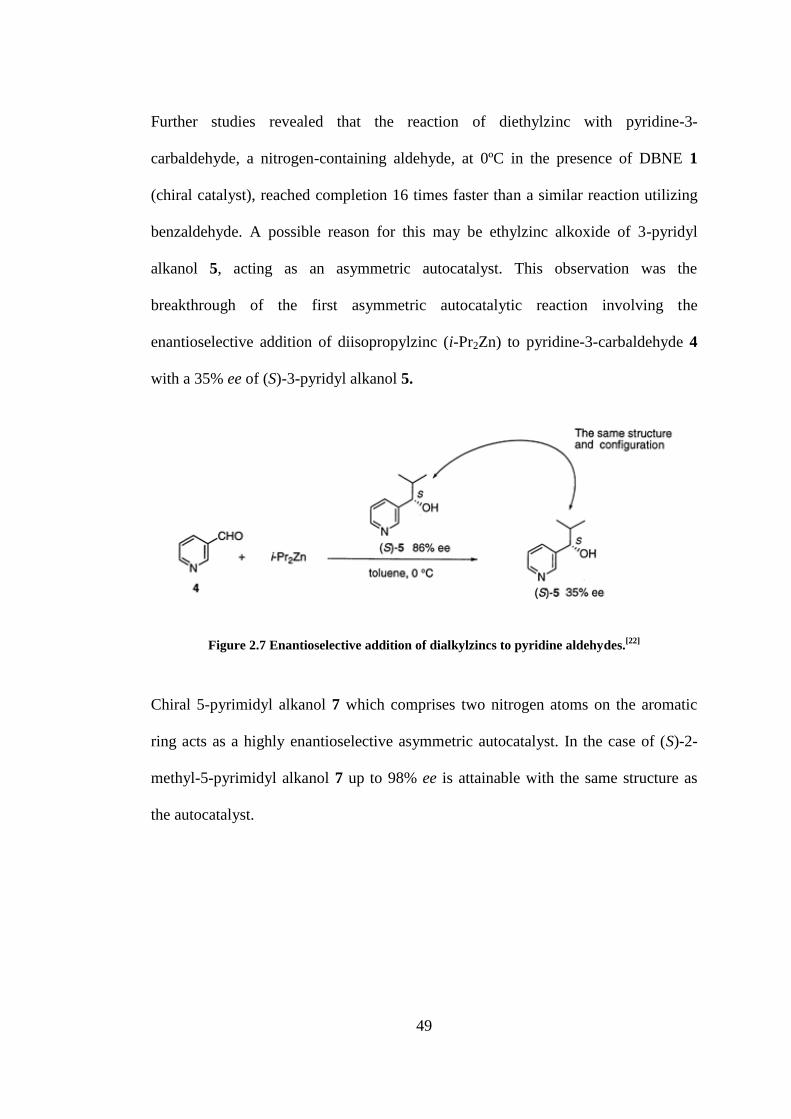
49
Further studies revealed that the reaction of diethylzinc with pyridine-3-
carbaldehyde, a nitrogen-containing aldehyde, at 0ºC in the presence of DBNE 1
(chiral catalyst), reached completion 16 times faster than a similar reaction utilizing
benzaldehyde. A possible reason for this may be ethylzinc alkoxide of 3-pyridyl
alkanol 5, acting as an asymmetric autocatalyst. This observation was the
breakthrough of the first asymmetric autocatalytic reaction involving the
enantioselective addition of diisopropylzinc (i-Pr2Zn) to pyridine-3-carbaldehyde 4
with a 35% ee of (S)-3-pyridyl alkanol 5.
Figure 2.7 Enantioselective addition of dialkylzincs to pyridine aldehydes.[22]
Chiral 5-pyrimidyl alkanol 7 which comprises two nitrogen atoms on the aromatic
ring acts as a highly enantioselective asymmetric autocatalyst. In the case of (S)-2-
methyl-5-pyrimidyl alkanol 7 up to 98% ee is attainable with the same structure as
the autocatalyst.

50
Figure 2.8: Enantioselective alkylation of pyrimidine aldehyde[22]
Interestingly the R group of the pyrimidyl aldehyde influences the degree of
enantioselectivity. Practically perfect asymmetric autocatalysis was found to be the
case when 10 is the autocatalyst with up to >99.5% ee.
Figure 2.9: Practically perfect asymmetric autocatalysis in which the product is used as the
asymmetric autocatalyst for the next run.[22]
The positive non-linear effect in the above is obvious with the ee of the produced
pyrimidyl alcohol higher than the asymmetric autocatalyst. Consecutive asymmetric
autocatalysis was found to achieve a high ee with minute initial amounts of the
autocatalyst.
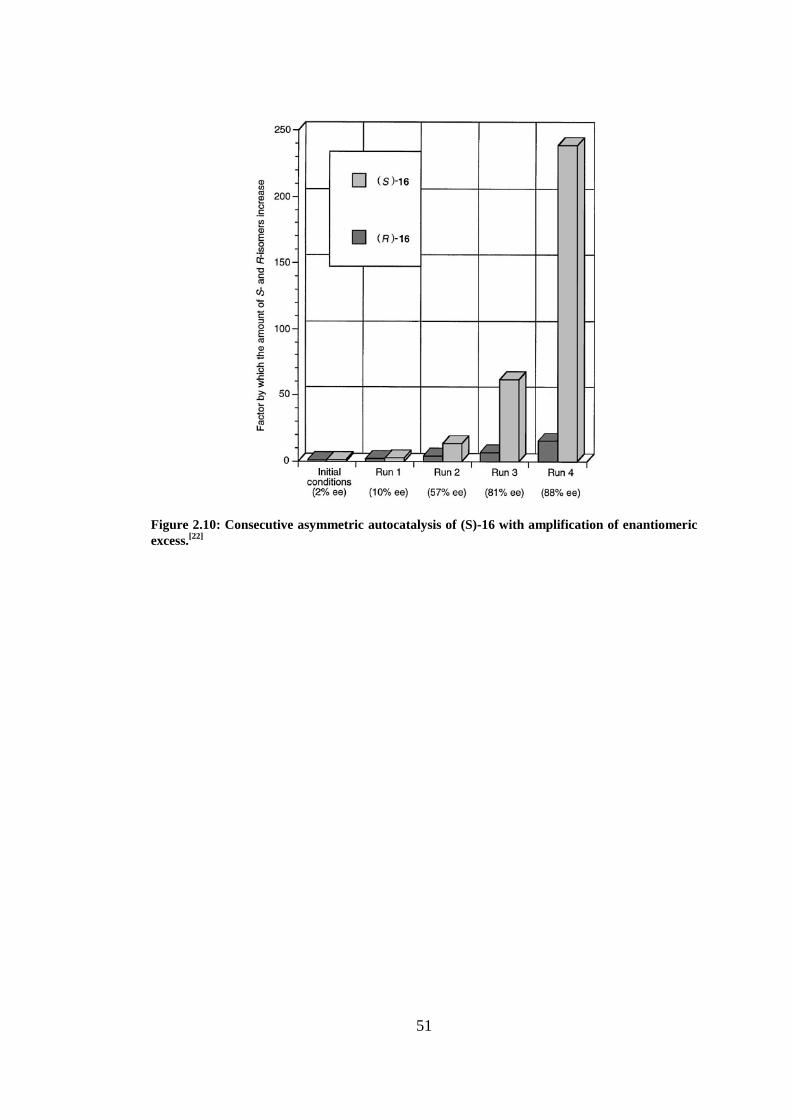
51
Figure 2.10: Consecutive asymmetric autocatalysis of (S)-16 with amplification of enantiomeric
excess.[22]

52
3. Mechanistic approaches to understanding the Soai
autocatalytic reaction
A summary of recently proposed mechanisms for the Soai autocatalytic reaction is
visited in this section. Of particular importance are the mechanisms proposed by
Blackmond, Brown, Soai, Buhse and co-workers. The essence of this section is to
obtain knowledge that so far contributes to the understanding of the molecular
mechanism behind amplification of chirality.
3.1 The Blackmond Model
Blackmond‟s first publication on non-linear effects was built on the Kagan ML2 and
ML3 models (introduced in section 2.1.2),[39]
which were evaluated using
experimentally determined rates of asymmetric synthesis reactions. These studies
formed the foundation for subsequent mechanistic studies of the Soai reaction, which
will be summarised further below.[40, 41]
3.1.1 Dimer Model
The foundation of the dimer model as the active catalyst is based on its suitability
when compared with experimental data. Reaction microcalorimetry (Omnical
CRC90) at room temperature has been used as a kinetic tool to follow the progress of
the Soai reaction.[41-44]
Three optical purities were tested, with autocatalyst of 97%
ee, 43% ee and a racemic autocatalyst mixture. As can be seen in Figure 3.1 the rate
of reaction is higher with an enantiopure catalyst and least with a racemic catalyst.
However, after normalisation to relative conversion the kinetic profiles of the
different autocatalyst are very similar.[42]

53
Figure 3.1: Reaction heat flow against time of differing enantiomeric excess: 97%, 43% and
0%[42]
In fact, the normalized rate profiles for the 97% ee and racemic autocatalyst mixtures
were found to be almost identical. This suggests that the kinetic order and hence the
reaction mechanism is similar. Very significantly, the reaction rate observed with the
97% enantiopure autocatalyst was approximately twice that of the rate observed with
the racemic system. This indicates that the concentration of the active catalyst is
influenced by the catalyst ee, supporting the view that the action of some
components in the racemic system, are suppressed. The system therefore appears to
exhibit features intrinsic to the Kagan and Noyori models discussed in section 2.1
above.
Predictions derived from the amplification mechanisms proposed by Kagan and
Noyori (section 2.1.3 above) were therefore discussed in light of the experimentally
catalytic cycle
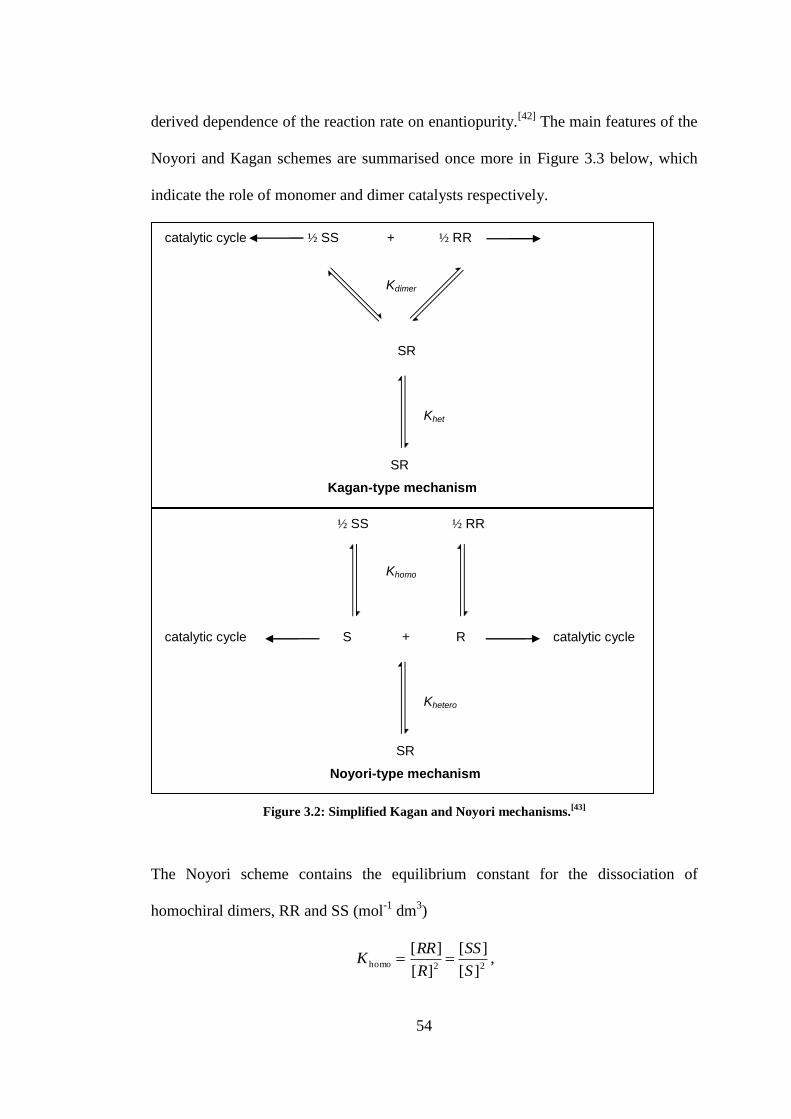
54
derived dependence of the reaction rate on enantiopurity.[42]
The main features of the
Noyori and Kagan schemes are summarised once more in Figure 3.3 below, which
indicate the role of monomer and dimer catalysts respectively.
Figure 3.2: Simplified Kagan and Noyori mechanisms.[43]
The Noyori scheme contains the equilibrium constant for the dissociation of
homochiral dimers, RR and SS (mol-1
dm3)
22homo][
][
][
][
S
SS
R
RRK ,
S R catalytic cycle
Khomo
½ SS
catalytic cycle
Khetero
½ RR
+
SR
Noyori-type mechanism
SR
Kdimer
½ SS + ½ RR
Khet
SR
Kagan-type mechanism
catalytic cycle

55
and the equilibrium constant for the dissociation of heterochiral dimers, RS and SR
(mol-1
dm3)
][][
][hetero
SR
SRK
It can be seen that in the Noyori scheme formation of catalytically inactive
homodimers according to the equilibrium constant Khomo lowers the concentration of
both monomeric enantiomers, but without any influence on enantiomeric excess in
the reactant solution. Amplification of enantiomeric excess can occur when the
equilibrium constant for the formation of the RS heterodimer is sufficiently high:
removal of equal amounts of minor and major enantiomer in the form of the RS
dimer then depletes the concentration of the minor enantiomer relatively more than
that of the major enantiomer. The reactant solution then has a lower total
concentration [S] + [R] of the monomers, but a higher enantiomeric excess. For this
effect to become significant a reasonably high value of Khetero is necessary. The
dependence on the magnitude of Khetero is illustrated quantitatively (Figure 3.3).
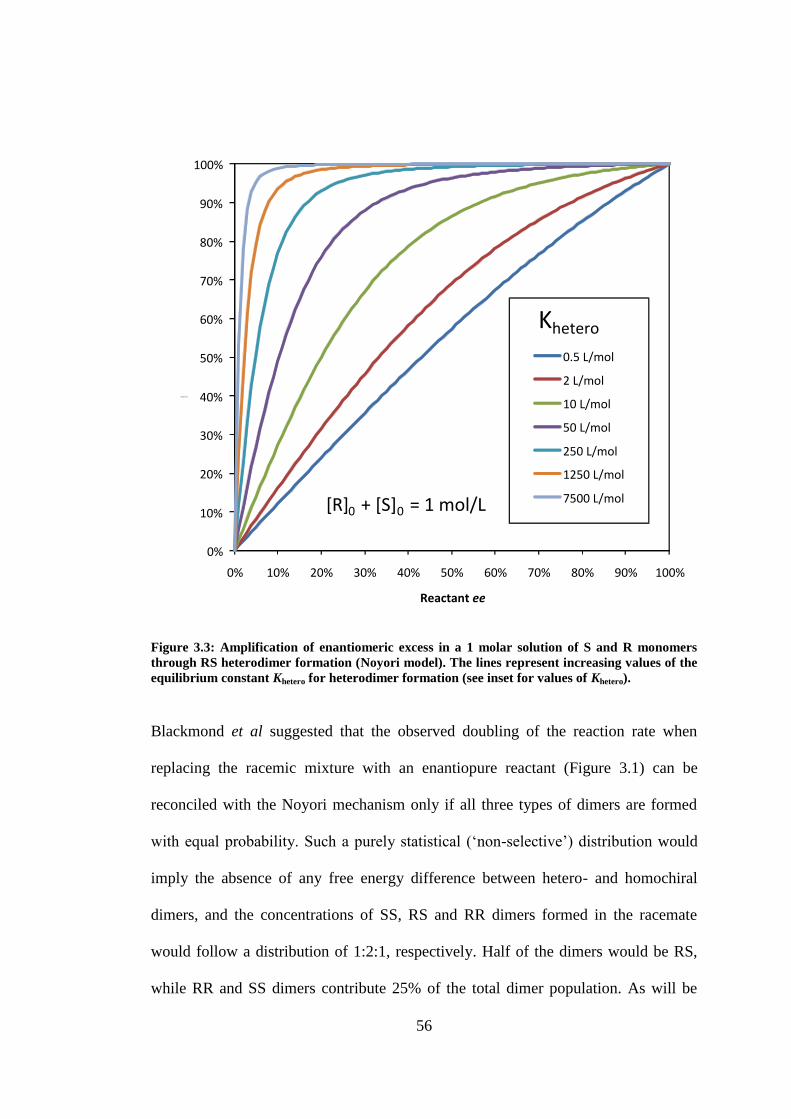
56
Figure 3.3: Amplification of enantiomeric excess in a 1 molar solution of S and R monomers
through RS heterodimer formation (Noyori model). The lines represent increasing values of the
equilibrium constant Khetero for heterodimer formation (see inset for values of Khetero).
Blackmond et al suggested that the observed doubling of the reaction rate when
replacing the racemic mixture with an enantiopure reactant (Figure 3.1) can be
reconciled with the Noyori mechanism only if all three types of dimers are formed
with equal probability. Such a purely statistical („non-selective‟) distribution would
imply the absence of any free energy difference between hetero- and homochiral
dimers, and the concentrations of SS, RS and RR dimers formed in the racemate
would follow a distribution of 1:2:1, respectively. Half of the dimers would be RS,
while RR and SS dimers contribute 25% of the total dimer population. As will be
0%
10%
20%
30%
40%
50%
60%
70%
80%
90%
100%
0% 10% 20% 30% 40% 50% 60% 70% 80% 90% 100%
Equii brium ee
Reactant ee
0.5 L/mol
2 L/mol
10 L/mol
50 L/mol
250 L/mol
1250 L/mol
7500 L/mol
K hetero
[R] 0 + [S] 0 = 1 mol/L

57
shown in the next section, the equilibrium constants Khetero and Khomo for a purely
statistical dimer distribution are related through Khetero = 2Khomo. Blackmond et al
appear to be arguing that the halving of the reaction rate in the racemic system is due
to removing ~50% of the monomeric S and R molecules from the available pool as
RS dimers. By implication, if dimer formation were indeed non-selective, the
remaining 25% each of R and S molecules would have to form quantitatively RR and
SS dimers. To achieve such quantitative turnover into dimers the absolute values of
the equilibrium constants for heterodimer formation, Khetero, and for homodimer
formation, Khomo, would have to be very large. To achieve the halved reaction rate of
the racemate the homochiral dimer species then would also have to carry the chiral
amplification reaction, in contradiction to the original Noyori mechanism, in which
all dimer species are presumed inactive.
Blackmond et al argue further that amplification of chirality is not possible with a
statistical selection of dimers, with Khetero = 2Khomo. This would indeed be the case if
monomers are quantitatively transformed into homochiral and heterochiral dimers,
because in this case the diastereomeric distribution of dimers would always mirror
the original enantiomeric excess.
It is instructive for further discussions below to derive the relationship Khetero =
2Khomo from first principles, using elementary statistics. For this we consider n
molecule pairs randomly drawn (without replacement) from a pool of 2n molecules,
of which r molecules have R-configuration and s molecules have S-configuration,
with 2n = r + s. If the two types of molecules cannot otherwise be distinguished then
the probability of drawing an R molecule from such a pool is r/2n. The probability of
immediately drawing another R molecule is (r-1)/(2n-1), hence the probability of
forming an RR pair is
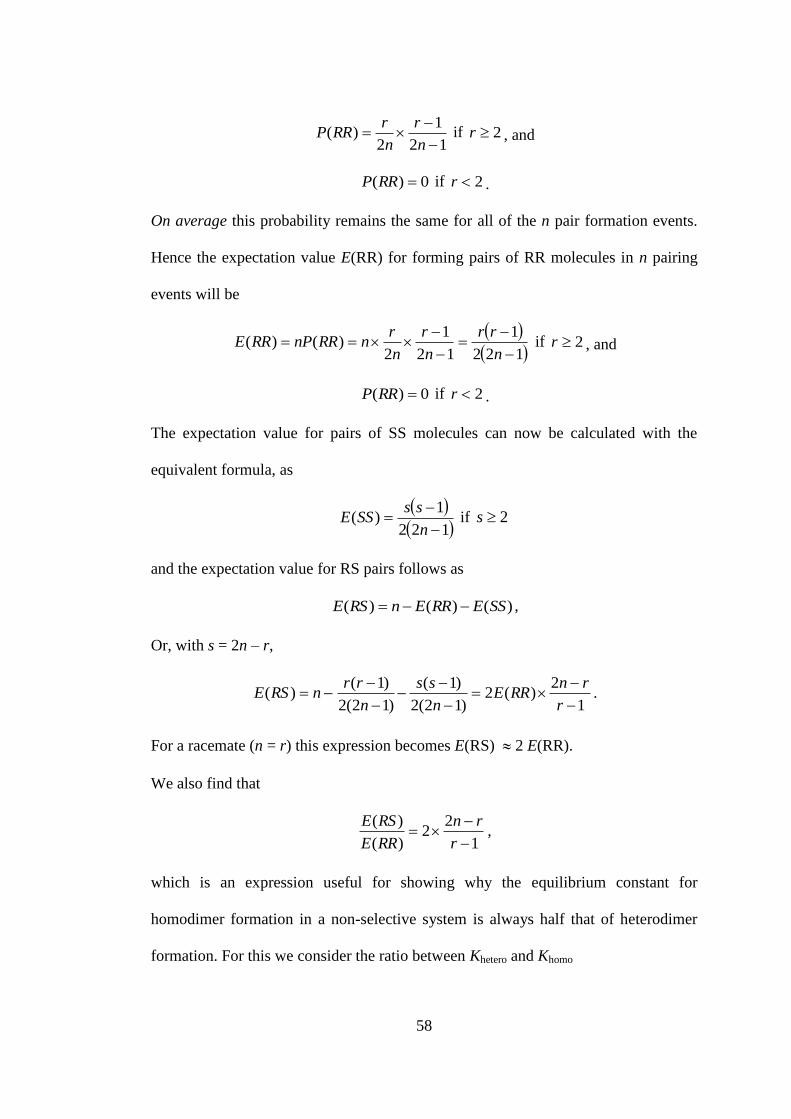
58
12
1
2)(
n
r
n
rRRP if 2r , and
0)( RRP if 2r .
On average this probability remains the same for all of the n pair formation events.
Hence the expectation value E(RR) for forming pairs of RR molecules in n pairing
events will be
122
1
12
1
2)()(
n
rr
n
r
n
rnRRnPRRE if 2r , and
0)( RRP if 2r .
The expectation value for pairs of SS molecules can now be calculated with the
equivalent formula, as
122
1)(
n
ssSSE if 2s
and the expectation value for RS pairs follows as
)()()( SSERREnRSE ,
Or, with s = 2n – r,
1
2)(2
)12(2
)1(
)12(2
)1()(
r
rnRRE
n
ss
n
rrnRSE .
For a racemate (n = r) this expression becomes E(RS) 2 E(RR).
We also find that
1
22
)(
)(
r
rn
RRE
RSE,
which is an expression useful for showing why the equilibrium constant for
homodimer formation in a non-selective system is always half that of heterodimer
formation. For this we consider the ratio between Khetero and Khomo
59
][
][
][
][
][
][
][][
][ 2
homo
hetero
S
R
RR
SR
RR
R
SR
SR
K
K .
The ratio between the concentrations of hetero- and homodimers concentrations is
equal to the ratio between their statistical expectation values,
][
][
)(
)(
RR
SR
SSE
RSE ,
so we can also write
][
][
1
22
][
][
)(
)(
homo
hetero
S
R
r
rn
S
R
SSE
RSE
K
K
.
We now identify 2n – r as just the number of S molecules in SS dimers, which will
be proportional to the equilibrium concentration of [S]. Furthermore, for a large
population of molecules )( r r - 1 r. Because S and R molecules are
chemically indistinguishable the proportionality as for s and [S] applies equally to r
and [R]. For a large population of molecules we can therefore write that
2][
][
][
][2
][
][
12
homo
hetero
S
R
R
S
S
R
r
s
K
K,
From which follows the expression Khetero = 2Khomo used by Blackmond et al.
However, within the Noyori monomer catalysis scheme an alternative interpretation
of the experimental findings of Blackmond et al is possible. If the equilibrium
constants for dimerisation were such that 50% of all monomers are removed from the
solution then the halving of the reaction rate indicated by the data in Figure 3.1 could
be achieved as well, even though monomer catalysis would be taking place. If there
was additionally a preference for heterochiral RS dimer formation then chiral
amplification similar to that illustrated in Figure 3.3 could be achieved. Such
mechanisms have in fact been explored by Buhse and co-workers who have shown
60
that Noyori-type monomeric chiral amplification is at least theoretically compatible
with the rate measurements presented by Blackmond.[42]
It appears that more detailed
further experimental work might be required to identify the species that is actually
the catalyst responsible for amplification.
Currently, on balance, the experimental consensus leans towards acknowledging the
presence of large quantities of dimer species, and hence the construction of
mechanistic scenarios based on dimer catalysis. This is a reasonable choice because
large quantities of dimers have been observed by NMR spectroscopic
investigations.[42]
Dimer catalysis is the basis of the Kagan model, in which the
homochiral dimers (and not the monomers) are the chiral auxiliaries for amplifying
enantiomeric excess. Kdimer is the dimensionless equilibrium constant for the direct
formation of heterochiral dimers from homochiral dimers:
][][
][ 2
dimerSSRR
SRK
By simple substitution with the values for Khetero and Khomo (derived above in the
context of the Noyori model) it also follows that
2
homo
hetero
2
homo
2
hetero
dimer]][[
]][[
K
K
SRK
SRKK
which implies that Kdimer = 4 based on the proposal that Khetero = 2Khomo .
The rate equation in the modified ML2 Kagan system (considers the homodimer as
the active catalysts as seen in section 2.1.2) used by Blackmond et al follows as:[42]
3.1
Whereby:
1
1AlkoxideZnPrAldehydeRate i
21
gk B
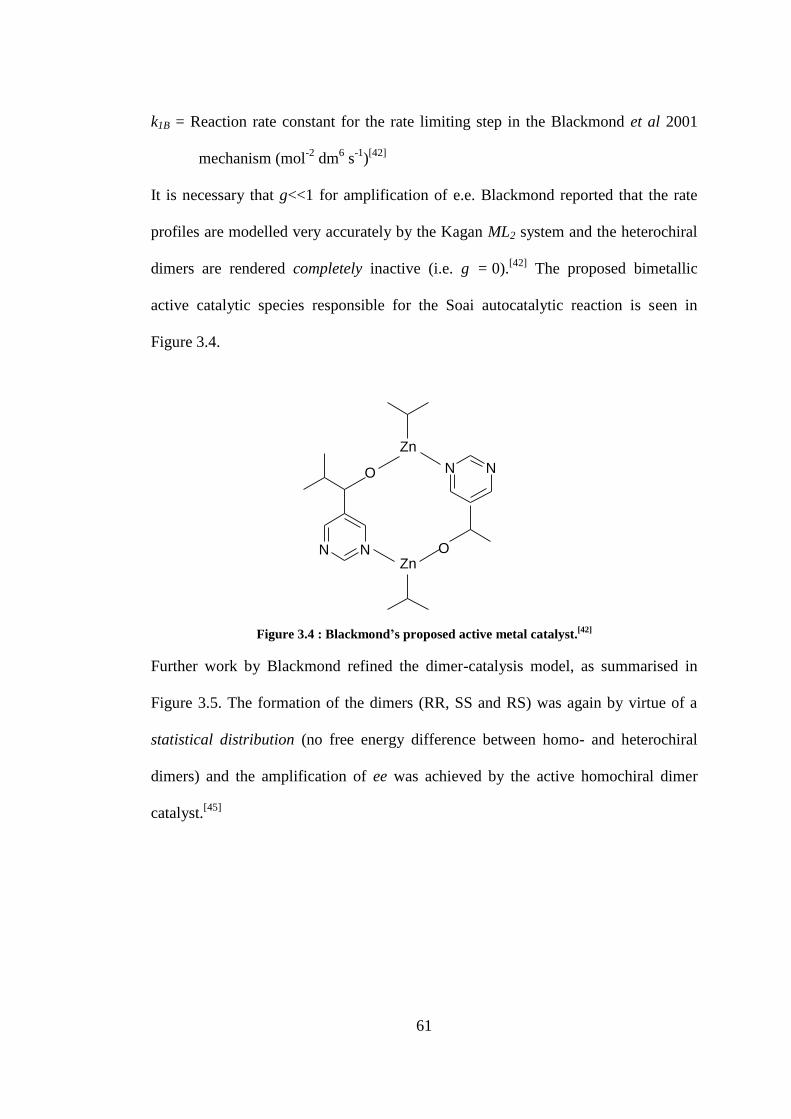
61
k1B = Reaction rate constant for the rate limiting step in the Blackmond et al 2001
mechanism (mol-2
dm6 s
-1)[42]
It is necessary that g<<1 for amplification of e.e. Blackmond reported that the rate
profiles are modelled very accurately by the Kagan ML2 system and the heterochiral
dimers are rendered completely inactive (i.e. g = 0).[42]
The proposed bimetallic
active catalytic species responsible for the Soai autocatalytic reaction is seen in
Figure 3.4.
Figure 3.4 : Blackmond’s proposed active metal catalyst.[42]
Further work by Blackmond refined the dimer-catalysis model, as summarised in
Figure 3.5. The formation of the dimers (RR, SS and RS) was again by virtue of a
statistical distribution (no free energy difference between homo- and heterochiral
dimers) and the amplification of ee was achieved by the active homochiral dimer
catalyst.[45]
N NZn
O
O
Zn
N N
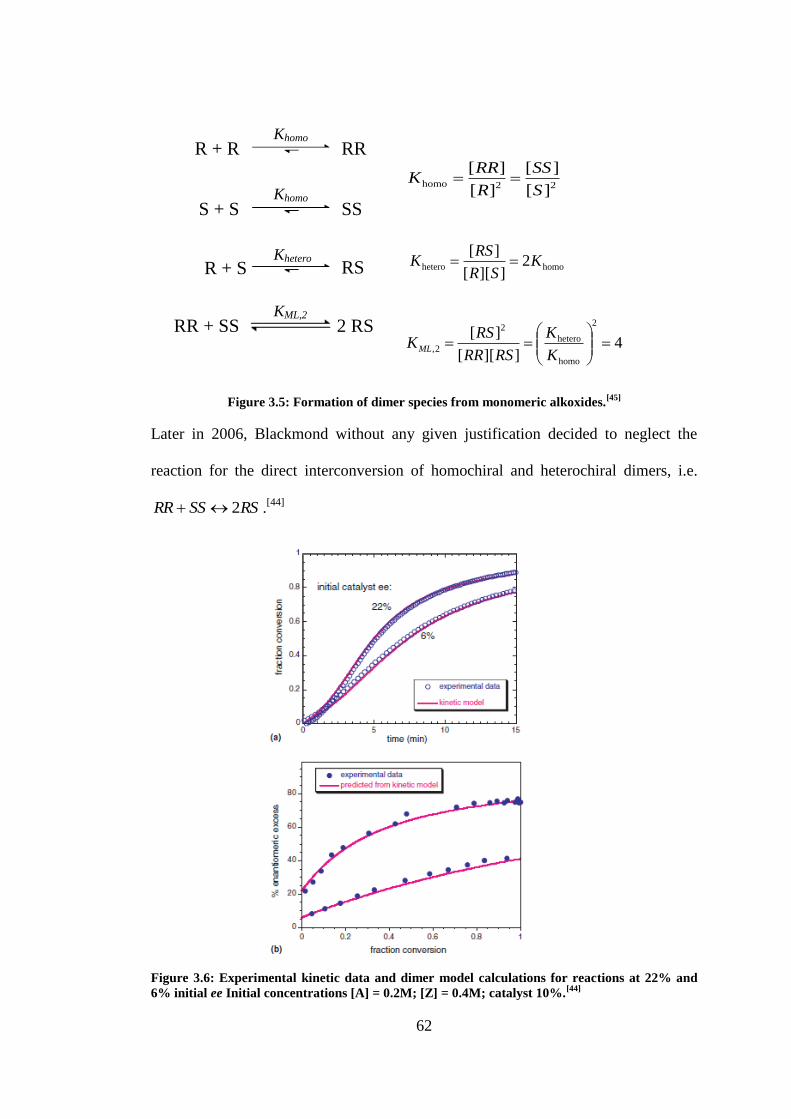
62
Figure 3.5: Formation of dimer species from monomeric alkoxides.[45]
Later in 2006, Blackmond without any given justification decided to neglect the
reaction for the direct interconversion of homochiral and heterochiral dimers, i.e.
RSSSRR 2 .[44]
Figure 3.6: Experimental kinetic data and dimer model calculations for reactions at 22% and
6% initial ee Initial concentrations [A] = 0.2M; [Z] = 0.4M; catalyst 10%.[44]
R + R RR Khomo
Khomo
S + S
RR + SS
SS
2 RS
KML,2
22homo][
][
][
][
S
SS
R
RRK
4]][[
][2
homo
hetero
2
2,
K
K
RSRR
RSKML
R + S RS Khetero
homohetero 2]][[
][K
SR
RSK
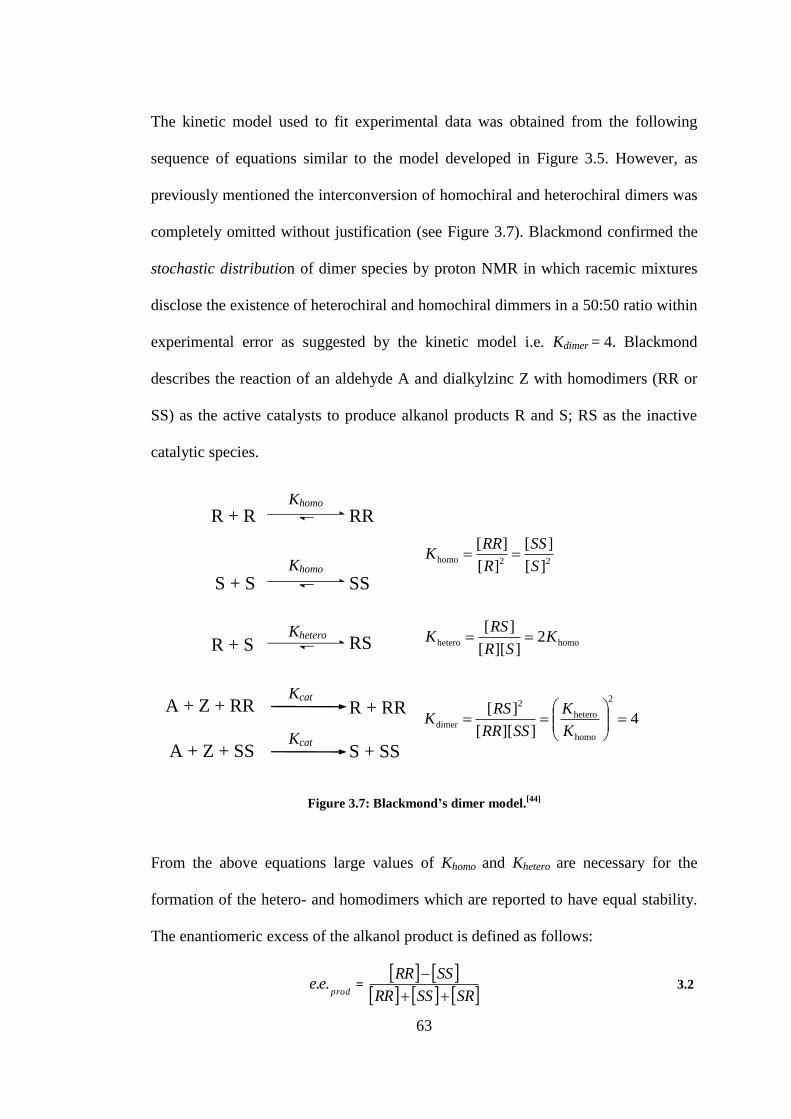
63
The kinetic model used to fit experimental data was obtained from the following
sequence of equations similar to the model developed in Figure 3.5. However, as
previously mentioned the interconversion of homochiral and heterochiral dimers was
completely omitted without justification (see Figure 3.7). Blackmond confirmed the
stochastic distribution of dimer species by proton NMR in which racemic mixtures
disclose the existence of heterochiral and homochiral dimmers in a 50:50 ratio within
experimental error as suggested by the kinetic model i.e. Kdimer = 4. Blackmond
describes the reaction of an aldehyde A and dialkylzinc Z with homodimers (RR or
SS) as the active catalysts to produce alkanol products R and S; RS as the inactive
catalytic species.
Figure 3.7: Blackmond’s dimer model.[44]
From the above equations large values of Khomo and Khetero are necessary for the
formation of the hetero- and homodimers which are reported to have equal stability.
The enantiomeric excess of the alkanol product is defined as follows:
prod
ee .. =
SRSSRR
SSRR
3.2
R + R RR Khomo
Khomo
Kcat
A + Z + SS
S + S
A + Z + RR
SS
S + SS
R + RR
Kcat
22homo][
][
][
][
S
SS
R
RRK
4]][[
][2
homo
hetero
2
dimer
K
K
SSRR
RSK
R + S RS Khetero
homohetero 2]][[
][K
SR
RSK

64
3.1.2 Tetramer
Blackmond also proposed a tetrameric model to explain the Soai autocatalytic
reaction rates. The rate equation developed in previous works (equation 3.1) is used
but the parameters g and β are excluded.[40]
3.3
Whereby:
k2B = Rate constant in the rate limiting step (mol-2
dm6 s
-1)
[Catalyst]active = [RR] + [SS] 3.4
Blackmond and Buono suggested that equation 3.1 is only obeyed for equimolar
ratios of the aldehyde and iPr2Zn. Figure 3.8 shows the reaction rate and the
enantiomeric excess of four reactions with different stoichiometric ratios.
Figure 3.8: Reaction rate as a function of aldehyde. Blue circles: Experimental data; dash black
line: Equation 3.1; solid pink line: Equation 3.2.[40]
The results shown above were obtained in toluene at 298 K and the initial
concentration of the aldehyde was 0.1 M, with 10 mol% chiral alcohol catalyst. The
active
i
22 CatalystZnPrAldehyde Rate Bk

65
respective conditions of the above profiles are (a) ee (cat) = 0.22, 1.8 equiv iPr2Zn,
(b) ee (cat) = 0.02, 2.0 equiv iPr2Zn, (c) ee (cat) = 0.97, 2.0 equiv iPr2Zn, (d) ee (cat)
= 0.22, 3.6 equiv iPr2Zn. Blackmond and Buono justify equation 3.3 by proposing
the formation of a complex between the aldehyde and iPr2Zn (Figure 3.9) before the
transfer of the alkyl group. Tetrameric structures are reported to be familiar in the
reactions of diakylzinc and amino alcohols.[40]
Figure 3.9: Aldehyde- iPr2Zn complex[40]
3.2 The Soai model
Soai and co-workers also made substantial effort in understanding the kinetics of the
autocatalytic reaction capable of amplifying chirality using HPLC to determine the
yield of the products with naphthalene as an internal standard. They proposed a
model that focused on the kinetics and did not cater for the amplification of
enantiomeric excess. The kinetic model was developed from different reactions of
aldehyde and iPr2Zn in the presence of minute amounts of an enantiopure catalyst.[19]
Figure 3.10: Scheme proposed by Soai and coworkers[19]
A = Aldehyde; Z = iPr2Zn
2
.
P
PPK S
P+P P.P
A + Z + P.P P + P.P ks
N
N
O
N
N
OZn(iPr2)
+ iPr2Zn
66
P = Reaction product (either R or S)
P.P = Dimeric catalyst species (either homochiral or heterochiral)
ks = Rate constant for dimer-catalysed product formation (mol-2
dm6 s
-1)
Ks = Equilibrium constant for the formation of dimeric catalyst species (mol-1
dm3)
From this scheme the rate of reaction, v (mol dm-3
s-1
) is defined as:
2. PZAKkPPZAkdt
Adv sss 3.5
Introducing the amount of reactant consumed or product formed results in:
dt
dxxPxZxAKk
dt
Adss
2
000 3.6
A0 = Initial aldehyde concentration (mol dm-3
)
P0 = Initial alkoxide product concentration (mol dm-3
)
Z0 = Initial diisopropylzinc concentration (mol dm-3
)
x = Amount of reactant consumed / amount of product formed (mol dm-3
)
A comparison of kinetic simulation of the derived rate equation and experimental
data is shown below. Clearly, it is a second order reaction and not first order as
depicted by the simulation represented by dash lines.

67
Figure 3.11: Comparison of simulation (solid lines) with experimental points. T = 273K;
A0=2.08X10⁻² M; Z0 = 3.13X10⁻² M; P0 = 2.08X10⁻⁴ M. Broken line represents simulation
assuming a first-order autocatalytic reaction.[19]
This model which elucidates the kinetics does not provide information on a model to
explain the amplification of ee in the reaction. They claim that this dimer model is
suitable because of agreement between experimental and calculated data. However
this work has been criticized by Blackmond et al because of the lack of crucial
information on the suppression of a minor enantiomer and stereochemical
information.[46]
The model was eventually improved by Soai and co-workers by considering
amplification of ee.[32]
The newly proposed mechanism shows similarity to that
proposed by Blackmond and co-workers in 2001.[42]
However unlike Blackmond, it
is assumed that the heterodimers are active catalysts and there is a free association of
dimers implying no statistical distribution.
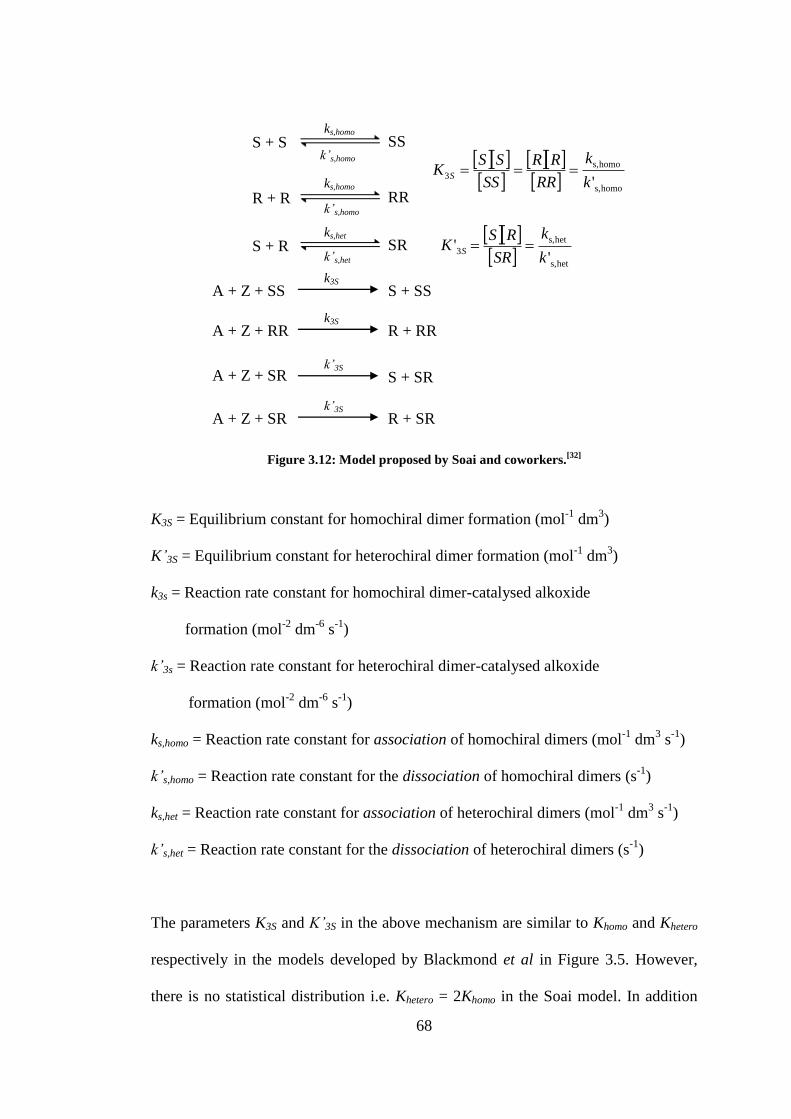
68
Figure 3.12: Model proposed by Soai and coworkers.[32]
K3S = Equilibrium constant for homochiral dimer formation (mol-1
dm3)
K’3S = Equilibrium constant for heterochiral dimer formation (mol-1
dm3)
k3s = Reaction rate constant for homochiral dimer-catalysed alkoxide
formation (mol-2
dm-6
s-1
)
k’3s = Reaction rate constant for heterochiral dimer-catalysed alkoxide
formation (mol-2
dm-6
s-1
)
ks,homo = Reaction rate constant for association of homochiral dimers (mol-1
dm3 s
-1)
k’s,homo = Reaction rate constant for the dissociation of homochiral dimers (s-1
)
ks,het = Reaction rate constant for association of heterochiral dimers (mol-1
dm3 s
-1)
k’s,het = Reaction rate constant for the dissociation of heterochiral dimers (s-1
)
The parameters K3S and K’3S in the above mechanism are similar to Khomo and Khetero
respectively in the models developed by Blackmond et al in Figure 3.5. However,
there is no statistical distribution i.e. Khetero = 2Khomo in the Soai model. In addition
S + S SS
R + R RR
S + R SR
A + Z + SS S + SS
A + Z + RR R + RR
A + Z + SR S + SR
A + Z + SR R + SR
k3S
k3S
k’3S
k’3S
homos,
homos,
3'k
k
RR
RR
SS
SSK S
hets,
hets,
3'
'k
k
SR
RSK S
ks,homo
ks,homo
ks,het
k’s,homo
k’s,homo
k’s,het

69
the Soai model does not include the interconversion of homochiral to heterochiral
dimers which agrees with Blackmond‟s 2006 model.[44]
From the model (Figure 3.12) the following equations were derived on the basis that
the concentration of the dimer is small relative to the monomer. However, this
assumption may not be obeyed at later stages of the reaction.
RSZAKkSZAKk
SRZAkSSZAkdt
Sd
SSSS
SS
33
2
33
33
''
'
3.7
RSZAKkRZAKk
SRZAkRRZAkdt
Rd
SSSS
SS
33
2
33
33
''
'
3.8
SSSS
SS
KkKk
Kk
3333
33
'' 3.9
The experimental and calculated results from the above rate equations are illustrated
below. Yields and the ee (59.4 to 94 %) were found to increase rapidly after short
incubation periods.

70
Figure 3.13: Comparison of simulation [yield: broken line; ee: solid line] with experimental
points [yield: hollow circles; ee: filled circle] on asymmetric autocatalysis with initial ee of
59.4% at -250C.
[32]
It is obvious from this work that Soai and coworkers have proven that their dimer
model explains the amplification of ee in asymmetric autocatalysis.
3.3 The Buhse model
The model proposed by Buhse and co-workers is apparently more realistic than the
models earlier proposed by Blackmond[42]
and Soai[32]
in 2001 and 2003 respectively.
The latter mentioned models consider that the association of iPr2Zn, the aldehyde and
the dimeric catalysts occurs in one concerted rate limiting step. Buhse basically
separated the three molecules in their model into two steps. In their model they
assume that two alkoxide molecules combine to form dimeric species; a complex
formed between the dimer and aldehyde; the aldehyde-dimer complex then reacts
with iPr2Zn to form a product.[47]

71
Process Reaction Rate Law
Irreversible formation of the
zinc alkoxide
COH+ZnCOZn
CHO+ZnCOZn
R1=k1[COH][Zn]
R2=k2[CHO][Zn]
Reversible zinc alkoxide
dimerization equilibrium
COZn+COZn(COZn)2 R3a=k3[COZn]2
R3b=k-3[(COZn)2]
Reversible association of the
carbaldehyde
(COZn)2+CHO(COZn)2-CHO R4a=k4[(COZn)2][CHO]
R4b=k-4[(COZn)2-CHO]
Irreversible catalyzed
formation of the zinc alkoxide
(COZn)2-CHO+Zn(COZn)2 +COZn R5=k5[(COZn)2-CHO][Zn]
Side reaction COH+CHOReaction by-product R6=k6[COH][CHO]
Figure 3.14: Proposed kinetic model. k:rate constant[47]
In this model the possibility of an unspecified by product which was not considered
by the other mentioned models is taken into account. This consideration evolves
from the formation of fewer products than expected from the limiting reagent. In
contrast to Blackmond and Soai, Buhse suggested that both homodimers and
heterodimers are catalytically active.
Further kinetic models were developed by Buhse[48]
which considered the work of
Noyori, Frank and Kagan. Three models that incorporate mutual inhibition and chiral
autocatalytic steps have been proposed.
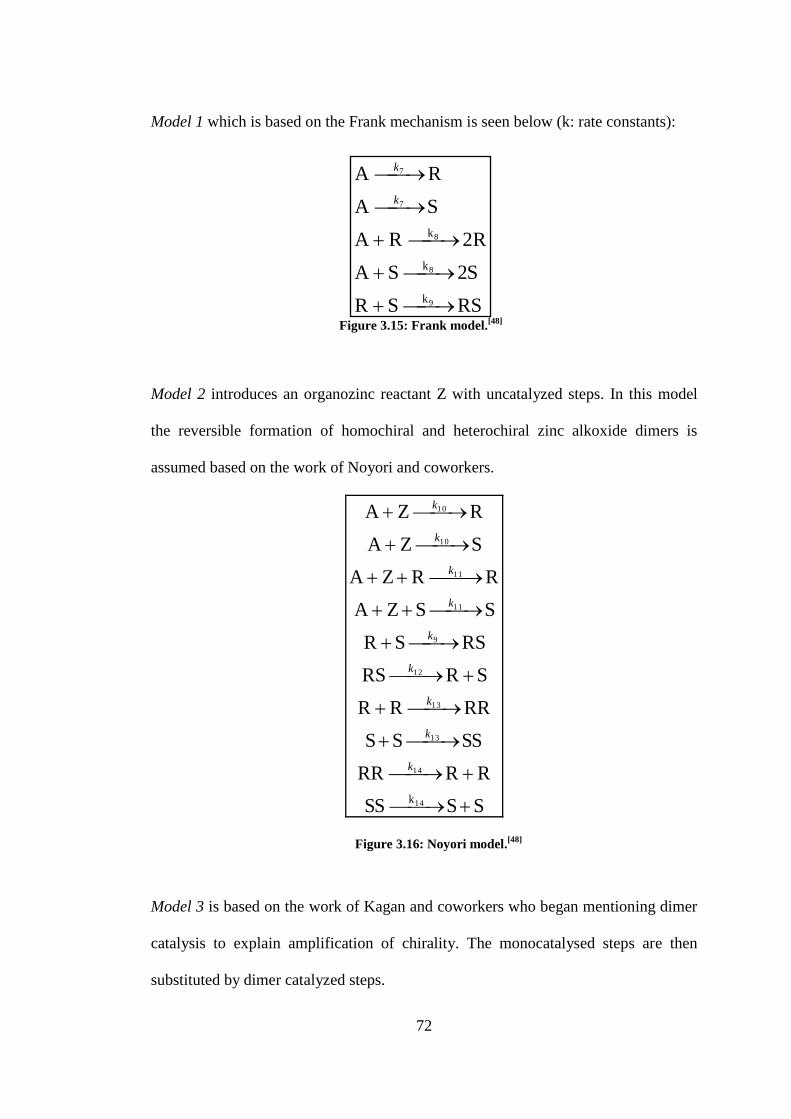
72
Model 1 which is based on the Frank mechanism is seen below (k: rate constants):
Figure 3.15: Frank model.[48]
Model 2 introduces an organozinc reactant Z with uncatalyzed steps. In this model
the reversible formation of homochiral and heterochiral zinc alkoxide dimers is
assumed based on the work of Noyori and coworkers.
SSSS
RRRR
SSSS
RRRR
SRRS
RSSR
SSZA
RRZA
SZA
RZA
14
14
13
13
12
9
11
11
10
10
k
k
k
k
k
k
k
k
k
k
Figure 3.16: Noyori model.[48]
Model 3 is based on the work of Kagan and coworkers who began mentioning dimer
catalysis to explain amplification of chirality. The monocatalysed steps are then
substituted by dimer catalyzed steps.
RS S R
S2 S A
R2 R A
SA
RA
9
8
8
7
7
k
k
k
k
k
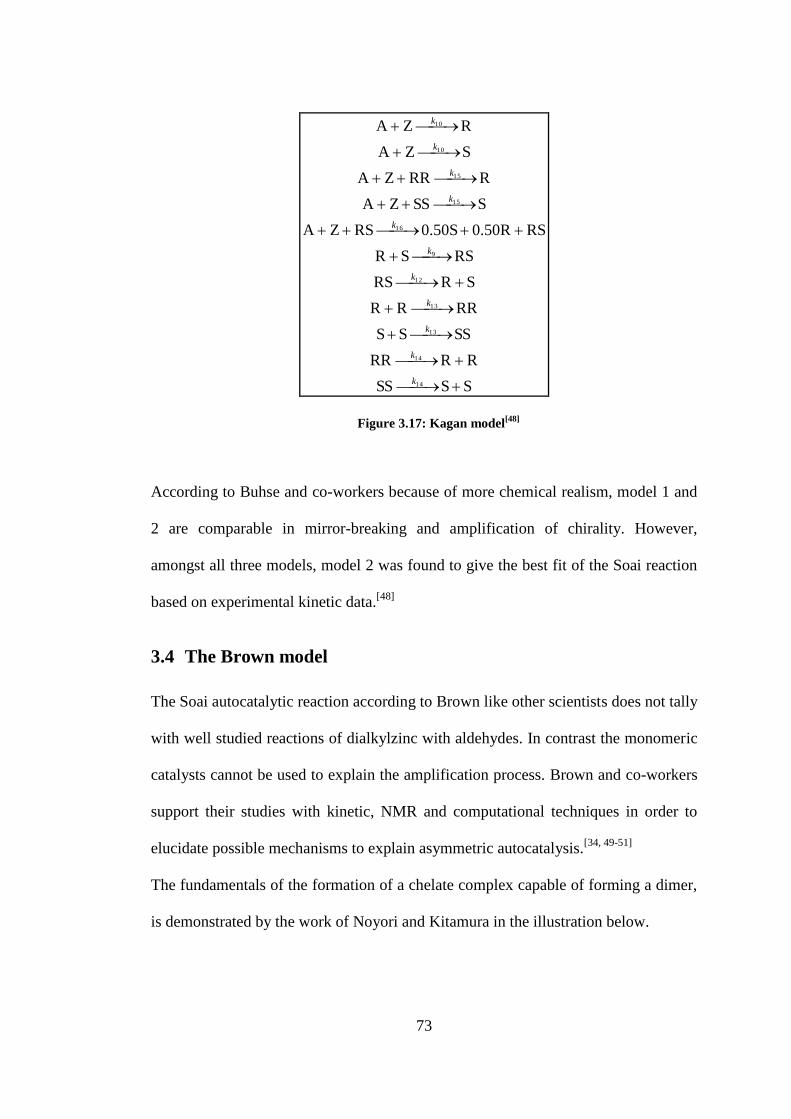
73
SSSS
RRRR
SSSS
RRRR
SRRS
RSSR
RS0.50R0.50SRSZA
SSSZA
RRRZA
SZA
RZA
14
14
13
13
12
9
16
15
15
10
10
k
k
k
k
k
k
k
k
k
k
k
Figure 3.17: Kagan model[48]
According to Buhse and co-workers because of more chemical realism, model 1 and
2 are comparable in mirror-breaking and amplification of chirality. However,
amongst all three models, model 2 was found to give the best fit of the Soai reaction
based on experimental kinetic data.[48]
3.4 The Brown model
The Soai autocatalytic reaction according to Brown like other scientists does not tally
with well studied reactions of dialkylzinc with aldehydes. In contrast the monomeric
catalysts cannot be used to explain the amplification process. Brown and co-workers
support their studies with kinetic, NMR and computational techniques in order to
elucidate possible mechanisms to explain asymmetric autocatalysis.[34, 49-51]
The fundamentals of the formation of a chelate complex capable of forming a dimer,
is demonstrated by the work of Noyori and Kitamura in the illustration below.

74
Figure 3.18: Fundamentals of Noyori and Kitamura model[51]
The monomer which forms a zinc chelate, is clearly reactive as it provides sites for
the carbonyl compound by coordinating with zinc and dialkylzinc through oxygen
coordination. The reason given for the high ee of the product over the catalyst is
suggested to be due to the reservoir dimer behavior that releases the reactive
monomer.[50]
The presence of a ligand is important in identifying accessible sites for
reactants and reagents. The catalyst is suggested to be a dimer that acts as a reservoir
that releases monomers. The heterodimer which is energetically more stable than the
homodimer reduces the concentration of one enantiomer resulting in a higher ee of
the reactant product than the starting ee of the catalysts.
The main technique used to understand the Soai reaction by Brown and co-workers
was NMR analyses in which species are identified in solution. Amplification of
chirality occurs with non-polar solvents in which precipitation unfortunately occurs.
THF which is a polar solvent has a lower tendency to precipitate and is a better

75
medium to provide interpretable data without difficulty. A spectra of racemic and
enantiopure zinc alkoxide showed distinct NMR spectra in THF.
Figure 3.19: Double resonance from homochiral to heterochiral[51]
Equivalent amounts of homo and heterodimers can be approved by two sets of
resonance (evidence of statistical distribution). According to Brown the likelihood of
higher oligomers is low since they ought to produce more signals. Further
computational studies considered that zinc could be bonded to N or O in pyrimidine
carbaldehyde and consequently suggests three possible structures of the dimer.
Brown suggests that the most likely dimer from his NMR analyses is a Zn-O square
dimer. He also specifies that characteristic conditions for an autocatalytic turnover
are 0-25°C, 0.05-0.2M iPr2Zn.[50, 51]
THF
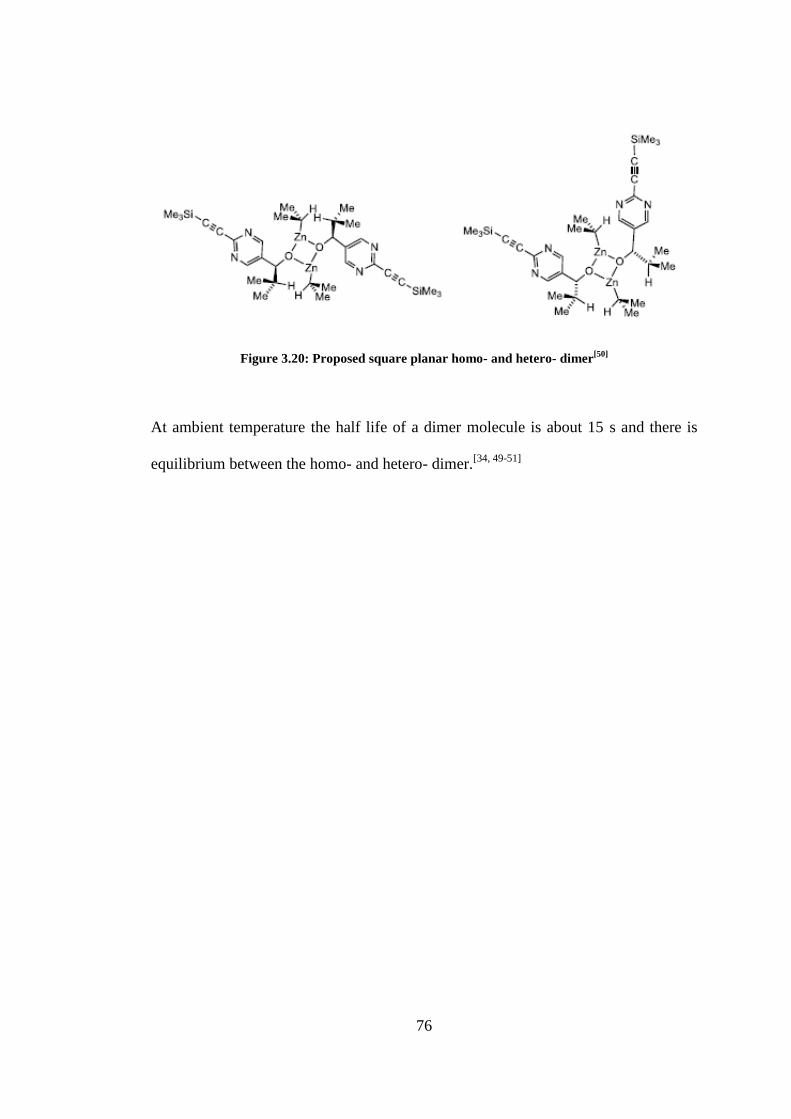
76
Figure 3.20: Proposed square planar homo- and hetero- dimer[50]
At ambient temperature the half life of a dimer molecule is about 15 s and there is
equilibrium between the homo- and hetero- dimer.[34, 49-51]

77
Figure 3.21: Dynamic exchange between homo- and hetero- dimer a) A: Observed B: Calculated
b) Arrhenius plot. Half life approx. 14s at 293 K.[51]
From the spectra above it is observed that increasing the temperature causes the
broadening and coalescence of singlets. Clearly a monomer is not formed in the
equilibrium between the dimers but probably at higher temperatures where small

78
changes in chemical shift are noticeable suggesting dissociative structural
modification. Further NMR studies were carried out to determine zinc site binding to
either the pyrimidine nitrogen or carbonyl group by monitoring the 13
C, 1H and
15N
chemical shift changes.
Figure 3.22: Chemical shift of binding of diisopropylzinc to pyrimidine aldehyde.[51]
From the above results the site of binding is the pyrimidine nitrogen. Further
computational studies were carried out in order to compare with the NMR data.
iPr2Zn which is used in the Soai autocatalytic reaction was replaced by Me2Zn. The
successive binding with Me2Zn initially with the aldehyde is seen in the scheme
below. The calculations were done by DFT at the B3LYP functional level with 6-
31G basis set for all atoms. It is obvious that the experimental and computed results
agree with the zinc prefering N- over O- in the pyrimidine aldehyde.[34, 51]

79
Figure 3.23: Enthalpy of binding ZnMe2 to pyrimidine aldehyde (Units: kcal/mol). N- preferred
over O- complexation.[51]
The significance of the relative stabilities of dimers was also computationally studied
in support of the (ZnO)2 planar structure over O-Zn-N macrocycles and even more
over {OZnO, NZnN} isomeric macromocycle. No reported evidence is however
present for the existence of a macrocycle from NMR studies.[51]
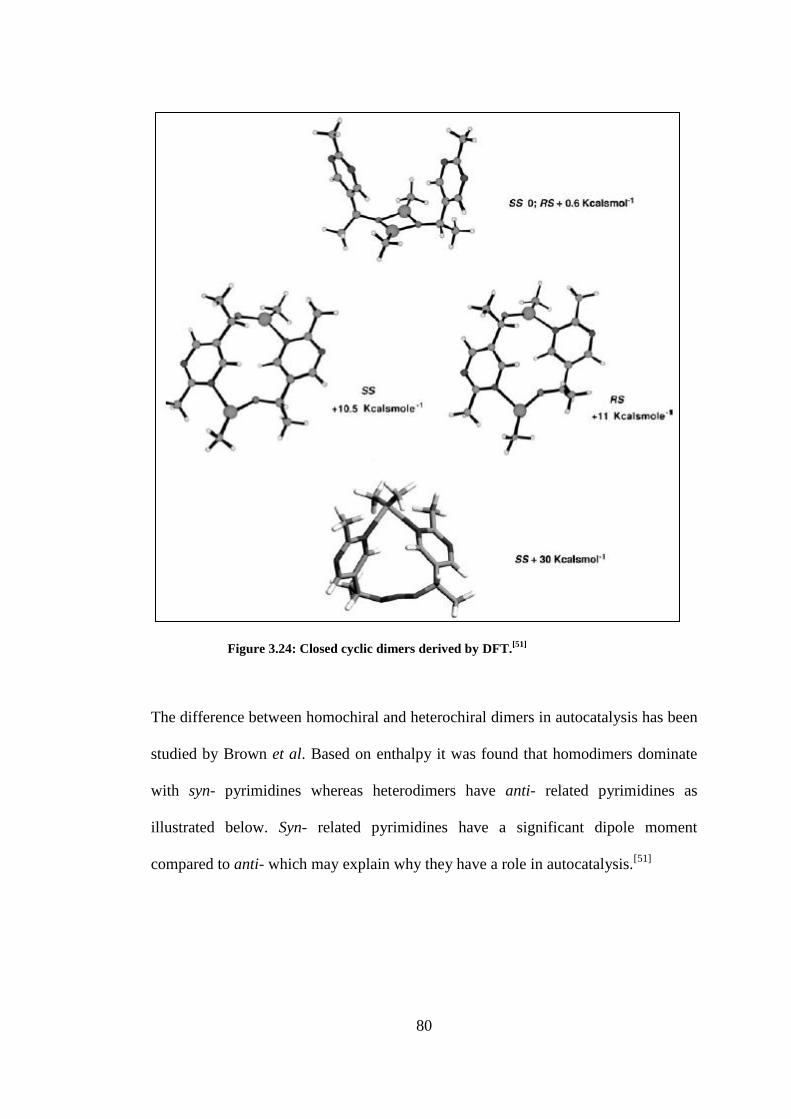
80
Figure 3.24: Closed cyclic dimers derived by DFT.[51]
The difference between homochiral and heterochiral dimers in autocatalysis has been
studied by Brown et al. Based on enthalpy it was found that homodimers dominate
with syn- pyrimidines whereas heterodimers have anti- related pyrimidines as
illustrated below. Syn- related pyrimidines have a significant dipole moment
compared to anti- which may explain why they have a role in autocatalysis.[51]

81
Figure 3.25: DFT calculated ground state conformations (preferred) of iPr2Zn derived homo-
(Ar, Ar` syn) and hetero- (Ar, Ar` anti) dimers.[51, 52]
Other possible species which include trimers and tetramers were derived from
computational calculations. Adding the aldehyde to the dimeric catalyst and akyl
zinc gives a trimer. The option of tetramers which was earlier visited by Blackmond
in this report was also explored by Brown et al in the DFT calculations. The
tetramers were based on a square dimer template. Four distinct tetramer structures
were computationally defined.[34, 50]
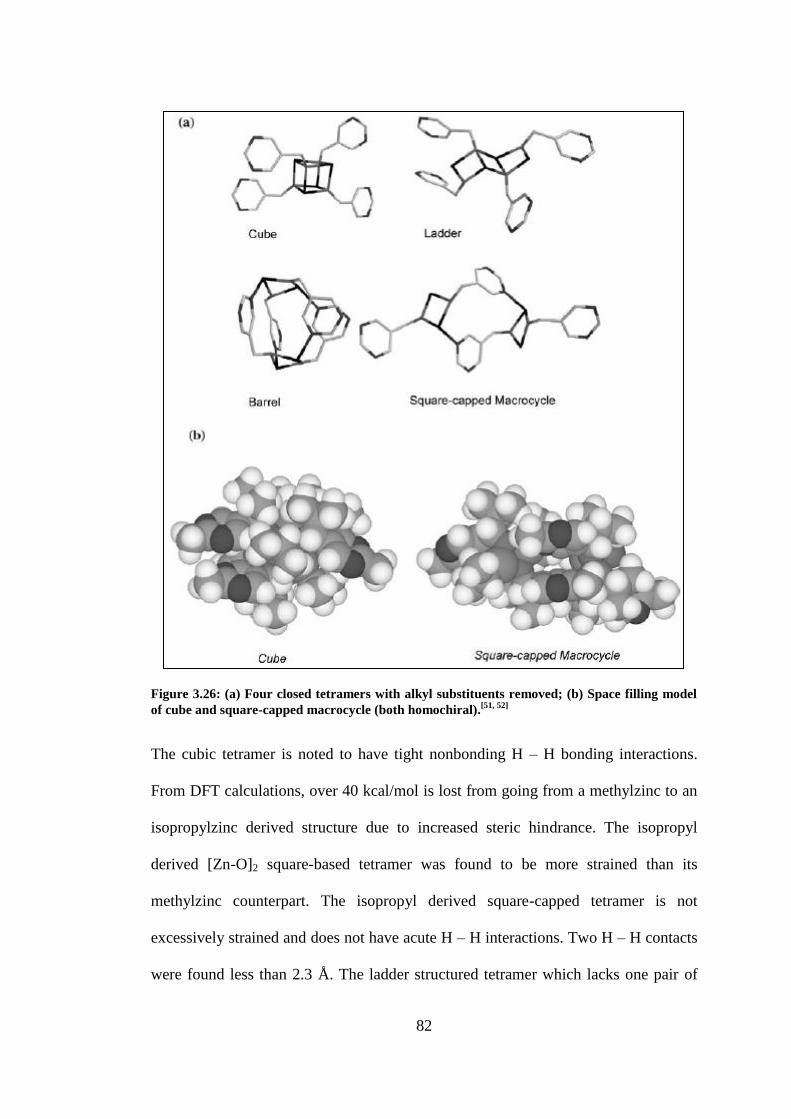
82
Figure 3.26: (a) Four closed tetramers with alkyl substituents removed; (b) Space filling model
of cube and square-capped macrocycle (both homochiral).[51, 52]
The cubic tetramer is noted to have tight nonbonding H – H bonding interactions.
From DFT calculations, over 40 kcal/mol is lost from going from a methylzinc to an
isopropylzinc derived structure due to increased steric hindrance. The isopropyl
derived [Zn-O]2 square-based tetramer was found to be more strained than its
methylzinc counterpart. The isopropyl derived square-capped tetramer is not
excessively strained and does not have acute H – H interactions. Two H – H contacts
were found less than 2.3 Å. The ladder structured tetramer which lacks one pair of

83
Zn-O associations and the barrel like structure tetramer are both less stable than the
cube tetramer.
Entrya Structure Binding
Energy (Me)
kcal mol-1
Binding Energy
(i-Pr) kcal mol-1
Binding Energy
(relative to 2x
precursor
dimer) kcal
mol-1
1C Me cube all-R 129.51 39.53
2C Pri cube all-(S) 91.68 7.46
3C Me cube
(RRSS)
129.58 40.86
4C Pri cube (RRSS) 91.86 6.78
1L Me ladder all-S 110.81 20.83
2L Pri ladder all S 80.88 -3.34
1B Me barrel all R 128.95 38.97
2B Pri barrel all R 104.8 20.58
1M Me SMS all-S 116.02 26.04
2M Pri SMS all S 101.3 17.11
aC = cube, L = ladder, B = barrel, M = (square macrocycle square (SMS))
Table 3.1: Binding enthalpies of tetrameric compared to dimeric structures[52]
The most likely active catalyst tetramer has a square-capped structure which
remarkably preserves its trigonal unsaturated Zn geometry for coordination. From 1H
NMR studies at low temperature there is evidence of highly dynamic and
unsymmetrical tetrameric Zn alkoxide species formed by the association of dimers. It
has been noted that the observed ee is higher than the ee calculated with a dimer
catalyst. According to Brown and co-workers, full consideration should be given to
higher homochiral oligomers in the explanation of the autocatalytic pathway. Models
with higher oligomers as the autocatalysts have been noted to give a higher
calculated ee for a given level of turnover.[51, 52]

84
An autocatalytic turnover is present only with diisopropylzinc. Other dialkylzinc
groups which include cyclopropyl, cyclopentyl or tertbutyl do not perform.
According to Klankermayer the bulkiness of the isopropyl group is responsible for its
exceptional performance in the autocatalytic amplification of chirality.[51, 52]
However, iPr and Et are of similar size with respective A-values of 2.21 and 1.79 Å
but the presence of longer range H – H interactions changes the setting.
Brown and co-workers have so far done kinetic, computational and NMR studies to
understand autocatalytic amplification. The solution structure of the resting state has
been well considered, yet Brown suggests that an X-ray structure of the oligomer
would be a step forward. No fully agreeable model explaining this process is known
at present.[51]
3.5 Research objective
The objective of this research study is to make a significant contribution to support
the numerous models already mentioned. As seen earlier, the nature of the catalyst
responsible for amplification of chirality is not definite. The characteristic of the
transition state structure has so far been suggested to be a monomer, dimer or
tetramer etc. Different techniques have been used to determine the catalyst, but none
of these techniques provides electronic and structural information which is necessary
in determining the molecular mechanism during amplification of chirality.
X-ray absorption fine structure (XAFS) which is the main technique used in this
work, provides structural and electronic information of the solution structure
responsible for autocatalysis. It is a powerful probing method for the quantitative
determination of structural parameters. Using this method it is possible to probe Zn
species in solution to generate structural information during amplification of

85
chirality. Information such as the oxidation number, coordination number and bond
distances can be acquired to build a model after probing the Zn species. Details of
the Zn sites which could be linear, trigonal, tetrahedral etc. can be revealed by
probing the Zn species. XAFS should be able to determine the transition state
structure at an initial stage of the reaction and also at different stages of the reaction.
It would be obvious if the central zinc probed has one or more zinc neighbours which
would imply the existence of a monomer, dimer etc. Evidence of the characteristic
structure of zinc species in toluene and THF is expected to be different using XAFS
because THF is a polar solvent and therefore has an affinity for metals. This would
confirm the poor performance of the Soai autocatalytic reaction in THF by the
provision of a model which has so far not been visited.
It is expected that chapters further in this work provide one model that suitably
characterises the Zn catalyst. This is unlike other models proposed earlier in this
chapter which suggest different models using the same technique.
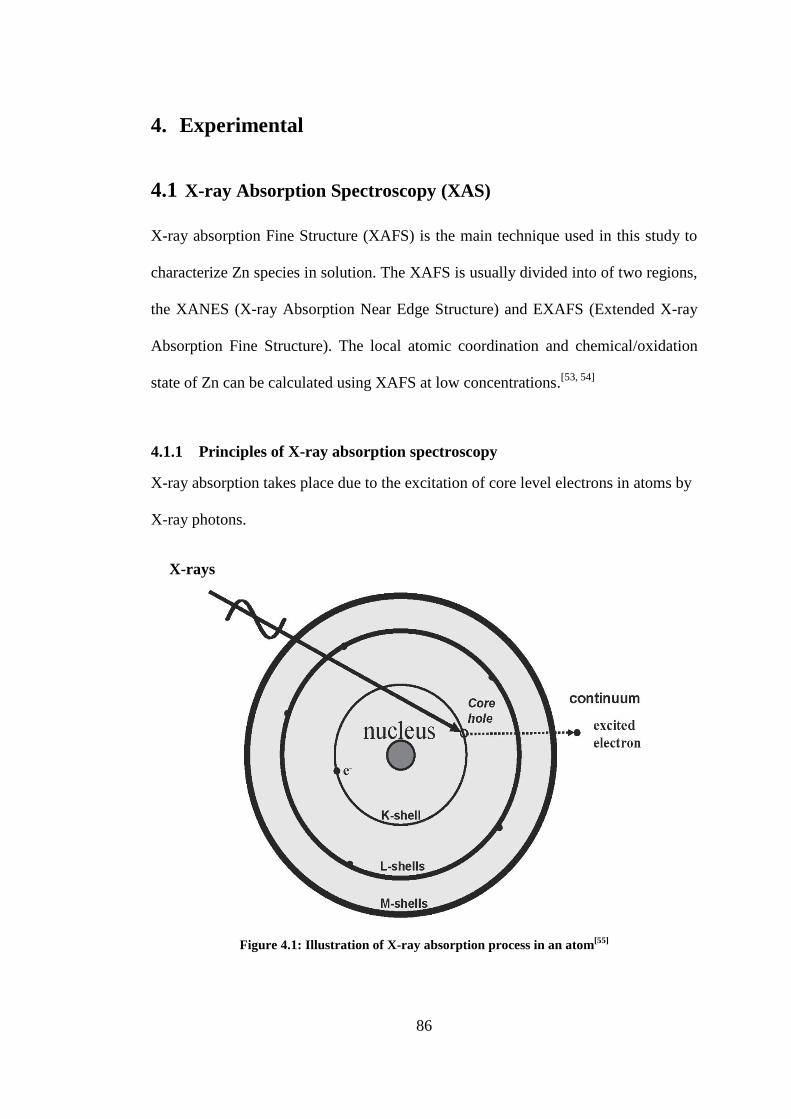
86
4. Experimental
4.1 X-ray Absorption Spectroscopy (XAS)
X-ray absorption Fine Structure (XAFS) is the main technique used in this study to
characterize Zn species in solution. The XAFS is usually divided into of two regions,
the XANES (X-ray Absorption Near Edge Structure) and EXAFS (Extended X-ray
Absorption Fine Structure). The local atomic coordination and chemical/oxidation
state of Zn can be calculated using XAFS at low concentrations.[53, 54]
4.1.1 Principles of X-ray absorption spectroscopy
X-ray absorption takes place due to the excitation of core level electrons in atoms by
X-ray photons.
Figure 4.1: Illustration of X-ray absorption process in an atom[55]
X-rays

87
The more weakly bound valence electrons occupy outer shell orbitals. These
electrons take part in chemical bond formation.
X-rays are photons, which are electromagnetic radiation. The electromagnetic
spectrum includes radio and television waves, microwaves, infrared light, X-rays and
gamma rays.
Figure 4.2: Spectrum of photon energy in wavelength and frequency[55]
Photons possess wave and particle like properties. The energy of X-rays is usually
expressed in electron volts (eV). The relation between energy and wavelength is:
E = hc/, (in Joules, J) 4.1
Where h is Planck‟s constant and c is the speed of light.
Three types of X-ray scattering are known which include Compton, Rayleigh and X-
ray Raman scattering. They all result from the interaction of electrons with X-rays.
Compton scattering is an inelastic process in which the X-ray loses energy, whereas
Rayleigh scattering is elastic and occurs because the oscillating electric field induces
oscillation in the electrons. Stronger elastic X-ray scattering is observed for heavier
atoms, because they have more electrons.
When an atom acquires all the energy of an X-ray, X-ray absorption occurs. This
gained energy excites the core electrons into higher energy unoccupied electron

88
orbitals or into the continuum where the electron is no longer bound by the atom.
The latter free electrons are usually referred to as photoelectrons. When the core
electrons are excited, a core hole is left behind. Within less than 10-15
s, an electron
from a higher energy orbital fills the core hole. This transition results in the release
of energy which can be in the form of fluorescence radiation, Auger electron
production or secondary electron production.
The filling of a core hole by a more weakly bound electron can also result in X-ray
fluorescence. The fluorescent X-ray energy is, in a first approximation, the difference
between the binding energy of the two core levels involved in the transition. The
fluorescence X-ray energy for a given electronic transition is element specific.
An alternative way for the system to lose energy during the process of core hole
deexcitation is the loss of energy by emission of additional electrons, either from the
same core levels involved in the deexcitation process or from different shells. This is
known as Auger electron production. The final steps of core hole relaxation by
electron emission is the production of secondary electrons and lower energy
(UV/Vis) photons.[55]
4.1.2 XANES and EXAFS
X-ray absorption spectra are typically acquired from about 200 eV below the
absorption edge to 1000 eV above. The X-ray absorption near edge structure
(XANES) is the region ranging from the absorption edge to about 40 eV above the
edge (Figure 4.3). The near-edge structure is determined by the density of states
available to the excited photoelectron. The coordination geometry and oxidation state
affect this part of the spectrum. The region after the XANES is known as the
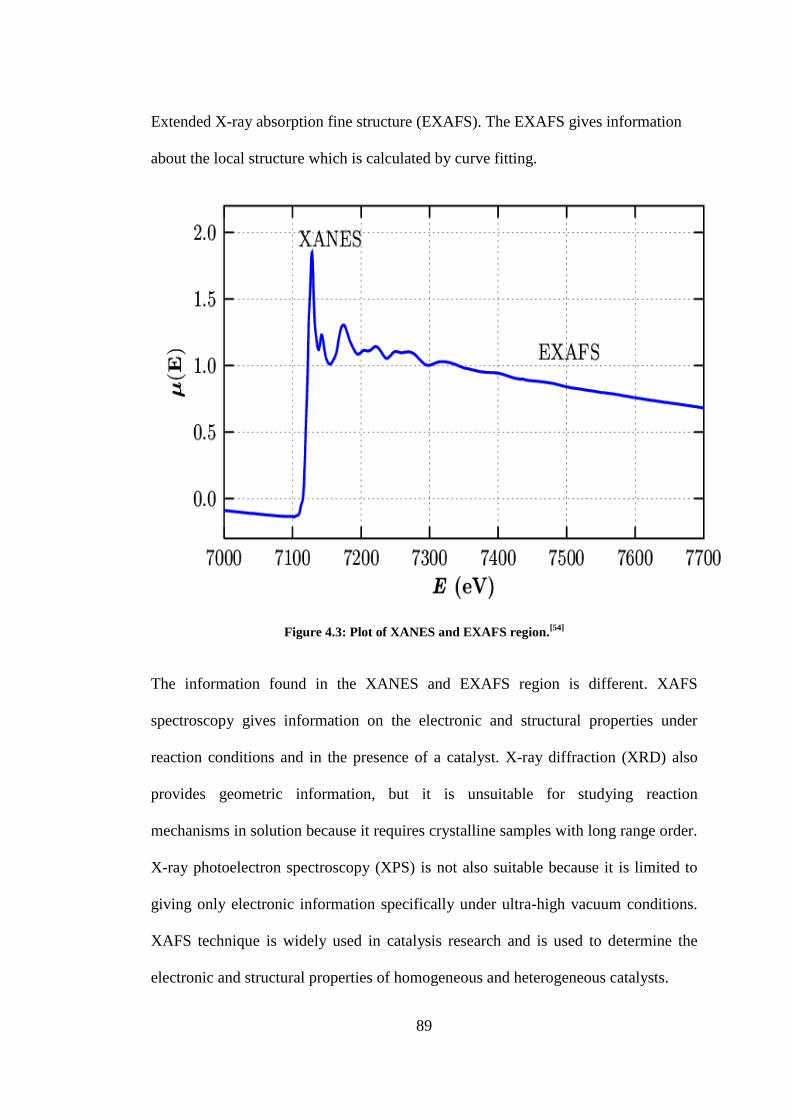
89
Extended X-ray absorption fine structure (EXAFS). The EXAFS gives information
about the local structure which is calculated by curve fitting.
Figure 4.3: Plot of XANES and EXAFS region.[54]
The information found in the XANES and EXAFS region is different. XAFS
spectroscopy gives information on the electronic and structural properties under
reaction conditions and in the presence of a catalyst. X-ray diffraction (XRD) also
provides geometric information, but it is unsuitable for studying reaction
mechanisms in solution because it requires crystalline samples with long range order.
X-ray photoelectron spectroscopy (XPS) is not also suitable because it is limited to
giving only electronic information specifically under ultra-high vacuum conditions.
XAFS technique is widely used in catalysis research and is used to determine the
electronic and structural properties of homogeneous and heterogeneous catalysts.

90
4.1.3 Physical principles
An incident beam of X-ray photons of intensity I, will be decreased by an amount
that is determined by the absorption characteristics of the irradiated material. The
relation between the path length dx and intensity is:
dI = -µ(E)Idx 4.2
Lambert‟s law is derived by integrating the above equation considering the total
thickness x:
It = I0e-µ(E)x
4.3
The excitation of an electron from a core to a vacant excited state or the continuum
results in a sudden rise (threshold energy or absorption edge) in the absorption
intensity. The kinetic energy of the electron (Ek) for any energy above the absorption
edge is defined by:
Ek = h- Ebinding 4.4
Figure 4.4: (a) Photoelectric effect in terms of excitation of different orbital or different energy
levels. (b) Illustration of neighbouring shells of atoms about the absorber. Interference between
outgoing photoelectron wave and backscattered off neighbouring atoms shell.[56]
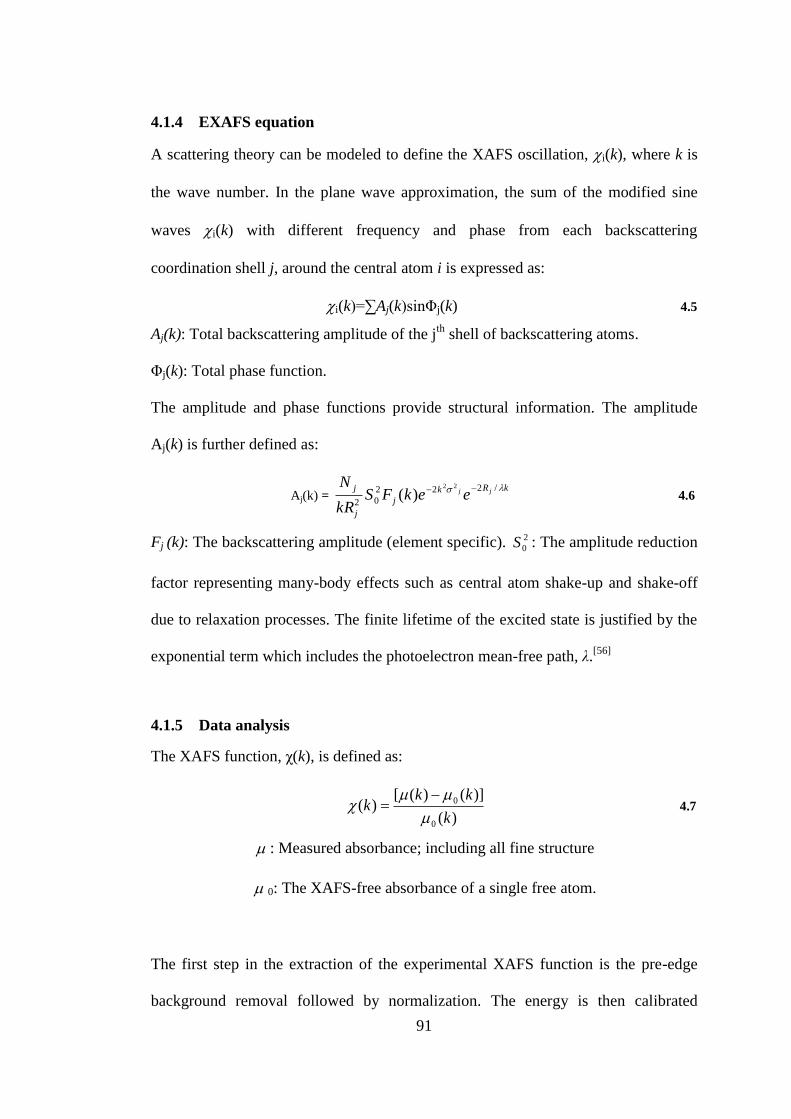
91
4.1.4 EXAFS equation
A scattering theory can be modeled to define the XAFS oscillation, i(k), where k is
the wave number. In the plane wave approximation, the sum of the modified sine
waves i(k) with different frequency and phase from each backscattering
coordination shell j, around the central atom i is expressed as:
i(k)=∑Aj(k)sinΦj(k) 4.5
Aj(k): Total backscattering amplitude of the jth
shell of backscattering atoms.
Φj(k): Total phase function.
The amplitude and phase functions provide structural information. The amplitude
Aj(k) is further defined as:
Aj(k) = kRk
j
j
j jj eekFSkR
N /222
02
22
)(
4.6
Fj (k): The backscattering amplitude (element specific). 2
0S : The amplitude reduction
factor representing many-body effects such as central atom shake-up and shake-off
due to relaxation processes. The finite lifetime of the excited state is justified by the
exponential term which includes the photoelectron mean-free path, λ.[56]
4.1.5 Data analysis
The XAFS function, χ(k), is defined as:
)(
)]()([)(
0
0
k
kkk
4.7
: Measured absorbance; including all fine structure
0: The XAFS-free absorbance of a single free atom.
The first step in the extraction of the experimental XAFS function is the pre-edge
background removal followed by normalization. The energy is then calibrated

92
(calibrated with zinc foil in this study) and it is converted to k-space. Several known
programs are available to process XAFS data which include Ifeffit packages: Athena
and Artermis, WinXAS, GNXAS[57]
and EXAFSPAK. In this work the Iffefit
packages: Athena and Artemis are utilized in the extraction of EXAFS oscillation
and data refinement.[58]
Two spectra were collected on an average for XANES and
EXAFS during this study and no changes were observed over short periods.
Background correction: Correction is necessary to eliminate effects that affect the
experimental absorption spectrum. Such effects include instrumental effects, sample
cell absorption, effects of other atoms (or electrons) in a sample. Ideally, only the
specific absorption of the atom chosen for study should remain for EXAFS analysis.
The pre-edge region is fitted with a polynomial (linear or quadratic) function and the
fit values are deducted from raw data.
Normalization: Normalization ensures that amplitude of the signal is in the right
scale and compensates for uncertainties in the concentration and sample thickness.
This process is achieved after pre-edge background correction and is done by
dividing experimental data collected from a synchrotron by the edge step.[59]
Threshold energy, E0: E0 is the minimum energy needed to excite a photoelectron and
can be correlated to the kinetic energy of the electron.[60]
The photon energy E of the
incident beam defines the wave vector k of the photoelectron:
k = {0.2625(E-E0)}1/2
4.8
E0 is the Fermi energy in version 8 of the FEFF program and is in a first
approximation taken as the first maximum derivative of the edge. E0 can be affected
by the oxidation state, covalency in chemical bonds etc.

93
Conversion to k-space: The energy scale can be changed from eV to the
photoelectron wave number, k (Å-1
) by the following correlations:
Kinetic energy of the photoelectron, E- E0 = 1/2mev2
= (mev)2/2me = P
2/2me
Photoelectron momentum, P = ħ.k 4.9
k = wave vector = e
2 = photoelectron wave number 4.10
E- E0 =
em
k
2
22 k
2
0 )(2
EEme = 2/1
0 )}(2625.0 EE
4.11
When k = 0; the energy is the threshold energy.
Spline atomic background removal: The total absorption coefficient µ(k) of an
isolated atom is expressed as:
)}(1){()( 0 kkk
4.12
Where )(k denotes the fractional change (modulation) in the absorption coefficient
induced by neighbouring atoms and contains structural information.
XAFS )(k can therefore be defined as:
)(k = )(
)]()([
0
0
k
kk
4.13
µ0(k) is the atomic background absorption for an isolated atom at the same energy.
With high k values the amplitude of the oscillations becomes smaller because of a
decrease in absorption with increasing energy. Dividing by µ0(k) normalises the
XAFS data. The EXAFS region µ0(k) function is determined by the smooth curve,
µspline(k) fitted from experimental data. µspline(k) is used as an approximation for µ0(k)
during normalization:
)(k =
)(
)]()([
k
kk
spline
splinedata
4.14
The Victoreen approximation of the absorption coefficient, µvic which is given by:
µvic = Cvic λ3 - Dvic λ
4. The EXAFS function is then defined as:
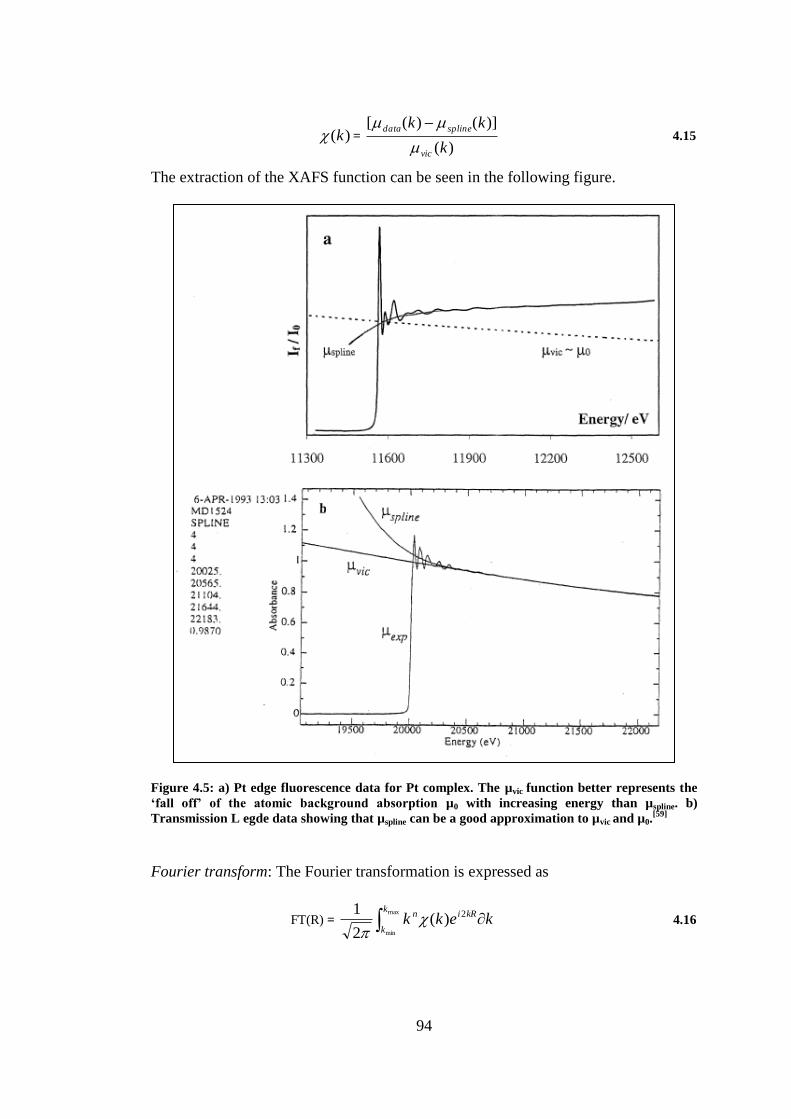
94
)(k =
)(
)]()([
k
kk
vic
splinedata
4.15
The extraction of the XAFS function can be seen in the following figure.
Figure 4.5: a) Pt edge fluorescence data for Pt complex. The µvic function better represents the
‘fall off’ of the atomic background absorption µ0 with increasing energy than µspline. b)
Transmission L egde data showing that µspline can be a good approximation to µvic and µ0.[59]
Fourier transform: The Fourier transformation is expressed as
FT(R) = max
min
2)(2
1 k
k
kRin kekk
4.16
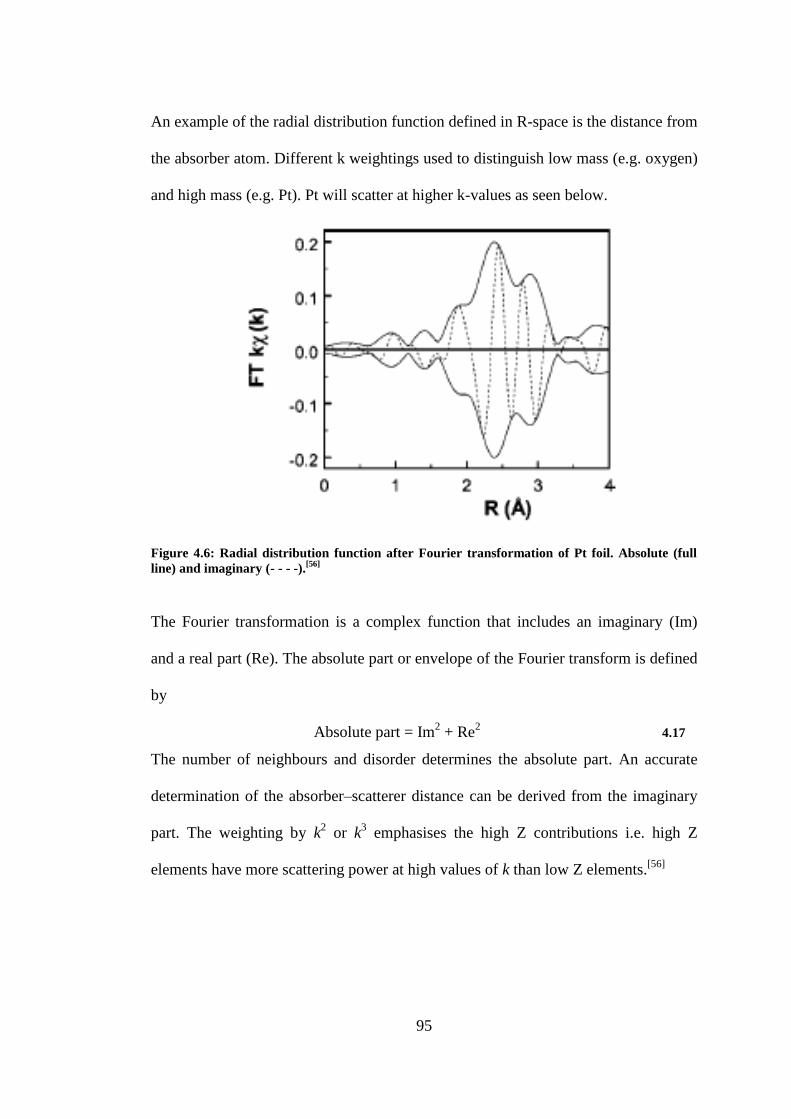
95
An example of the radial distribution function defined in R-space is the distance from
the absorber atom. Different k weightings used to distinguish low mass (e.g. oxygen)
and high mass (e.g. Pt). Pt will scatter at higher k-values as seen below.
Figure 4.6: Radial distribution function after Fourier transformation of Pt foil. Absolute (full
line) and imaginary (- - - -).[56]
The Fourier transformation is a complex function that includes an imaginary (Im)
and a real part (Re). The absolute part or envelope of the Fourier transform is defined
by
Absolute part = Im2 + Re
2 4.17
The number of neighbours and disorder determines the absolute part. An accurate
determination of the absorber–scatterer distance can be derived from the imaginary
part. The weighting by k2 or k
3 emphasises the high Z contributions i.e. high Z
elements have more scattering power at high values of k than low Z elements.[56]

96
FEFF program: FEFF8 can be used for data analysis. It calculates the phase shifts,
effective scattering amplitudes for single and multiple scattering pathways for XAFS
and XANES spectra.[61]
ATOMS: This program converts crystallographic data to a text file that is a Feff input
file.[56, 58, 62]
4.2 Miniaturized continuous flow reaction vessels
In this study a continuous flow tubular reactor and microcentrifuge tubes are used to
measure XAFS data in situ. The physical importance of downscaling to miniaturized
reactors is explored in this section.
4.2.1 Introduction
In the laboratory reactions are carried out in large volumes from to a few hundred
milliliters. Aliquots can be withdrawn from reactions off-line and analyzed batch-
wise. The disadvantage of such large quantities is analysis is slow and it takes longer
for a homogenous temperature and concentration distribution to be attained. This
may however lead to side products giving rise to lower yields and process
selectivity.[63]
Microreactor technology minimizes this problem and is used today by
several researchers. It involves a low volume of reagents in a laminar flow in which a
thermal and concentration gradient is present. The yield of reactions in microreactors
is notably high in much shorter times. Clearly microreactors are a new, safe and
efficient method to increase awareness of complex chemical processes.[64-66]
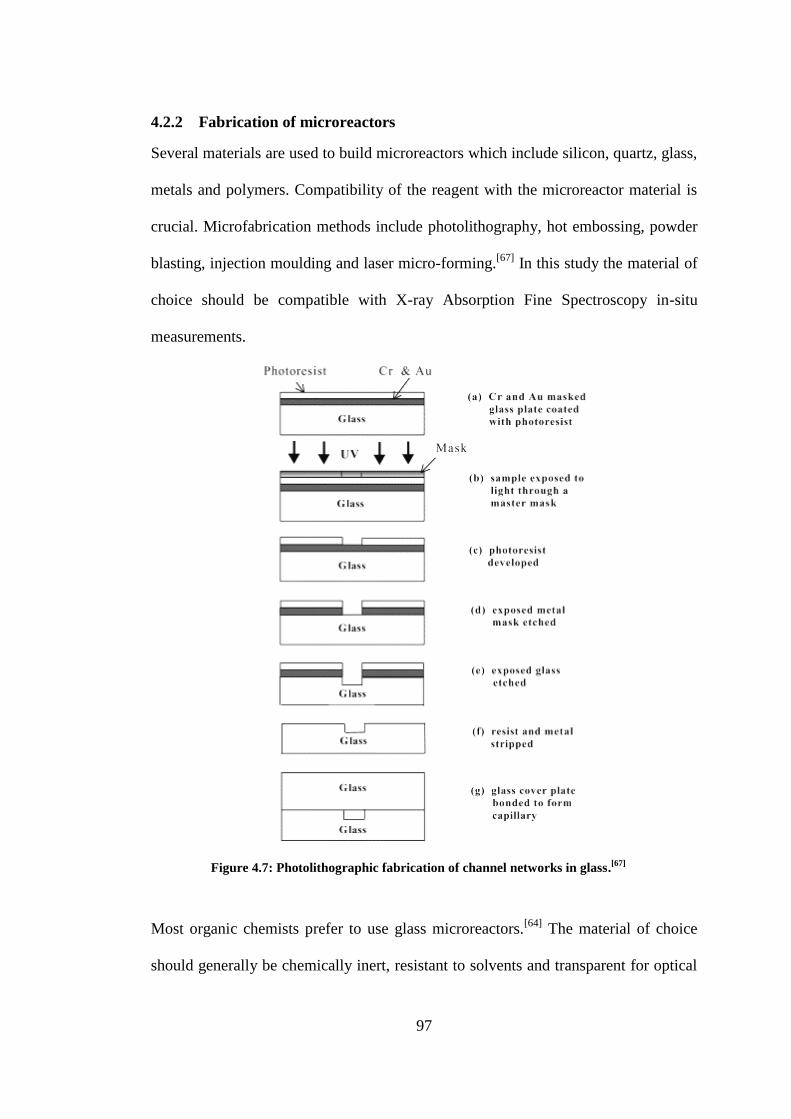
97
4.2.2 Fabrication of microreactors
Several materials are used to build microreactors which include silicon, quartz, glass,
metals and polymers. Compatibility of the reagent with the microreactor material is
crucial. Microfabrication methods include photolithography, hot embossing, powder
blasting, injection moulding and laser micro-forming.[67]
In this study the material of
choice should be compatible with X-ray Absorption Fine Spectroscopy in-situ
measurements.
Figure 4.7: Photolithographic fabrication of channel networks in glass.[67]
Most organic chemists prefer to use glass microreactors.[64]
The material of choice
should generally be chemically inert, resistant to solvents and transparent for optical
98
inspection. The material should avoid chemical species absorption and should have
suitable thermal and electrical properties.[63]
4.2.3 Microfluidic handling and effects of downsizing
Methods used to drive liquids in microchannels are electrokinetic, pressure driven
and flow driven. Driving a liquid through microchannels should target optimal
control on reaction conditions. A homogenous flow rate should be provided by the
pumping mechanism and this should not be affected by temperature, viscosity or
pressure that may change with time. In addition dead volumes due to connections
and tubings should be minimized to optimize control.[63]
In this study a flow driven
mechanism is used to pump the liquid through a cell while XAFS measurements are
collected. Flow with a high level of control is ensured by the use of syringe pumps or
peristaltic pumps and is suitable for time resolved reactions.[63, 68]
Reducing the reactor size has the advantage over lab-scale because less space is
required, less energy and reagents; and a shorter reaction time is involved. Process
safety and higher yields are also more likely. The consequence of downscaling is a
large surface to volume ratio which causes a higher mass and heat transfer compared
to lab scale reactors. An investigation of a study of the reliance of the reaction yield
on the residence times in microreactors under isothermal conditions is illustrated
below.
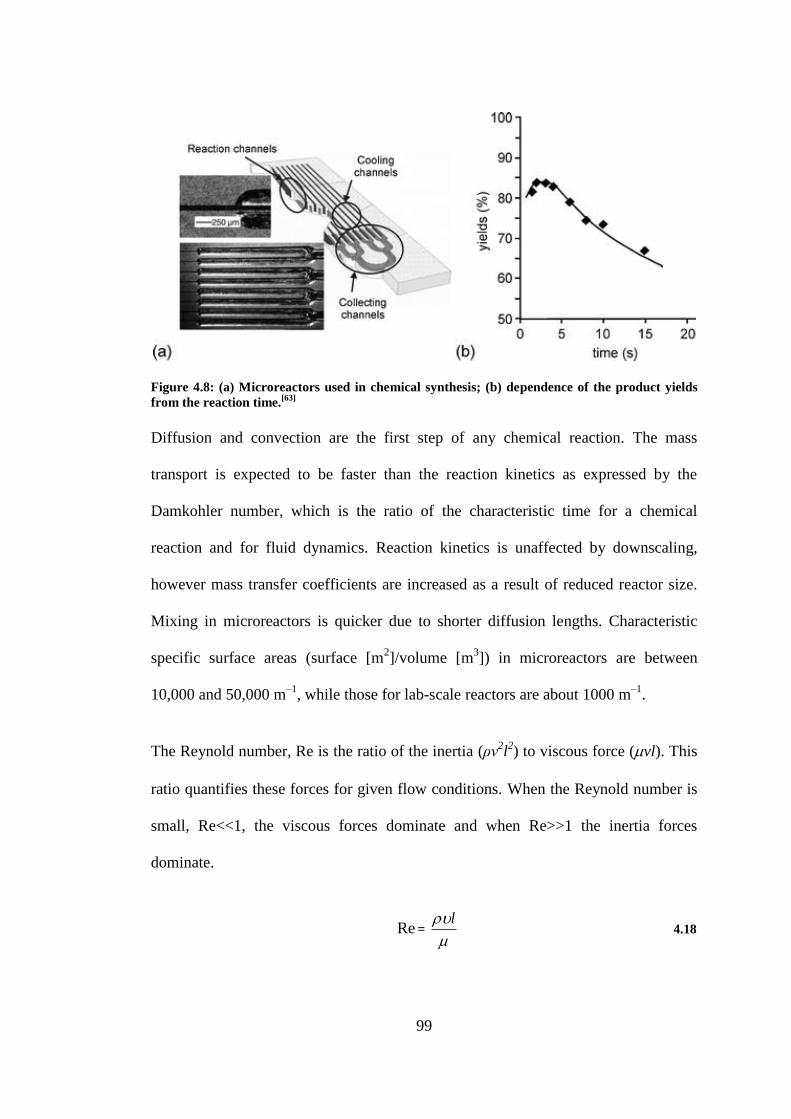
99
Figure 4.8: (a) Microreactors used in chemical synthesis; (b) dependence of the product yields
from the reaction time.[63]
Diffusion and convection are the first step of any chemical reaction. The mass
transport is expected to be faster than the reaction kinetics as expressed by the
Damkohler number, which is the ratio of the characteristic time for a chemical
reaction and for fluid dynamics. Reaction kinetics is unaffected by downscaling,
however mass transfer coefficients are increased as a result of reduced reactor size.
Mixing in microreactors is quicker due to shorter diffusion lengths. Characteristic
specific surface areas (surface [m2]/volume [m
3]) in microreactors are between
10,000 and 50,000 m–1
, while those for lab-scale reactors are about 1000 m–1
.
The Reynold number, Re is the ratio of the inertia (ρv2l2) to viscous force (vl). This
ratio quantifies these forces for given flow conditions. When the Reynold number is
small, Re<<1, the viscous forces dominate and when Re>>1 the inertia forces
dominate.
Re =
l
4.18
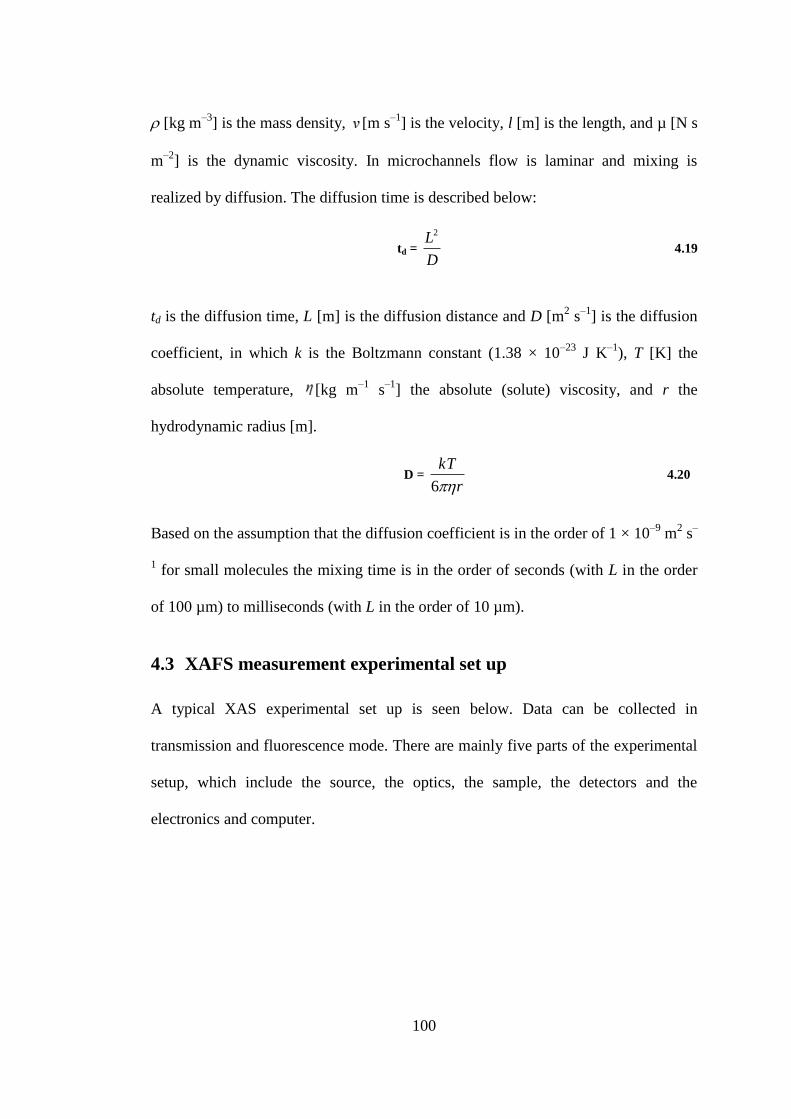
100
[kg m–3
] is the mass density, [m s–1
] is the velocity, l [m] is the length, and µ [N s
m–2
] is the dynamic viscosity. In microchannels flow is laminar and mixing is
realized by diffusion. The diffusion time is described below:
td = D
L2
4.19
td is the diffusion time, L [m] is the diffusion distance and D [m2 s
–1] is the diffusion
coefficient, in which k is the Boltzmann constant (1.38 × 10⁻²³
J K–1
), T [K] the
absolute temperature, [kg m–1
s–1
] the absolute (solute) viscosity, and r the
hydrodynamic radius [m].
D = r
kT
6
4.20
Based on the assumption that the diffusion coefficient is in the order of 1 × 10⁻⁹
m2 s
–
1 for small molecules the mixing time is in the order of seconds (with L in the order
of 100 µm) to milliseconds (with L in the order of 10 µm).
4.3 XAFS measurement experimental set up
A typical XAS experimental set up is seen below. Data can be collected in
transmission and fluorescence mode. There are mainly five parts of the experimental
setup, which include the source, the optics, the sample, the detectors and the
electronics and computer.

101
Figure 4.9: Schematic of XAS experiment[69]
In terms of the optics and detectors several types are known. The illustration below
includes a monochromator and mirrors for harmonic rejection.
Figure 4.10: Optics and detectors[69]
The different sorts of detectors mainly used include ion chambers, diodes, energy
discriminating and wavelength dispersive detectors.
XAFS data are acquired in transmission mode by passing the photon beam through
the sample, with the intensities of the incident (I0) and the transmitted (IT) beams
each collected by an ionization chamber. Fluorescence yield mode takes advantage
of the fact that the intensity of characteristic X-ray fluorescence, IF, is proportional to
the absorption coefficient, so the absorption spectrum is obtained from (E) = (IF/I0).
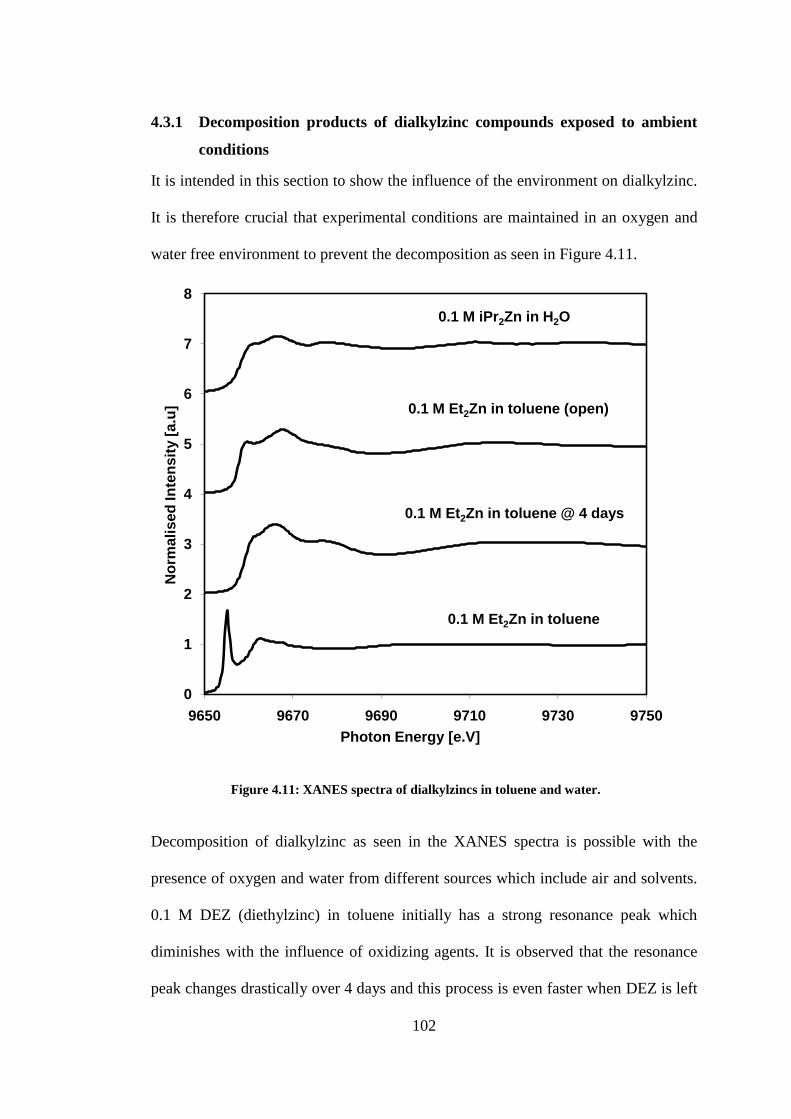
102
4.3.1 Decomposition products of dialkylzinc compounds exposed to ambient
conditions
It is intended in this section to show the influence of the environment on dialkylzinc.
It is therefore crucial that experimental conditions are maintained in an oxygen and
water free environment to prevent the decomposition as seen in Figure 4.11.
Figure 4.11: XANES spectra of dialkylzincs in toluene and water.
Decomposition of dialkylzinc as seen in the XANES spectra is possible with the
presence of oxygen and water from different sources which include air and solvents.
0.1 M DEZ (diethylzinc) in toluene initially has a strong resonance peak which
diminishes with the influence of oxidizing agents. It is observed that the resonance
peak changes drastically over 4 days and this process is even faster when DEZ is left
0
1
2
3
4
5
6
7
8
9650 9670 9690 9710 9730 9750
No
rma
lis
ed
In
ten
sit
y [
a.u
]
Photon Energy [e.V]
0.1 M Et2Zn in toluene
0.1 M Et2Zn in toluene @ 4 days
0.1 M Et2Zn in toluene (open)
0.1 M iPr2Zn in H2O
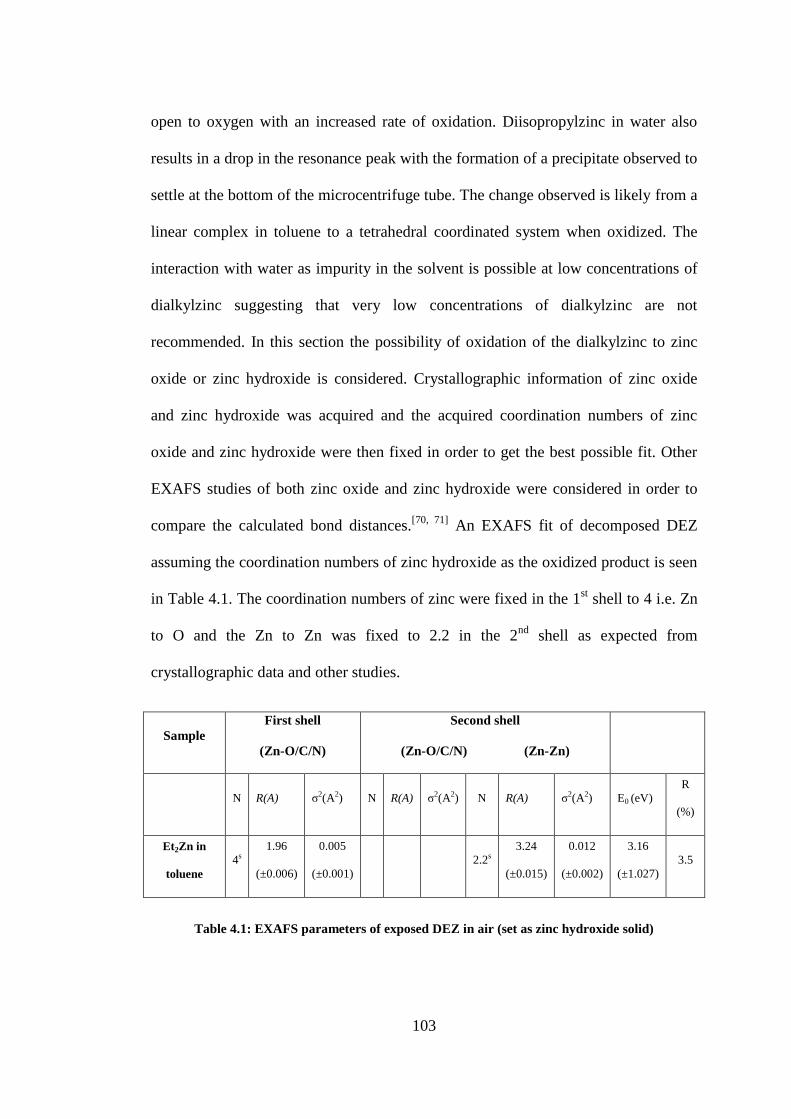
103
open to oxygen with an increased rate of oxidation. Diisopropylzinc in water also
results in a drop in the resonance peak with the formation of a precipitate observed to
settle at the bottom of the microcentrifuge tube. The change observed is likely from a
linear complex in toluene to a tetrahedral coordinated system when oxidized. The
interaction with water as impurity in the solvent is possible at low concentrations of
dialkylzinc suggesting that very low concentrations of dialkylzinc are not
recommended. In this section the possibility of oxidation of the dialkylzinc to zinc
oxide or zinc hydroxide is considered. Crystallographic information of zinc oxide
and zinc hydroxide was acquired and the acquired coordination numbers of zinc
oxide and zinc hydroxide were then fixed in order to get the best possible fit. Other
EXAFS studies of both zinc oxide and zinc hydroxide were considered in order to
compare the calculated bond distances.[70, 71]
An EXAFS fit of decomposed DEZ
assuming the coordination numbers of zinc hydroxide as the oxidized product is seen
in Table 4.1. The coordination numbers of zinc were fixed in the 1st shell to 4 i.e. Zn
to O and the Zn to Zn was fixed to 2.2 in the 2nd
shell as expected from
crystallographic data and other studies.
Table 4.1: EXAFS parameters of exposed DEZ in air (set as zinc hydroxide solid)
Sample
First shell
(Zn-O/C/N)
Second shell
(Zn-O/C/N) (Zn-Zn)
N R(A) σ2(A2) N R(A) σ2(A2) N R(A) σ2(A2) E0 (eV)
R
(%)
Et2Zn in
toluene
4s
1.96
(±0.006)
0.005
(±0.001)
2.2s
3.24
(±0.015)
0.012
(±0.002)
3.16
(±1.027)
3.5
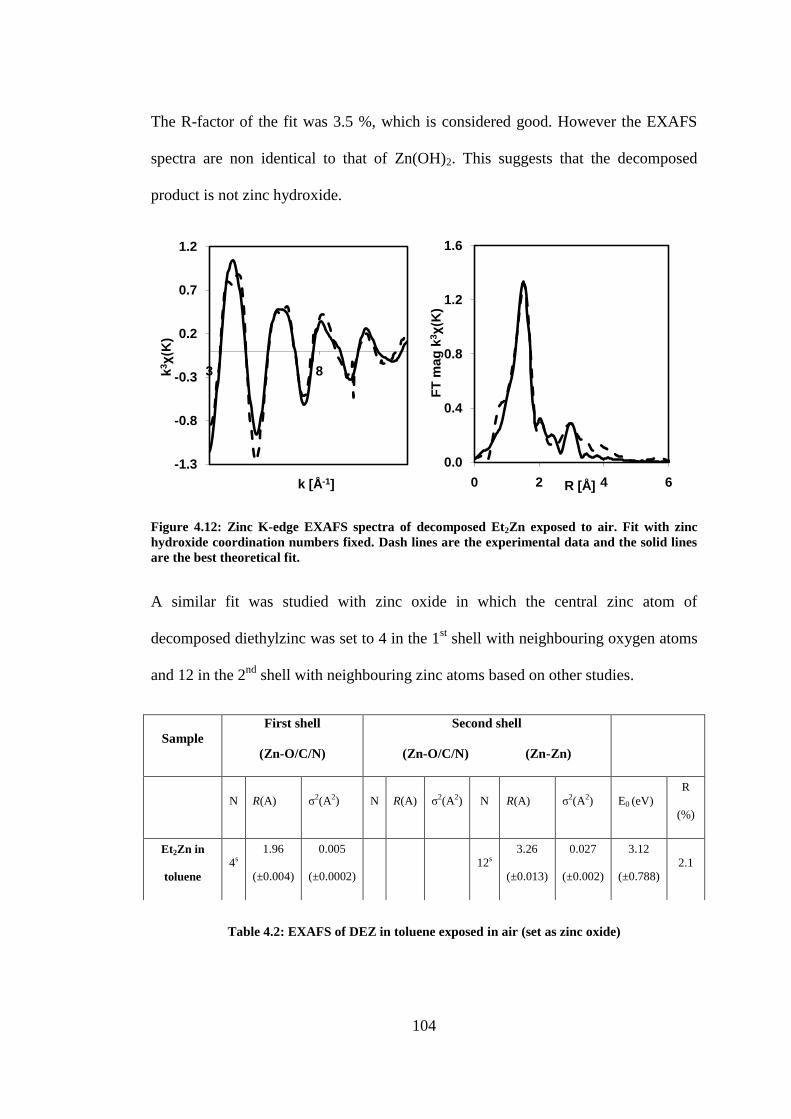
104
The R-factor of the fit was 3.5 %, which is considered good. However the EXAFS
spectra are non identical to that of Zn(OH)2. This suggests that the decomposed
product is not zinc hydroxide.
Figure 4.12: Zinc K-edge EXAFS spectra of decomposed Et2Zn exposed to air. Fit with zinc
hydroxide coordination numbers fixed. Dash lines are the experimental data and the solid lines
are the best theoretical fit.
A similar fit was studied with zinc oxide in which the central zinc atom of
decomposed diethylzinc was set to 4 in the 1st shell with neighbouring oxygen atoms
and 12 in the 2nd
shell with neighbouring zinc atoms based on other studies.
Table 4.2: EXAFS of DEZ in toluene exposed in air (set as zinc oxide)
-1.3
-0.8
-0.3
0.2
0.7
1.2
3 8k3χ(K
)
k [Å-1]
0.0
0.4
0.8
1.2
1.6
0 2 4 6
FT
mag
k3χ(K
)
R [Å]
Sample
First shell
(Zn-O/C/N)
Second shell
(Zn-O/C/N) (Zn-Zn)
N R(A) σ2(A2) N R(A) σ2(A2) N R(A) σ2(A2) E0 (eV)
R
(%)
Et2Zn in
toluene
4s
1.96
(±0.004)
0.005
(±0.0002)
12s
3.26
(±0.013)
0.027
(±0.002)
3.12
(±0.788)
2.1

105
The EXAFS fit based on zinc oxide has an R-factor of 2.1% implying a better fit
compared to zinc hydroxide as seen below.
Figure 4.13: Zinc K edge EXAFS spectra of decomposed Et2Zn exposed to air. Fit with zinc
oxide coordination numbers fixed. Dotted lines are the experimental data and the solid lines are
the best theoretical fit.
By virtue of the R-factor of the above EXAFS fits of decomposed DEZ it is likely
that the product formed after DEZ oxidation is closer to zinc oxide (The R-factor
calculated here is about two times smaller) than zinc hydroxide. It must be noted here
that neither of them is the decomposed product. The above two fits have similar Zn-
O bond distances in the 1st shell at about 1.96 Å with the same coordination number
of oxygen (4) around the central zinc atom. There is a slight difference in the Zn..Zn
bond distance of 0.02 Å between ZnO and Zn(OH)2. The bond distances of this
EXAFS calculation are similar to other studies.[70]
-1.5
-1
-0.5
0
0.5
1
3 8k3χ(K
)
k [Å-1]0.0
0.4
0.8
1.2
0 2 4 6F
T m
ag
k3χ(K
)R [Å]
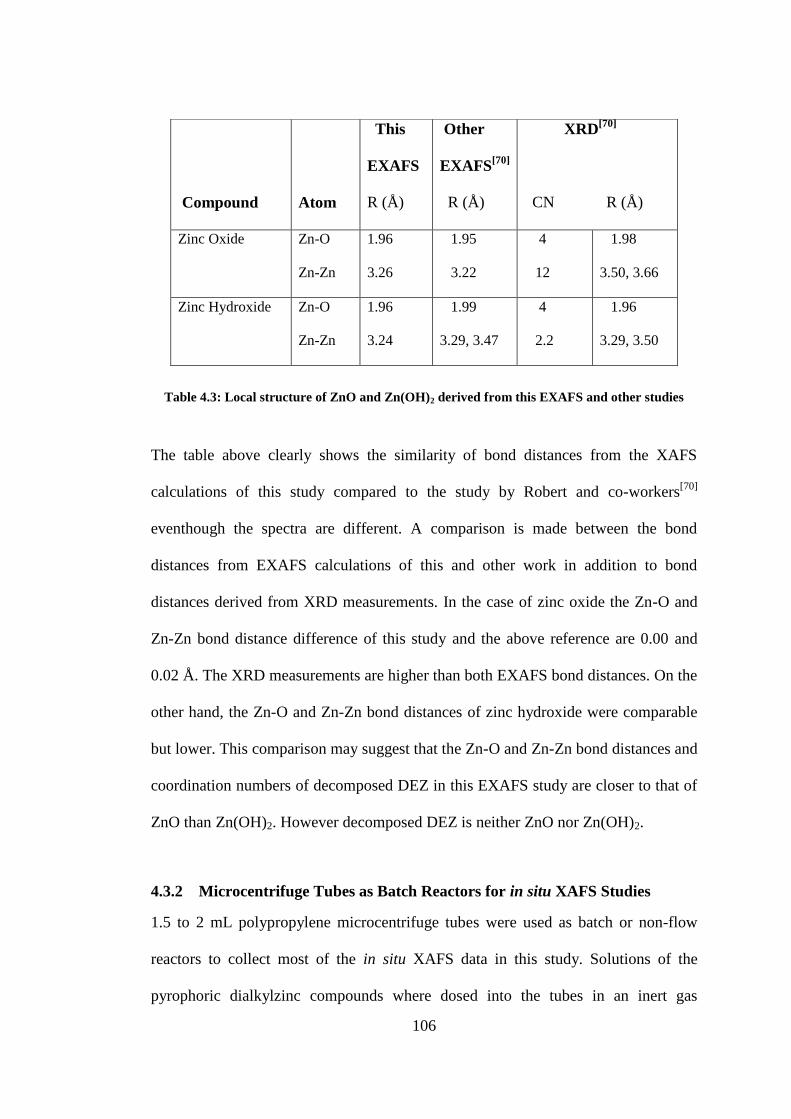
106
Table 4.3: Local structure of ZnO and Zn(OH)2 derived from this EXAFS and other studies
The table above clearly shows the similarity of bond distances from the XAFS
calculations of this study compared to the study by Robert and co-workers[70]
eventhough the spectra are different. A comparison is made between the bond
distances from EXAFS calculations of this and other work in addition to bond
distances derived from XRD measurements. In the case of zinc oxide the Zn-O and
Zn-Zn bond distance difference of this study and the above reference are 0.00 and
0.02 Å. The XRD measurements are higher than both EXAFS bond distances. On the
other hand, the Zn-O and Zn-Zn bond distances of zinc hydroxide were comparable
but lower. This comparison may suggest that the Zn-O and Zn-Zn bond distances and
coordination numbers of decomposed DEZ in this EXAFS study are closer to that of
ZnO than Zn(OH)2. However decomposed DEZ is neither ZnO nor Zn(OH)2.
4.3.2 Microcentrifuge Tubes as Batch Reactors for in situ XAFS Studies
1.5 to 2 mL polypropylene microcentrifuge tubes were used as batch or non-flow
reactors to collect most of the in situ XAFS data in this study. Solutions of the
pyrophoric dialkylzinc compounds where dosed into the tubes in an inert gas
Compound
Atom
This
EXAFS
R (Å)
Other
EXAFS[70]
R (Å)
XRD[70]
CN R (Å)
Zinc Oxide Zn-O
Zn-Zn
1.96
3.26
1.95
3.22
4
12
1.98
3.50, 3.66
Zinc Hydroxide Zn-O
Zn-Zn
1.96
3.24
1.99
3.29, 3.47
4
2.2
1.96
3.29, 3.50
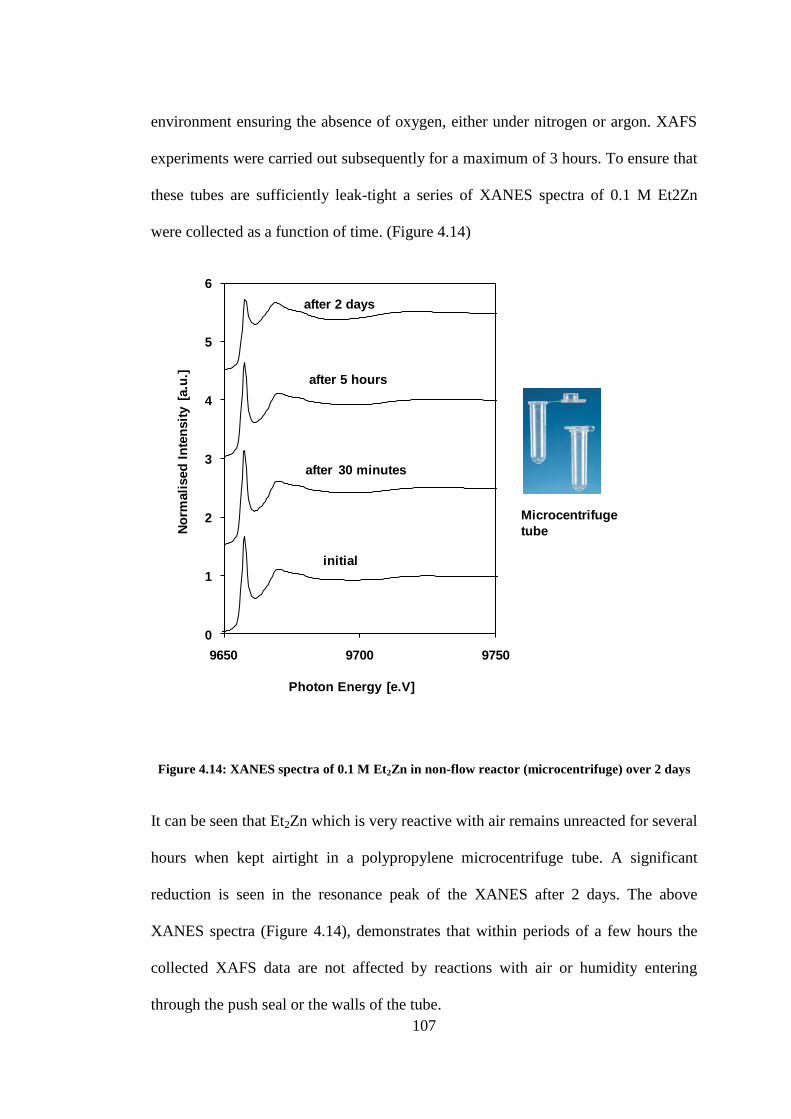
107
environment ensuring the absence of oxygen, either under nitrogen or argon. XAFS
experiments were carried out subsequently for a maximum of 3 hours. To ensure that
these tubes are sufficiently leak-tight a series of XANES spectra of 0.1 M Et2Zn
were collected as a function of time. (Figure 4.14)
Figure 4.14: XANES spectra of 0.1 M Et2Zn in non-flow reactor (microcentrifuge) over 2 days
It can be seen that Et2Zn which is very reactive with air remains unreacted for several
hours when kept airtight in a polypropylene microcentrifuge tube. A significant
reduction is seen in the resonance peak of the XANES after 2 days. The above
XANES spectra (Figure 4.14), demonstrates that within periods of a few hours the
collected XAFS data are not affected by reactions with air or humidity entering
through the push seal or the walls of the tube.
0
1
2
3
4
5
6
9650 9700 9750
No
rmali
sed
In
ten
sit
y [
a.u
.]
Photon Energy [e.V]
after 30 minutes
after 5 hours
after 2 days
initial
Microcentrifuge
tube
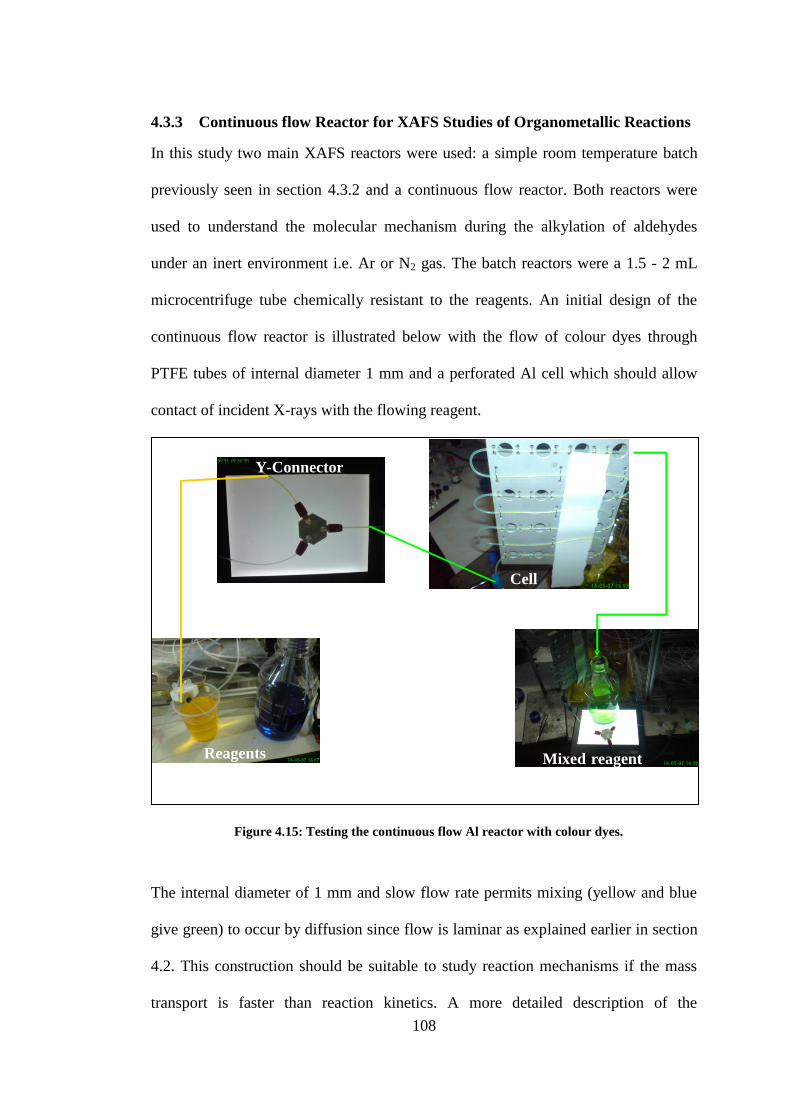
108
4.3.3 Continuous flow Reactor for XAFS Studies of Organometallic Reactions
In this study two main XAFS reactors were used: a simple room temperature batch
previously seen in section 4.3.2 and a continuous flow reactor. Both reactors were
used to understand the molecular mechanism during the alkylation of aldehydes
under an inert environment i.e. Ar or N2 gas. The batch reactors were a 1.5 - 2 mL
microcentrifuge tube chemically resistant to the reagents. An initial design of the
continuous flow reactor is illustrated below with the flow of colour dyes through
PTFE tubes of internal diameter 1 mm and a perforated Al cell which should allow
contact of incident X-rays with the flowing reagent.
Figure 4.15: Testing the continuous flow Al reactor with colour dyes.
The internal diameter of 1 mm and slow flow rate permits mixing (yellow and blue
give green) to occur by diffusion since flow is laminar as explained earlier in section
4.2. This construction should be suitable to study reaction mechanisms if the mass
transport is faster than reaction kinetics. A more detailed description of the
Cell
Mixed reagent Reagents
Y - Connector

109
continuous flow reactor as well as the possibilities and limitations of the continuous
tubular flow reactor for XAFS studies of organometallic reactions (seen in 4.3.4) has
been published as a conference proceeding.[72]
4.3.4 Continuous Tubular Reactor for XAFS Studies of Organometallic
Reactions: Possibilities and Limitations for Studies of the Soai Reaction1
The in situ flow XAFS measurements at the Zn K-edge were performed at station 9.3
of the SRS, UK, and at 12ID-B of the Advanced Photon Source (APS) at Argonne
National Laboratory (USA). Supporting work with non-flowing solutions was
performed using sealed Eppendorf microcentrifuge tubes at BM29 of the ESRF,
Grenoble, France. Solutions were loaded into the microcentrifuge tubes in a glove
bag continuously purged with dry N2. All reactions were performed at room
temperature. At all three beamlines simultaneous measurements in transmission
mode with gas ionization chambers and by fluorescence-yield (FY) detection with
multielement Ge detectors were performed. Reactants and dry toluene solvent were
obtained from Aldrich.
1This section has been published in the journal of physics conference series. [72] L. N. Nchari, G. A.
Hembury, A. M. Beesley, D. J. Meehan, N. Tsapatsaris, M. Hudson, M. Thomason, S. L. M.
Schroeder, 14th International Conference on X-Ray Absorption Fine Structure (Xafs14), Proceedings
2009, 190.
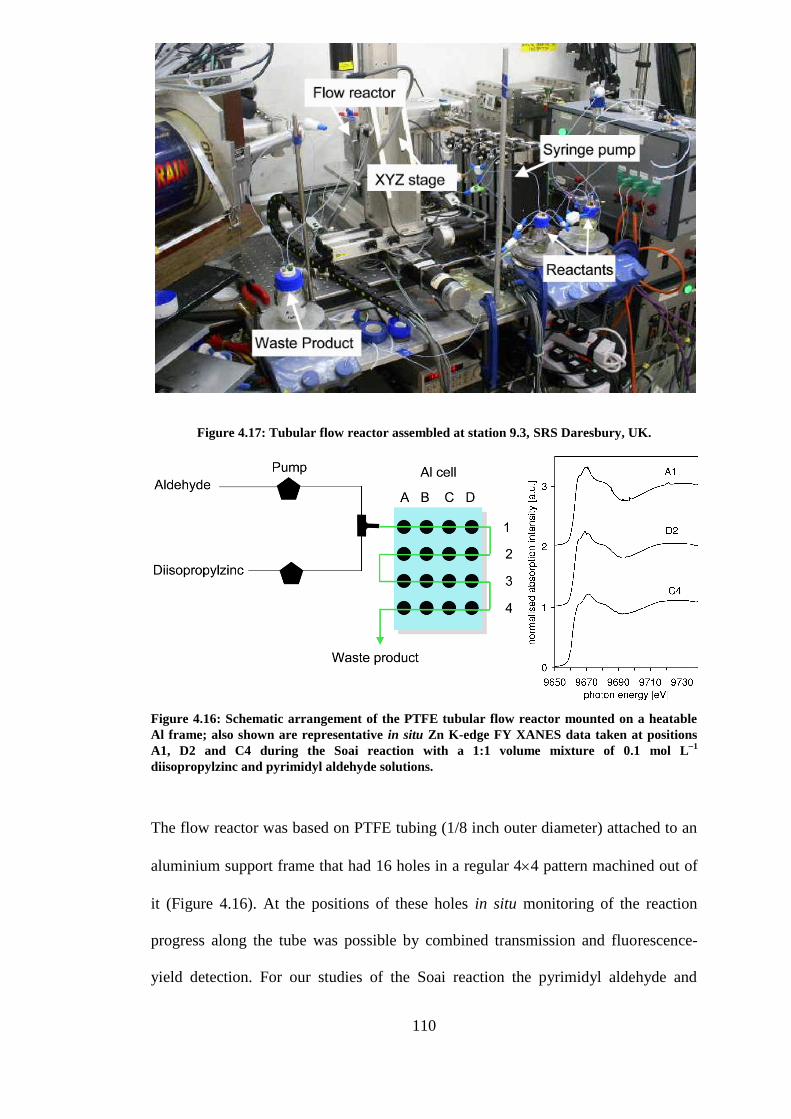
110
Figure 4.16: Schematic arrangement of the PTFE tubular flow reactor mounted on a heatable
Al frame; also shown are representative in situ Zn K-edge FY XANES data taken at positions
A1, D2 and C4 during the Soai reaction with a 1:1 volume mixture of 0.1 mol L1
diisopropylzinc and pyrimidyl aldehyde solutions.
The flow reactor was based on PTFE tubing (1/8 inch outer diameter) attached to an
aluminium support frame that had 16 holes in a regular 44 pattern machined out of
it (Figure 4.16). At the positions of these holes in situ monitoring of the reaction
progress along the tube was possible by combined transmission and fluorescence-
yield detection. For our studies of the Soai reaction the pyrimidyl aldehyde and
Figure 4.17: Tubular flow reactor assembled at station 9.3, SRS Daresbury, UK.

111
diisopropylzinc were mixed at the tube inlet by joining the two solution streams in a
PTFE „T‟-piece (Omnifit). The solution streams were provided by syringe pumps
(Versa 6, Kloehn) fitted with 1 mL syringes and non-distribution valves; they were
controlled remotely via a serial interface with a LabVIEW (National Instruments)
GUI. A pair of syringe pumps was used for each of the two reactants (0.1 mol L1
diisopropylzinc and pyrimidyl aldehyde solutions). Handshaking operation
synchronised the pump pairs: while one pump was dispensing the other was
aspirating in preparation for subsequent dosing. As mentioned above, due to the
oxygen and moisture sensitivity of this iPr2Zn solution a nitrogen atmosphere was
needed to keep the environment inert within the pump pairs and flow cell apparatus.
This was achieved by including a nitrogen feed on the multiport pump-head and
purging before introduction of iPr2Zn solution. The reactant solutions were also
prepared and stored under nitrogen. By varying the flow rate from the dosing pumps
it is possible to tune the flow rate in the reactor to obtain information about the
nature of metal species as a function of reaction time. Positioning in the X-ray beam
was achieved by using a computer controlled XYZ stage calibrated to the dimensions
of the reactor system. FY XANES data obtained at the APS during the reaction in a
solution containing 0.1 mol L1
of pyrimidyl aldehyde and 0.1 mol L1
diisopropylzinc are included in Figure 4.16. A photograph of the completely
assembled system at station 9.3 of the SRS is shown in Figure 4.17.
Flow Experiments
The XANES data from Figure 4.19 indicates that under the chosen flow conditions
the reaction had progressed almost to completion at the initial measurement point,
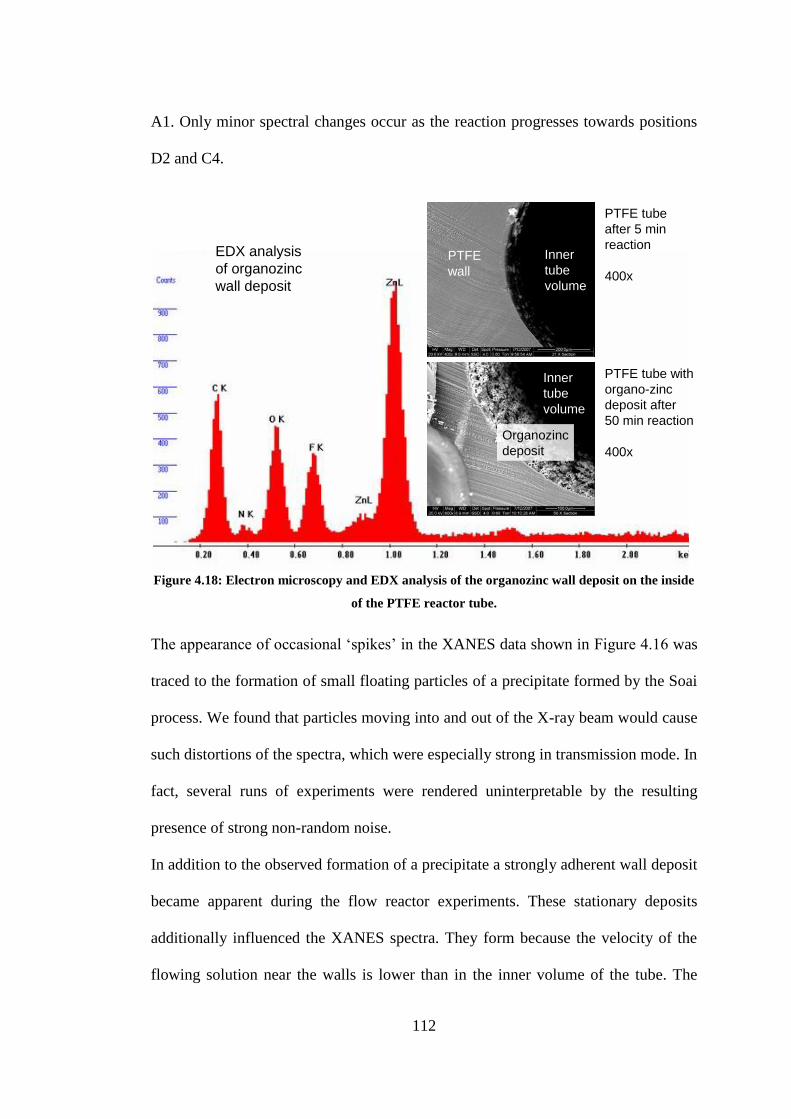
112
A1. Only minor spectral changes occur as the reaction progresses towards positions
D2 and C4.
Figure 4.18: Electron microscopy and EDX analysis of the organozinc wall deposit on the inside
of the PTFE reactor tube.
The appearance of occasional „spikes‟ in the XANES data shown in Figure 4.16 was
traced to the formation of small floating particles of a precipitate formed by the Soai
process. We found that particles moving into and out of the X-ray beam would cause
such distortions of the spectra, which were especially strong in transmission mode. In
fact, several runs of experiments were rendered uninterpretable by the resulting
presence of strong non-random noise.
In addition to the observed formation of a precipitate a strongly adherent wall deposit
became apparent during the flow reactor experiments. These stationary deposits
additionally influenced the XANES spectra. They form because the velocity of the
flowing solution near the walls is lower than in the inner volume of the tube. The
PTFE tube
after 5 min
reaction
400x
PTFE tube with
organo-zinc
deposit after
50 min reaction
400x
PTFE
wall
Inner
tube
volume
Inner
tube
volume
Organozinc
deposit
EDX analysis
of organozinc
wall deposit
113
extent to which wall deposits can grow quickly is illustrated by electron microscopic
images in Figure 4.18. The lower of the two images shows that after running the Soai
reaction for 50 min the deposit had a thickness of 5 µm. Ex situ energy-dispersive X-
ray (EDX) analysis (Figure 4.18) confirmed that the deposit contains ZnO and
organozinc material. It seems likely that the formation of such wall deposits can only
be suppressed if the reactor design is modified to maintain a high space velocity of
the reaction medium, for example through strong turbulent flow or shear, near the
wall where the XAFS measurements take place. Abrupt changes of flow direction or
introduction of constricted regions on the tube may achieve this objective.
The XANES data included in Figure 4.19 are reminiscent of the Zn K-edge XANES
of Zn2+
species in a tetrahedral environment, such as ZnO. This is illustrated in figure
4, in which the spectrum from position C4 is compared to a previously published
spectrum of solid crystalline ZnO. It can be seen that the energetic positions of the
shoulder at ~9664 eV, the main resonance at ~9669 eV and the broad resonance
around ~9682 eV coincide. Note however that the amplitudes of the XANES
resonances of the Soai product, and especially the features in the EXAFS region
(e.g., at ~9717 eV), are strongly reduced, indicating disorder relative to crystalline
ZnO on one hand and the presence of a significant self-absorption effect, likely
associated with the formation of the observed solid product on the other. It appears
that deposition of a poorly ordered ZnO and/or Zn(OH)2 product takes place on the
wall of the reactor tube and dominates the observed XAFS spectrum. The most likely
origin is the presence of residual water and/or O2 in the reaction system,
decomposing diisopropylzinc to Zn(OH)2 and ZnO, respectively.

114
Because of the problems associated with solid product formation the flow reactor
turned out to be unsuitable for a number of Soai aldehyde alkylation systems. For
this reason we reverted back to a simple static batch reactor experiment with
microcentrifuge tubes as described in section 4.3.2 that permitted separation of
solution phase and precipitates by gravitational settling.
Products of Soai Process under Non-Flow Conditions
Figure 4.19: In situ transmission XANES (BM29, ESRF) obtained in microcentrifuge tubes. From
top to bottom: Zn K-edge XANES spectra of a toluene solution containing 0.1 M diisopropylzinc;
the supernatant of a solution formed by reacting 0.1 M diisopropylzinc and 0.1 M pyrimidine
aldehyde in toluene; the sediment formed in this solution; a toluene solution containing 0.1 M
diisopropylzinc and 2 M pyrimidine aldehyde; the spectrum labelled C4 in figure 1 (measured at
the SRS); a spectrum of ZnO.
5H
H
O
Zn
O
N
N
N
N
5H
H
O
Zn
O
N
N
N
N
115
Experiments with a sealed static reactor cell (a standard Eppendorf polypropylene
microcentrifuge tube) allowed us to minimise the formation of wall deposits and to
selectively characterise the precipitate formed by the Soai process. This was
achieved by allowing sedimentation of the precipitate at the bottom of the
microcentrifuge tube, which also enabled us to separately examine the remaining
supernatant solution. Figure 4.19 contains the resulting transmission XANES spectra
of the sedimented precipitate (3rd
spectrum from top) and of the supernatant solution
(2nd
spectrum from top) obtained by mixing 0.1 mol L-1
aldehyde and 0.1 mol L-1
iPr2Zn in toluene in a 1:1 molar ratio. It can be seen by comparison with the
spectrum of iPr2Zn in toluene (top spectrum) that any Zn species remaining in the
supernatant solution stem from unreacted iPr2Zn. In contrast, the spectrum of the
sedimented precipitate (second spectrum from top) has no strong white line,
indicating that p-like valence states are occupied and that the local bonding and/or
coordination geometry are fundamentally different from that in iPr2Zn. For a 1:1
mixture of iPr2Zn and aldehyde one would statistically expect a product mixture
containing unreacted iPr2Zn as well as the monomeric species 3 and some
monomeric dialkoxide species 5 (Figure 4.19). To address which of these species
was responsible for the observed spectrum we carried out the reaction of iPr2Zn with
a 20-fold excess of aldehyde because this reaction is expected to result in the
formation of only the dialkoxide 5. Interestingly, the XANES spectrum of this
product (3rd
spectrum from bottom in Figure 4.19) is very similar to the spectrum of
the precipitate formed in the 1:1 mixture, indicating that the dialkoxide is
preferentially formed even when understoichiometric amounts of aldehyde are
supplied. What is currently not clear is whether the precipitate contains the
monomeric species 5 or whether the previously proposed dimers, trimers or
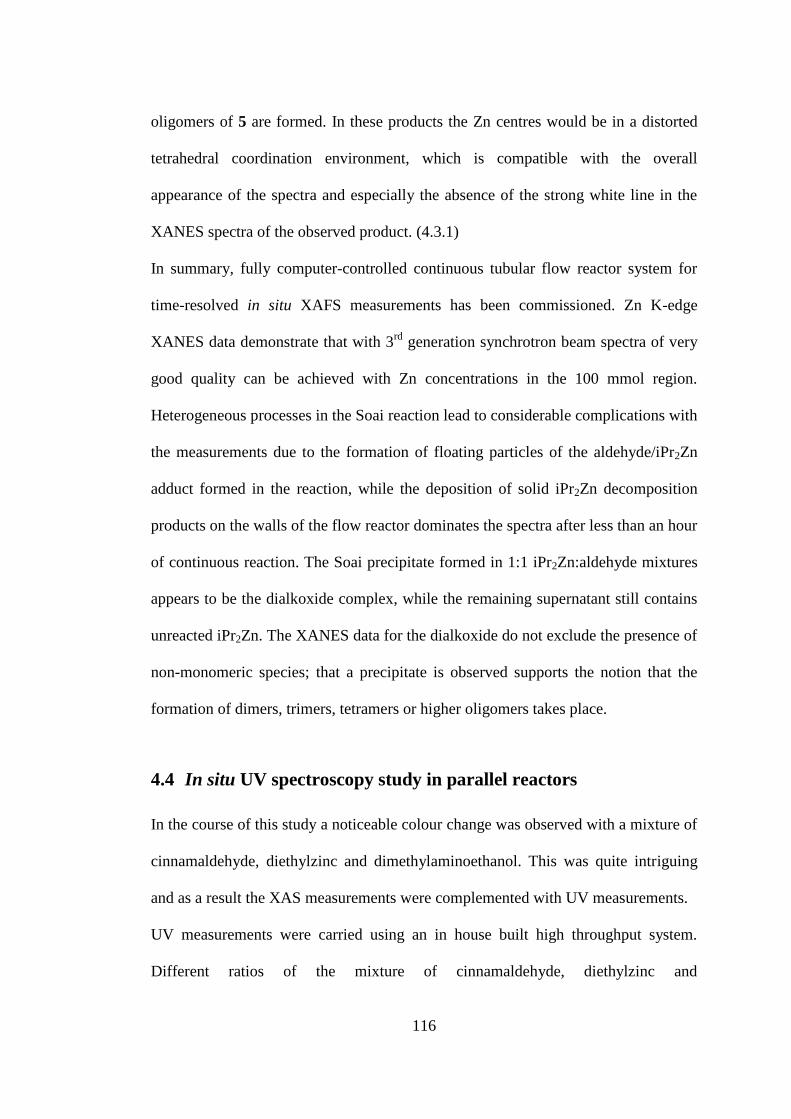
116
oligomers of 5 are formed. In these products the Zn centres would be in a distorted
tetrahedral coordination environment, which is compatible with the overall
appearance of the spectra and especially the absence of the strong white line in the
XANES spectra of the observed product. (4.3.1)
In summary, fully computer-controlled continuous tubular flow reactor system for
time-resolved in situ XAFS measurements has been commissioned. Zn K-edge
XANES data demonstrate that with 3rd
generation synchrotron beam spectra of very
good quality can be achieved with Zn concentrations in the 100 mmol region.
Heterogeneous processes in the Soai reaction lead to considerable complications with
the measurements due to the formation of floating particles of the aldehyde/iPr2Zn
adduct formed in the reaction, while the deposition of solid iPr2Zn decomposition
products on the walls of the flow reactor dominates the spectra after less than an hour
of continuous reaction. The Soai precipitate formed in 1:1 iPr2Zn:aldehyde mixtures
appears to be the dialkoxide complex, while the remaining supernatant still contains
unreacted iPr2Zn. The XANES data for the dialkoxide do not exclude the presence of
non-monomeric species; that a precipitate is observed supports the notion that the
formation of dimers, trimers, tetramers or higher oligomers takes place.
4.4 In situ UV spectroscopy study in parallel reactors
In the course of this study a noticeable colour change was observed with a mixture of
cinnamaldehyde, diethylzinc and dimethylaminoethanol. This was quite intriguing
and as a result the XAS measurements were complemented with UV measurements.
UV measurements were carried using an in house built high throughput system.
Different ratios of the mixture of cinnamaldehyde, diethylzinc and

117
dimethylaminoethanol were considered. The change in the absorption characteristics
overtime was observed by simultaneously measuring five samples. The intensity of
each cell was measured at intervals of one minute. The illustration below shows the
automated system suitable for measuring 5 samples simultaneously.[73]
Figure 4.20: Overview of ‘5 cuvette’ platform, (a) camera, (b) flow cuvettes in aluminium frame,
(c) collimating lens, (d) monochromator & light source, (e and f) syringe pump dosing system
with stock solutions and (g) control PC.[73]
The scanning monochromatic light (250 W quartz tungsten halogen lamp) was
allowed to go through the sample array using a collimating lens. The sample array of
five cuvettes (Type 71-V, Starna Scientific), were fixed in an aluminium frame.
(g)
(e)
(d)
(c)(b)
(a)
(f)
data flow
solution flow
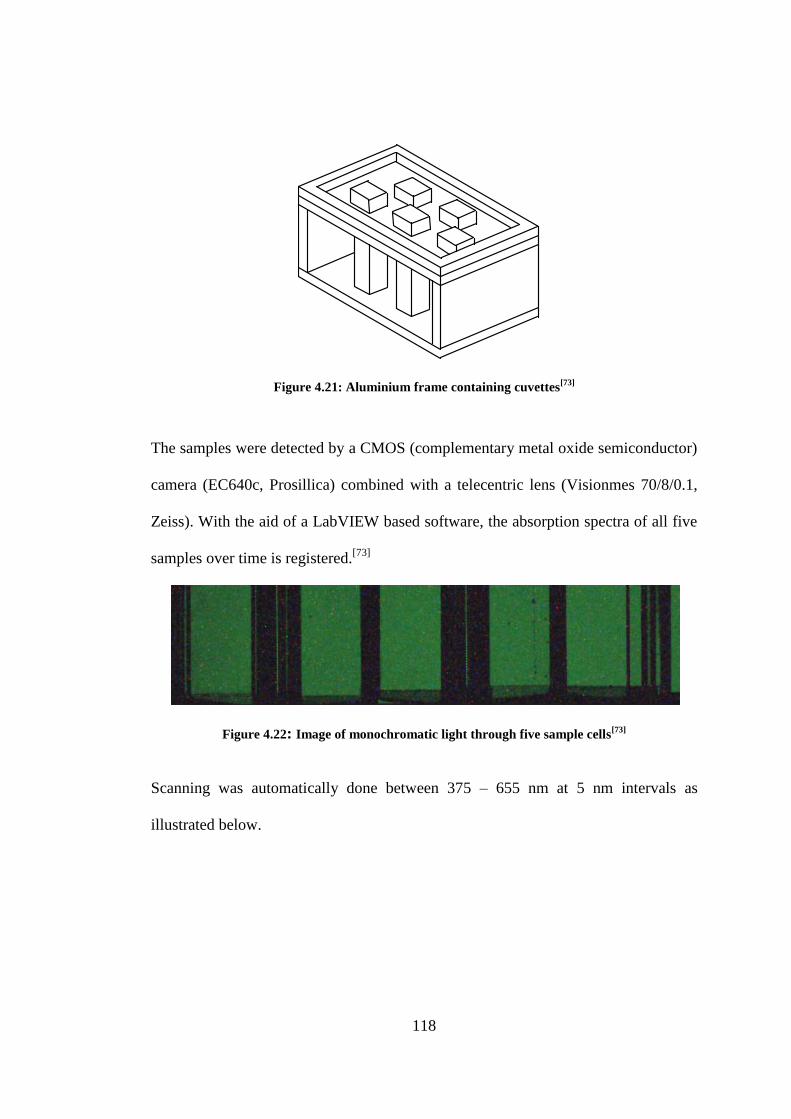
118
Figure 4.21: Aluminium frame containing cuvettes[73]
The samples were detected by a CMOS (complementary metal oxide semiconductor)
camera (EC640c, Prosillica) combined with a telecentric lens (Visionmes 70/8/0.1,
Zeiss). With the aid of a LabVIEW based software, the absorption spectra of all five
samples over time is registered.[73]
Figure 4.22: Image of monochromatic light through five sample cells[73]
Scanning was automatically done between 375 – 655 nm at 5 nm intervals as
illustrated below.
bank 1
gas manifold
bank 2

119
Figure 4.23: Determination of light intensity through sample cells at a range of wavelengths by
image analysis software.[73]
The summation of pixel intensities gives information about the brightness and the
amount of transmitted light. The measurement of 5 samples is compared to a
reference image which in this case was toluene at the same wavelength. The
absorption is calculated by using the Beer-Lambert equation
A = 2 - log(100xI/I0) 4.21
A - Absorption, I - Measured Intensity and Io - Original Intensity
Synchronized images acquired are replicated every minute for 35 minutes in order to
produce a time resolved measurement.[73]
375 nm
651 nm
653 nm
655 nm
‘blank’ 375 nm
651 nm
653 nm
655 nm
‘colour’
375
651
653
655
3500
5500
5500
5500
3400
5600
5500
5600
3500
5500
5500
5500
3600
5600
5600
5600
3600
5000
5000
5000
.. .. .. .. .. ..
375
651
653
655
3000
4500
4555
4500
2500
1000
1100
1000
1000
1000
1000
1000
3000
2500
2800
2500
1500
2000
2100
2100
.. .. .. .. .. ..
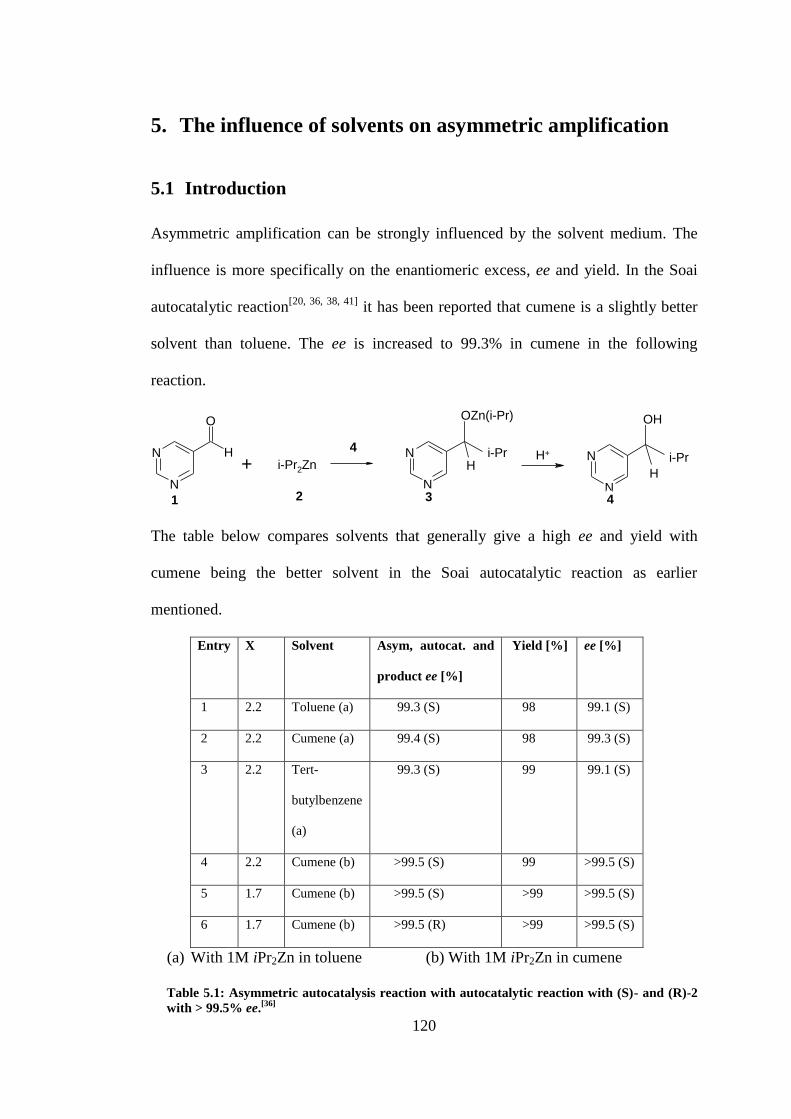
120
5. The influence of solvents on asymmetric amplification
5.1 Introduction
Asymmetric amplification can be strongly influenced by the solvent medium. The
influence is more specifically on the enantiomeric excess, ee and yield. In the Soai
autocatalytic reaction[20, 36, 38, 41]
it has been reported that cumene is a slightly better
solvent than toluene. The ee is increased to 99.3% in cumene in the following
reaction.
The table below compares solvents that generally give a high ee and yield with
cumene being the better solvent in the Soai autocatalytic reaction as earlier
mentioned.
Entry X Solvent Asym, autocat. and
product ee [%]
Yield [%] ee [%]
1 2.2 Toluene (a) 99.3 (S) 98 99.1 (S)
2 2.2 Cumene (a) 99.4 (S) 98 99.3 (S)
3 2.2 Tert-
butylbenzene
(a)
99.3 (S) 99 99.1 (S)
4 2.2 Cumene (b) >99.5 (S) 99 >99.5 (S)
5 1.7 Cumene (b) >99.5 (S) >99 >99.5 (S)
6 1.7 Cumene (b) >99.5 (R) >99 >99.5 (S)
(a) With 1M iPr2Zn in toluene (b) With 1M iPr2Zn in cumene
Table 5.1: Asymmetric autocatalysis reaction with autocatalytic reaction with (S)- and (R)-2
with > 99.5% ee.[36]
N
N
O
H N
N
N
N
+ i-Pr2Zn i-Pr
H
OZn(i-Pr)
i-Pr
H
OH
H+
1 2 3 4
4

121
According to studies done by Blackmond, the Soai autocatalytic reaction performs
chiral amplification well in toluene and diethylether (Figure 5.1).[45]
Figure 5.1: Product ee against initial catalyst ee in toluene, diethylether, Et2O/toluene and
THF.[45]
Interestingly, THF does not lead to amplification but to promotion of a linear
relationship between the ee of the product and the initial catalyst. In THF the reaction
is also reported to be extremely sluggish. Further studies indicated that product
precipitation may be observed during reactions in all solvents.[45]
The ee in solution
and the precipitate is solvent dependent. In the case of toluene the ee of the
precipitate in toluene is lower than that of the solution. This reverses in diethyl ether
in which the precipitate gives a higher ee. Blackmond has proposed that these results

122
suggest the physical properties of the heterodimer to be less soluble than homodimer
species in toluene whereas in diethylether the heterodimer species is more soluble.[45]
Table 5.2: Comparing the ee and % product in solution and the precipitate for the Soai
reaction.[45]
Brown also reported the non-occurrence of amplification in THF.[50]
It was suggested
that the strong Lewis basicity of the solvent has an inhibiting effect that causes a
slow turnover. Other studies report the binding of the Lewis base to metals.
123
Using PMR spectroscopy Denisov et al[74]
examined the formation of complexes of
diethylzinc with Lewis bases. They proposed that a donor-acceptor complex causes
an internal shift or change in the electronegativity of Zn atom explaining why for
complexes with diethylether a small chemical shift is observed than for THF. The
decreasing strength of complex formation with Et2Zn is in the order THF >
propylene oxide > diethyl ether.[74]
An X-ray absorption spectroscopy study is
important to understand the interaction of the solvents with alkyl zinc and to explain
the different levels of the ee of the product and chiral catalyst.
5.2 Experimental
Several concentrations of dialkyl zinc were prepared in 2 mL microcentrifuge tubes.
This preparation was done in the presence of nitrogen gas in a glove bag in the
absence of oxygen. The behaviour of dialkylzinc was studied in solvents which
include toluene, diethylether and tetrahydrofuran. In some experiments the solvents
were mixed in specific ratios. X-ray absorption fine structure (XAS) measurements
were carried out at the Zn K-edge.[56]
The monochromator type used was Si (111)
and the experiments were performed at beam lines BESSRC 12-BM-B at the
Advanced Photon Source (USA), BM29 at the European Synchrotron Research
Facility (ESRF), XAS at ANKA (Germany) and 9.3 at SRS (United Kingdom). The
X-ray radiation was detected in florescence and transmission mode.
The local Zn structures in solution were determined from fitting experimental and
theoretical data in R and k space (Figure 5.5). Theoretical data is from the structure
of ZnO derived from a crystal structure database and imported into Iffefit. The
extracted EXAFS function was weighted at k3
and Fourier transforms calculated
between a k range of 3-12 Å. The dialkylzinc models in different solvents were
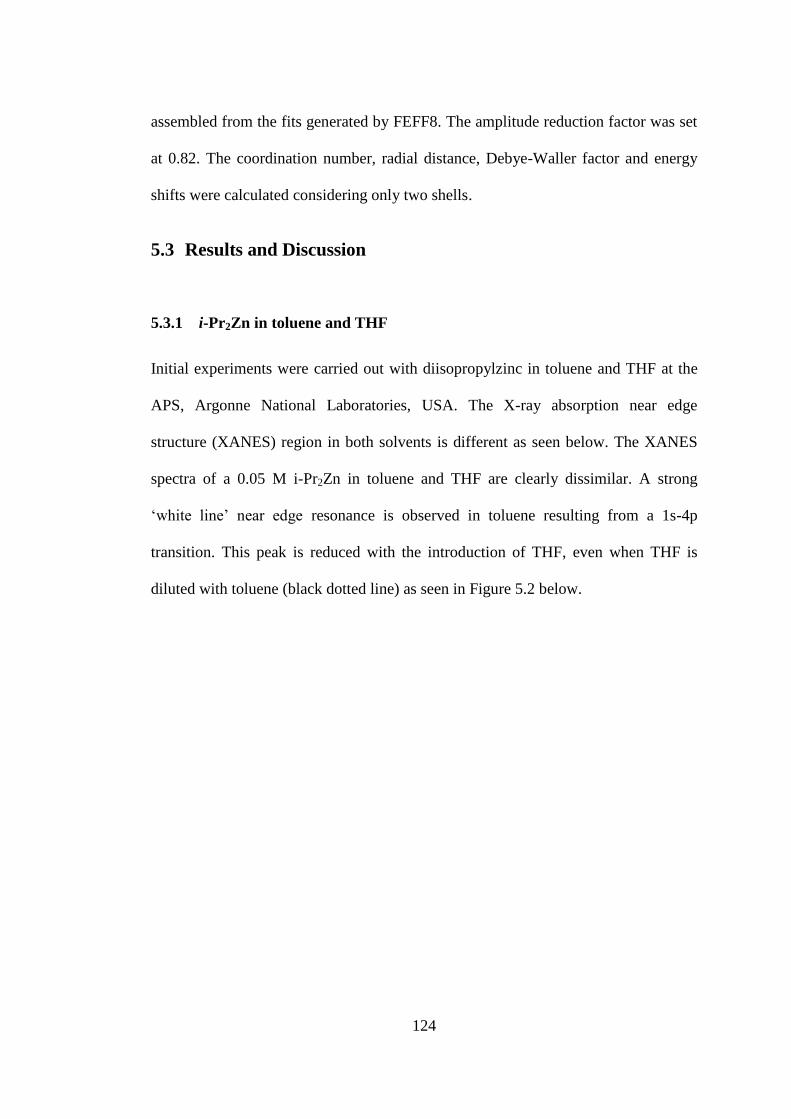
124
assembled from the fits generated by FEFF8. The amplitude reduction factor was set
at 0.82. The coordination number, radial distance, Debye-Waller factor and energy
shifts were calculated considering only two shells.
5.3 Results and Discussion
5.3.1 i-Pr2Zn in toluene and THF
Initial experiments were carried out with diisopropylzinc in toluene and THF at the
APS, Argonne National Laboratories, USA. The X-ray absorption near edge
structure (XANES) region in both solvents is different as seen below. The XANES
spectra of a 0.05 M i-Pr2Zn in toluene and THF are clearly dissimilar. A strong
„white line‟ near edge resonance is observed in toluene resulting from a 1s-4p
transition. This peak is reduced with the introduction of THF, even when THF is
diluted with toluene (black dotted line) as seen in Figure 5.2 below.

125
Figure 5.2: Zn K-egde XANES spectra of 0.1 M i-Pr2Zn in toluene, THF and toluene/THF (1:1).
Considering the red dotted line in the XANES spectra (Figure 5.2), it is noticeable
that with the addition of THF the second peak moves towards lower energy values. A
small peak at 9684 eV of i-Pr2Zn in toluene also disappears with THF addition. The
similarity of the XANES spectra of iPr2Zn in THF and a toluene/THF mixture
suggests a high affinity of THF to associate itself with Zn thus changing the Zn
environment or electronegativity. A model of both iPr2Zn in toluene and THF was
further calculated from the Extended X-ray Absorption Spectroscopy region.
The EXAFS fit of diisopropylzinc in toluene is shown in Figure 5.3 below.
0
1
2
3
4
9650 9660 9670 9680 9690 9700
No
rmalised
In
ten
sit
y [
a.u
]
Photon Energy [e.V]
i-Pr2Zn in Toluene
i-Pr2Zn in 50 %Toluene and 50 %THF
i-Pr2Zn in THF
Resonance peak changes
2nd peak moves to lower energy with increasing THF
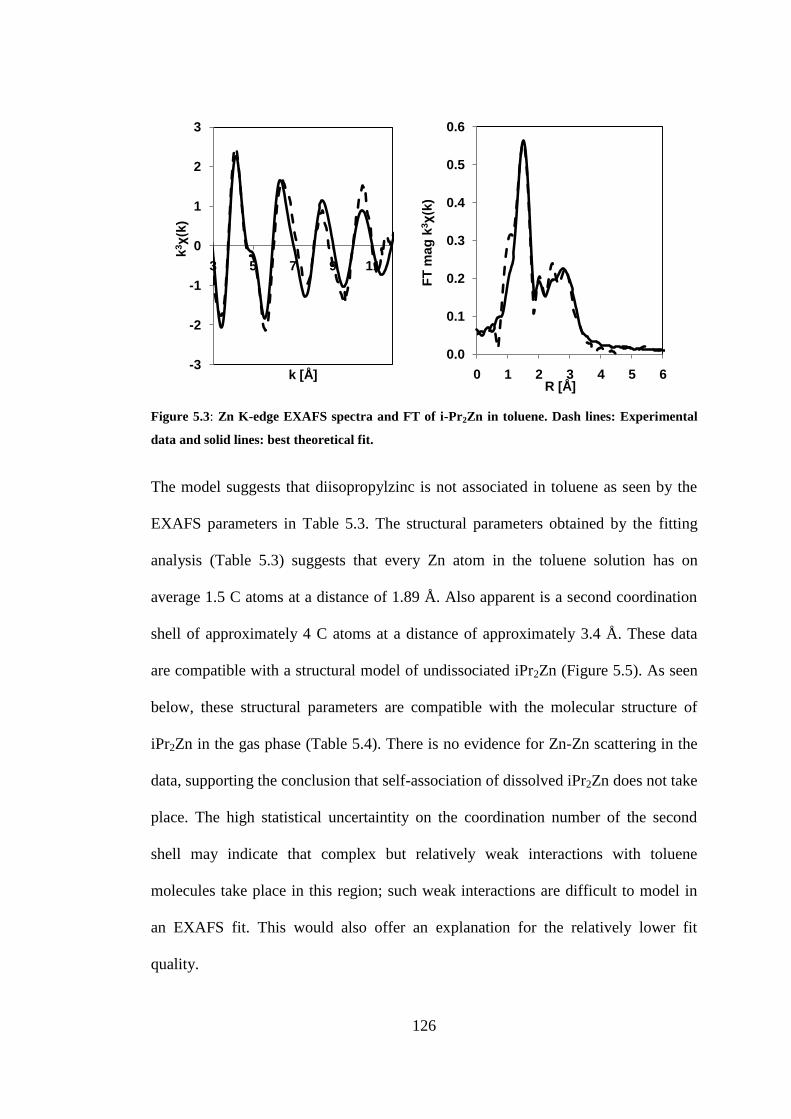
126
Figure 5.3: Zn K-edge EXAFS spectra and FT of i-Pr2Zn in toluene. Dash lines: Experimental
data and solid lines: best theoretical fit.
The model suggests that diisopropylzinc is not associated in toluene as seen by the
EXAFS parameters in Table 5.3. The structural parameters obtained by the fitting
analysis (Table 5.3) suggests that every Zn atom in the toluene solution has on
average 1.5 C atoms at a distance of 1.89 Å. Also apparent is a second coordination
shell of approximately 4 C atoms at a distance of approximately 3.4 Å. These data
are compatible with a structural model of undissociated iPr2Zn (Figure 5.5). As seen
below, these structural parameters are compatible with the molecular structure of
iPr2Zn in the gas phase (Table 5.4). There is no evidence for Zn-Zn scattering in the
data, supporting the conclusion that self-association of dissolved iPr2Zn does not take
place. The high statistical uncertaintity on the coordination number of the second
shell may indicate that complex but relatively weak interactions with toluene
molecules take place in this region; such weak interactions are difficult to model in
an EXAFS fit. This would also offer an explanation for the relatively lower fit
quality.
-3
-2
-1
0
1
2
3
3 5 7 9 11
k3χ(k
)
k [Å]
0.0
0.1
0.2
0.3
0.4
0.5
0.6
0 1 2 3 4 5 6
FT
mag
k3χ(k
)
R [Å]

127
The results of the EXAFS fitting analysis for diisopropylzinc in THF are also shown
in Figure 5.4. A strong difference between the EXAFS of diisopropylzinc in toluene
(Figure 5.3) and in THF (Figure 5.4) is already evident from visual inspection of the
spectra.
Figure 5.4: Zn K-edge EXAFS spectra and FT of i-Pr2Zn in toluene and THF. Dash lines:
experimental data and solid lines: best theoretical fit.
-3
-2
-1
0
1
2
3
3 5 7 9 11
k3χ(k
)
k [Å]
0.0
0.1
0.2
0.3
0.4
0.5
0.6
0 1 2 3 4 5 6
FT
ma
g k
3χ(k
)
R [Å]
-3
-2
-1
0
1
2
3
4
3 5 7 9 11
k3χ(k
)
k [Å]
0.0
0.1
0.2
0.3
0.4
0.5
0.6
0.7
0.8
0 1 2 3 4 5 6
FT
mag
k3χ(k
)
R [Å]
THF/toluene
e
THF
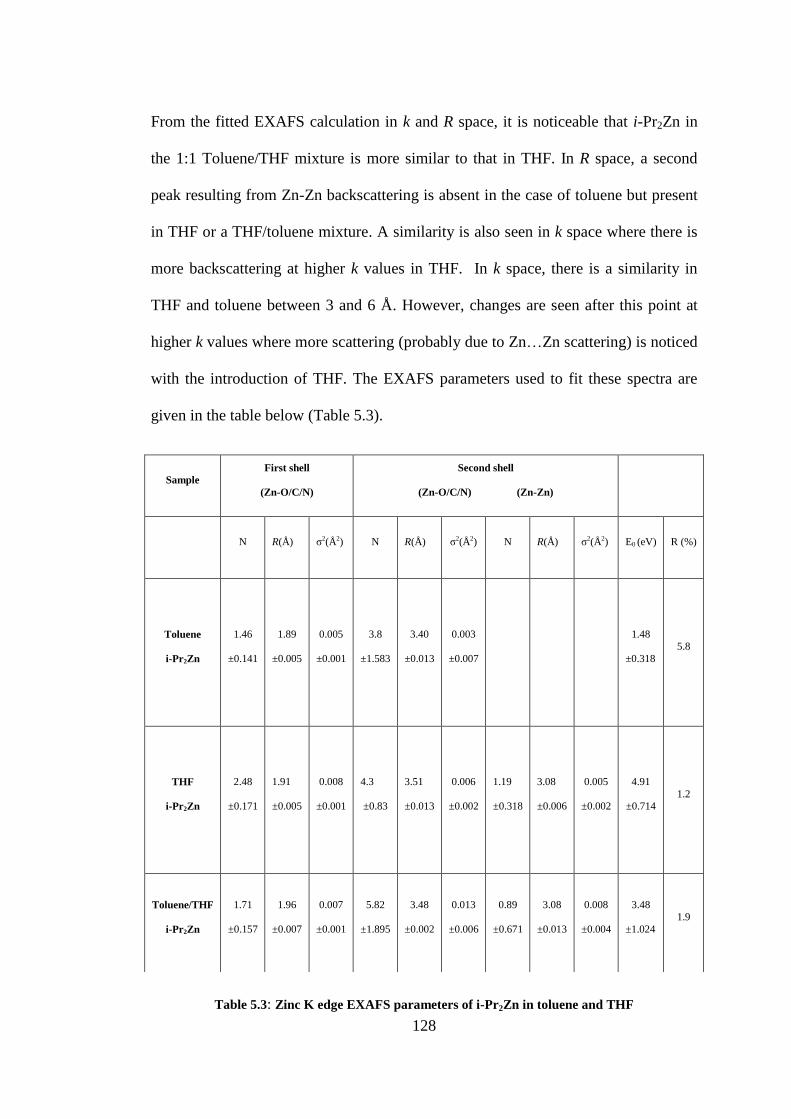
128
From the fitted EXAFS calculation in k and R space, it is noticeable that i-Pr2Zn in
the 1:1 Toluene/THF mixture is more similar to that in THF. In R space, a second
peak resulting from Zn-Zn backscattering is absent in the case of toluene but present
in THF or a THF/toluene mixture. A similarity is also seen in k space where there is
more backscattering at higher k values in THF. In k space, there is a similarity in
THF and toluene between 3 and 6 Å. However, changes are seen after this point at
higher k values where more scattering (probably due to Zn…Zn scattering) is noticed
with the introduction of THF. The EXAFS parameters used to fit these spectra are
given in the table below (Table 5.3).
Table 5.3: Zinc K edge EXAFS parameters of i-Pr2Zn in toluene and THF
Sample
First shell
(Zn-O/C/N)
Second shell
(Zn-O/C/N) (Zn-Zn)
N R(Å) σ2(Å2) N R(Å) σ2(Å2) N R(Å) σ2(Å2) E0 (eV) R (%)
Toluene
i-Pr2Zn
1.46
±0.141
1.89
±0.005
0.005
±0.001
3.8
±1.583
3.40
±0.013
0.003
±0.007
1.48
±0.318
5.8
THF
i-Pr2Zn
2.48
±0.171
1.91
±0.005
0.008
±0.001
4.3
±0.83
3.51
±0.013
0.006
±0.002
1.19
±0.318
3.08
±0.006
0.005
±0.002
4.91
±0.714 1.2
Toluene/THF
i-Pr2Zn
1.71
±0.157
1.96
±0.007
0.007
±0.001
5.82
±1.895
3.48
±0.002
0.013
±0.006
0.89
±0.671
3.08
±0.013
0.008
±0.004
3.48
±1.024
1.9
129
The R-factor, which is the goodness of the fit between experimental and theoretical
spectrum is 1.2 and 1.9 % for iPr2Zn in THF and in the THF/toluene mixture,
respectively. This means these fits are excellent and the predicted dimeric structures
are therefore reliable. The structural parameters obtained by the fitting analysis
(Table 5.3) suggests that every Zn atom in the THF solution has on average 2.5 C
atoms at a distance of 1.91 Å (slightly more extended than in toluene). The second
shell has approximately 4 C atoms at a distance of approximately 3.5 Å. The
structural model of associated iPr2Zn is seen in Figure 5.5. There is evidence for Zn-
Zn scattering in the data implying that self-association occurs in THF but not in
toluene. In THF the existence of a dimer is evidenced by Zn-Zn backscattering.
Figure 5.5: Models of iPr2Zn in toluene and THF from EXAFS calculations. Because of solvent
interactions the Zn complex is likely to be a bent structure and therefore depicted as such, even
though the actual coordination geometry cannot be determined from the XAFS data.
Two distinct models of iPr2Zn can be seen from Figure 5.5 in toluene and THF.
iPr2Zn exists as a monomer in toluene but dimerizes in THF. A possible link between
both models and ee is suggested by Mahmoud.[75]
The proposed dimer model has a
Zn-Zn distance of approximately 3.08 Å. There is however no evidence of bond
formation between the two Zn atoms because a Zn-Zn bond distance is typically
reported to be about 2 Å i.e. approximately 1 Å less than the model proposed in this
Zn
CH3
CH3
CH3
CH3
Zn
CH3
CH3
CH3
CH3
Zn
CH3
CH3
CH3
CH3
1.89 Å1.91 Å
Toluene THF
3.08 Å

130
study.[76]
The Zn atoms are likely held together in a cluster by weak intermolecular
forces. Using XAS it is otherwise not possible to distinguish Zn-O, Zn-N and Zn-C
interactions as carbon, nitrogen and oxygen have similar backscattering contributions
as a result of their close atomic numbers or similar number of electrons in the core of
their atoms.[77]
The EXAFS calculated bond distances are similar to those from other
studies done by Haaland in which the bond length of zinc-carbon bonds was studied
by density functional theory calculations, gas electron diffraction and photon electron
spectroscopy.[76, 78]
Gas
Phase[78]
Solution
(EXAFS)
C2
Zn C1
Zn-C1 1.96 Å 1.89 Å
Zn-C2 3.45 Å 3.40 Å
Table 5.4: Comparison of bond distances in i-Pr2Zn gas phase and solution. Gas phase:
Haaland’s study,[78]
Solution: EXAFS calculation.
Assuming that bond angles in the gas phase and in solution are similar it would
appear that the EXAFS-derived structural parameters are also compatible with the
structures reported in Haaland‟s study. The Zn-C1-C2 angle adopted from the studies
of Haaland is 114˚.[78]
Near edge
Based on the EXAFS derived models for iPr2Zn we can now understand the
difference in the near-edge data for iPr2Zn dissolved in toluene and THF. Kau et
al[79]
and Fulton et al[80, 81]
related the intensity of the near-edge resonance for Cu+ to
local coordination and geometry by considering the ligand field splitting of Cu+
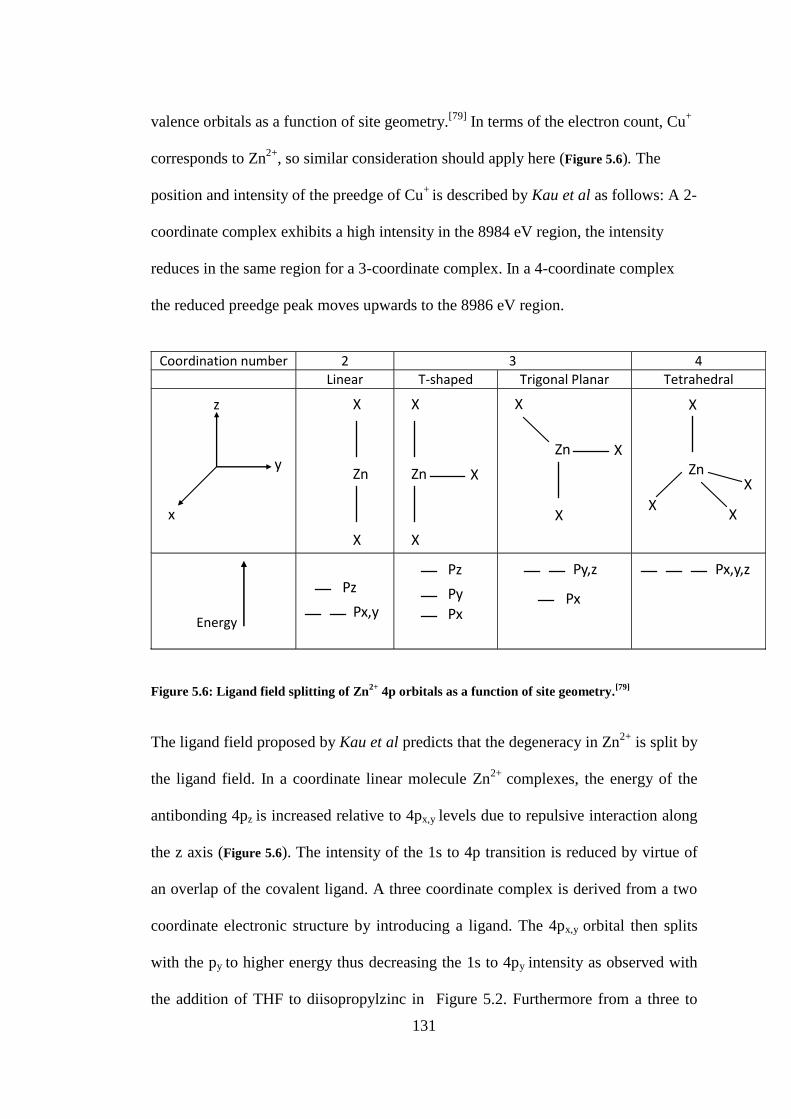
131
valence orbitals as a function of site geometry.[79]
In terms of the electron count, Cu+
corresponds to Zn2+
, so similar consideration should apply here (Figure 5.6). The
position and intensity of the preedge of Cu+
is described by Kau et al as follows: A 2-
coordinate complex exhibits a high intensity in the 8984 eV region, the intensity
reduces in the same region for a 3-coordinate complex. In a 4-coordinate complex
the reduced preedge peak moves upwards to the 8986 eV region.
Coordination number 2 3 4
Linear T-shaped Trigonal Planar Tetrahedral
Energy
z
y
x
X
X
Zn
X
X
Zn X
X
X
Zn X
X
XZn
X
X
Pz
Px,y
Pz
Py
Px
Py,z
Px
Px,y,z
Figure 5.6: Ligand field splitting of Zn2+
4p orbitals as a function of site geometry.[79]
The ligand field proposed by Kau et al predicts that the degeneracy in Zn2+
is split by
the ligand field. In a coordinate linear molecule Zn2+
complexes, the energy of the
antibonding 4pz is increased relative to 4px,y levels due to repulsive interaction along
the z axis (Figure 5.6). The intensity of the 1s to 4p transition is reduced by virtue of
an overlap of the covalent ligand. A three coordinate complex is derived from a two
coordinate electronic structure by introducing a ligand. The 4px,y orbital then splits
with the py to higher energy thus decreasing the 1s to 4py intensity as observed with
the addition of THF to diisopropylzinc in Figure 5.2. Furthermore from a three to
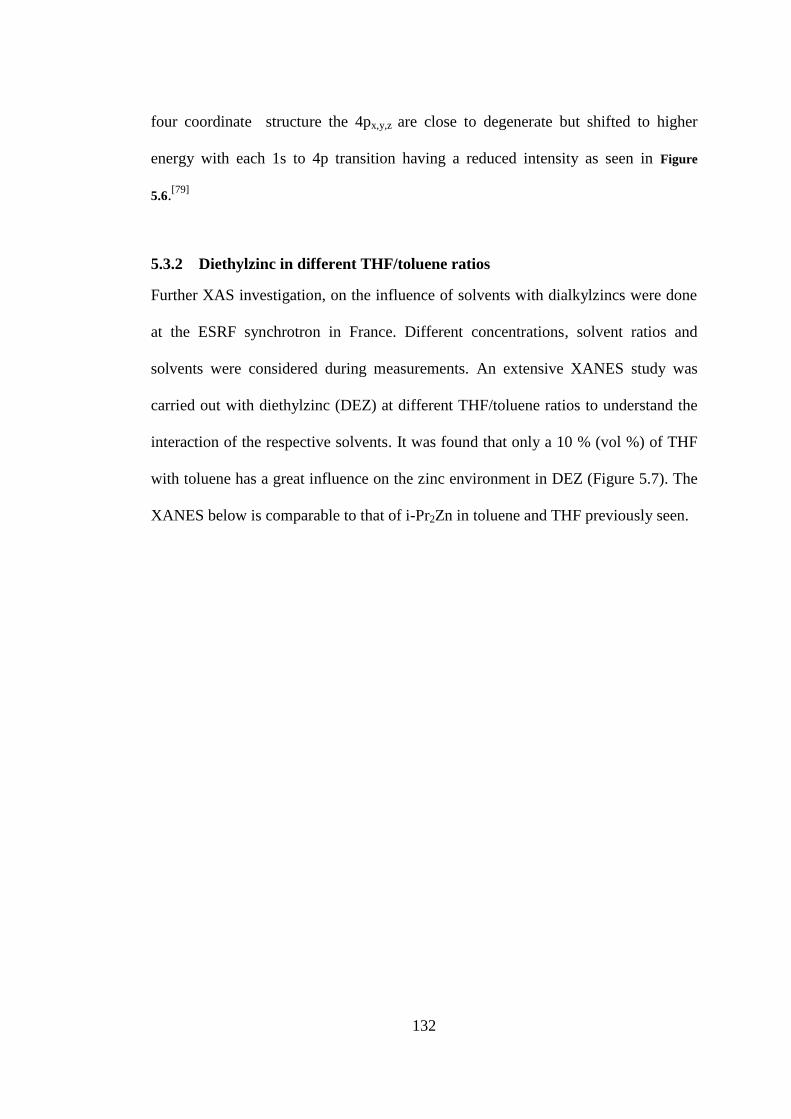
132
four coordinate structure the 4px,y,z are close to degenerate but shifted to higher
energy with each 1s to 4p transition having a reduced intensity as seen in Figure
5.6.[79]
5.3.2 Diethylzinc in different THF/toluene ratios
Further XAS investigation, on the influence of solvents with dialkylzincs were done
at the ESRF synchrotron in France. Different concentrations, solvent ratios and
solvents were considered during measurements. An extensive XANES study was
carried out with diethylzinc (DEZ) at different THF/toluene ratios to understand the
interaction of the respective solvents. It was found that only a 10 % (vol %) of THF
with toluene has a great influence on the zinc environment in DEZ (Figure 5.7). The
XANES below is comparable to that of i-Pr2Zn in toluene and THF previously seen.
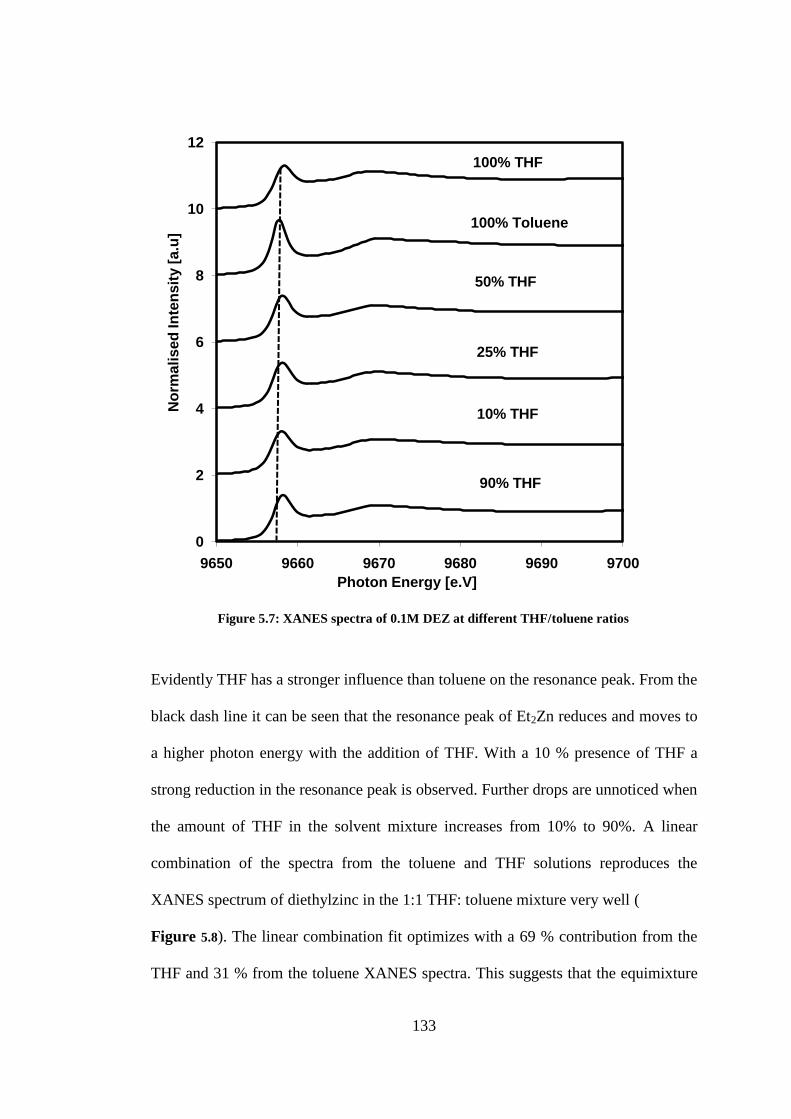
133
Figure 5.7: XANES spectra of 0.1M DEZ at different THF/toluene ratios
Evidently THF has a stronger influence than toluene on the resonance peak. From the
black dash line it can be seen that the resonance peak of Et2Zn reduces and moves to
a higher photon energy with the addition of THF. With a 10 % presence of THF a
strong reduction in the resonance peak is observed. Further drops are unnoticed when
the amount of THF in the solvent mixture increases from 10% to 90%. A linear
combination of the spectra from the toluene and THF solutions reproduces the
XANES spectrum of diethylzinc in the 1:1 THF: toluene mixture very well (
Figure 5.8). The linear combination fit optimizes with a 69 % contribution from the
THF and 31 % from the toluene XANES spectra. This suggests that the equimixture
0
2
4
6
8
10
12
9650 9660 9670 9680 9690 9700
No
rma
lis
ed
In
ten
sit
y [
a.u
]
Photon Energy [e.V]
90% THF
10% THF
25% THF
50% THF
100% Toluene
100% THF
134
has 69 % of zinc present as the dialkylzinc complex with THF. It appears that
diethylzinc in THF has a significantly higher affinity for binding to diethylzinc than
toluene.
Figure 5.8: XANES spectra of 0.1 M DEZ in toluene and THF. Calculated XANES in 1:1
(toluene:THF) included.
The linear combination analysis of XANES spectra was expanded to investigating a
number of toluene/THF mixtures, from 10 to 90 % of THF in the solvent mixture.
The results are shown in Figure 5.9. At 10, 25, 50 and 90 % of THF in the solvent
mixture the calculated THF contributions were 62, 66.9, 70 and 74% respectively.
This is a true indication of the strong influence of THF over toluene even at low
concentrations of 10 %.
0.0
0.2
0.4
0.6
0.8
1.0
1.2
1.4
1.6
1.8
9650 9660 9670 9680 9690 9700 9710
No
rmalized
In
ten
sit
y [
a.u
]
Photon Energy [eV]
Et2Zn in THF
Et2Zn in toluene
Et2Zn in tol/THF (1:1)
Et2Zn in tol/THF (1:1) Fit
Fit = 69%THF + 31%Toluene
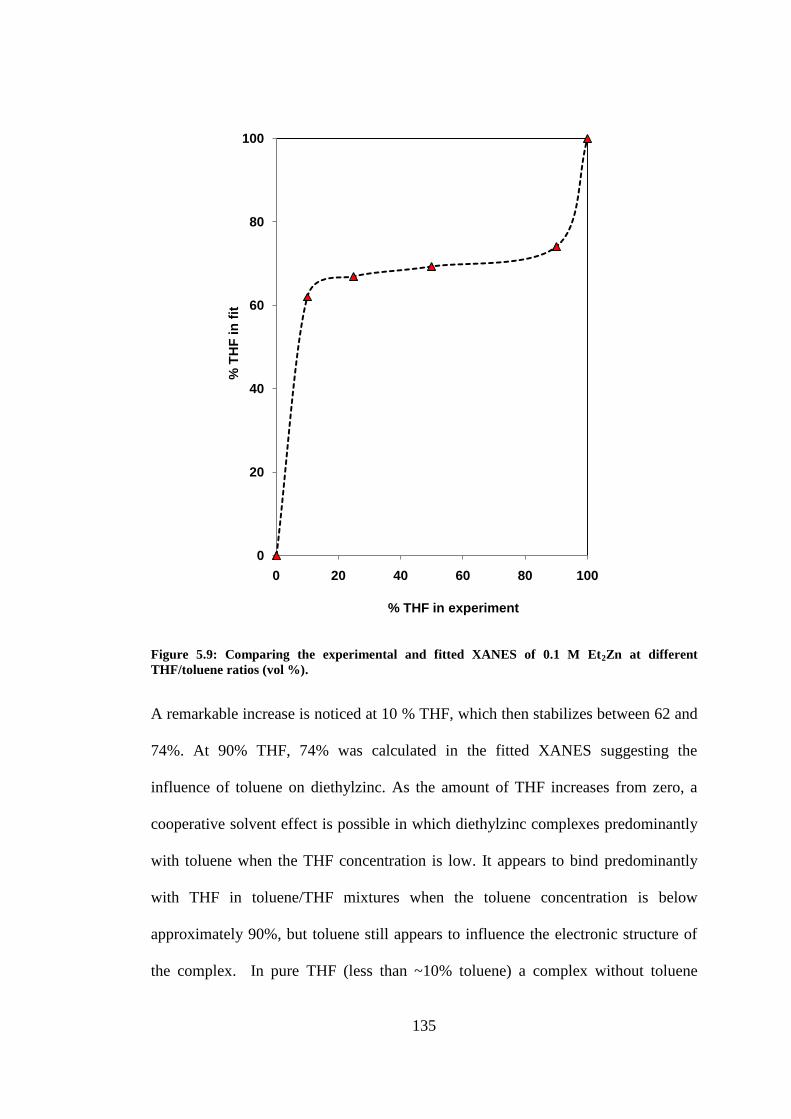
135
Figure 5.9: Comparing the experimental and fitted XANES of 0.1 M Et2Zn at different
THF/toluene ratios (vol %).
A remarkable increase is noticed at 10 % THF, which then stabilizes between 62 and
74%. At 90% THF, 74% was calculated in the fitted XANES suggesting the
influence of toluene on diethylzinc. As the amount of THF increases from zero, a
cooperative solvent effect is possible in which diethylzinc complexes predominantly
with toluene when the THF concentration is low. It appears to bind predominantly
with THF in toluene/THF mixtures when the toluene concentration is below
approximately 90%, but toluene still appears to influence the electronic structure of
the complex. In pure THF (less than ~10% toluene) a complex without toluene
0
20
40
60
80
100
0 20 40 60 80 100
% T
HF
in
fit
% THF in experiment

136
influence appears to be formed. At high amounts of THF there is a possibility of
slight decomposition with water molecules resulting in the reduction of the resonance
peak, but this effect is not expected to dominate the observed spectra. This
comparison indicates that diethylzinc has a strong affinity for pure toluene, and
complexes formed in increasing amounts of THF do not completely overshadow
complexes in toluene until almost pure THF is used.
5.3.3 Diethylzinc in THF as a function of concentrations
Concentrations between 0.001 and 0.05 M of DEZ were investigated. Variations of
the concentration were found to strongly influence the XANES Zn K-edge spectra of
diethylzinc in THF (Figure 5.10).

137
Figure 5.10: XANES spectra of DEZ in THF at different concentrations
Concentrations beyond 0.2 M were not considered because of the problems
associated with high absorption, fluorescence detector overload and self-absorption
effects. At low concentrations (between 0.001 and 0.05 M) the sharp peak at about
9660 eV changes compared to that observed between 0.025 and 0.05 M. At 0.01 M
the resonance peak reduces and maintains the same height as the second peak
compared to higher concentrations considered. Between 0.025 and 0.05 M the
difference between the 1st and 2
nd peak is 0.25 a.u (Figure 5.10). Clearly there is a
similarity in the XANES spectra between 0.01, 0.025 and 0.05 M which is
undoubtedly different from 0.001 M. At 0.001 M the XANES structure is completely
0
1
2
3
4
5
9650 9660 9670 9680 9690 9700 9710 9720
No
rma
lis
ed
In
ten
sit
y [
a.u
]
Photon Energy [e.V]
0.001 M
0.01 M
0.025 M
0.05 M
0.25 a.u
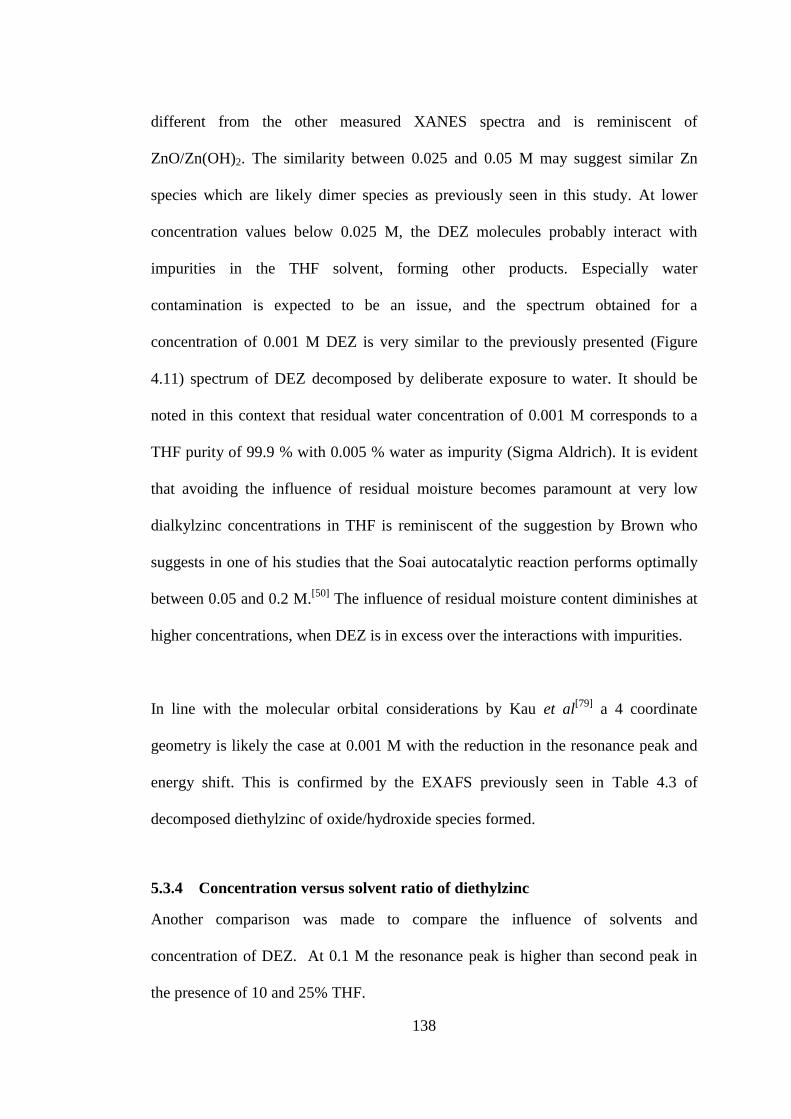
138
different from the other measured XANES spectra and is reminiscent of
ZnO/Zn(OH)2. The similarity between 0.025 and 0.05 M may suggest similar Zn
species which are likely dimer species as previously seen in this study. At lower
concentration values below 0.025 M, the DEZ molecules probably interact with
impurities in the THF solvent, forming other products. Especially water
contamination is expected to be an issue, and the spectrum obtained for a
concentration of 0.001 M DEZ is very similar to the previously presented (Figure
4.11) spectrum of DEZ decomposed by deliberate exposure to water. It should be
noted in this context that residual water concentration of 0.001 M corresponds to a
THF purity of 99.9 % with 0.005 % water as impurity (Sigma Aldrich). It is evident
that avoiding the influence of residual moisture becomes paramount at very low
dialkylzinc concentrations in THF is reminiscent of the suggestion by Brown who
suggests in one of his studies that the Soai autocatalytic reaction performs optimally
between 0.05 and 0.2 M.[50]
The influence of residual moisture content diminishes at
higher concentrations, when DEZ is in excess over the interactions with impurities.
In line with the molecular orbital considerations by Kau et al[79]
a 4 coordinate
geometry is likely the case at 0.001 M with the reduction in the resonance peak and
energy shift. This is confirmed by the EXAFS previously seen in Table 4.3 of
decomposed diethylzinc of oxide/hydroxide species formed.
5.3.4 Concentration versus solvent ratio of diethylzinc
Another comparison was made to compare the influence of solvents and
concentration of DEZ. At 0.1 M the resonance peak is higher than second peak in
the presence of 10 and 25% THF.
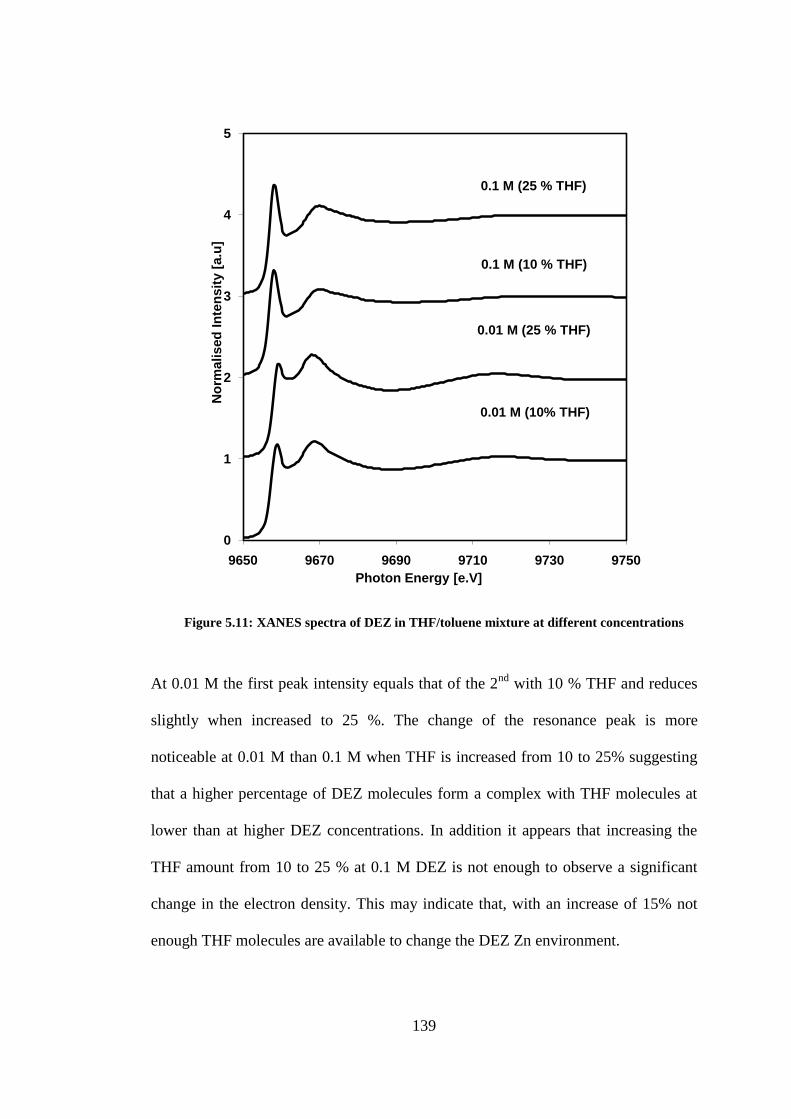
139
Figure 5.11: XANES spectra of DEZ in THF/toluene mixture at different concentrations
At 0.01 M the first peak intensity equals that of the 2nd
with 10 % THF and reduces
slightly when increased to 25 %. The change of the resonance peak is more
noticeable at 0.01 M than 0.1 M when THF is increased from 10 to 25% suggesting
that a higher percentage of DEZ molecules form a complex with THF molecules at
lower than at higher DEZ concentrations. In addition it appears that increasing the
THF amount from 10 to 25 % at 0.1 M DEZ is not enough to observe a significant
change in the electron density. This may indicate that, with an increase of 15% not
enough THF molecules are available to change the DEZ Zn environment.
0
1
2
3
4
5
9650 9670 9690 9710 9730 9750
No
rmalised
In
ten
sit
y [
a.u
]
Photon Energy [e.V]
0.1 M (25 % THF)
0.1 M (10 % THF)
0.01 M (25 % THF)
0.01 M (10% THF)
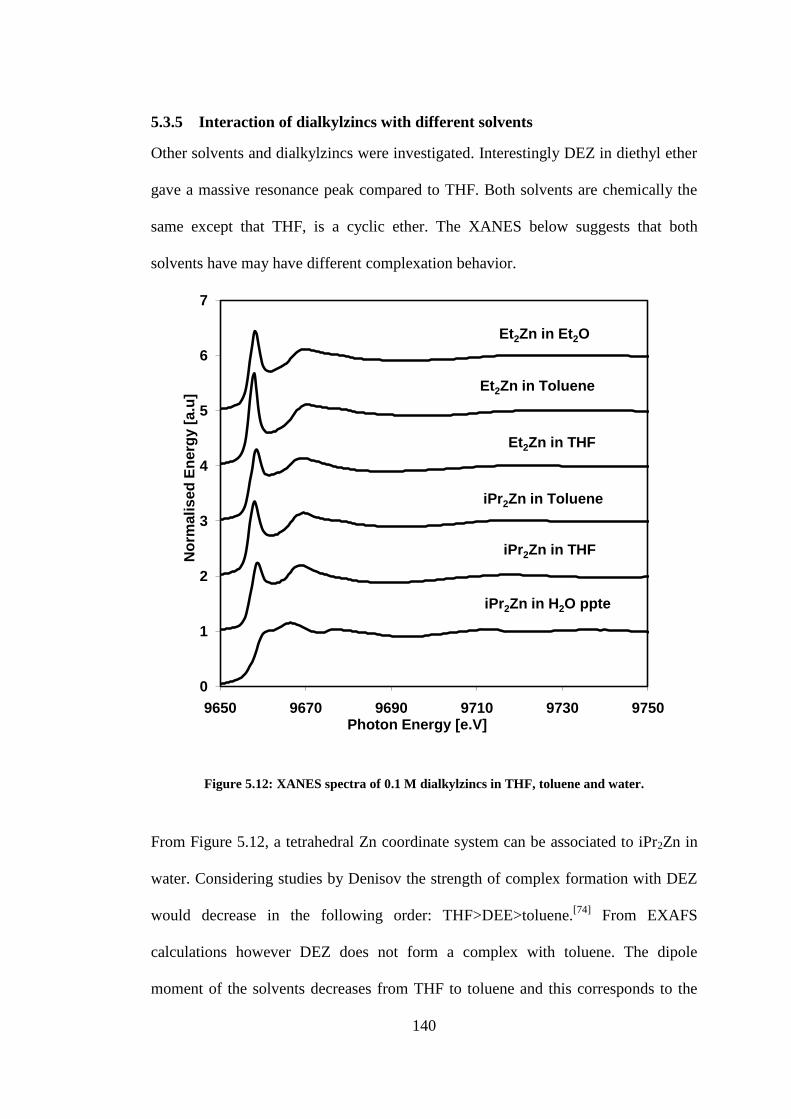
140
5.3.5 Interaction of dialkylzincs with different solvents
Other solvents and dialkylzincs were investigated. Interestingly DEZ in diethyl ether
gave a massive resonance peak compared to THF. Both solvents are chemically the
same except that THF, is a cyclic ether. The XANES below suggests that both
solvents have may have different complexation behavior.
Figure 5.12: XANES spectra of 0.1 M dialkylzincs in THF, toluene and water.
From Figure 5.12, a tetrahedral Zn coordinate system can be associated to iPr2Zn in
water. Considering studies by Denisov the strength of complex formation with DEZ
would decrease in the following order: THF>DEE>toluene.[74]
From EXAFS
calculations however DEZ does not form a complex with toluene. The dipole
moment of the solvents decreases from THF to toluene and this corresponds to the
0
1
2
3
4
5
6
7
9650 9670 9690 9710 9730 9750
No
rma
lis
ed
En
erg
y [
a.u
]
Photon Energy [e.V]
iPr2Zn in H2O ppte
iPr2Zn in THF
iPr2Zn in Toluene
Et2Zn in THF
Et2Zn in Toluene
Et2Zn in Et2O
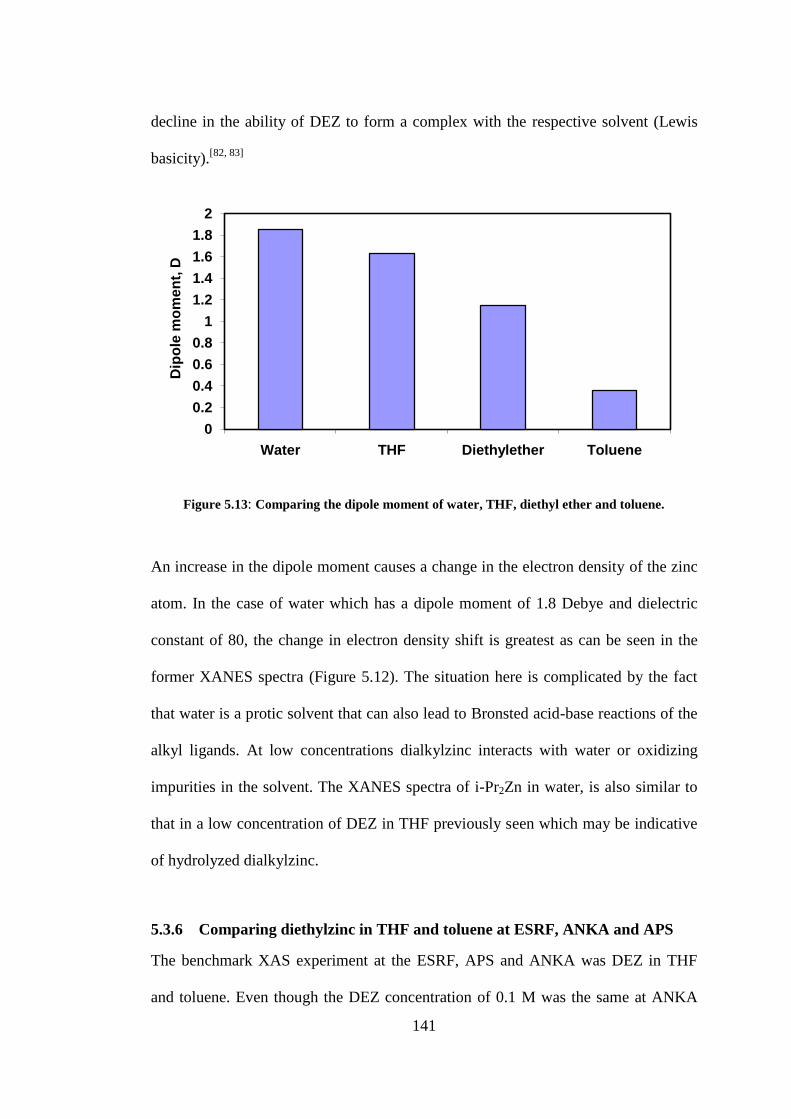
141
decline in the ability of DEZ to form a complex with the respective solvent (Lewis
basicity).[82, 83]
Figure 5.13: Comparing the dipole moment of water, THF, diethyl ether and toluene.
An increase in the dipole moment causes a change in the electron density of the zinc
atom. In the case of water which has a dipole moment of 1.8 Debye and dielectric
constant of 80, the change in electron density shift is greatest as can be seen in the
former XANES spectra (Figure 5.12). The situation here is complicated by the fact
that water is a protic solvent that can also lead to Bronsted acid-base reactions of the
alkyl ligands. At low concentrations dialkylzinc interacts with water or oxidizing
impurities in the solvent. The XANES spectra of i-Pr2Zn in water, is also similar to
that in a low concentration of DEZ in THF previously seen which may be indicative
of hydrolyzed dialkylzinc.
5.3.6 Comparing diethylzinc in THF and toluene at ESRF, ANKA and APS
The benchmark XAS experiment at the ESRF, APS and ANKA was DEZ in THF
and toluene. Even though the DEZ concentration of 0.1 M was the same at ANKA
0
0.2
0.4
0.6
0.8
1
1.2
1.4
1.6
1.8
2
Water THF Diethylether Toluene
Dip
ole
mo
men
t, D

142
and ESRF the XANES spectra from ESRF was similar to APS but not ANKA. This
was observed in both THF and toluene. It is still unclear why the discrepancy exists.
In all cases the supplier of DEZ and the solvents was Sigma Aldrich. However at
ANKA, the solvents were dried, distilled and kept on molecular sieves.
Figure 5.14: Comparing the XANES spectra of 0.1M DEZ obtained at different synchrotrons.
An expected massive white line which is the case at APS and ESRF is not the case at
ANKA in toluene. The XANES measured at ANKA in toluene has a reduced peak
and is similar to the XANES in THF at APS and ESRF. The difference between the
measurement at ANKA in toluene and APS/ESRF in THF is that the 1st peak of the
ANKA spectra is slightly broader. In THF the XANES spectra at ANKA is an
0
2
4
6
8
10
12
9650 9670 9690 9710
No
rma
lis
ed
In
ten
sit
y [
a.u
]
Photon Energy [e.V]
THF (ANKA)
THF (APS)
Tol (APS)
Tol (ESRF)
THF (ESRF)
Tol (ANKA)
Similar
Similar
Indicative of zinc oxide

143
obvious reminder of zinc oxide suggesting tetrahedral zinc sites. From this XANES
analysis at the different light sources, one may suspect the presence of trigonal planar
or tetrahedral zinc sites in both toluene and THF based on the ANKA beam time
results. One possible explanation could be the oxidation of DEZ or the presence of
contaminants. The difference might perhaps be synchrotron related but is more likely
to be the purity of DEZ. This study deals with this inconsistency by relying on the
XAS measurements at APS and ESRF, in order to develop structural models.
5.3.7 Comparing the XANES of diethyl-, dimethyl- and diisopropylzinc
Since the discovery of the Soai reaction, diisopropylzinc has been the only successful
alkyl donating group capable of amplifying chirality. In this section we shall see the
Zn K-edge spectra of diisopropyl-, diethyl- and dimethylzinc measured at the APS.
The dialkylzincs which are pyrophoric were prepared in the same manner in an inert
environment as previously mentioned. It should be noted that dimethylzinc is the
most pyrophoric and easily ignites. Figure 5.15 illustrates the similarity in the
XANES of dialkylzincs measured at APS with three characteristic peaks within this
energy range. However, it can be seen that dimethylzinc (DMZ) shows a slightly
different XANES from the other measured spectra.

144
Figure 5.15: Zn K-edge spectra of 0.1 M dimethyl-, diethyl and diisoproylzinc in toluene
Dimethylzinc has a more intense resonance line than the other two. The discrepancy
in their XANES spectra can be measured and is indicated by the black arrows in the
above Zn K-edge XANES. With respect to DMZ the white line is higher by 0.2 a.u,
the trough between the two peaks is 0.1 a.u deeper and the 2nd
peak is shifted slightly
to a higher energy level. The observed difference may be because of the electronic
and steric effects present in these molecules. Diisopropylzinc and diethylzinc are
both similar in size whereas dimethylzinc has a smaller radius and has less bulky
0.0
0.5
1.0
1.5
2.0
9650 9670 9690 9710
No
rmali
sed
In
ten
sit
y [
a.u
]
Photon Energy [e.V]
Diethylzinc
Dimethylzinc
Diisopropylzinc

145
groups. In terms of the ability to release electrons, ethyl and isopropyl have a greater
potential of donating electrons in comparison to methyl. Isopropyl is a better electron
releasing substituent than ethyl even though their spectra are the same. This
differentiation in the XANES spectra is partly or wholly as a result of the electronic
effects on the zinc atom. On the other hand other potential causes must be considered
including steric effects which could support the explanation of this disparity.
5.3.8 EXAFS analysis of diethylzinc in solvents
The EXAFS analysis provides evidence of the neighbouring atoms as well as bond
distances from the central zinc atom in solution. We have established that dialkyl
zincs tend to bind to polar solvents. According to EXAFS calculations DEZ does not
form a complex with toluene. In toluene the 1st shell coordination number with
carbon is 1.42 (±0.121) i.e. approximately 2 and the Zn-C bond distance in the first
shell is 1.89 (±0.010) Å. This suggests a linear structure which is maintained in
toluene.
Figure 5.16: Zinc K edge EXAFS spectra of Et2Zn in Toluene. Dotted lines are the experimental
data and the solid lines are the best theoretical fit.
-2.5
-2
-1.5
-1
-0.5
0
0.5
1
1.5
2
3 8k3χ(k
)
k [Å]
0.0
0.1
0.2
0.3
0.4
0.5
0.6
0.7
0 2 4 6
FT
mag
k3χ(k
)
R [Å]
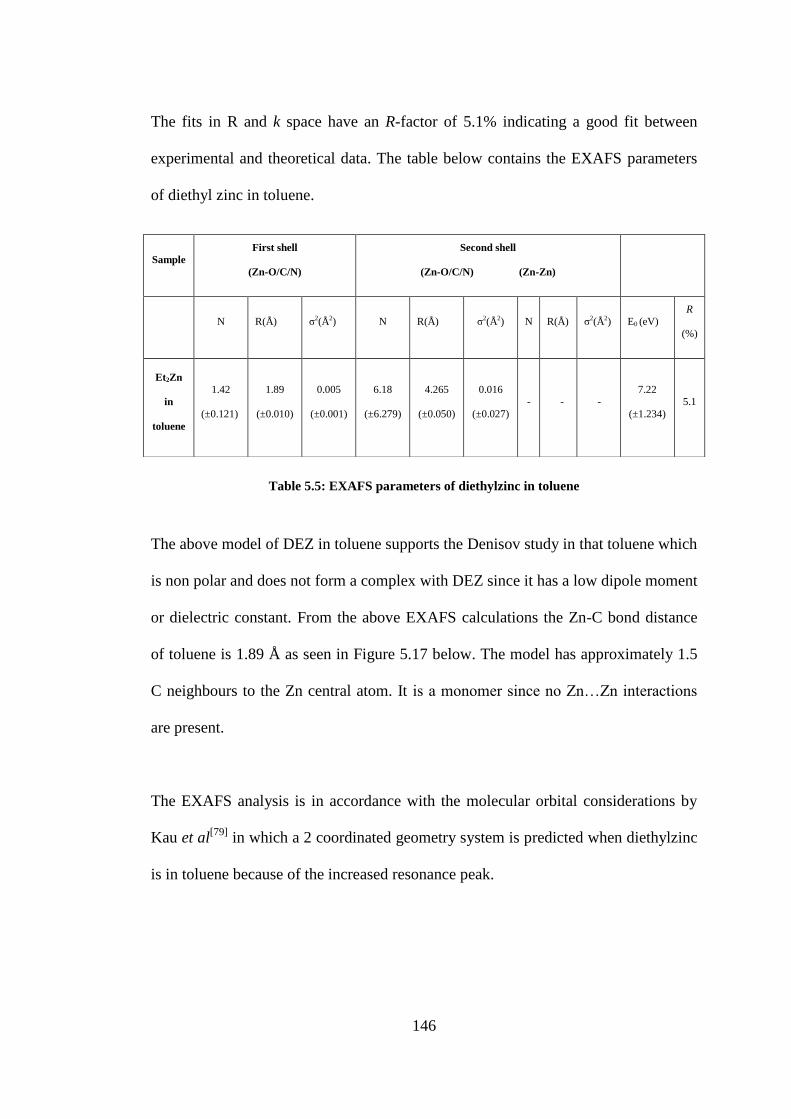
146
The fits in R and k space have an R-factor of 5.1% indicating a good fit between
experimental and theoretical data. The table below contains the EXAFS parameters
of diethyl zinc in toluene.
Table 5.5: EXAFS parameters of diethylzinc in toluene
The above model of DEZ in toluene supports the Denisov study in that toluene which
is non polar and does not form a complex with DEZ since it has a low dipole moment
or dielectric constant. From the above EXAFS calculations the Zn-C bond distance
of toluene is 1.89 Å as seen in Figure 5.17 below. The model has approximately 1.5
C neighbours to the Zn central atom. It is a monomer since no Zn…Zn interactions
are present.
The EXAFS analysis is in accordance with the molecular orbital considerations by
Kau et al[79]
in which a 2 coordinated geometry system is predicted when diethylzinc
is in toluene because of the increased resonance peak.
Sample
First shell
(Zn-O/C/N)
Second shell
(Zn-O/C/N) (Zn-Zn)
N R(Å) σ2(Å2) N R(Å) σ2(Å2) N R(Å) σ2(Å2) E0 (eV)
R
(%)
Et2Zn
in
toluene
1.42
(±0.121)
1.89
(±0.010)
0.005
(±0.001)
6.18
(±6.279)
4.265
(±0.050)
0.016
(±0.027)
- - - 7.22
(±1.234)
5.1

147
Figure 5.17: Model of diethyl zinc in toluene from EXAFS calculations.
The EXAFS fit of diethyl zinc in THF suggests that an association of DEZ molecules
is promoted by the presence of the polar solution i.e. THF. Three EXAFS fit
calculations were done on diethyl zinc in 100% THF in order to ascertain the nature
of the structure in THF. The EXAFS fits in Figure 5.18 indicate that in THF it is very
probable that there is a contribution due to a Zn…Zn interaction. The two best fits
which include Zn seen in Figure 5.18 have a pronounced second peak at
approximately 3 Å. This pronounced second peak (mainly Zn…Zn) is absent in
toluene. From the fits below it is obvious that the structure is more likely a tetramer
or a dimer than a monomer as indicated by the number of neighbouring Zn atoms.
Zn
CH3
CH3
1.89 Å

148
Figure 5.18: EXAFS fits of diethylzinc in THF (a) linear (b) dimer and (c) tetramer.
-2.5
-2
-1.5
-1
-0.5
0
0.5
1
1.5
2
2.5
3 8
k3χ(k
)
k [Å]
0.0
0.1
0.2
0.3
0.4
0.5
0 1 2 3 4 5 6
FT
mag
k3χ(k
)
R [Å]
-2.5
-2
-1.5
-1
-0.5
0
0.5
1
1.5
2
2.5
3 8
k3χ(k
)
k [Å]
0.0
0.1
0.2
0.3
0.4
0.5
0 2 4 6
FT
mag
k3χ(k
)
R [Å]
-2.5
-2
-1.5
-1
-0.5
0
0.5
1
1.5
2
2.5
3 8
k3χ
(k)
k [Å]
0.0
0.1
0.2
0.3
0.4
0.5
0 1 2 3 4 5 6
FT
mag
k3χ
(k)
R [Å]
(a) No
Zn…Zn
(b)
Zn...Zn
(one Zn)
(c)
Zn…Zn
(3 Zn)
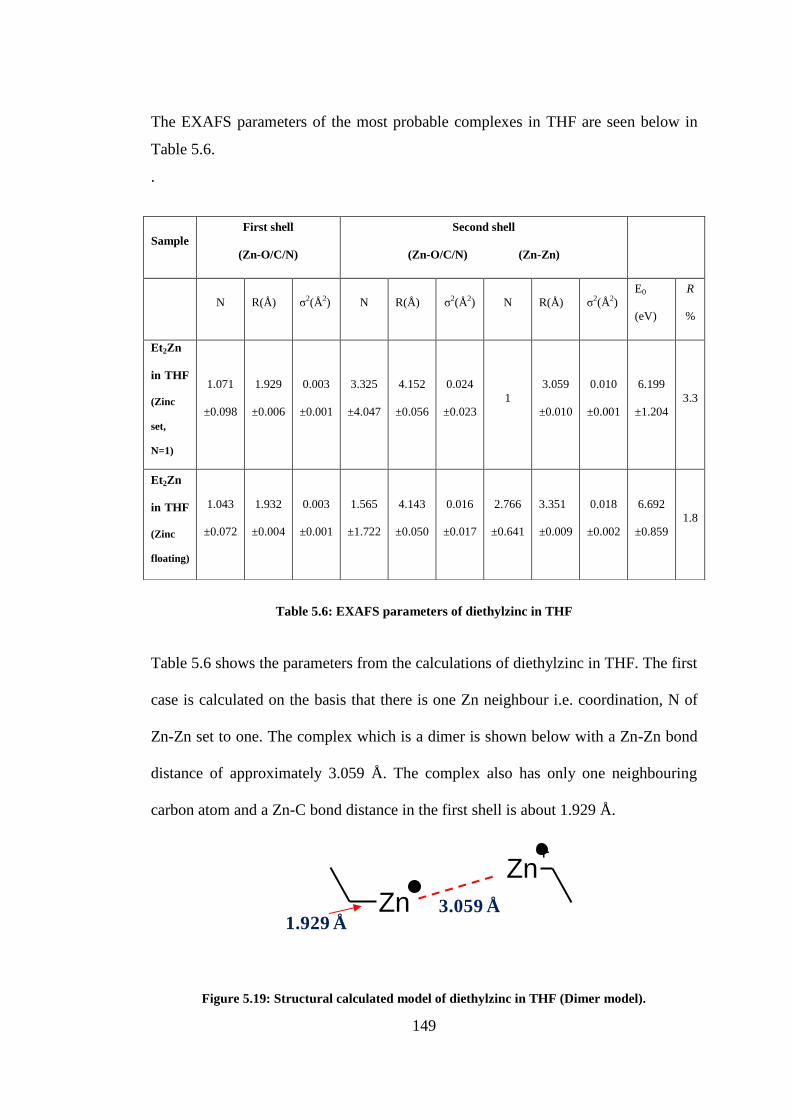
149
The EXAFS parameters of the most probable complexes in THF are seen below in
Table 5.6.
.
Table 5.6: EXAFS parameters of diethylzinc in THF
Table 5.6 shows the parameters from the calculations of diethylzinc in THF. The first
case is calculated on the basis that there is one Zn neighbour i.e. coordination, N of
Zn-Zn set to one. The complex which is a dimer is shown below with a Zn-Zn bond
distance of approximately 3.059 Å. The complex also has only one neighbouring
carbon atom and a Zn-C bond distance in the first shell is about 1.929 Å.
Figure 5.19: Structural calculated model of diethylzinc in THF (Dimer model).
1.929 ÅZn
+Zn
+
3.059 Å
Sample
First shell
(Zn-O/C/N)
Second shell
(Zn-O/C/N) (Zn-Zn)
N R(Å) σ2(Å2) N R(Å) σ2(Å2) N R(Å) σ2(Å2)
E0
(eV)
R
%
Et2Zn
in THF
(Zinc
set,
N=1)
1.071
±0.098
1.929
±0.006
0.003
±0.001
3.325
±4.047
4.152
±0.056
0.024
±0.023
1
3.059
±0.010
0.010
±0.001
6.199
±1.204
3.3
Et2Zn
in THF
(Zinc
floating)
1.043
±0.072
1.932
±0.004
0.003
±0.001
1.565
±1.722
4.143
±0.050
0.016
±0.017
2.766
±0.641
3.351
±0.009
0.018
±0.002
6.692
±0.859
1.8

150
The above model is derived from the dimer model has an R-factor of 3.3%. Allowing
the Zn-Zn coordination number to float, results in the tetramer model (Figure 5.20).
The EXAFS parameters that represent the tetramer model are seen in the bottom
section of Table 5.6. As can be seen from Table 5.6 and Figure 5.18, the tetramer
model has the best fit with an R-factor 1.8% (best fit). The structure of the tetramer
model derived from the best fit is shown below.
Figure 5.20: Structural calculated model of diethylzinc in THF (Tetramer model).
The above models suggest that toluene molecules therefore do not interact with the
diethylzinc like THF molecules which cause Zn…Zn interactions. Both the dimer
and tetramer models in THF possess dissociated DEZ molecules i.e. monoalkylzinc
(MEZ). Either two or four monoethylzinc molecules are then brought together by
THF molecules (found between two MEZ molecules) to form a monoethylzinc
(MEZ) dimer or tetramer respectively. From the EXAFS calculations it is very likely
that the preferred structure of diethyl zinc in THF is the tetramer model which has a
better fit in THF. The Zn-C bond distance is 1.932 Å and the Zn….Zn distances are
Zn+
Zn+
Zn+
Zn+
3.351 Å
1.932 Å
151
3.351 Å (longer than that of dimer model). It is also important to note that the Zn-C
bond distance (1st shell) increases from toluene to THF from 1.89 to 1.93 Å. It is
likely that monoethylzinc is a radical. This phenomenon, whereby a radical is formed
by diethylzinc in THF has been proposed by other studies.[84, 85]
Diethylzinc is known
to promote radical formation possibly by its interaction with impurities which
include oxygen present in THF. The ethyl radical formed then associates with other
functional groups forming a new compound. Diethylzinc therefore functions as an
initiator and transfer agent.[84, 85]
The electronegative oxygen atom in THF, found
between two MEZ molecules, is likely responsible for pulling the remaining MEZ
molecules together thus the Zn…Zn interaction.
The association of THF molecules with zinc is still present with an excess of toluene
molecules in a 3:1 ratio as previously seen in the XANES spectra. From this study
the binding effect experienced with zinc atoms is less severe when less THF
molecules are present. This finding is logical as fewer THF molecules are available
to interact with zinc. Astonishingly according to this model, the diethylzinc
molecules still dissociate to monoethylzinc with a deficiency of THF molecules in
the solvent mixture.
In line with the molecular orbital considerations by Kau et al[79]
a 3 fold coordinated
geometry system is expected with the reduction in the resonance peak with the
interaction of 0.1 M diethylzinc and THF. This is contradicted by a one coordinated
geometry structure calculated by the EXAFS analysis. The formation of radicals of
diethylzinc in THF already discussed may be the reason for this discrepancy.

152
5.3.9 Kinetic simulation studies of diethylzinc in solvents
In an attempt to relate the work of Denisov[74]
to this XAFS study, equilibrium
studies were carried out to compare the interaction of solvents with DEZ or
dialkylzincs. Kinetic simulation studies were possible using a simulation program,
Chemical Kinetic Simulator (CKS). The rate of reaction is determined by CKS using
a stochastic algorithm technique.
The equilibrium constants derived from Denisov‟s work were used and the reversible
reaction considered involved the association of DEZ and a solvent to form a
complex.
Et2Zn + Solvent ↔ Et2Zn.Solvent
DEZ and the solvent exist in equilibrium with the donor-acceptor complex. The
kinetic calculation was done with initial amounts of 0.1 M and an inert solvent was
assumed to be the medium. Equilibrium constants determined by Denisov i.e. THF:
0.68 l/m, DEE: 0.2 l/m were considered and the simulations were executed with a
package called chemical kinetic simulator v1.01.[86]
Assumptions made in the
calculation include equilibrium constants of toluene and polar solvents as 0.05 and 1
l/mol respectively. The outcome of this calculation should hopefully support the
findings derived from the XAFS studies.
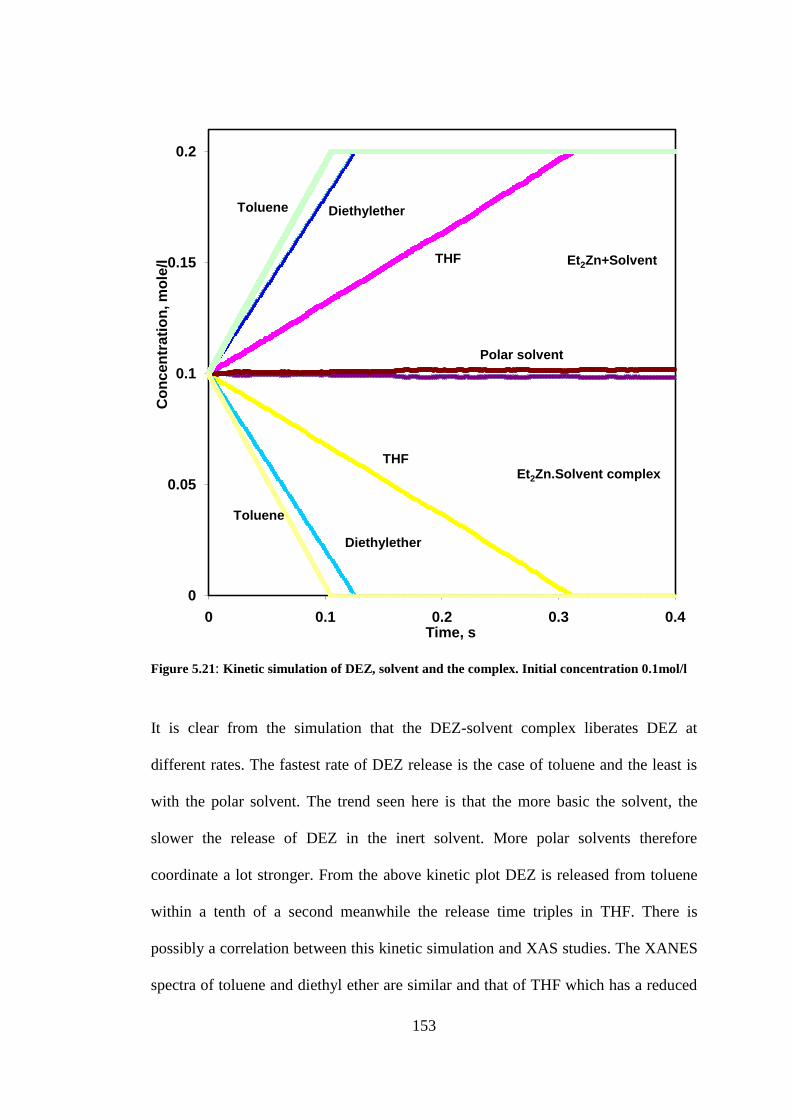
153
Figure 5.21: Kinetic simulation of DEZ, solvent and the complex. Initial concentration 0.1mol/l
It is clear from the simulation that the DEZ-solvent complex liberates DEZ at
different rates. The fastest rate of DEZ release is the case of toluene and the least is
with the polar solvent. The trend seen here is that the more basic the solvent, the
slower the release of DEZ in the inert solvent. More polar solvents therefore
coordinate a lot stronger. From the above kinetic plot DEZ is released from toluene
within a tenth of a second meanwhile the release time triples in THF. There is
possibly a correlation between this kinetic simulation and XAS studies. The XANES
spectra of toluene and diethyl ether are similar and that of THF which has a reduced
0
0.05
0.1
0.15
0.2
0 0.1 0.2 0.3 0.4
Co
nc
en
tra
tio
n, m
ole
/l
Time, s
THF
THF
Diethylether
Diethylether
Toluene
Toluene
Polar solvent
Et2Zn+Solvent
Et2Zn.Solvent complex
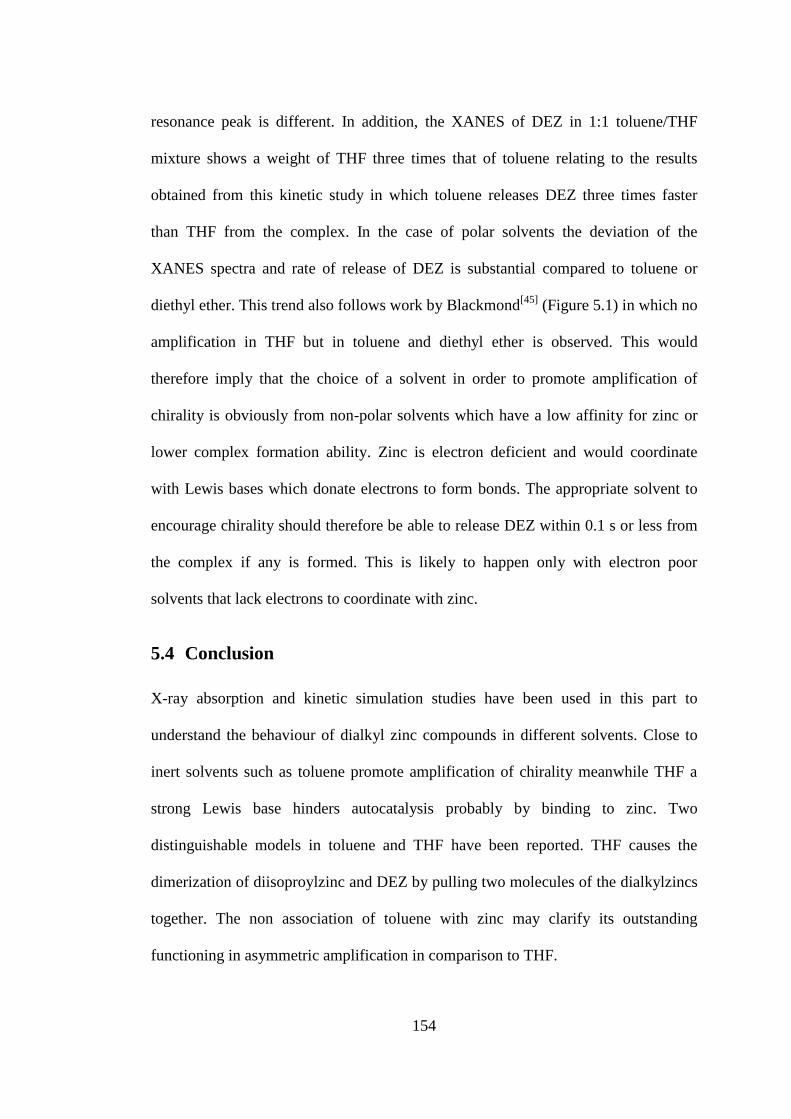
154
resonance peak is different. In addition, the XANES of DEZ in 1:1 toluene/THF
mixture shows a weight of THF three times that of toluene relating to the results
obtained from this kinetic study in which toluene releases DEZ three times faster
than THF from the complex. In the case of polar solvents the deviation of the
XANES spectra and rate of release of DEZ is substantial compared to toluene or
diethyl ether. This trend also follows work by Blackmond[45]
(Figure 5.1) in which no
amplification in THF but in toluene and diethyl ether is observed. This would
therefore imply that the choice of a solvent in order to promote amplification of
chirality is obviously from non-polar solvents which have a low affinity for zinc or
lower complex formation ability. Zinc is electron deficient and would coordinate
with Lewis bases which donate electrons to form bonds. The appropriate solvent to
encourage chirality should therefore be able to release DEZ within 0.1 s or less from
the complex if any is formed. This is likely to happen only with electron poor
solvents that lack electrons to coordinate with zinc.
5.4 Conclusion
X-ray absorption and kinetic simulation studies have been used in this part to
understand the behaviour of dialkyl zinc compounds in different solvents. Close to
inert solvents such as toluene promote amplification of chirality meanwhile THF a
strong Lewis base hinders autocatalysis probably by binding to zinc. Two
distinguishable models in toluene and THF have been reported. THF causes the
dimerization of diisoproylzinc and DEZ by pulling two molecules of the dialkylzincs
together. The non association of toluene with zinc may clarify its outstanding
functioning in asymmetric amplification in comparison to THF.
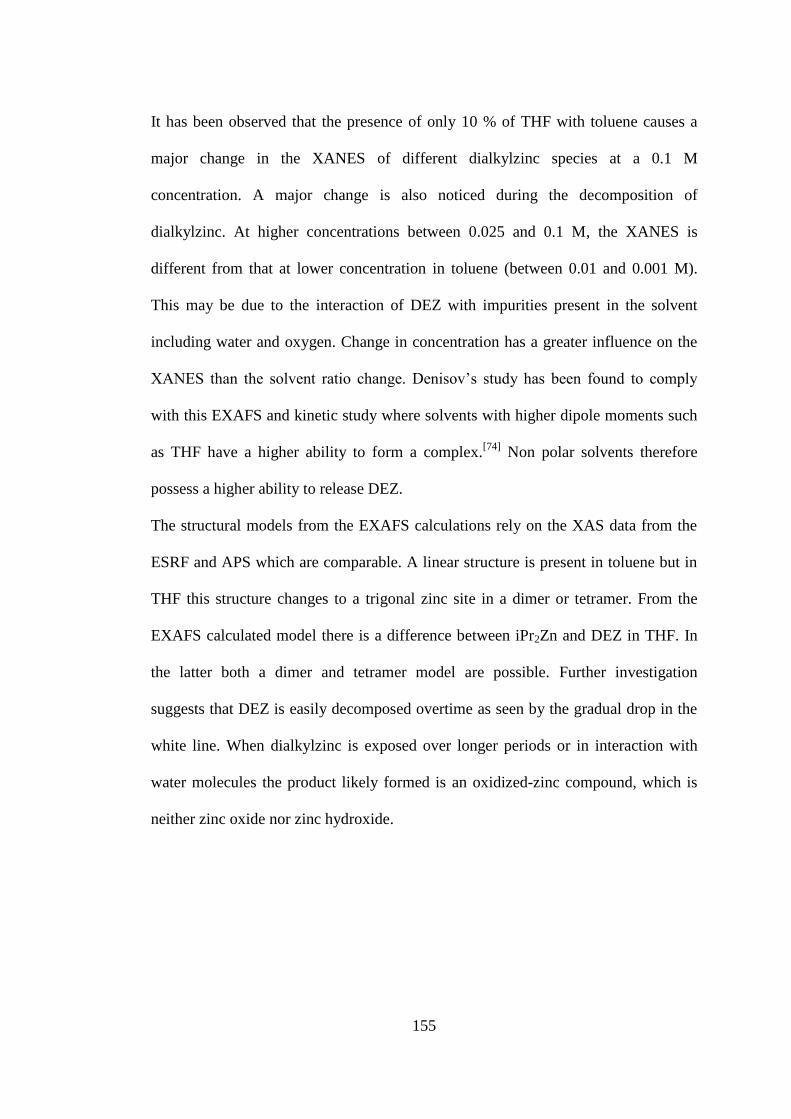
155
It has been observed that the presence of only 10 % of THF with toluene causes a
major change in the XANES of different dialkylzinc species at a 0.1 M
concentration. A major change is also noticed during the decomposition of
dialkylzinc. At higher concentrations between 0.025 and 0.1 M, the XANES is
different from that at lower concentration in toluene (between 0.01 and 0.001 M).
This may be due to the interaction of DEZ with impurities present in the solvent
including water and oxygen. Change in concentration has a greater influence on the
XANES than the solvent ratio change. Denisov‟s study has been found to comply
with this EXAFS and kinetic study where solvents with higher dipole moments such
as THF have a higher ability to form a complex.[74]
Non polar solvents therefore
possess a higher ability to release DEZ.
The structural models from the EXAFS calculations rely on the XAS data from the
ESRF and APS which are comparable. A linear structure is present in toluene but in
THF this structure changes to a trigonal zinc site in a dimer or tetramer. From the
EXAFS calculated model there is a difference between iPr2Zn and DEZ in THF. In
the latter both a dimer and tetramer model are possible. Further investigation
suggests that DEZ is easily decomposed overtime as seen by the gradual drop in the
white line. When dialkylzinc is exposed over longer periods or in interaction with
water molecules the product likely formed is an oxidized-zinc compound, which is
neither zinc oxide nor zinc hydroxide.

156
6. Characterisation of a ligand and alkylzinc complex
6.1 Introduction
The alkyl-zinc bond in dialkylzincs is rather non polar. Replacing an alkyl group by
an electronegative substituent increases the polarity of the alkyl-Zn bond thereby
strengthening the character of the alkyl group and zinc atom as a donor and acceptor
respectively.
R∂- X
R - Zn – R Zn∂+
Unreactive Reactive
X = alkyl, N, O, halogen, etc.
This explains the benefit of using chiral ligands which have an X substituent together
with dialkylzincs. The nature of the aldehyde, alkylzinc and ligand is crucial in
influencing the reactivity. Noyori suggested the scheme below in which DAIB (3-
exo-(Dimethylamino)isoborneol) was mixed with dialkylzinc in a 1:1 ratio evolving
the corresponding alkane. A dimeric compound, 1 is also produced among three
isomers.[18]
157
Figure 6.1: Catalytic cycle proposed by Noyori.[18]
The monomeric zinc chelate complexes (Figure 6.2) have been recognized by Noyori
as the active catalyst in DAIB promoted alkylation of aldehydes while the dimeric
catalysts are unreactive.[18]
These catalysts are regarded to be vital in the
amplification of chirality.
Figure 6.2: Noyori’s DAIB and the dimer-monomer equilibrium of homochiral zinc chelate
complexes.[87]

158
The equilibrium between the inactive dimer and active monomer according to Noyori
provides evidence on the extent of turnover.[18]
Using XAS, our objective was to use conditions under which amplification of
chirality is achieved according to Noyori, in order to characterize the zinc complex in
solution. Experiments done by Noyori, indicate that a 1:2:1 mixture of the aldehyde,
diethylzinc and ligand gives the highest yield and enantiomeric excess
(corresponding to fourth row in Table 6.1).[18]
Ratio
(S)-1-phenyl-1-1-
propanol
C6H5CHO (C2H5)2Zn (-) DAIB % Yield % ee
1 1 0 0
1 1 1 1 0
1 2 2 0
1 2 1 88 98
2 2 1 49 98
100 50 1 48 98
50 50 1 97 98
Table 6.1: Effect of aldehyde: dialkylzinc: DAIB ratio on reactivity.[18]
The main ligands studied in this report include DMAE (dimethylaminoethanol) and
2-butanol. Braese and co-workers have proven the suitability of ketimines with a
[2.2] paracyclophane framework in the asymmetric addition of alkyl groups to
aldehydes.[88-92]
Soai and co-workers have also contributed to the growing interest in
[2.2] paracyclophane as chiral ligands in enantioselective reactions.[93]
For example,
monosubstituted [2.2] paracyclophane were used as chiral initiators in the
isopropylation of 2-alkynylpyrimidine-5-carbaldehyde to 2-alkynylpyrimidyl alkanol
which gives a high enantiomeric excess (97%).

159
The objective of this investigation reported in the following sections is to examine
the molecular structure of the active catalyst, and in particular whether it is a
monomer, a dimer or perhaps some other species.
6.2 Experimental
The results in this section were obtained at the ESRF in a follow up beamtime to
previous experiments carried out at ANKA in Karlsruhe, Germany. The
paracyclophane ligand is mimicked by DMAE which has both O and N
electronegative atoms. In the first instance the iPr2Zn and 2-butanol which have been
used by Soai and coworkers will be studied followed by DMAE and DEZ.
6.3 Results and discussion
6.3.1 i-Pr2Zn and 2-butanol
XAS measurements were carried out at different concentrations of i-Pr2Zn and 2-
butanol mostly in toluene which is an ideal solvent to give a high ee and yield. The
concentration of 0.1 M i-Pr2Zn was maintained in all measurements.

160
Figure 6.3: XANES Zn K-edge spectra of 0.1 M i-Pr2Zn : 2-butanol molar ratios.
Mixing i-Pr2Zn with 2-butanol causes a change in electronic state of the zinc atom as
seen from the XANES spectra in which a drop of the resonance peak is visible
compared to i-Pr2Zn in toluene. However it is noticeable that decreasing the i-Pr2Zn:
2-butanol molar ratio from 1:1 to 1:10 with the ligand in excess there is no visible
change in the normalized XANES plot. This would imply the zinc environment
remains unaltered probably because a point of saturation is attained for interaction
between i-Pr2Zn and 2-butanol molecules. By doubling the dialkylzinc amount, from
1:1 to 2:1 a similar XANES spectra is also observed in toluene and even THF. In
such a scenario there is a surplus of i-Pr2Zn molecules meaning all 2-butanol
molecules will coordinate with i-Pr2Zn and an excess of the dialkylzinc would be
0
1
2
3
4
5
6
7
9650 9670 9690 9710 9730 9750
No
rma
lis
ed
In
ten
sit
y [
a.u
]
Photon Energy [e.V]
2:1 in THF
2:1 in toluene
1:10 in toluene
1:1 in toluene
iPr2Zn in toluene
iPr2Zn in THF
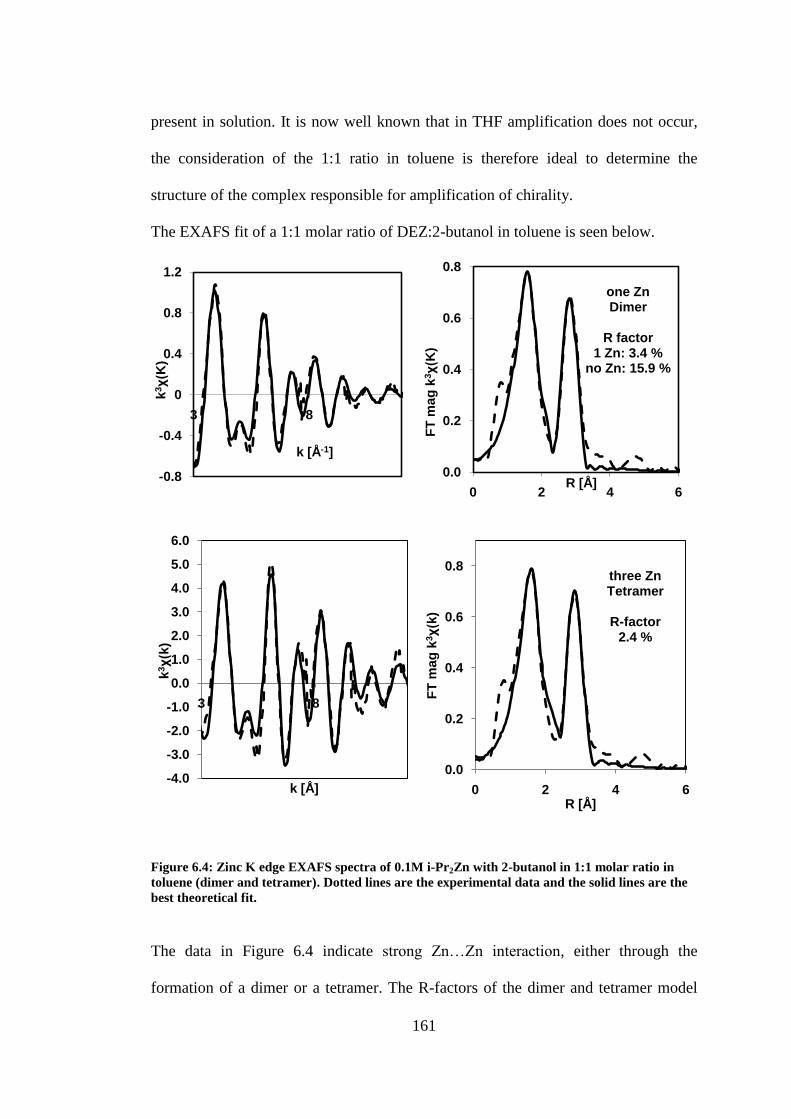
161
present in solution. It is now well known that in THF amplification does not occur,
the consideration of the 1:1 ratio in toluene is therefore ideal to determine the
structure of the complex responsible for amplification of chirality.
The EXAFS fit of a 1:1 molar ratio of DEZ:2-butanol in toluene is seen below.
Figure 6.4: Zinc K edge EXAFS spectra of 0.1M i-Pr2Zn with 2-butanol in 1:1 molar ratio in
toluene (dimer and tetramer). Dotted lines are the experimental data and the solid lines are the
best theoretical fit.
The data in Figure 6.4 indicate strong Zn…Zn interaction, either through the
formation of a dimer or a tetramer. The R-factors of the dimer and tetramer model
-0.8
-0.4
0
0.4
0.8
1.2
3 8
k3χ(K
)
k [Å-1]
0.0
0.2
0.4
0.6
0.8
0 2 4 6
FT
mag
k3χ(K
)
R [Å]
one ZnDimer
R factor1 Zn: 3.4 %
no Zn: 15.9 %
-4.0
-3.0
-2.0
-1.0
0.0
1.0
2.0
3.0
4.0
5.0
6.0
3 8
k3χ(k
)
k [Å]
0.0
0.2
0.4
0.6
0.8
0 2 4 6
FT
mag
k3χ(k
)
R [Å]
three ZnTetramer
R-factor2.4 %

162
fits are 3.4 and 2.4 %. For comparison, the R-factor obtained using a monomer
without Zn…Zn interaction is poor, at 15.9 %. The parameters used in the EXAFS
fits are given in Table 6.2.
Table 6.2: Zn K-edge EXAFS parameter of 0.1 M i-Pr2Zn with 2-Butanol in 1:1 molar ratio in
toluene
The XANES suggests that 2-butanol is reactive as can be seen by XANES of a 1:1
and 1:10 molar ratio which are similar compared to that of iPr2Zn in toluene. No
visible difference is seen in both the XANES and EXAFS regions. This would imply
that there is not enough butanol to react with all the zinc in solution.
The behavior of 2-butanol as observed from the XANES is similar to that of THF.
The Zn-C bond distance in the 1st shell is 2.02 and 2.03 Å in the dimer and tetramer
respectively. A difference of 0.25 Å is calculated between the dimer and tetramer
complex with a Zn…Zn distance of 3.10 Å found in the tetramer.
Model
First shell
(Zn-O/C/N)
Second shell
(Zn-O/C/N) (Zn-Zn)
N R(Å) σ2(Å2) N R(Å) σ2(Å2) N R(Å) σ2(Å2) E0 (eV)
R
%
Dimer
3.42
±0.394
2.017
±0.011
0.009
±0.002
4.02
±0.991
3.50
±0.016
0.008
±0.003
1 3.348
±0.010
0.002
±0.001
2.63
±1.014
3.4
Tetrame
r
3.63
±0.394
2.031
±0.009
0.010
±0.001
5.15
±1.719
3.50
±0.016
0.015
±0.003 3
3.097
±0.007
0.010
±0.001
4.10
±1.555 2.4
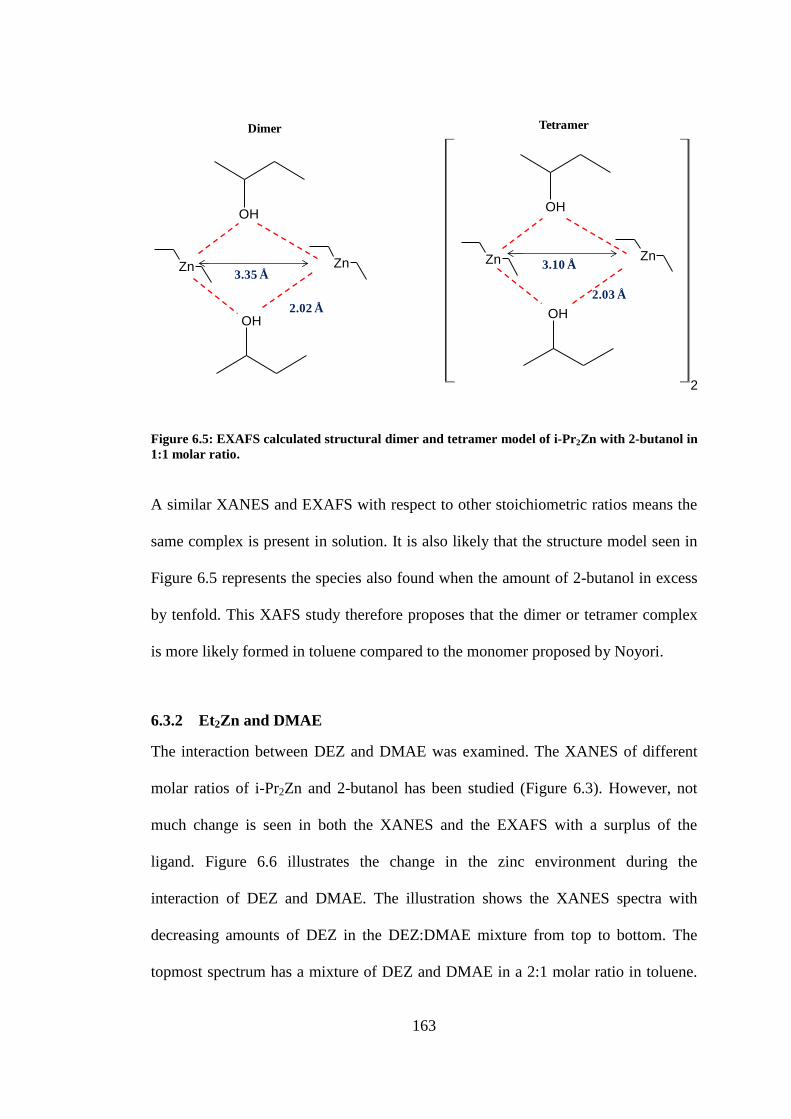
163
Figure 6.5: EXAFS calculated structural dimer and tetramer model of i-Pr2Zn with 2-butanol in
1:1 molar ratio.
A similar XANES and EXAFS with respect to other stoichiometric ratios means the
same complex is present in solution. It is also likely that the structure model seen in
Figure 6.5 represents the species also found when the amount of 2-butanol in excess
by tenfold. This XAFS study therefore proposes that the dimer or tetramer complex
is more likely formed in toluene compared to the monomer proposed by Noyori.
6.3.2 Et2Zn and DMAE
The interaction between DEZ and DMAE was examined. The XANES of different
molar ratios of i-Pr2Zn and 2-butanol has been studied (Figure 6.3). However, not
much change is seen in both the XANES and the EXAFS with a surplus of the
ligand. Figure 6.6 illustrates the change in the zinc environment during the
interaction of DEZ and DMAE. The illustration shows the XANES spectra with
decreasing amounts of DEZ in the DEZ:DMAE mixture from top to bottom. The
topmost spectrum has a mixture of DEZ and DMAE in a 2:1 molar ratio in toluene.
OH
OH
ZnZn
OH
OH
ZnZn
2
Dimer Tetramer
3.35 Å
2.02 Å
3.10 Å
2.03 Å
164
A weak „white line‟ is present at approximately 9659 eV which disappears with the
replacement of toluene with THF in the same molar ratio indicating the presence of
new zinc species. The „white line‟ reappears in an equimolar ratio DEZ and DMAE
in toluene. Reducing the DEZ:DMAE ratio in toluene to 1:10 results in the
disappearance of the white line at 9659 eV suggesting the emergence of new zinc
species. The XANES of a 2:1 in THF and 1:10 in toluene are similar. The 2:1
mixture in THF probably has a mixture of DEZ-DMAE, and DEZ-THF complexes
previously seen in section 5.3.8. On the other hand the 1:10 DEZ:DMAE mixture in
toluene has DEZ-DMAE complexes since there is enough DMAE to react with all
zinc centres. This behavior is evidence of the distinction between DMAE and 2-
butanol. Both ligands are used in asymmetric synthesis as chiral initiators to activate
the dialkylzinc.

165
Figure 6.6: XANES Zn K-edge spectra of 0.1 M Et2Zn and DMAE.
The results seen in Figure 6.4 and Figure 6.6 suggest that the degree of interaction of
both DMAE and 2-butanol with their corresponding dialkylzinc is diverse probably
because DMAE is a chelating agent compared to 2-butanol. The XANES spectra of a
2:1 (DEZ: DMAE) in toluene with an excess of DEZ is found to be more similar to a
1:1 in toluene than a 2:1 mixture in THF. This likely because in toluene, DEZ-
DMAE and DEZ species exist whereas in THF, DEZ-THF species are present in
addition since THF binds to zinc. THF is known to stabilize diethylzinc.[94]
The presence of oxygen and a nitrogen atom in DMAE is seen in Figure 6.7. The
dielectric properties of DMAE may therefore have a stronger electronic effect on the
zinc atom than 2-butanol. DMAE is a chelating agent and 2-butanol is not. DMAE
0.0
0.5
1.0
1.5
2.0
2.5
3.0
3.5
4.0
4.5
9650 9670 9690 9710 9730 9750
No
rmalised
In
ten
sit
y [
a.u
]
Photon Energy [e.V]
1:10 in toluene
1:1 in toluene
2:1 in THF
2:1 in Toluene

166
appears to be less reactive in toluene because an excess is required to convert all
DEZ.
Figure 6.7: Structure of 2-butanol (left) and DMAE (right).
Both oxygen and nitrogen in DMAE are capable of donating electrons to the zinc
atom and are therefore likely to form a bidentate rather than a monodentate
complex.[74]
The similarity of the 1:10 in toluene and 2:1 in THF mixtures potentially
supports the fact that DMAE is a better electron donor than 2-butanol.[95-97]
Further calculations were done to determine the structure of the DEZ/DMAE
complex in a 1:1 ratio which according to studies by Noyori is represented by a
monomeric active complex responsible for amplification of chirality.[18]
Structural
information in this study is ascertained by fitting the EXAFS in k and R space as seen
in Figure 6.8. An evaluation of the EXAFS, advocates the possibility of dimer or
tetramer complex formed between DEZ and DMAE.
N
OH
OH
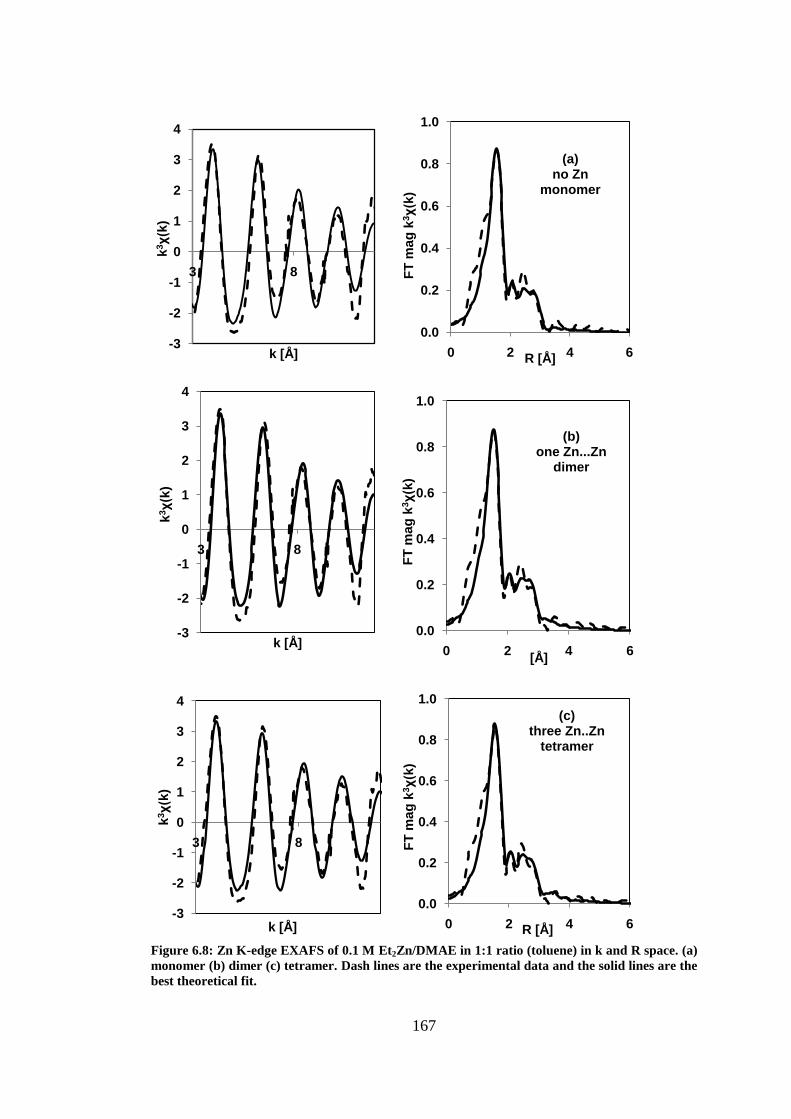
167
Figure 6.8: Zn K-edge EXAFS of 0.1 M Et2Zn/DMAE in 1:1 ratio (toluene) in k and R space. (a)
monomer (b) dimer (c) tetramer. Dash lines are the experimental data and the solid lines are the
best theoretical fit.
-3
-2
-1
0
1
2
3
4
3 8
k3χ(k
)
k [Å]
0.0
0.2
0.4
0.6
0.8
1.0
0 2 4 6
FT
mag
k3χ(k
)
R [Å]
(a)no Zn
monomer
-3
-2
-1
0
1
2
3
4
3 8
k3χ(k
)
k [Å] 0.0
0.2
0.4
0.6
0.8
1.0
0 2 4 6
FT
mag
k3χ(k
)
[Å]
(b)one Zn...Zn
dimer
-3
-2
-1
0
1
2
3
4
3 8
k3χ(k
)
k [Å]
0.0
0.2
0.4
0.6
0.8
1.0
0 2 4 6
FT
mag
k3χ(k
)
R [Å]
(c)three Zn..Zn
tetramer
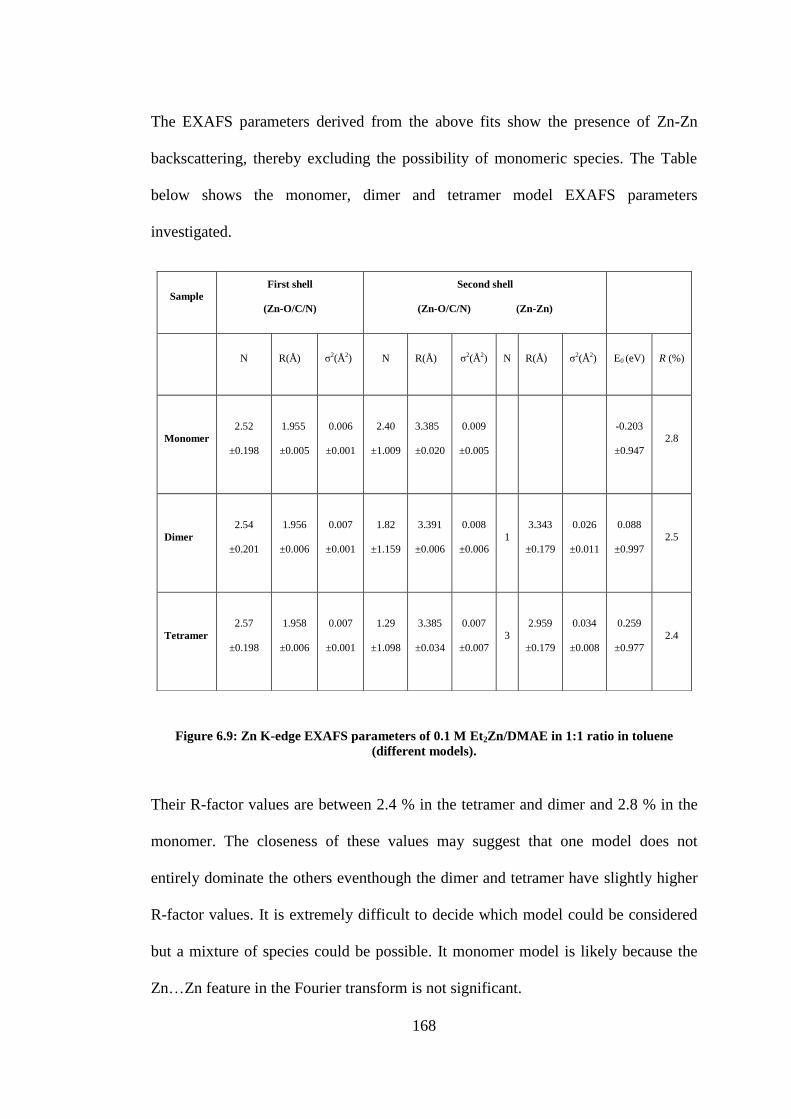
168
The EXAFS parameters derived from the above fits show the presence of Zn-Zn
backscattering, thereby excluding the possibility of monomeric species. The Table
below shows the monomer, dimer and tetramer model EXAFS parameters
investigated.
Figure 6.9: Zn K-edge EXAFS parameters of 0.1 M Et2Zn/DMAE in 1:1 ratio in toluene
(different models).
Their R-factor values are between 2.4 % in the tetramer and dimer and 2.8 % in the
monomer. The closeness of these values may suggest that one model does not
entirely dominate the others eventhough the dimer and tetramer have slightly higher
R-factor values. It is extremely difficult to decide which model could be considered
but a mixture of species could be possible. It monomer model is likely because the
Zn…Zn feature in the Fourier transform is not significant.
Sample
First shell
(Zn-O/C/N)
Second shell
(Zn-O/C/N) (Zn-Zn)
N R(Å) σ2(Å2) N R(Å) σ2(Å2) N R(Å) σ2(Å2) E0 (eV) R (%)
Monomer
2.52
±0.198
1.955
±0.005
0.006
±0.001
2.40
±1.009
3.385
±0.020
0.009
±0.005
-0.203
±0.947
2.8
Dimer
2.54
±0.201
1.956
±0.006
0.007
±0.001
1.82
±1.159
3.391
±0.006
0.008
±0.006 1
3.343
±0.179
0.026
±0.011
0.088
±0.997 2.5
Tetramer
2.57
±0.198
1.958
±0.006
0.007
±0.001
1.29
±1.098
3.385
±0.034
0.007
±0.007
3
2.959
±0.179
0.034
±0.008
0.259
±0.977
2.4

169
Figure 6.10: Monomer, Dimer and Tetramer structural models proposed from EXAFS
parameters of 0.1 M Et2Zn/DMAE in 1:1 ratio (toluene).
Using XAS it is not possible to distinguish Zn-O, Zn-N and Zn-C interactions as
carbon, nitrogen and oxygen have similar backscattering contributions as a result of
their close atomic numbers or similar number of electrons. Other studies propose
comparable Zn-O, Zn-N and Zn-C bond distances.[98, 99]
6.4 Conclusion
According to Noyori the monomer species is responsible for catalysis. The EXAFS
calculations in this study indicate that a monomer, dimer, tetramer or a mixture of
complexes is formed between DEZ and DMAE in a 1:1 molar ratio. From the
XANES it is apparent that the interaction of dialkylzinc and DMAE is different to its
interaction with 2-butanol. DEZ is found to be more reactive than 2-butanol. This
difference in interaction may be because of the presence of two electronegative
atoms (N and O) in DMAE, which causes a stronger interaction with the zinc centre.
N
OH
ZnZn
N
OH
ZnZn
2
N
OH
Zn
Tetramer
Monomer
Dimer
3.34 Å2.95 Å
1.95 Å1.96 Å
1.95 Å
170
The objective of this chapter which is to determine the nature of the complex formed
between dialkylzinc and the ligand has therefore been successfully resolved. Two
ligands which include 2-butanol and DMAE where investigated with DEZ. DMAE
which has both O and N electronegative atoms is similar to paracylcophane ketimine
ligand which is also of great interest in this study. From the findings of this chapter
using both ligands, it is therefore very probable that a dimer or tetramer complex is
formed with 2-butanol, indicating that the monomer complexes, as suggested by
Noyori, are probably present only in low concentrations. In the case of DMAE a
monomer, dimer and tetramer complex is possible based on the EXAFS calculations.
This difference in the structures may also be attributed to DMAE which is less
reactive with DEZ than 2-butanol.

171
7. Characterisation of the alkylation of aldehydes
7.1 Introduction
In the Soai reaction and in many non-autocatalytic stereoselective synthesis reactions
prochiral carbonyl compounds react with dialkylzinc in the presence of a chiral
ligand to give the corresponding chiral secondary alcohol after hydrolysis. This
reaction is capable of giving up to 99% ee.
Several studies[17, 18, 22, 25, 33, 45, 49, 51]
have been reported on the enantioselective
addition of dialkylzincs to aldehydes but a deep understanding of the nature of the
reaction products is lacking. Two types of reactions that generate chirality will be
examined in this section. They include the Soai autocatalytic reaction and non-
autocatalytic asymmetric reactions. Both reactions are highly enantioselective but the
autocatalytic asymmetric reactions are of great interest since the product acts as the
catalyst which is never depleted.
As earlier mentioned, the principle of autocatalytic chiral amplification was first
theoretically suggested by Frank, who established that spontaneous asymmetric
synthesis is a natural property of life which may be present in simpler autocatalytic
systems.[16]
A laboratory demonstration of the antagonistic principle by Frank was
first possible by Soai and coworkers who first reported the asymmetric autocatalytic
reaction.[19, 26, 27]
H+Ligand
R2Zn +H R2
OH
R1
R1CHO
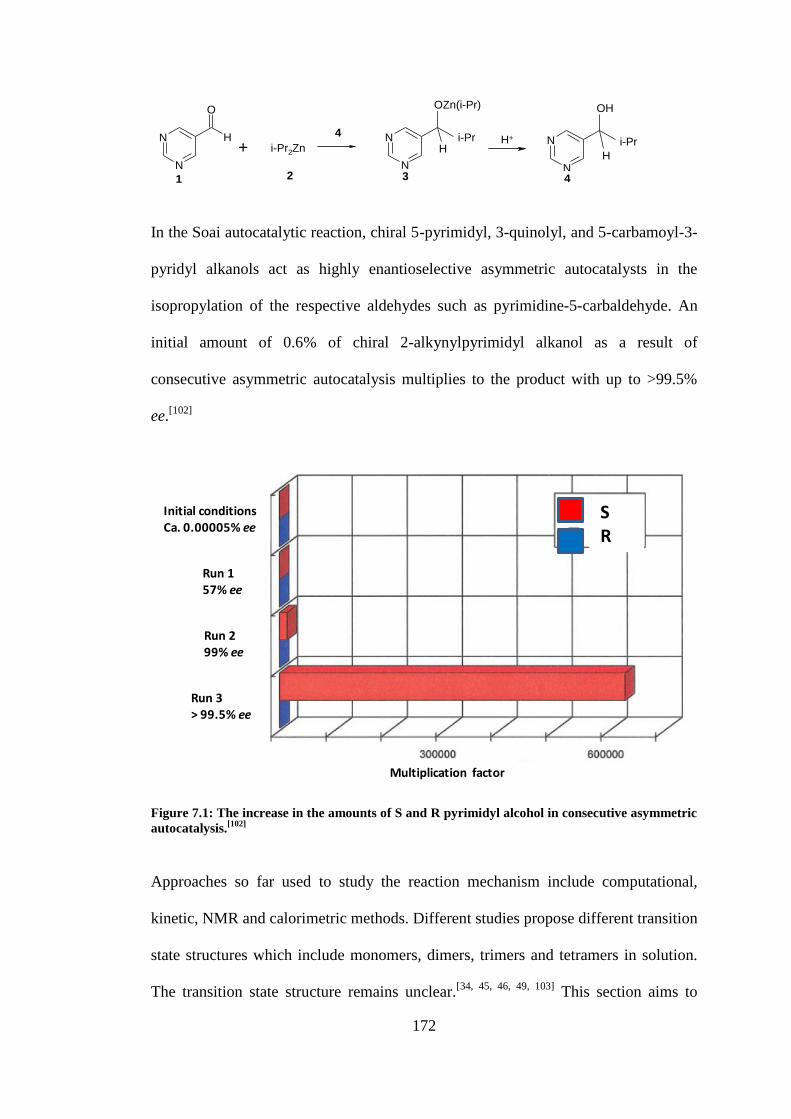
172
In the Soai autocatalytic reaction, chiral 5-pyrimidyl, 3-quinolyl, and 5-carbamoyl-3-
pyridyl alkanols act as highly enantioselective asymmetric autocatalysts in the
isopropylation of the respective aldehydes such as pyrimidine-5-carbaldehyde. An
initial amount of 0.6% of chiral 2-alkynylpyrimidyl alkanol as a result of
consecutive asymmetric autocatalysis multiplies to the product with up to >99.5%
ee.[102]
Figure 7.1: The increase in the amounts of S and R pyrimidyl alcohol in consecutive asymmetric
autocatalysis.[102]
Approaches so far used to study the reaction mechanism include computational,
kinetic, NMR and calorimetric methods. Different studies propose different transition
state structures which include monomers, dimers, trimers and tetramers in solution.
The transition state structure remains unclear.[34, 45, 46, 49, 103]
This section aims to
Initial conditionsCa. 0.00005% ee
Run 3> 99.5% ee
Run 299% ee
Run 157% ee
Multiplication factor
SR
N
N
O
H N
N
N
N
+ i-Pr2Zn i-Pr
H
OZn(i-Pr)
i-Pr
H
OH
H+
1 2 3 4
4
173
show results derived from EXAFS and XANES analysis that contribute to the
possible structural models of the active catalysts responsible for autocatalysis. The
advantage of using X-ray absorption spectroscopy is the possibility of acquiring both
electronic and structural properties.
7.2 Experimental
Zn K-edge measurements of the main reaction between dialkylzinc and different
aldehydes were carried out at ESRF and APS synchrotron light sources.
7.3 Results and discussion
The results discussed here include the reaction of dialkylzinc compounds with
pyrimidine-5-carbaldehyde, benzaldehyde and cinnamaldehyde in presence of
DMAE and 2-butanol. The studies described here are therefore a logical continuation
of the work presented in chapter 6, which examined the interaction of the ligand and
dialkylzinc compounds.
7.3.1 i-Pr2Zn and benzaldehyde
In the first instance the reaction of 0.1 M i-Pr2Zn with benzaldehyde (BA) is
presented. The molar ratios were varied and changes were observed in the XANES.
i-Pr2Zn perfectly works in the Soai autocatalytic reaction but chiral amplification up
to 99% ee achieved with benzaldehyde. Figure 7.2 illustrates the Zn K-edge XANES
of the i-Pr2Zn/benzaldehyde system. The stong white line resulting from a 1s-4p
transition of i-Pr2Zn in toluene decreases on addition of benzaldehyde indicating a
change in the local Zn environment. The two peaks in the XANES region are found
between 9650 and 9670 eV. Increasing the amount of benzaldehyde from a 1:1 ratio
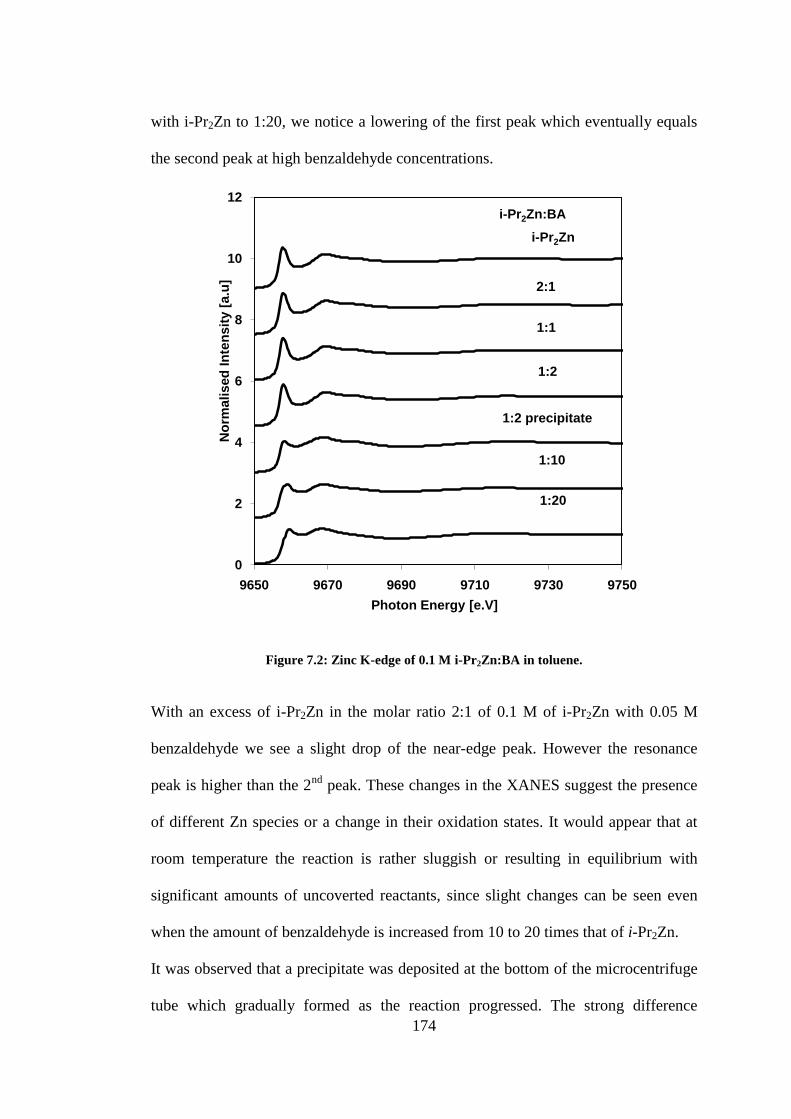
174
with i-Pr2Zn to 1:20, we notice a lowering of the first peak which eventually equals
the second peak at high benzaldehyde concentrations.
Figure 7.2: Zinc K-edge of 0.1 M i-Pr2Zn:BA in toluene.
With an excess of i-Pr2Zn in the molar ratio 2:1 of 0.1 M of i-Pr2Zn with 0.05 M
benzaldehyde we see a slight drop of the near-edge peak. However the resonance
peak is higher than the 2nd
peak. These changes in the XANES suggest the presence
of different Zn species or a change in their oxidation states. It would appear that at
room temperature the reaction is rather sluggish or resulting in equilibrium with
significant amounts of uncoverted reactants, since slight changes can be seen even
when the amount of benzaldehyde is increased from 10 to 20 times that of i-Pr2Zn.
It was observed that a precipitate was deposited at the bottom of the microcentrifuge
tube which gradually formed as the reaction progressed. The strong difference
0
2
4
6
8
10
12
9650 9670 9690 9710 9730 9750
No
rmalised
In
ten
sit
y [
a.u
]
Photon Energy [e.V]
i-Pr2Zn:BA
1:20
1:10
1:2 precipitate
1:2
1:1
2:1
i-Pr2Zn

175
between the near-edge resonance intensity in the XANES of the precipitate (1:2
precipitate) at the bottom of the tube as compared to the supernatant solution (Figure
7.2) suggests that the solution may contain significant unreacted i-Pr2Zn. This
suggestion is supported by the fact that the XANES of the 1:2 precipitate is similar to
that of the species present in solution at a benzaldehyde excess of 1:20, which would
be compatible with the above mentioned equilibrium shifted to products by addition
of reactant excess, and formation of a product with low solubility.
7.3.2 i-Pr2Zn and pyrimidine-5-aldehyde
The XANES spectra of iPr2Zn and pyrimidine-5-carbaldehyde, PA shown below
follow a similar trend to the reaction with benzaldehyde.
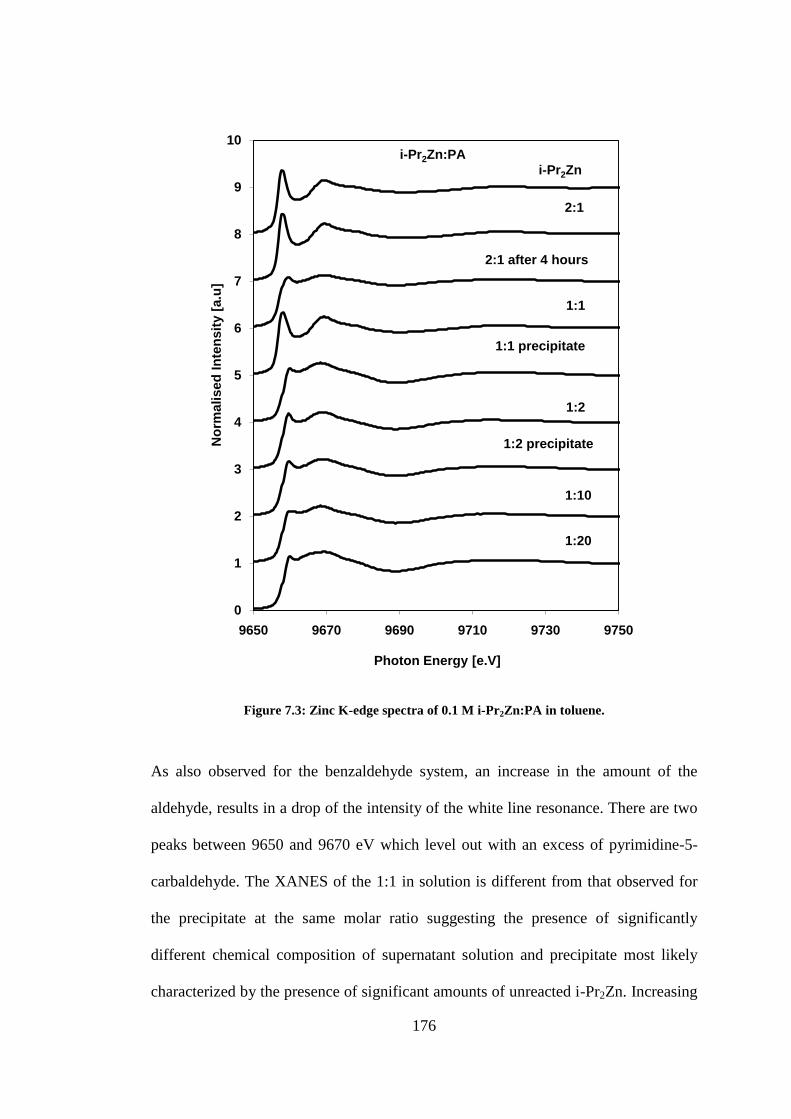
176
Figure 7.3: Zinc K-edge spectra of 0.1 M i-Pr2Zn:PA in toluene.
As also observed for the benzaldehyde system, an increase in the amount of the
aldehyde, results in a drop of the intensity of the white line resonance. There are two
peaks between 9650 and 9670 eV which level out with an excess of pyrimidine-5-
carbaldehyde. The XANES of the 1:1 in solution is different from that observed for
the precipitate at the same molar ratio suggesting the presence of significantly
different chemical composition of supernatant solution and precipitate most likely
characterized by the presence of significant amounts of unreacted i-Pr2Zn. Increasing
0
1
2
3
4
5
6
7
8
9
10
9650 9670 9690 9710 9730 9750
No
rmali
sed
In
ten
sit
y [
a.u
]
Photon Energy [e.V]
i-Pr2Zn:PA
1:20
1:10
1:2 precipitate
1:2
1:1 precipitate
1:1
2:1 after 4 hours
2:1
i-Pr2Zn
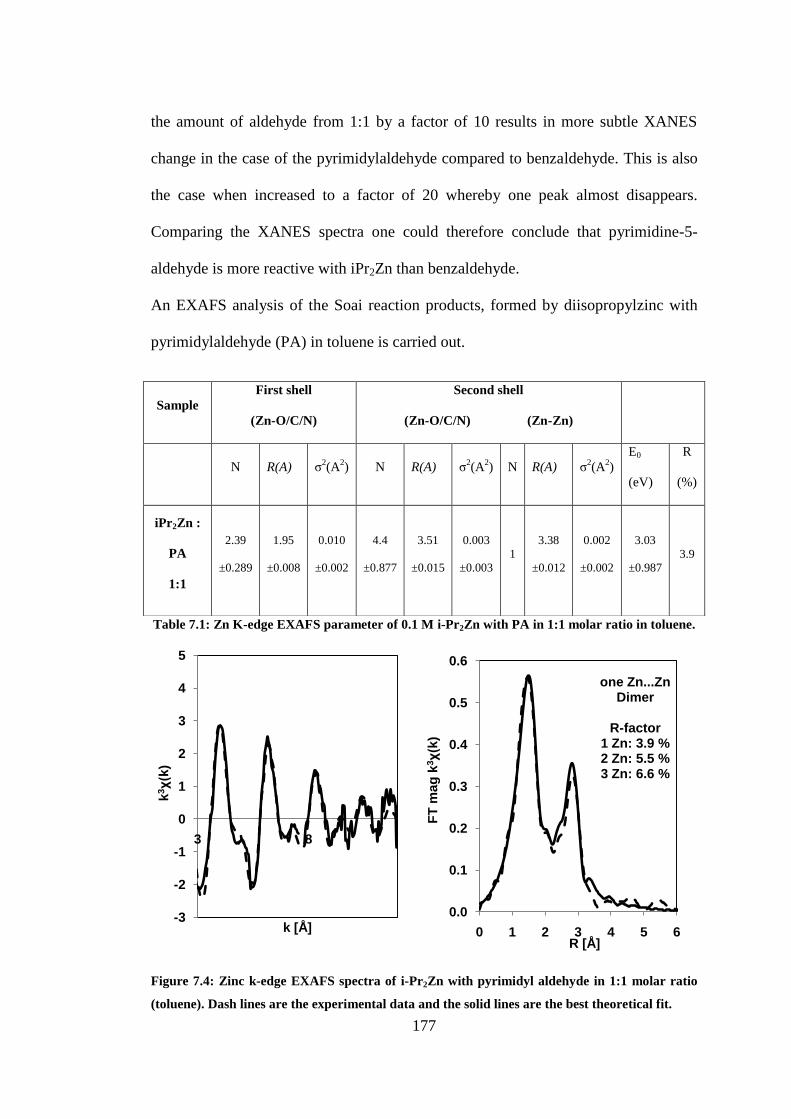
177
the amount of aldehyde from 1:1 by a factor of 10 results in more subtle XANES
change in the case of the pyrimidylaldehyde compared to benzaldehyde. This is also
the case when increased to a factor of 20 whereby one peak almost disappears.
Comparing the XANES spectra one could therefore conclude that pyrimidine-5-
aldehyde is more reactive with iPr2Zn than benzaldehyde.
An EXAFS analysis of the Soai reaction products, formed by diisopropylzinc with
pyrimidylaldehyde (PA) in toluene is carried out.
Table 7.1: Zn K-edge EXAFS parameter of 0.1 M i-Pr2Zn with PA in 1:1 molar ratio in toluene.
Figure 7.4: Zinc k-edge EXAFS spectra of i-Pr2Zn with pyrimidyl aldehyde in 1:1 molar ratio
(toluene). Dash lines are the experimental data and the solid lines are the best theoretical fit.
-3
-2
-1
0
1
2
3
4
5
3 8
k3χ(k
)
k [Å] 0.0
0.1
0.2
0.3
0.4
0.5
0.6
0 1 2 3 4 5 6
FT
mag
k3χ(k
)
R [Å]
one Zn...ZnDimer
R-factor1 Zn: 3.9 %2 Zn: 5.5 %3 Zn: 6.6 %
Sample
First shell
(Zn-O/C/N)
Second shell
(Zn-O/C/N) (Zn-Zn)
N R(A) σ2(A
2) N R(A) σ
2(A
2) N R(A) σ
2(A
2)
E0
(eV)
R
(%)
iPr2Zn :
PA
1:1
2.39
±0.289
1.95
±0.008
0.010
±0.002
4.4
±0.877
3.51
±0.015
0.003
±0.003
1
3.38
±0.012
0.002
±0.002
3.03
±0.987
3.9

178
A fit of the EXAFS obtained for the 1:1 molar ratio in toluene (Table 7.1, Figure 7.4)
suggests that in a 1:1 solution of i-Pr2Zn and pyrimidyl aldehyde a dimer exists
which is so far typical for Zn-O moieties. This dimer structural model is derived
from an EXAFS fit with R-factor of 3.9 % in the dimer compared to 5.5 % and 6.6 %
in the trimer and tetramer respectively. Based on the EXAFS calculations around the
central Zn atom in the 1st shell, there are about 3 atoms: possibly 2 oxygen and 1
carbon atom distant approximately 1.95 Å from zinc. The bulky pyrimidyl group on
oxygen probably prevents the formation of higher aggregates. One Zn neighbouring
atom is also found with a distance 3.34 Å from the zinc central atom. The square
core of the dimer is a Zn-O-Zn-O around which an isopropyl group is attached to
zinc and the pyrimidyl group is attached to the oxygen. The 1:1 molar ratio of the
precipitate formed at the bottom of the 1:1 solution of i-Pr2Zn and pyrimidyl
aldehyde (PA) was also investigated as tabulated below.
Table 7.2: Zinc K edge EXAFS parameters of i-Pr2Zn with pyrimidyl aldehyde in 1:1 molar
ratio (precipitate). Some results are rather unusual due to nonhomogeneity of sample in
solution, thus the high R-factor.
Sample
First shell
(Zn-O/C/N)
Second shell
(Zn-O/C/N) (Zn-Zn)
N R(A) σ2(A
2) N R(A) σ
2(A
2) N R(A) σ
2(A
2)
E0
(eV)
R
(%)
iPr2Zn:
PA
1:1
precipitate
3.68
±0.901
1.96
±0.017
0.007
±0.002
86
±2854
3.85
±0.969
0.132
±1.006
1
3.49
±0.069
0.012
±0.008
-0.16
±0.322
16.4
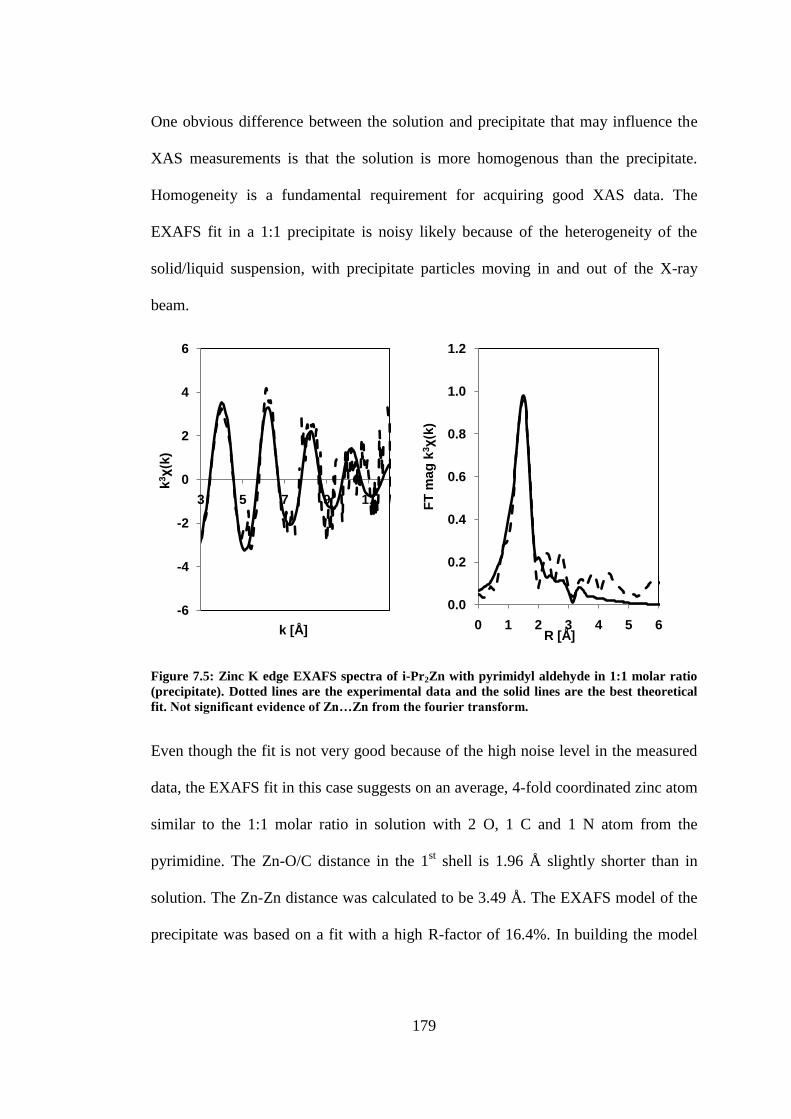
179
One obvious difference between the solution and precipitate that may influence the
XAS measurements is that the solution is more homogenous than the precipitate.
Homogeneity is a fundamental requirement for acquiring good XAS data. The
EXAFS fit in a 1:1 precipitate is noisy likely because of the heterogeneity of the
solid/liquid suspension, with precipitate particles moving in and out of the X-ray
beam.
Figure 7.5: Zinc K edge EXAFS spectra of i-Pr2Zn with pyrimidyl aldehyde in 1:1 molar ratio
(precipitate). Dotted lines are the experimental data and the solid lines are the best theoretical
fit. Not significant evidence of Zn…Zn from the fourier transform.
Even though the fit is not very good because of the high noise level in the measured
data, the EXAFS fit in this case suggests on an average, 4-fold coordinated zinc atom
similar to the 1:1 molar ratio in solution with 2 O, 1 C and 1 N atom from the
pyrimidine. The Zn-O/C distance in the 1st shell is 1.96 Å slightly shorter than in
solution. The Zn-Zn distance was calculated to be 3.49 Å. The EXAFS model of the
precipitate was based on a fit with a high R-factor of 16.4%. In building the model
-6
-4
-2
0
2
4
6
3 5 7 9 11
k3χ(k
)
k [Å]
0.0
0.2
0.4
0.6
0.8
1.0
1.2
0 1 2 3 4 5 6
FT
mag
k3χ(k
)
R [Å]

180
only the 1st shell is considered similar to all cases in this study. The derived model
therefore reveals an alkoxide dimer with a Zn-O-Zn-O plane at the centre.
Figure 7.6: EXAFS model of i-Pr2Zn with pyrimidyl aldehyde in 1:1 molar ratio. Model of
dimer alkoxide in solution. The oxygen attaches opposite the both Ns’ in the pyrimidyl ring.
Further EXAFS measurements were carried out for the 2:1 molar ratio of i-Pr2Zn and
PA. In this case an excess of i-Pr2Zn molecules was present in solution suggesting
that most of the PA molecules would be reacted. i-Pr2Zn molecules have a linear
coordination (5.3.1). We have previously seen that with a 1:1 molar ratio of i-Pr2Zn
and PA a dimer complex is formed which posseses a trigonal zinc coordination. One
would therefore logically expect a combination of both linear and trigonal
coordinated Zn centres in the first instance. From the EXAFS calculations three C/O
atoms are around the zinc centre in the 1st shell. The Zn-C/O and Zn-Zn bond
distances are 1.97 and 3.06 Å respectively. This fit with an R-factor of 12.9%
therefore complies with the prediction of having excess i-Pr2Zn molecules in
solution. EXAFS is a bulk technique and in this case two significant zinc species are
Zn
Zn
OON
N
R R= R
3.3 Å
1.9 Å
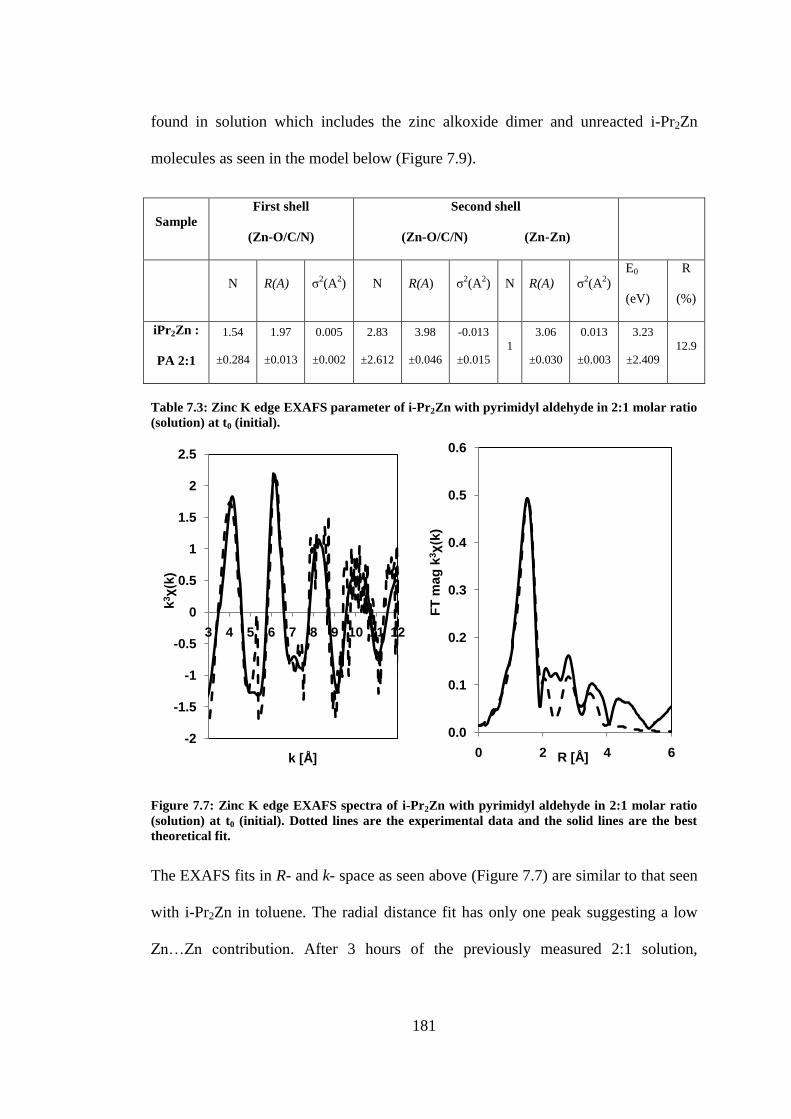
181
found in solution which includes the zinc alkoxide dimer and unreacted i-Pr2Zn
molecules as seen in the model below (Figure 7.9).
Table 7.3: Zinc K edge EXAFS parameter of i-Pr2Zn with pyrimidyl aldehyde in 2:1 molar ratio
(solution) at t0 (initial).
Figure 7.7: Zinc K edge EXAFS spectra of i-Pr2Zn with pyrimidyl aldehyde in 2:1 molar ratio
(solution) at t0 (initial). Dotted lines are the experimental data and the solid lines are the best
theoretical fit.
The EXAFS fits in R- and k- space as seen above (Figure 7.7) are similar to that seen
with i-Pr2Zn in toluene. The radial distance fit has only one peak suggesting a low
Zn…Zn contribution. After 3 hours of the previously measured 2:1 solution,
-2
-1.5
-1
-0.5
0
0.5
1
1.5
2
2.5
3 4 5 6 7 8 9 10 11 12
k3χ(k
)
k [Å]
0.0
0.1
0.2
0.3
0.4
0.5
0.6
0 2 4 6
FT
mag
k3χ(k
)
R [Å]
Sample
First shell
(Zn-O/C/N)
Second shell
(Zn-O/C/N) (Zn-Zn)
N R(A) σ2(A
2) N R(A) σ
2(A
2) N R(A) σ
2(A
2)
E0
(eV)
R
(%)
iPr2Zn :
PA 2:1
1.54
±0.284
1.97
±0.013
0.005
±0.002
2.83
±2.612
3.98
±0.046
-0.013
±0.015
1
3.06
±0.030
0.013
±0.003
3.23
±2.409
12.9
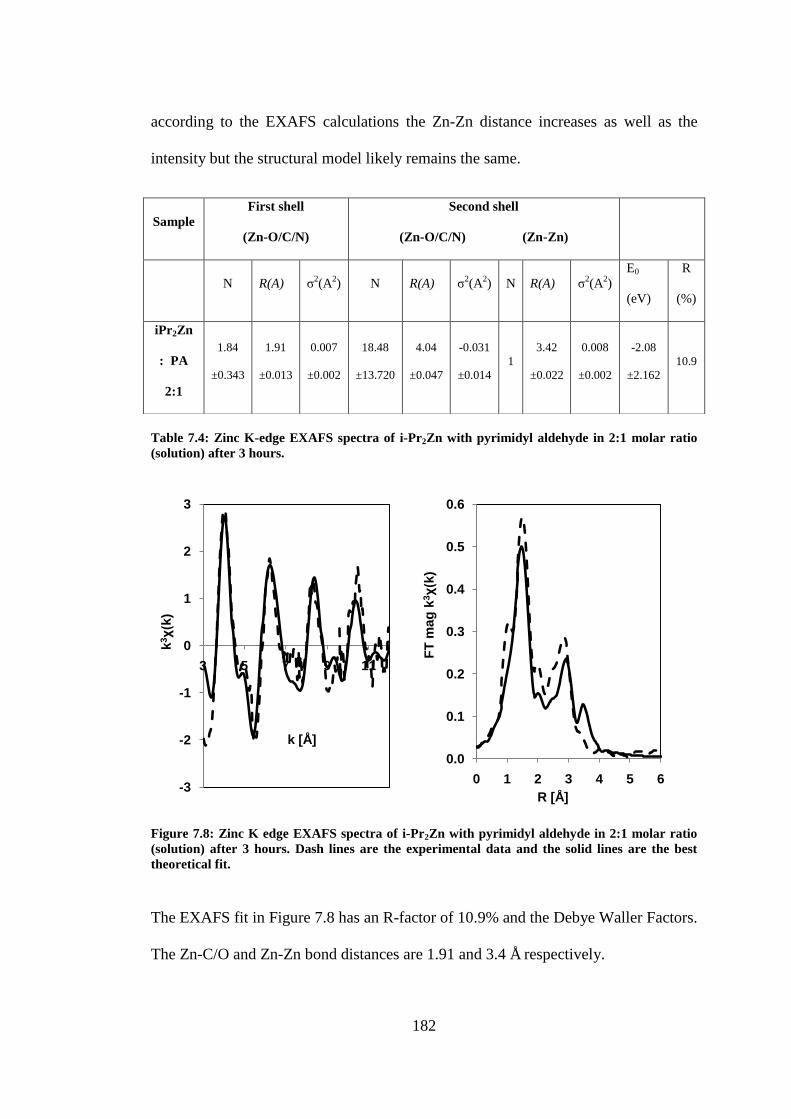
182
according to the EXAFS calculations the Zn-Zn distance increases as well as the
intensity but the structural model likely remains the same.
Table 7.4: Zinc K-edge EXAFS spectra of i-Pr2Zn with pyrimidyl aldehyde in 2:1 molar ratio
(solution) after 3 hours.
Figure 7.8: Zinc K edge EXAFS spectra of i-Pr2Zn with pyrimidyl aldehyde in 2:1 molar ratio
(solution) after 3 hours. Dash lines are the experimental data and the solid lines are the best
theoretical fit.
The EXAFS fit in Figure 7.8 has an R-factor of 10.9% and the Debye Waller Factors.
The Zn-C/O and Zn-Zn bond distances are 1.91 and 3.4 Å respectively.
-3
-2
-1
0
1
2
3
3 5 7 9 11
k3χ(k
)
k [Å]
0.0
0.1
0.2
0.3
0.4
0.5
0.6
0 1 2 3 4 5 6
FT
mag
k3χ(k
)
R [Å]
Sample
First shell
(Zn-O/C/N)
Second shell
(Zn-O/C/N) (Zn-Zn)
N R(A) σ2(A
2) N R(A) σ
2(A
2) N R(A) σ
2(A
2)
E0
(eV)
R
(%)
iPr2Zn
: PA
2:1
1.84
±0.343
1.91
±0.013
0.007
±0.002
18.48
±13.720
4.04
±0.047
-0.031
±0.014
1
3.42
±0.022
0.008
±0.002
-2.08
±2.162
10.9
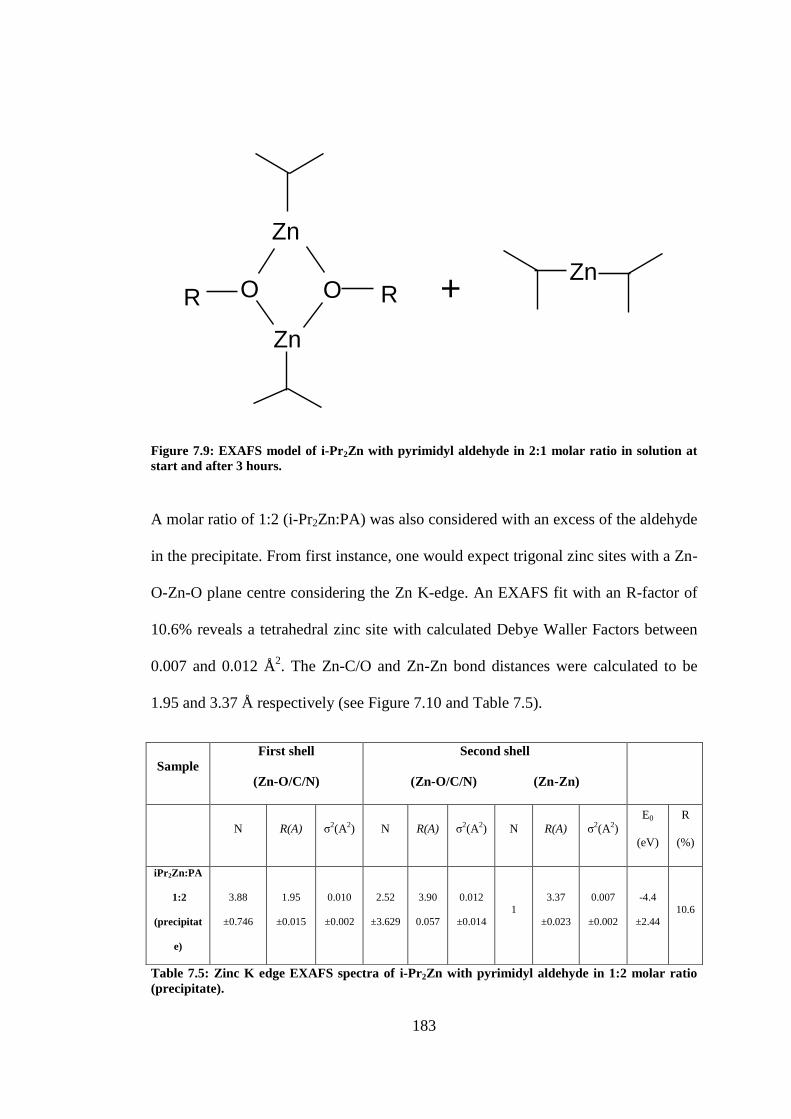
183
Figure 7.9: EXAFS model of i-Pr2Zn with pyrimidyl aldehyde in 2:1 molar ratio in solution at
start and after 3 hours.
A molar ratio of 1:2 (i-Pr2Zn:PA) was also considered with an excess of the aldehyde
in the precipitate. From first instance, one would expect trigonal zinc sites with a Zn-
O-Zn-O plane centre considering the Zn K-edge. An EXAFS fit with an R-factor of
10.6% reveals a tetrahedral zinc site with calculated Debye Waller Factors between
0.007 and 0.012 Å2. The Zn-C/O and Zn-Zn bond distances were calculated to be
1.95 and 3.37 Å respectively (see Figure 7.10 and Table 7.5).
Table 7.5: Zinc K edge EXAFS spectra of i-Pr2Zn with pyrimidyl aldehyde in 1:2 molar ratio
(precipitate).
Sample
First shell
(Zn-O/C/N)
Second shell
(Zn-O/C/N) (Zn-Zn)
N R(A) σ2(A2) N R(A) σ2(A2) N R(A) σ2(A2)
E0
(eV)
R
(%)
iPr2Zn:PA
1:2
(precipitat
e)
3.88
±0.746
1.95
±0.015
0.010
±0.002
2.52
±3.629
3.90
0.057
0.012
±0.014 1
3.37
±0.023
0.007
±0.002
-4.4
±2.44 10.6
Zn
Zn
OOZn
R R +
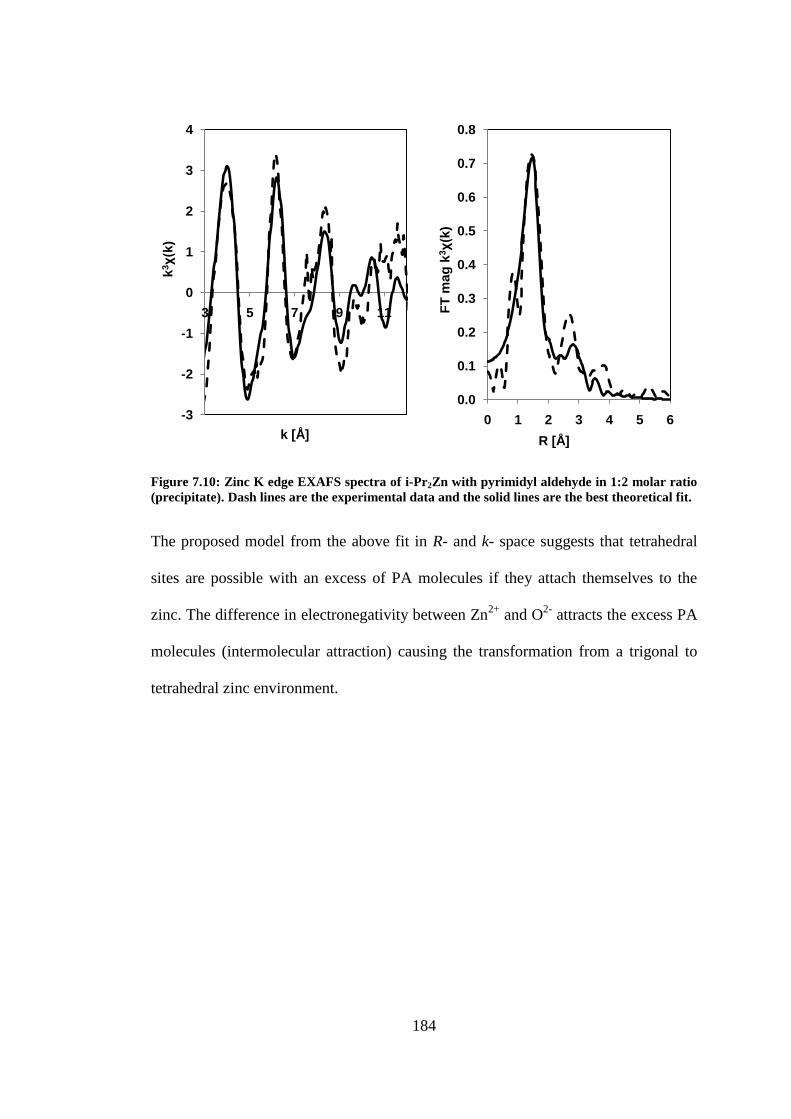
184
Figure 7.10: Zinc K edge EXAFS spectra of i-Pr2Zn with pyrimidyl aldehyde in 1:2 molar ratio
(precipitate). Dash lines are the experimental data and the solid lines are the best theoretical fit.
The proposed model from the above fit in R- and k- space suggests that tetrahedral
sites are possible with an excess of PA molecules if they attach themselves to the
zinc. The difference in electronegativity between Zn2+
and O2-
attracts the excess PA
molecules (intermolecular attraction) causing the transformation from a trigonal to
tetrahedral zinc environment.
-3
-2
-1
0
1
2
3
4
3 5 7 9 11
k3χ(k
)
k [Å]
0.0
0.1
0.2
0.3
0.4
0.5
0.6
0.7
0.8
0 1 2 3 4 5 6
FT
mag
k3χ(k
) R [Å]
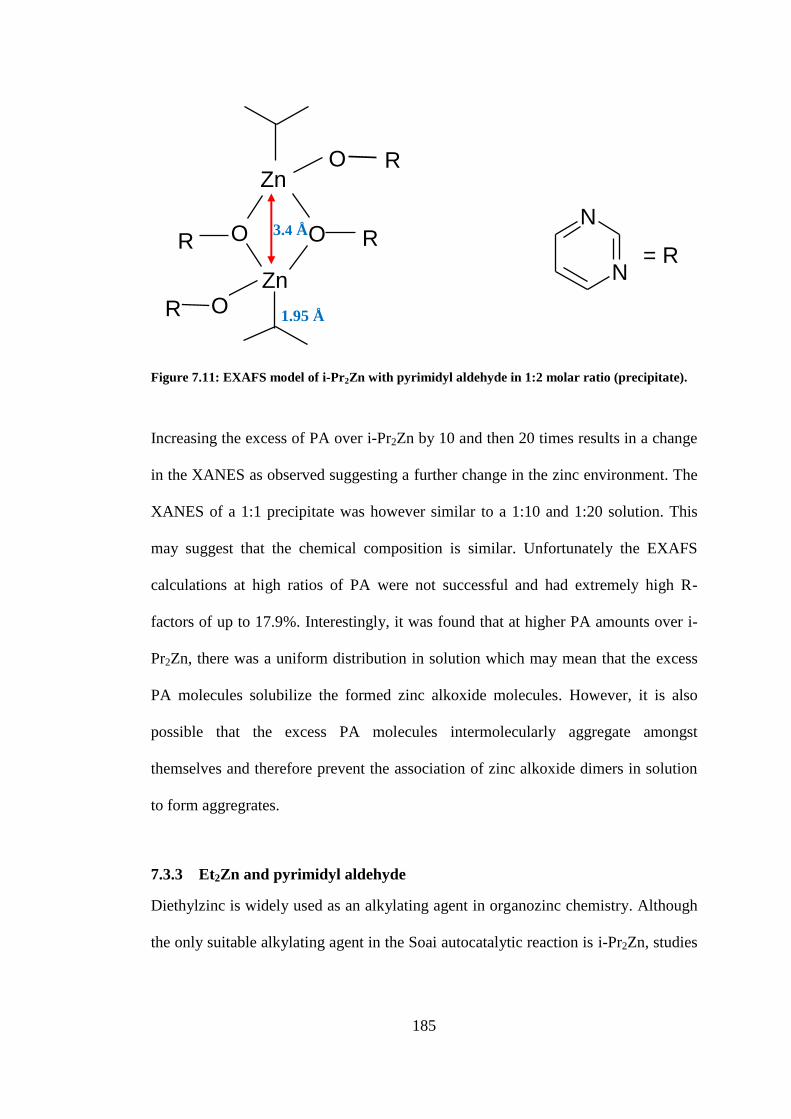
185
Figure 7.11: EXAFS model of i-Pr2Zn with pyrimidyl aldehyde in 1:2 molar ratio (precipitate).
Increasing the excess of PA over i-Pr2Zn by 10 and then 20 times results in a change
in the XANES as observed suggesting a further change in the zinc environment. The
XANES of a 1:1 precipitate was however similar to a 1:10 and 1:20 solution. This
may suggest that the chemical composition is similar. Unfortunately the EXAFS
calculations at high ratios of PA were not successful and had extremely high R-
factors of up to 17.9%. Interestingly, it was found that at higher PA amounts over i-
Pr2Zn, there was a uniform distribution in solution which may mean that the excess
PA molecules solubilize the formed zinc alkoxide molecules. However, it is also
possible that the excess PA molecules intermolecularly aggregate amongst
themselves and therefore prevent the association of zinc alkoxide dimers in solution
to form aggregrates.
7.3.3 Et2Zn and pyrimidyl aldehyde
Diethylzinc is widely used as an alkylating agent in organozinc chemistry. Although
the only suitable alkylating agent in the Soai autocatalytic reaction is i-Pr2Zn, studies
Zn
Zn
OON
N
R R
O
O R
R
= R
3.4 Å
1.95 Å

186
on DEZ would be beneficial because it is similar to i-Pr2Zn in its functioning and
size.
Figure 7.12: Zinc K-edge XANES spectra of 0.1 M DEZ:PA in toluene.
The XANES spectra of the reaction of DEZ and PA illustrated above were measured
under different stoichiometric conditions. The trend of the XANES spectra of DEZ is
similar to i-Pr2Zn. In toluene a DEZ molecule has a linear zinc arrangement with a
large white line resonance peak (see 5.3.2). In the case of the reaction of PA and
DEZ the resonance peak drops implying a change in the zinc environment from the
0
1
2
3
4
5
6
7
8
9
9650 9660 9670 9680 9690 9700 9710
No
rma
lis
ed
In
ten
sit
y [
a.u
]
Photon Energy [e.V]
2:1 after 9 hours
1:20
1:1
1:1 after 9 hours
1:2
2:1
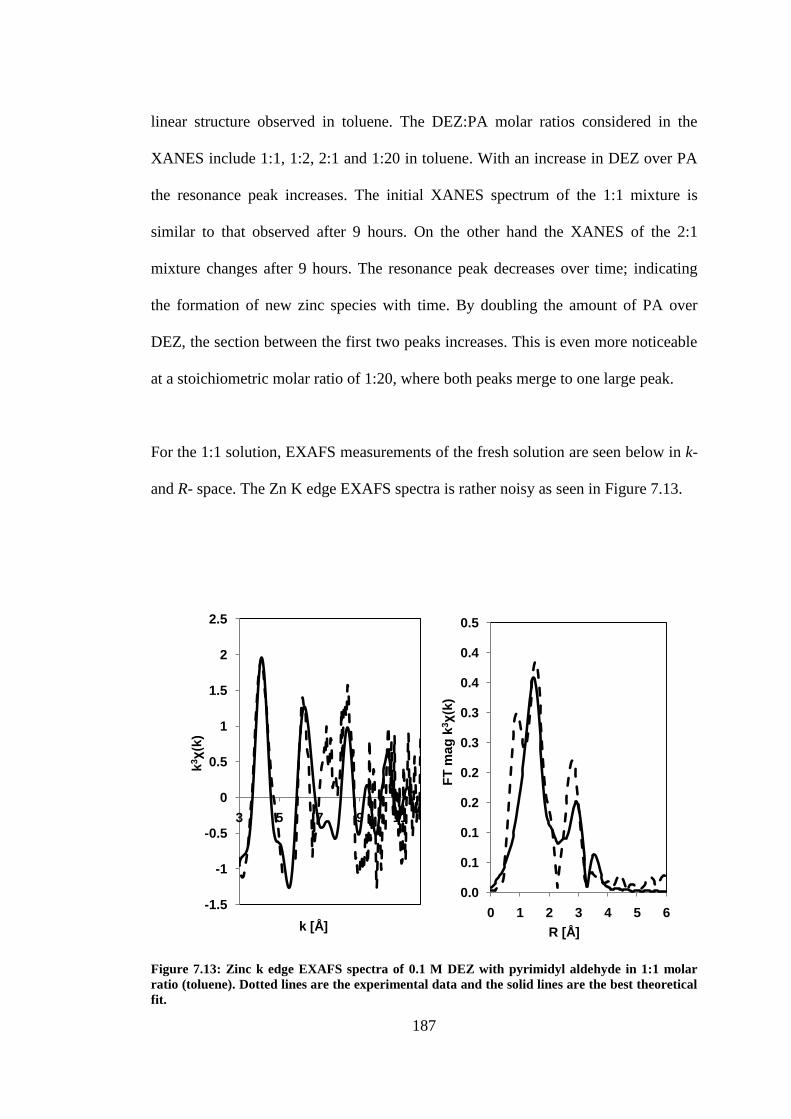
187
linear structure observed in toluene. The DEZ:PA molar ratios considered in the
XANES include 1:1, 1:2, 2:1 and 1:20 in toluene. With an increase in DEZ over PA
the resonance peak increases. The initial XANES spectrum of the 1:1 mixture is
similar to that observed after 9 hours. On the other hand the XANES of the 2:1
mixture changes after 9 hours. The resonance peak decreases over time; indicating
the formation of new zinc species with time. By doubling the amount of PA over
DEZ, the section between the first two peaks increases. This is even more noticeable
at a stoichiometric molar ratio of 1:20, where both peaks merge to one large peak.
For the 1:1 solution, EXAFS measurements of the fresh solution are seen below in k-
and R- space. The Zn K edge EXAFS spectra is rather noisy as seen in Figure 7.13.
Figure 7.13: Zinc k edge EXAFS spectra of 0.1 M DEZ with pyrimidyl aldehyde in 1:1 molar
ratio (toluene). Dotted lines are the experimental data and the solid lines are the best theoretical
fit.
-1.5
-1
-0.5
0
0.5
1
1.5
2
2.5
3 5 7 9 11
k3χ(k
)
k [Å]
0.0
0.1
0.1
0.2
0.2
0.3
0.3
0.4
0.4
0.5
0 1 2 3 4 5 6
FT
ma
g k
3χ(k
)
R [Å]

188
Table 7.6: Zinc K edge EXAFS spectra of DEZ with pyrimidyl aldehyde in 1:1 molar ratio
(toluene).
The noisy XAS data resulted in an R-factor of the EXAFS fit of 21.8%. The Debye-
Waller factors were between 0.002 and 0.015 Å2. The proposed model has upto
about 3 neighbouring atoms to the zinc centre atom i.e. C or O and a zinc atom. The
Zn-O-Zn-O exists and the Zn-Zn distance is 3.43 Å. The Zn-C/O bond distance in
the 1st shell is 1.93 Å. From the XANES after 9 hours the plot of the normalized
intensity versus photon energy looks the same suggesting that the zinc species are
similar or same.
Sample
First shell
(Zn-O/C/N)
Second shell
(Zn-O/C/N) (Zn-Zn)
N R(A) σ2(A
2) N R(A) σ
2(A
2) N R(A) σ
2(A
2)
E0
(eV)
R
(%)
DEZ:PA
1:1
1.78
±0.537
1.93
±0.022
0.002
±0.004
4.68
±5.177
4.04
±0.027
0.015
±0.016
1
3.43
±0.027
0.008
±0.002
0.36
±3.115
21.8

189
Figure 7.14: EXAFS model of DEZ with pyrimidyl aldehyde in 1:1 molar ratio (solution).
The EXAFS data are compatible with the presence of a mixture of linear DEZ and
1:1 trigonal species, as seen above (Figure 7.14). An EXAFS fit of a 2:1
stoichiometric ratio with an R-factor of 6.7% confirms this prediction. The DWF
calculated were between 0.005 and 0.010 Å2
and the Zn-C/O and Zn-Zn bond
distances of 1.87 Å and 3.39 Å respectively.
Zn
Zn
OOR R3.4 Å
1.93 Å
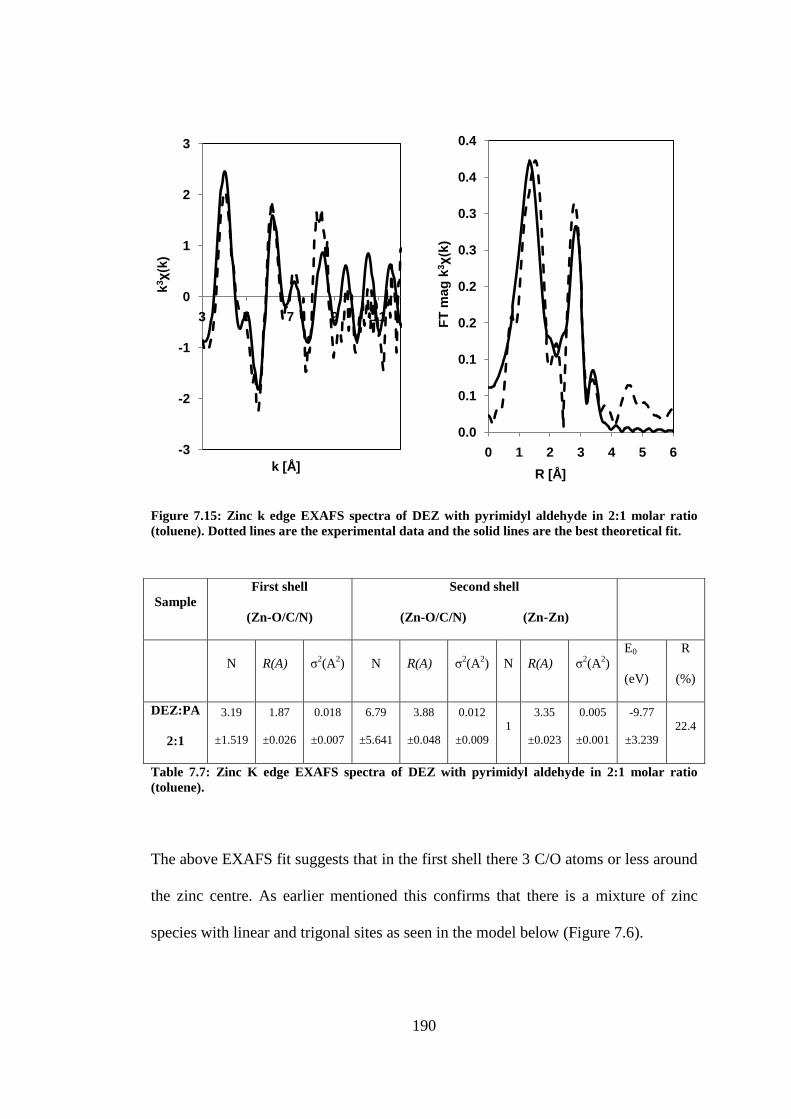
190
Figure 7.15: Zinc k edge EXAFS spectra of DEZ with pyrimidyl aldehyde in 2:1 molar ratio
(toluene). Dotted lines are the experimental data and the solid lines are the best theoretical fit.
Table 7.7: Zinc K edge EXAFS spectra of DEZ with pyrimidyl aldehyde in 2:1 molar ratio
(toluene).
The above EXAFS fit suggests that in the first shell there 3 C/O atoms or less around
the zinc centre. As earlier mentioned this confirms that there is a mixture of zinc
species with linear and trigonal sites as seen in the model below (Figure 7.6).
-3
-2
-1
0
1
2
3
3 5 7 9 11
k3χ(k
)
k [Å]
0.0
0.1
0.1
0.2
0.2
0.3
0.3
0.4
0.4
0 1 2 3 4 5 6F
T m
ag
k3χ(k
)
R [Å]
Sample
First shell
(Zn-O/C/N)
Second shell
(Zn-O/C/N) (Zn-Zn)
N R(A) σ2(A
2) N R(A) σ
2(A
2) N R(A) σ
2(A
2)
E0
(eV)
R
(%)
DEZ:PA
2:1
3.19
±1.519
1.87
±0.026
0.018
±0.007
6.79
±5.641
3.88
±0.048
0.012
±0.009
1
3.35
±0.023
0.005
±0.001
-9.77
±3.239
22.4

191
Figure 7.16: EXAFS model of DEZ with pyrimidyl aldehyde in 2:1 molar ratio (solution).
From the XANES (Figure 7.12) there is evidence of the formation of new zinc
species since there is a change with an increase in the stoichiometric amount of PA
over diethylzinc. All the diethylzinc in toluene will obviously be consumed by excess
PA. The EXAFS calculations at 1:2 and 1:20 were unfortunately extremely noisy and
not fully interpretable because increasing the amount of PA increases the amount of
solid particles in solution. With this increase in PA there is a change in the XANES
spectra implying that the excess PA molecules still interact with the formed alkoxide
dimer leading possibly to solubilisation. Another reason for the change in the
XANES may be the physical state. Increasing the amount of PA gradually moves
from a liquid solution to a solid. It may also possible that higher aggregates e.g.
Figure 7.17, may be formed especially with the possibility of intermolecular
interaction although no direct evidence is immediately available.
Zn
Zn
OOZn
R R +3.35 Å
1.87 Å
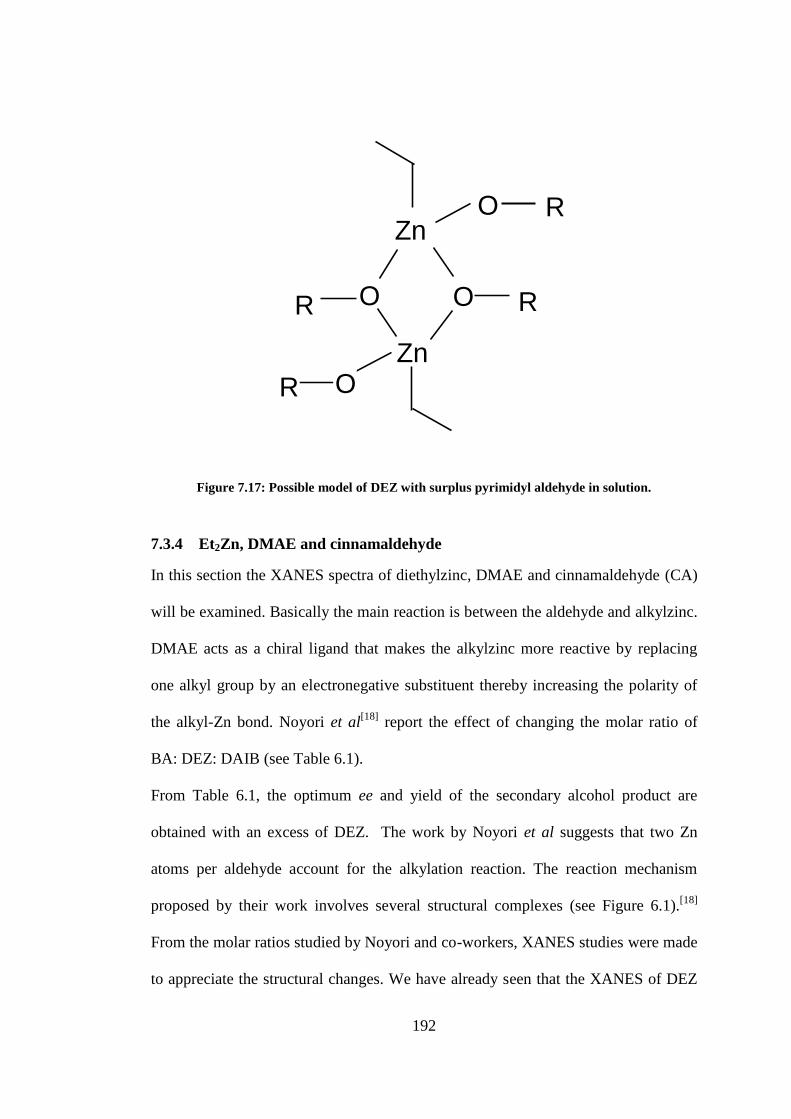
192
Figure 7.17: Possible model of DEZ with surplus pyrimidyl aldehyde in solution.
7.3.4 Et2Zn, DMAE and cinnamaldehyde
In this section the XANES spectra of diethylzinc, DMAE and cinnamaldehyde (CA)
will be examined. Basically the main reaction is between the aldehyde and alkylzinc.
DMAE acts as a chiral ligand that makes the alkylzinc more reactive by replacing
one alkyl group by an electronegative substituent thereby increasing the polarity of
the alkyl-Zn bond. Noyori et al[18]
report the effect of changing the molar ratio of
BA: DEZ: DAIB (see Table 6.1).
From Table 6.1, the optimum ee and yield of the secondary alcohol product are
obtained with an excess of DEZ. The work by Noyori et al suggests that two Zn
atoms per aldehyde account for the alkylation reaction. The reaction mechanism
proposed by their work involves several structural complexes (see Figure 6.1).[18]
From the molar ratios studied by Noyori and co-workers, XANES studies were made
to appreciate the structural changes. We have already seen that the XANES of DEZ
Zn
Zn
OOR R
O
O R
R
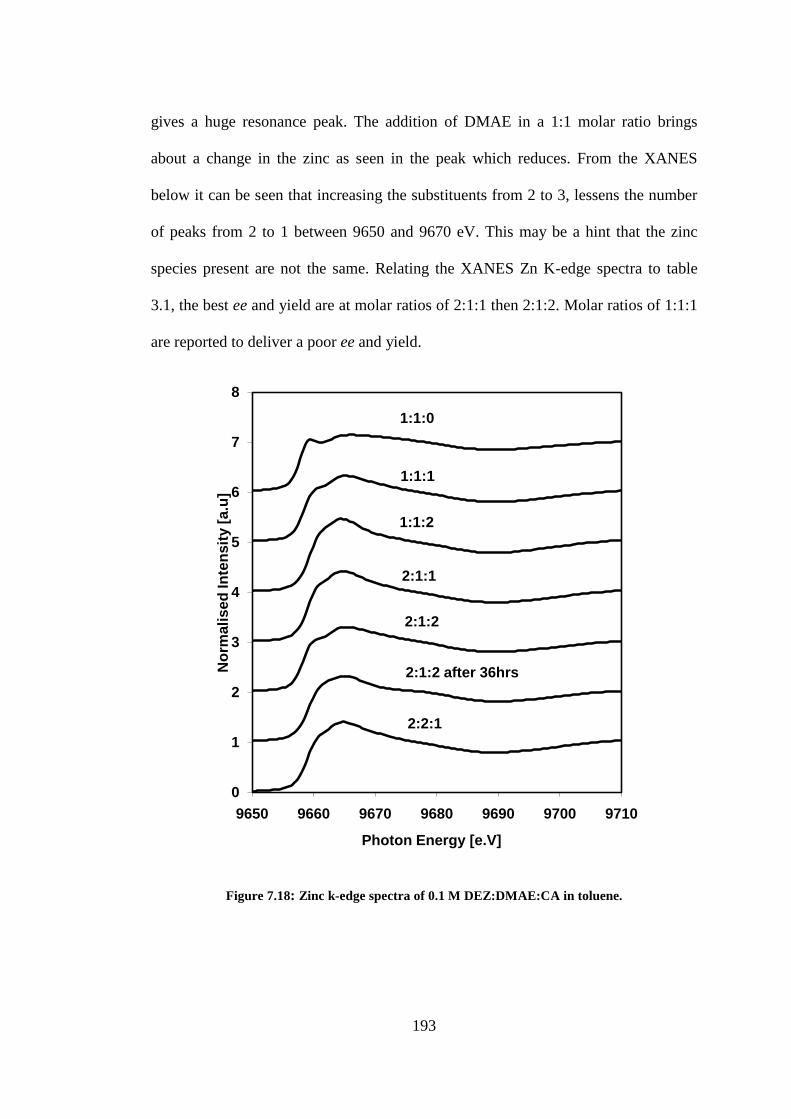
193
gives a huge resonance peak. The addition of DMAE in a 1:1 molar ratio brings
about a change in the zinc as seen in the peak which reduces. From the XANES
below it can be seen that increasing the substituents from 2 to 3, lessens the number
of peaks from 2 to 1 between 9650 and 9670 eV. This may be a hint that the zinc
species present are not the same. Relating the XANES Zn K-edge spectra to table
3.1, the best ee and yield are at molar ratios of 2:1:1 then 2:1:2. Molar ratios of 1:1:1
are reported to deliver a poor ee and yield.
Figure 7.18: Zinc k-edge spectra of 0.1 M DEZ:DMAE:CA in toluene.
0
1
2
3
4
5
6
7
8
9650 9660 9670 9680 9690 9700 9710
No
rma
lis
ed
In
ten
sit
y [
a.u
]
Photon Energy [e.V]
2:2:1
2:1:2 after 36hrs
1:1:1
1:1:2
2:1:1
2:1:2
1:1:0
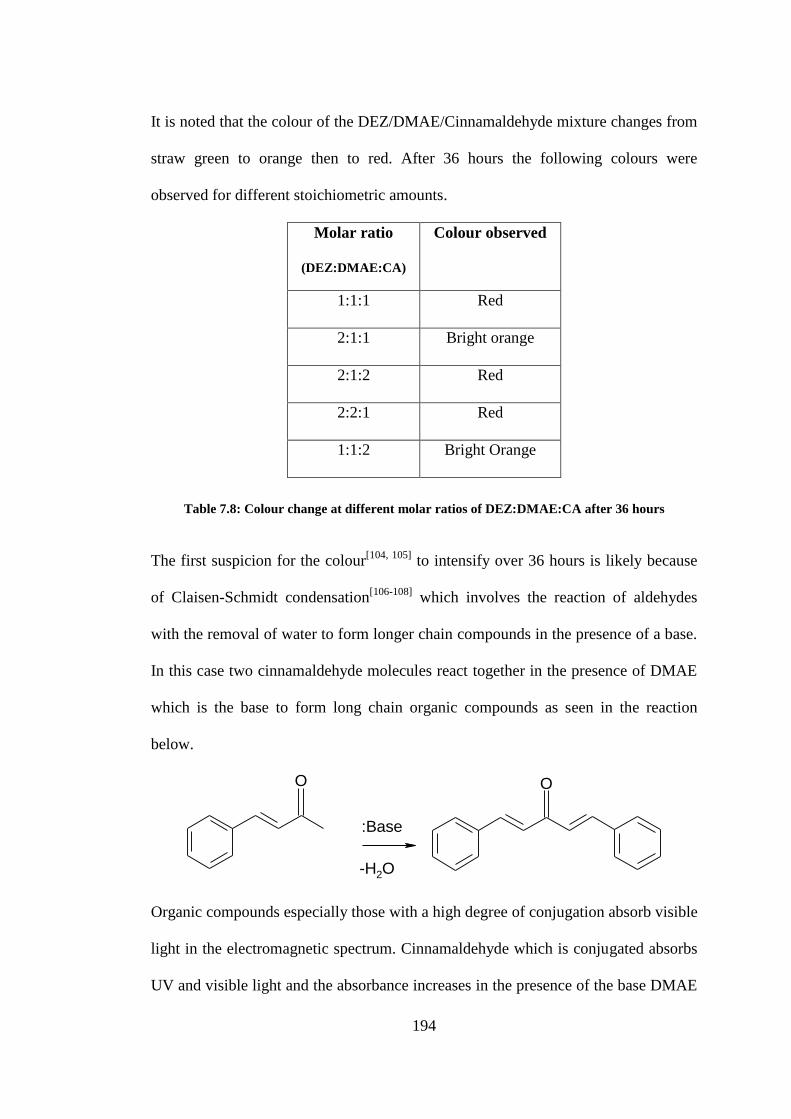
194
It is noted that the colour of the DEZ/DMAE/Cinnamaldehyde mixture changes from
straw green to orange then to red. After 36 hours the following colours were
observed for different stoichiometric amounts.
Molar ratio
(DEZ:DMAE:CA)
Colour observed
1:1:1 Red
2:1:1 Bright orange
2:1:2 Red
2:2:1 Red
1:1:2 Bright Orange
Table 7.8: Colour change at different molar ratios of DEZ:DMAE:CA after 36 hours
The first suspicion for the colour[104, 105]
to intensify over 36 hours is likely because
of Claisen-Schmidt condensation[106-108]
which involves the reaction of aldehydes
with the removal of water to form longer chain compounds in the presence of a base.
In this case two cinnamaldehyde molecules react together in the presence of DMAE
which is the base to form long chain organic compounds as seen in the reaction
below.
O O
-H2O
:Base
Organic compounds especially those with a high degree of conjugation absorb visible
light in the electromagnetic spectrum. Cinnamaldehyde which is conjugated absorbs
UV and visible light and the absorbance increases in the presence of the base DMAE
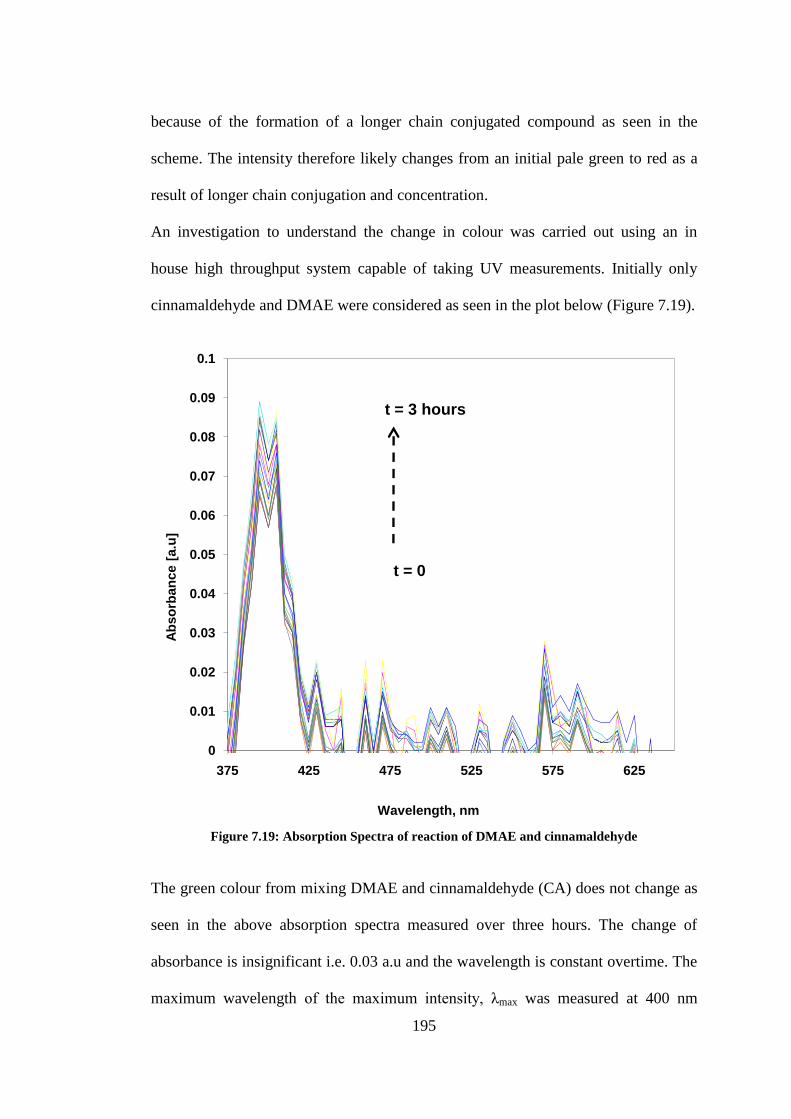
195
because of the formation of a longer chain conjugated compound as seen in the
scheme. The intensity therefore likely changes from an initial pale green to red as a
result of longer chain conjugation and concentration.
An investigation to understand the change in colour was carried out using an in
house high throughput system capable of taking UV measurements. Initially only
cinnamaldehyde and DMAE were considered as seen in the plot below (Figure 7.19).
Figure 7.19: Absorption Spectra of reaction of DMAE and cinnamaldehyde
The green colour from mixing DMAE and cinnamaldehyde (CA) does not change as
seen in the above absorption spectra measured over three hours. The change of
absorbance is insignificant i.e. 0.03 a.u and the wavelength is constant overtime. The
maximum wavelength of the maximum intensity, λmax was measured at 400 nm
0
0.01
0.02
0.03
0.04
0.05
0.06
0.07
0.08
0.09
0.1
375 425 475 525 575 625
Ab
so
rban
ce [
a.u
]
Wavelength, nm
t = 3 hours
t = 0

196
corresponding to the green colour observed. Adding DEZ to the above combination
changes the situation as seen in the absorption spectra below (Figure 7.20). An
increase in the absorbance and the wavelength is observed. From Figure 7.20, λmax
moves from 475 nm to 515 nm which corresponds to the change from green to red
observed in the reaction over time. The deduction from this change in wavelength is
the formation of new absorbing species. This may confirm the fact that a longer
conjugated compound is formed with time which causes an increase in the intensity
probably due to an increase in concentration over time.
Figure 7.20: Absorption Spectra of reaction of DMAE, cinnamaldehyde and DEZ
0
0.05
0.1
0.15
0.2
0.25
0.3
0.35
0.4
0.45
375 425 475 525 575 625
Ab
so
rban
ce [
a.u
]
Wavelength, nm
t = 3 hours
t = 0

197
From this examination there is no change in colour when DMAE and CA are mixed.
It was also observed that there was no change in colour when DEZ was mixed with
CA. These facts imply that the reaction may be zinc catalyzed. DMAE and CA
initially combine to form a complex which is green in a condensation reaction. The
presence of Zn tetrahedral sites possibly promotes the formation of monomer
complex which eventually polymerizes because of the conjugated bonds in CA
which open and link with other monomers.
An EXAFS analysis with k values considered between 3 and 12 Å-1
is presented here
with an excellent R-factor of 0.8%. The Debye Waller factors calculated are between
0.005 and 0.009 Å2.
Figure 7.21: Zinc K edge EXAFS spectra of 0.1 M DEZ:DMAE:CA (2:1:2) in toluene. Dotted
lines are the experimental data and the solid lines are the best theoretical fit.
-4
-3
-2
-1
0
1
2
3
4
5
3 8
k3χ(k
)
k [Å]
0.0
0.2
0.4
0.6
0.8
1.0
1.2
0 2 4 6
FT
mag
k3χ(k
)
R [Å]

198
Table 7.9: Zinc K edge EXAFS spectra of DEZ, DMAE and CA.
The model proposes four C/O neighbouring atoms to Zn in the 1st shell, with a Zn-C
distance approximately 1.97 Å. This EXAFS calculation therefore suggests a dimer
specie with two zinc centres separated by 3.42 Å. The dimer complex may be a
polymer or conjugated complex based on the red colour seen in the UV
measurements (Table 7.8).
7.3.5 Characterisation of dimer species formed in the Soai reaction
The results of this section were measured at the APS to confirm the nature of the
products formed during the autocatalytic Soai process. EXAFS calculations reported
in the previous sections so far disclosed the distinct possibility of a dimer alkoxide
complex with specific bond distances, but other possibilities include admixtures of
monomers, trimers, tetramers and higher oligomers.
First, the XANES spectra of four different aldehydes that were allowed to react with
iPr2Zn were considered. The aldehydes examined include: benzaldehyde, pyrimidyl
aldehydes and pyridyl aldehydes. It is worth mentioning that so far the best
performing aldehyde discovered by Soai and co-workers is 2-(tert-butylethynyl)
Sample
First shell
(Zn-O/C/N)
Second shell
(Zn-O/C/N) (Zn-Zn)
N R(A) σ2(A2) N R(A) σ2(A2) N R(A) σ2(A2)
E0
(eV)
R
(%)
Et2Zn:DMAE:
CA
2:1:2
4.0
±0.18
1.97
±0.003
0.008
±0.001
3.1
±0.69
3.47
±0.015
0.003
±0.004
1 3.32
±0.012
0.006
±0.002
-0.10
±0.545
0.8
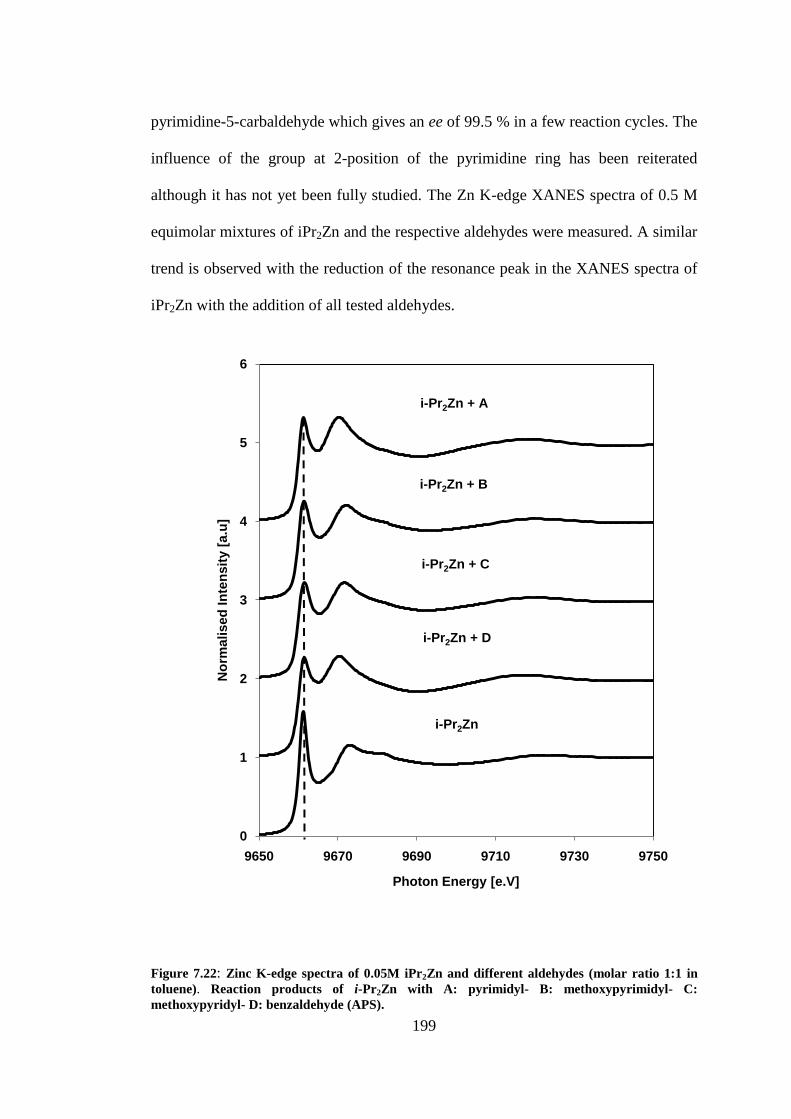
199
pyrimidine-5-carbaldehyde which gives an ee of 99.5 % in a few reaction cycles. The
influence of the group at 2-position of the pyrimidine ring has been reiterated
although it has not yet been fully studied. The Zn K-edge XANES spectra of 0.5 M
equimolar mixtures of iPr2Zn and the respective aldehydes were measured. A similar
trend is observed with the reduction of the resonance peak in the XANES spectra of
iPr2Zn with the addition of all tested aldehydes.
Figure 7.22: Zinc K-edge spectra of 0.05M iPr2Zn and different aldehydes (molar ratio 1:1 in
toluene). Reaction products of i-Pr2Zn with A: pyrimidyl- B: methoxypyrimidyl- C:
methoxypyridyl- D: benzaldehyde (APS).
0
1
2
3
4
5
6
9650 9670 9690 9710 9730 9750
No
rmalised
In
ten
sit
y [
a.u
]
Photon Energy [e.V]
i-Pr2Zn + A
i-Pr2Zn + B
i-Pr2Zn + C
i-Pr2Zn + D
i-Pr2Zn
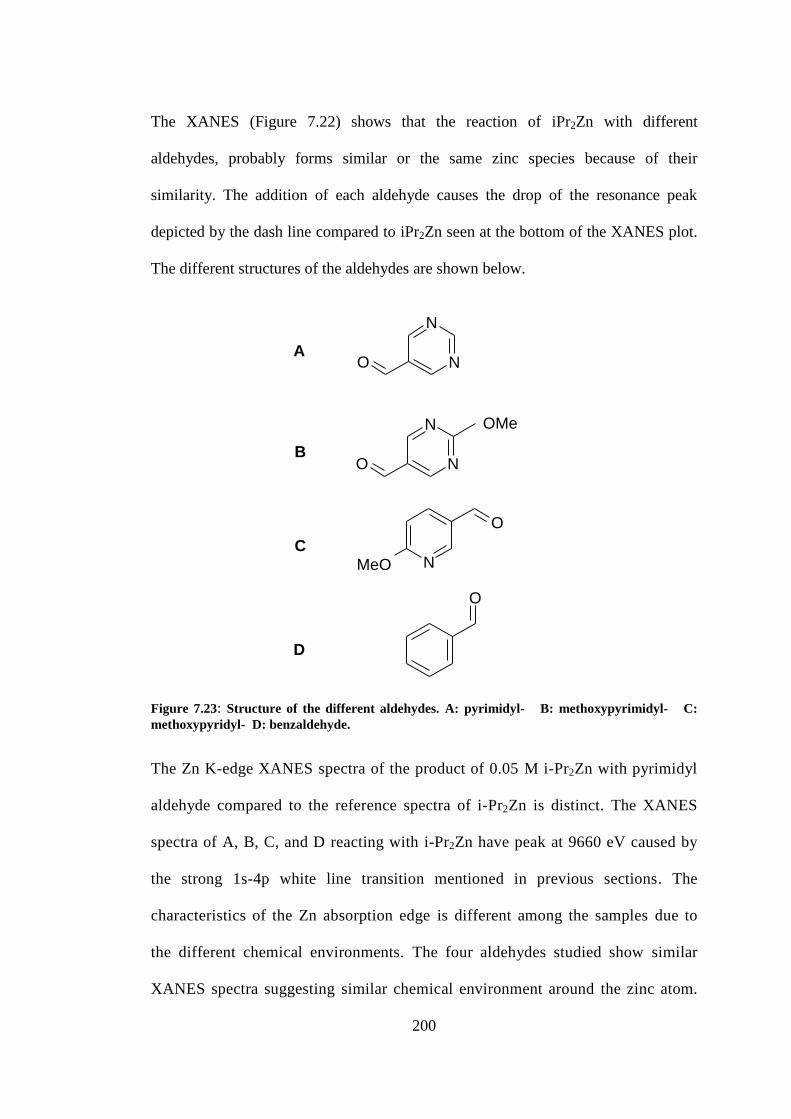
200
The XANES (Figure 7.22) shows that the reaction of iPr2Zn with different
aldehydes, probably forms similar or the same zinc species because of their
similarity. The addition of each aldehyde causes the drop of the resonance peak
depicted by the dash line compared to iPr2Zn seen at the bottom of the XANES plot.
The different structures of the aldehydes are shown below.
Figure 7.23: Structure of the different aldehydes. A: pyrimidyl- B: methoxypyrimidyl- C:
methoxypyridyl- D: benzaldehyde.
The Zn K-edge XANES spectra of the product of 0.05 M i-Pr2Zn with pyrimidyl
aldehyde compared to the reference spectra of i-Pr2Zn is distinct. The XANES
spectra of A, B, C, and D reacting with i-Pr2Zn have peak at 9660 eV caused by
the strong 1s-4p white line transition mentioned in previous sections. The
characteristics of the Zn absorption edge is different among the samples due to
the different chemical environments. The four aldehydes studied show similar
XANES spectra suggesting similar chemical environment around the zinc atom.
N
NO
N
NO
O
N
O
MeO
OMe
B
C
D
A

201
Both methoxy groups are para-substituted. Previous studies by Soai and co-
workers prove that asymmetric amplification only occurs with pyrimidyl
aldehydes. Para substitution with a methoxy group (electron withdrawing), should
improve the yield and enantiomeric excess. The first asymmetric autocatalytic
reactions were observed by Soai and co-workers when pyridyl aldehydes were
allowed to form pyridyl alcohol. They were found not to be highly
enantioselective like pyrimidylaldehydes. Benzaldehydes do not exhibit
asymmetric autocatalysis. The XANES can only inform us on the Zn2+
oxidation
state and also that the zinc coordination of the alkoxide complex formed from
each aldehyde is likely the same. The EXAFS fit in k and R- space seen below
shows that the fit of the experimental and theoretical data is reliable.
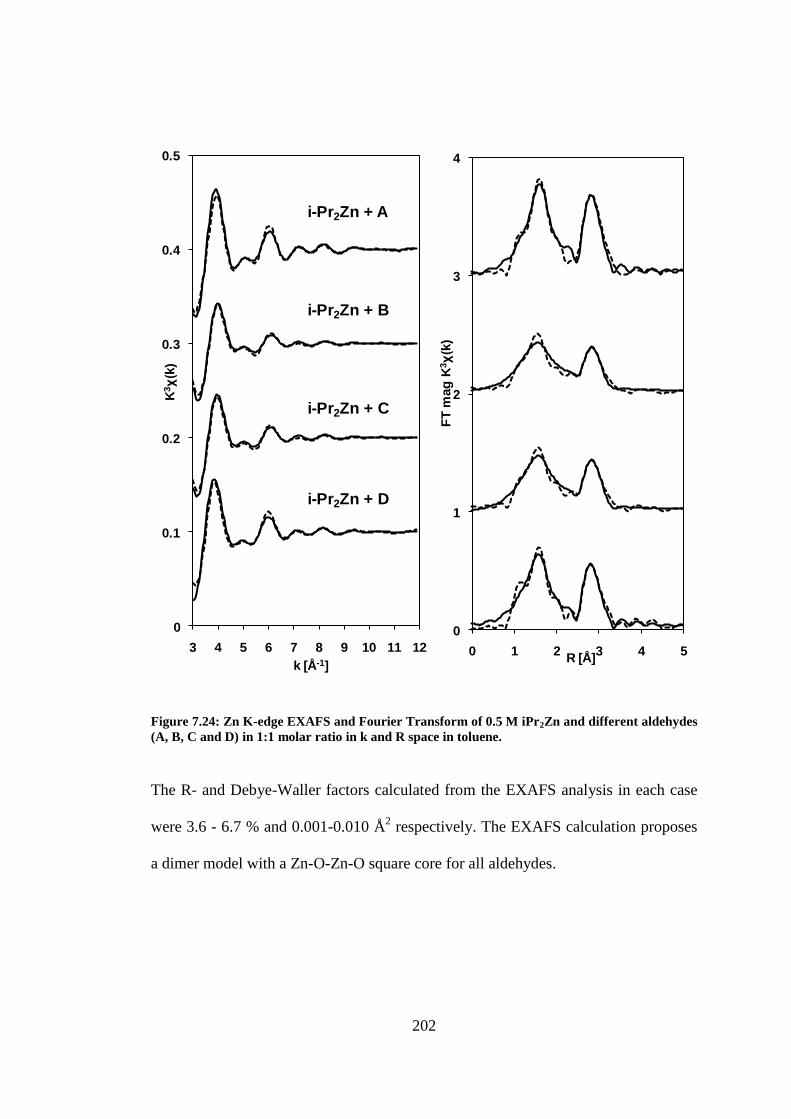
202
Figure 7.24: Zn K-edge EXAFS and Fourier Transform of 0.5 M iPr2Zn and different aldehydes
(A, B, C and D) in 1:1 molar ratio in k and R space in toluene.
The R- and Debye-Waller factors calculated from the EXAFS analysis in each case
were 3.6 - 6.7 % and 0.001-0.010 Å2 respectively. The EXAFS calculation proposes
a dimer model with a Zn-O-Zn-O square core for all aldehydes.
0
0.1
0.2
0.3
0.4
0.5
3 4 5 6 7 8 9 10 11 12
K3χ(k
)
k [Å-1]
i-Pr2Zn + B
i-Pr2Zn + C
i-Pr2Zn + D
0
1
2
3
4
0 1 2 3 4 5
FT
mag
K3χ(k
)
R [Å]
i-Pr2Zn + A
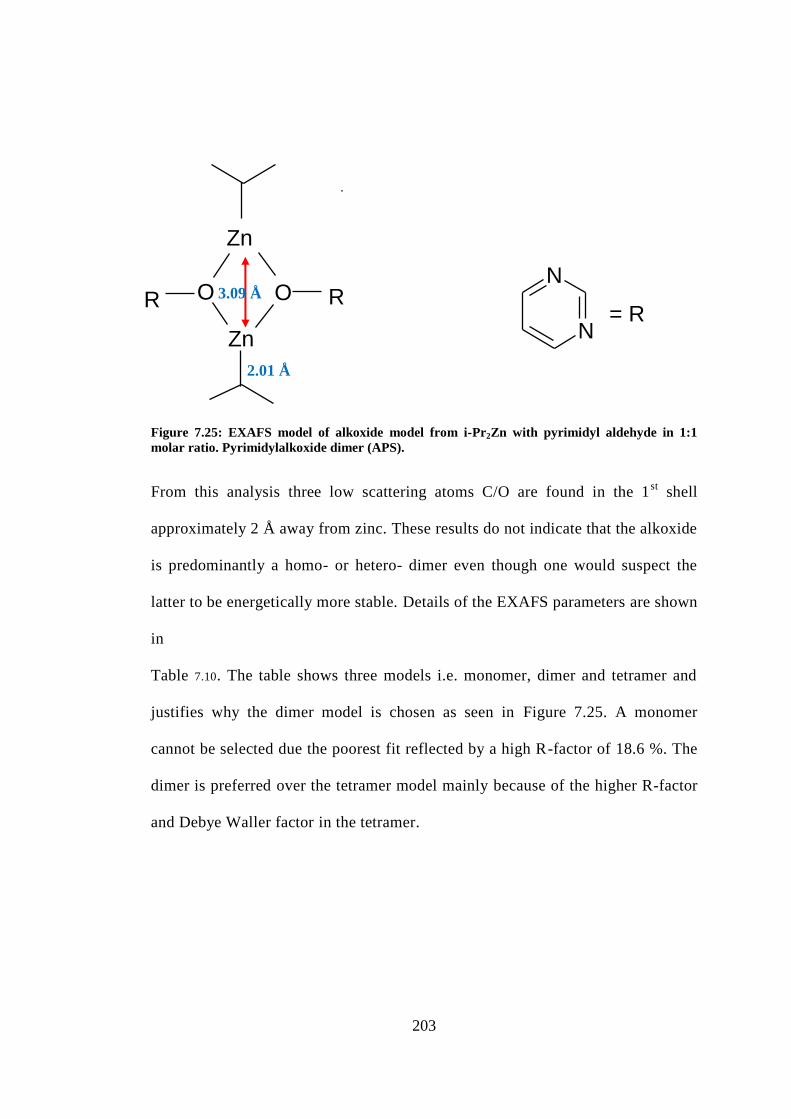
203
.
Figure 7.25: EXAFS model of alkoxide model from i-Pr2Zn with pyrimidyl aldehyde in 1:1
molar ratio. Pyrimidylalkoxide dimer (APS).
From this analysis three low scattering atoms C/O are found in the 1st shell
approximately 2 Å away from zinc. These results do not indicate that the alkoxide
is predominantly a homo- or hetero- dimer even though one would suspect the
latter to be energetically more stable. Details of the EXAFS parameters are shown
in
Table 7.10. The table shows three models i.e. monomer, dimer and tetramer and
justifies why the dimer model is chosen as seen in Figure 7.25. A monomer
cannot be selected due the poorest fit reflected by a high R-factor of 18.6 %. The
dimer is preferred over the tetramer model mainly because of the higher R-factor
and Debye Waller factor in the tetramer.
Zn
Zn
OON
N
R R= R
3.09 Å
2.01 Å

204
Table 7.10: Zn K-edge EXAFS parameters of iPr2Zn and aldehyde A. s: fixed
The Zn-O/C and Zn-Zn bonds in the first shell are similar in all alkoxide models.
In the second shell the Zn-C bond distances and coordination number varies from
3.46 in the monomer to 3.54 Å in the tetramer. The most important shell using in
this study is the 1st shell which has a higher level of accuracy compared to higher
shells. It is now evident from the XAS data analysed from the APS and ESRF that
the transition state complex is a dimer.
7.4 Conclusion
The reaction of iPr2Zn with benzaldehyde, pyrimidylaldehyde, pyridylaldehyde and
cinnamaldehyde was examined through XANES and EXAFS measurements. The
reaction of DEZ and pyrimidylaldehyde has also been closely investigated. The
XANES indicates pyrimidylaldehydes form more strongly bound products with
Sample First shell
(Zn-O/C)
Second shell
(Zn-O/C) (Zn-Zn)
N R (Å)
σ2
( Å 2)
N
R
( Å)
σ2
( Å 2)
N
R
( Å)
σ2
( Å 2)
E0
(eV)
R
(%)
i-Pr2Zn 1.46
±0.141
1.89
±0.005
0.005
±0.001
3.8
±1.583
3.40
±0.013
0.003
±0.007
1.48
±0.318
5.8
i-Pr2Zn
+ A
monomer
(0 Zn...Zn)
2.29
±0.621
1.92
±0.014
0.004
±0.002
9.39
±3.305
3.46
±0.295
0.007
±0.004
1.12
±1.892
18.6
dimer
(1 Zn...Zn)
2.44
±0.295
2.01
±0.008
0.006
±0.001
5.44
±1.376
3.52
±0.015
0.004
±0.002 1s
3.09
±0.008
0.003
±0.001
5.32
±1.061 3.9
tetramer
(3Zn...Zn)
2.46
±0.299
2.03
±0.008
0.006
±0.001
4.17
±1.595
3.54
±0.022
0.005
±0.004
3s 3.10
±0.009
0.010
±0.001
6.19
±1.218
4.1
205
iPr2Zn than benzaldehyde. Increasing the amount of benzaldehyde results in less
drastic changes in the XANES compared to pyrimidylaldehydes where the changes
are more obvious. The XANES of the reaction products held in solution and
deposited as a precipitate are different and it appears that in solution the diversity of
zinc species is greater than in the precipitate. Alkylation of the aldehyde occurs over
time as seen from the XANES, which changes with time. This EXAFS study does
not explain why iPr2Zn is preferred to DEZ which is similar in size. The XANES and
EXAFS analysis of both dialkylzincs are similar and no solid justification has been
made for the outstanding performance of iPr2Zn in chiral amplification. Considering
that by using XAS both structural and electronic information can be acquired, one
may conclude that the performance of iPr2Zn over DEZ may be based on its
energetic stability. Strangely the Zn…Zn distances calculated (iPr2Zn: PA; 1:1) are
not the same. The calculations based on experiments at ESRF (Table 7.3) compared
to the APS (Table 7.10) propose an average Zn-Zn distance of 3.38 and 3.01 Å
respectively. This difference is likely due to noise caused by the inhomogeneous
solution. The most important information derived from both data is the existence of a
dimer complex which is the main objective of this work. From an energetic
perspective a thorough look at the bond distance in the dimer alkoxide complex
formed by DEZ and iPr2Zn may be a breakthrough. Considering only the 1st shell, it
is remarkable to know that the Zn-C/O is shorter in the DEZ- than the iPr2Zn-
alkoxide complex. This applies to the 1:1 and 2:1 complexes formed in solution were
the bond distances are shorter by 0.04 and 0.02 Å respectively. This may advocate
that the transitions state structure of the DEZ-complex has a higher Gibbs free energy
than that formed by iPr2Zn. The enantioselectivity may be instigated by the
difference in free energy between both transition structures. Klankermayer reports
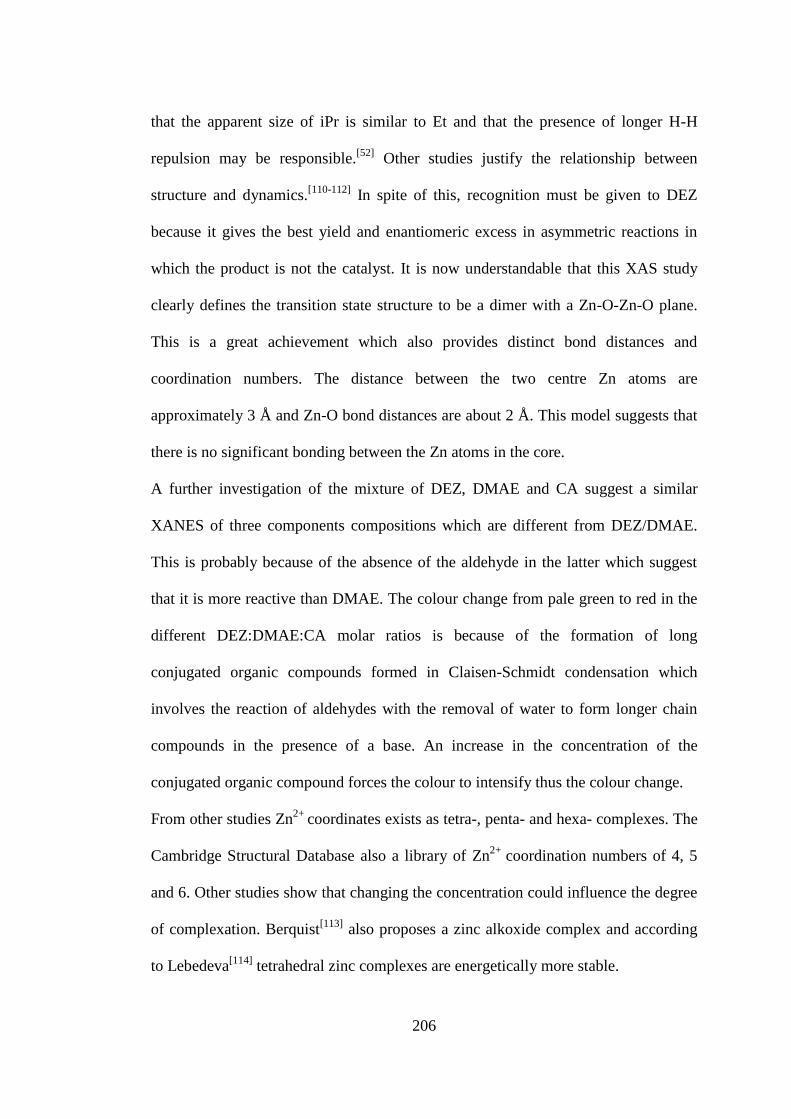
206
that the apparent size of iPr is similar to Et and that the presence of longer H-H
repulsion may be responsible.[52]
Other studies justify the relationship between
structure and dynamics.[110-112]
In spite of this, recognition must be given to DEZ
because it gives the best yield and enantiomeric excess in asymmetric reactions in
which the product is not the catalyst. It is now understandable that this XAS study
clearly defines the transition state structure to be a dimer with a Zn-O-Zn-O plane.
This is a great achievement which also provides distinct bond distances and
coordination numbers. The distance between the two centre Zn atoms are
approximately 3 Å and Zn-O bond distances are about 2 Å. This model suggests that
there is no significant bonding between the Zn atoms in the core.
A further investigation of the mixture of DEZ, DMAE and CA suggest a similar
XANES of three components compositions which are different from DEZ/DMAE.
This is probably because of the absence of the aldehyde in the latter which suggest
that it is more reactive than DMAE. The colour change from pale green to red in the
different DEZ:DMAE:CA molar ratios is because of the formation of long
conjugated organic compounds formed in Claisen-Schmidt condensation which
involves the reaction of aldehydes with the removal of water to form longer chain
compounds in the presence of a base. An increase in the concentration of the
conjugated organic compound forces the colour to intensify thus the colour change.
From other studies Zn2+
coordinates exists as tetra-, penta- and hexa- complexes. The
Cambridge Structural Database also a library of Zn2+
coordination numbers of 4, 5
and 6. Other studies show that changing the concentration could influence the degree
of complexation. Berquist[113]
also proposes a zinc alkoxide complex and according
to Lebedeva[114]
tetrahedral zinc complexes are energetically more stable.
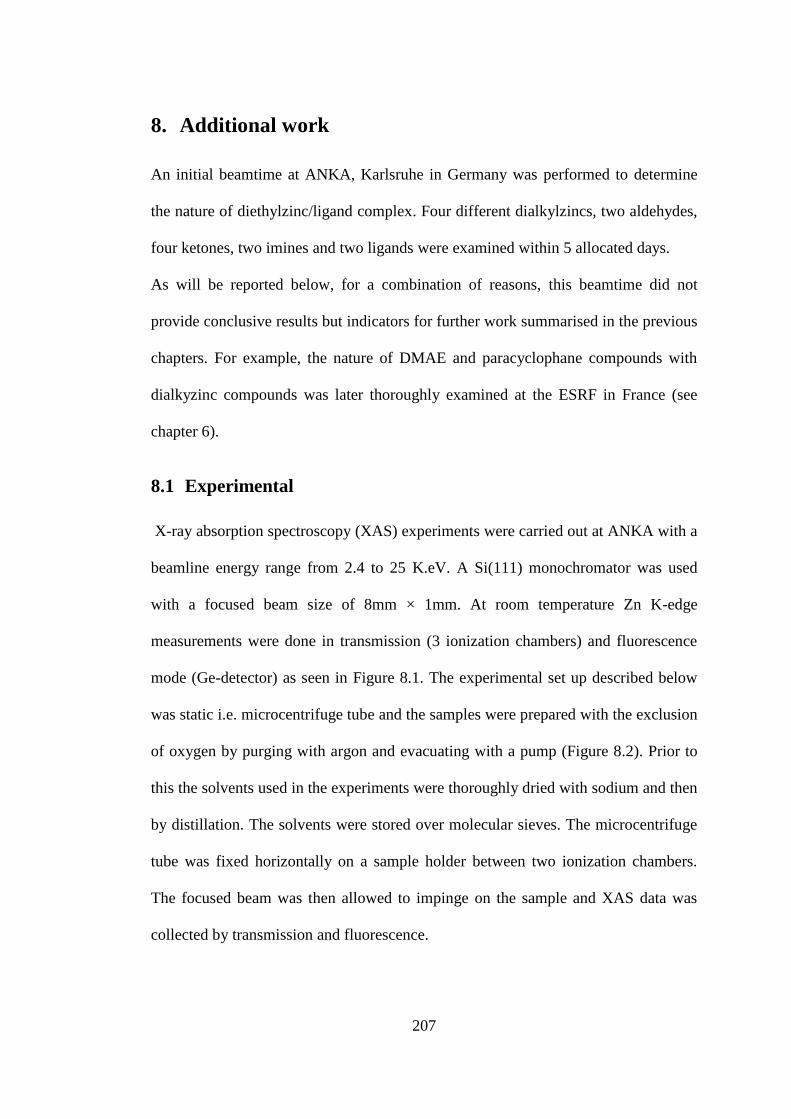
207
8. Additional work
An initial beamtime at ANKA, Karlsruhe in Germany was performed to determine
the nature of diethylzinc/ligand complex. Four different dialkylzincs, two aldehydes,
four ketones, two imines and two ligands were examined within 5 allocated days.
As will be reported below, for a combination of reasons, this beamtime did not
provide conclusive results but indicators for further work summarised in the previous
chapters. For example, the nature of DMAE and paracyclophane compounds with
dialkyzinc compounds was later thoroughly examined at the ESRF in France (see
chapter 6).
8.1 Experimental
X-ray absorption spectroscopy (XAS) experiments were carried out at ANKA with a
beamline energy range from 2.4 to 25 K.eV. A Si(111) monochromator was used
with a focused beam size of 8mm × 1mm. At room temperature Zn K-edge
measurements were done in transmission (3 ionization chambers) and fluorescence
mode (Ge-detector) as seen in Figure 8.1. The experimental set up described below
was static i.e. microcentrifuge tube and the samples were prepared with the exclusion
of oxygen by purging with argon and evacuating with a pump (Figure 8.2). Prior to
this the solvents used in the experiments were thoroughly dried with sodium and then
by distillation. The solvents were stored over molecular sieves. The microcentrifuge
tube was fixed horizontally on a sample holder between two ionization chambers.
The focused beam was then allowed to impinge on the sample and XAS data was
collected by transmission and fluorescence.
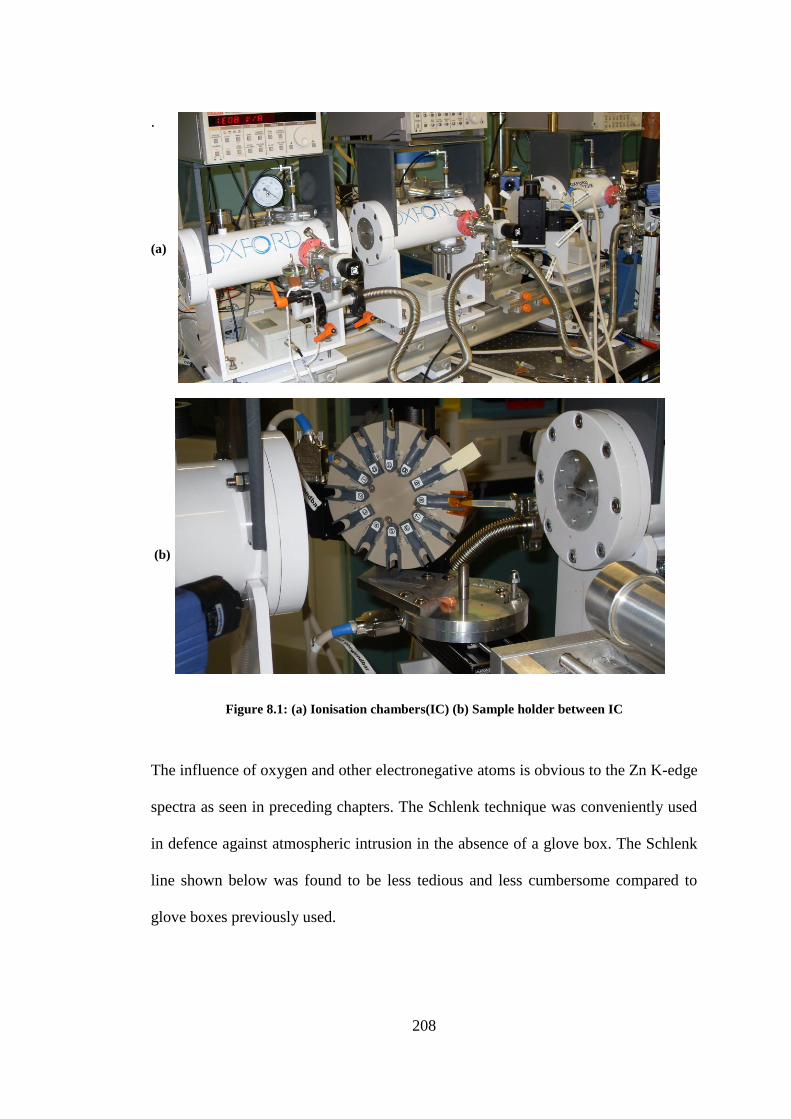
208
.
(a)
(b)
Figure 8.1: (a) Ionisation chambers(IC) (b) Sample holder between IC
The influence of oxygen and other electronegative atoms is obvious to the Zn K-edge
spectra as seen in preceding chapters. The Schlenk technique was conveniently used
in defence against atmospheric intrusion in the absence of a glove box. The Schlenk
line shown below was found to be less tedious and less cumbersome compared to
glove boxes previously used.

209
Figure 8.2: Air free sample preparing set up
XAS data was then acquired after mounting the prepared sample contained in an
Eppendorf tube (5cm × 0.6cm). Materials used include dialkylzincs, organic
solvents, aldehydes, N/O ligands, imines and ketones.
Table 8.1: Chemicals used during experiment
Dialkyl
-zinc
Organic
solvents
Aldehyde
Ketones
N/O ligands
i-Pr2Zn THF t-
Cinnamaldehyde
Benzylidene
Acetone
Paracyclophane
Et2Zn Toluene Trans-2-Hexenal Benzyliden
acetophenone
N,N-dimethyl
aminoethanol
Me2Zn Hexane Cyclohexenone
n-Bu2Zn Diethylether

210
8.2 Results and discussion
XAS acquisition at the Zn K-edge was optimal at a concentration of 0.05 M. This
concentration was used at the APS prior to this experiment. The results of this
section include processing the XANES and EXAFS refinement. The applications
used in data processing include Athena and Artemis (Ifeffit packages).
8.2.1 Alkylating agents
Alkyl donating groups investigated include dimethyl-, diethyl-, dibutyl- and
diisopropylzinc. Diisopropylzinc has been the only successful alkyl donating group
in the Soai autocatalytic reaction[19, 102]
meanwhile diethylzinc gives the best yield
and enantiomeric excess in asymmetric reactions in which the product is not the
catalyst. Clearly noticeable from the Zn K-edge spectra is a similar resonance peak
with all measured dialkylzincs (Figure 8.3).
Figure 8.3: XANES of different alkylzincs in Toluene. APS-labeled; ANKA-unlabeled
The top most spectra shows that the normalized intensity of i-Pr2Zn at APS, changes
with the photon energy. The resonance peak is 1.5 a.u and is higher than the spectra
0
1
2
3
4
5
6
7
8
9650 9655 9660 9665 9670 9675 9680 9685 9690 9695 9700
Photon Energy [e.V]
No
rmali
sed
In
ten
sit
y [
a.u
.]
i-Pr2Zn_APS
n-Bu2Zn
Et2Zn
i-Pr2Zn
Me2Zn1 a.u.
1.5 a.u.
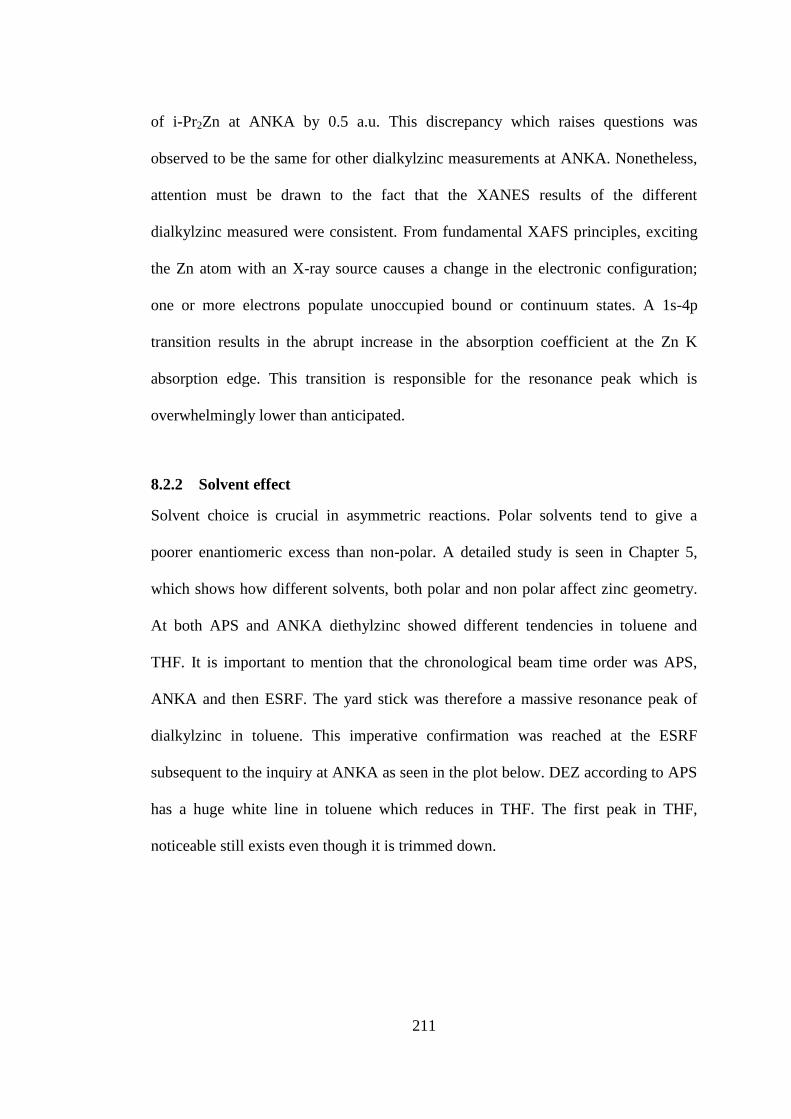
211
of i-Pr2Zn at ANKA by 0.5 a.u. This discrepancy which raises questions was
observed to be the same for other dialkylzinc measurements at ANKA. Nonetheless,
attention must be drawn to the fact that the XANES results of the different
dialkylzinc measured were consistent. From fundamental XAFS principles, exciting
the Zn atom with an X-ray source causes a change in the electronic configuration;
one or more electrons populate unoccupied bound or continuum states. A 1s-4p
transition results in the abrupt increase in the absorption coefficient at the Zn K
absorption edge. This transition is responsible for the resonance peak which is
overwhelmingly lower than anticipated.
8.2.2 Solvent effect
Solvent choice is crucial in asymmetric reactions. Polar solvents tend to give a
poorer enantiomeric excess than non-polar. A detailed study is seen in Chapter 5,
which shows how different solvents, both polar and non polar affect zinc geometry.
At both APS and ANKA diethylzinc showed different tendencies in toluene and
THF. It is important to mention that the chronological beam time order was APS,
ANKA and then ESRF. The yard stick was therefore a massive resonance peak of
dialkylzinc in toluene. This imperative confirmation was reached at the ESRF
subsequent to the inquiry at ANKA as seen in the plot below. DEZ according to APS
has a huge white line in toluene which reduces in THF. The first peak in THF,
noticeable still exists even though it is trimmed down.
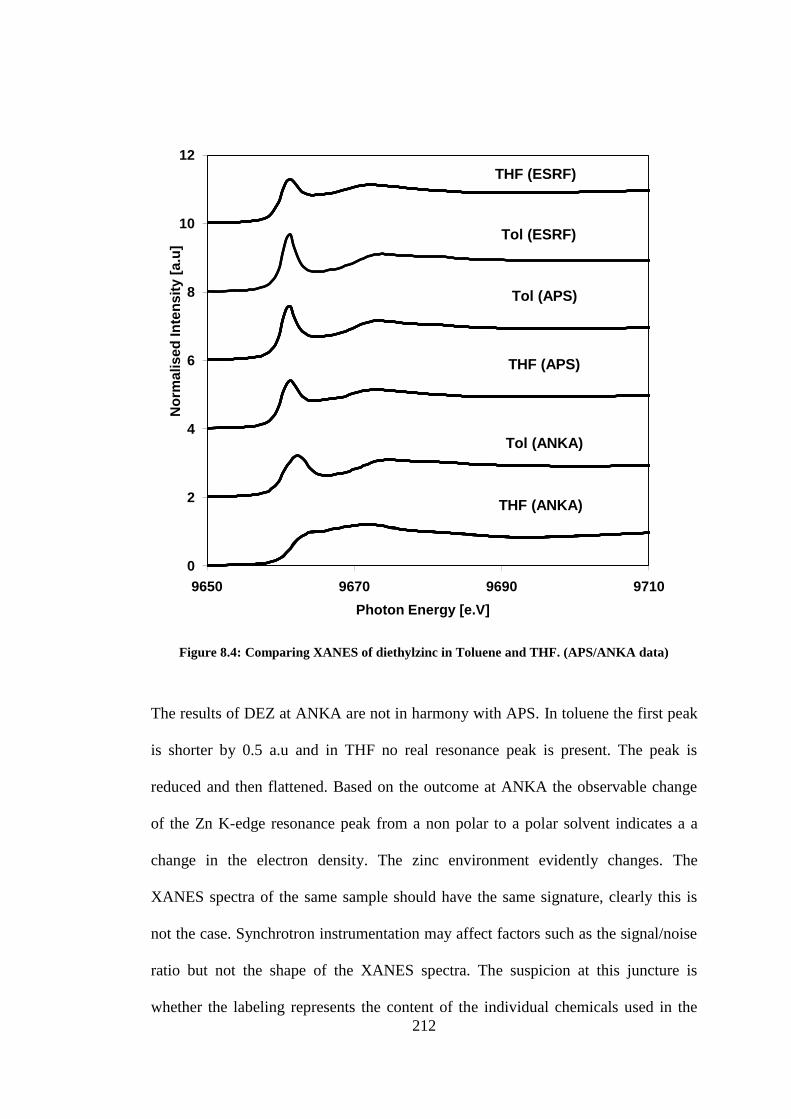
212
Figure 8.4: Comparing XANES of diethylzinc in Toluene and THF. (APS/ANKA data)
The results of DEZ at ANKA are not in harmony with APS. In toluene the first peak
is shorter by 0.5 a.u and in THF no real resonance peak is present. The peak is
reduced and then flattened. Based on the outcome at ANKA the observable change
of the Zn K-edge resonance peak from a non polar to a polar solvent indicates a a
change in the electron density. The zinc environment evidently changes. The
XANES spectra of the same sample should have the same signature, clearly this is
not the case. Synchrotron instrumentation may affect factors such as the signal/noise
ratio but not the shape of the XANES spectra. The suspicion at this juncture is
whether the labeling represents the content of the individual chemicals used in the
0
2
4
6
8
10
12
9650 9670 9690 9710
No
rma
lis
ed
In
ten
sit
y [
a.u
]
Photon Energy [e.V]
THF (ANKA)
THF (APS)
Tol (APS)
Tol (ESRF)
THF (ESRF)
Tol (ANKA)

213
experiment. The may be contamination of some kind on the chemicals or solvents
either from the beam time at ANKA or APS.
8.2.3 Ethylation with paracyclophane based and dimethylaminoethanol
ligands
The use of N,O-ligands such as paracyclophane is important in enantioselectivity
generally giving a high yield and enantiomeric excess. In this section the Zn K-edge
of the interaction of DEZ and N,O-ligands such as paracyclophane and
dimethylaminoethanol are studied.[88-91]
The essence of this is to determine the zinc
environment with different combinations. The main aim was to provide structural
information of the nature of the complex formed between DEZ and the ligand. The
illustration below shows the XANES of DEZ with DMAE/Paracyclophane in
toluene. It also includes the interaction of the DEZ-ligand combination with
aldehydes and ketones. From basic chemistry ketones are generally less reactive than
aldehydes because of steric hindrance. Ketones generally have bulky groups
compared to aldehydes which hinder attacking molecules from reacting. Obvious
changes are seen from the XANES plot below implying a change in zinc geometry. It
is also observed that changing the solvent from toluene to a polar solvent, in this case
THF changes the XANES substantially as previously seen in this work. Only the
behavior of ketones can be appreciated in the following example.
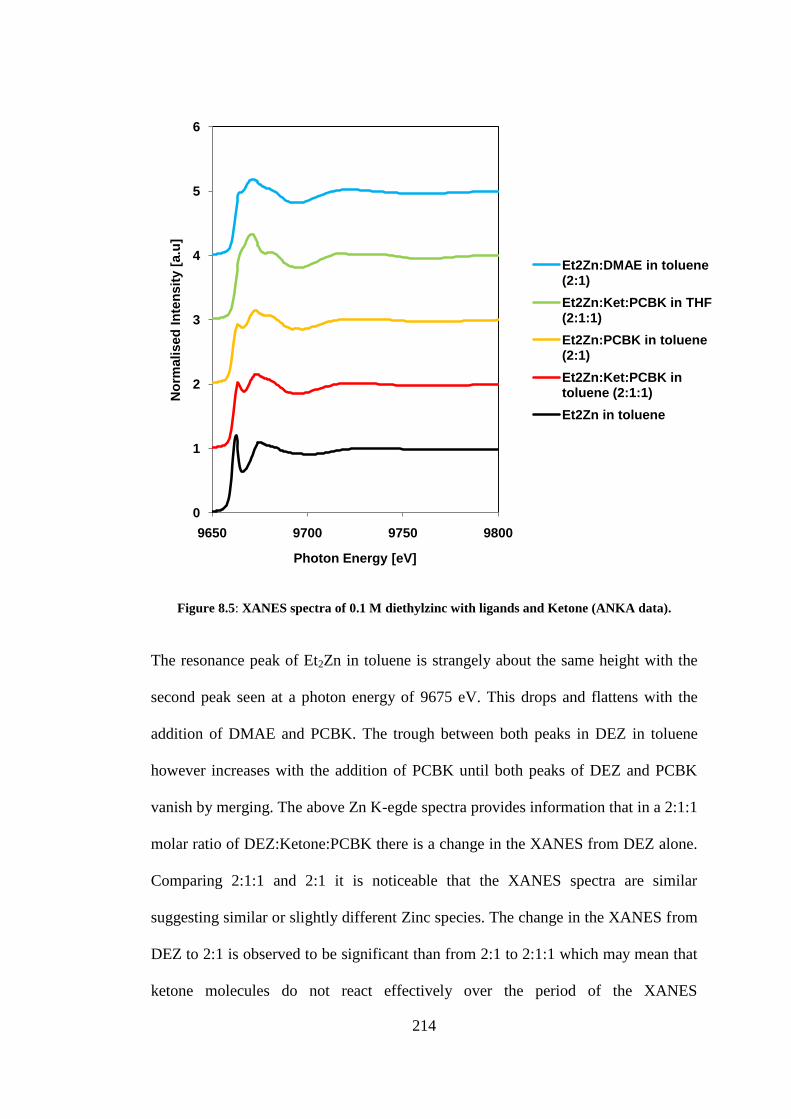
214
Figure 8.5: XANES spectra of 0.1 M diethylzinc with ligands and Ketone (ANKA data).
The resonance peak of Et2Zn in toluene is strangely about the same height with the
second peak seen at a photon energy of 9675 eV. This drops and flattens with the
addition of DMAE and PCBK. The trough between both peaks in DEZ in toluene
however increases with the addition of PCBK until both peaks of DEZ and PCBK
vanish by merging. The above Zn K-egde spectra provides information that in a 2:1:1
molar ratio of DEZ:Ketone:PCBK there is a change in the XANES from DEZ alone.
Comparing 2:1:1 and 2:1 it is noticeable that the XANES spectra are similar
suggesting similar or slightly different Zinc species. The change in the XANES from
DEZ to 2:1 is observed to be significant than from 2:1 to 2:1:1 which may mean that
ketone molecules do not react effectively over the period of the XANES
0
1
2
3
4
5
6
9650 9700 9750 9800
No
rmalised
In
ten
sit
y [
a.u
]
Photon Energy [eV]
Et2Zn:DMAE in toluene (2:1)
Et2Zn:Ket:PCBK in THF (2:1:1)
Et2Zn:PCBK in toluene (2:1)
Et2Zn:Ket:PCBK in toluene (2:1:1)
Et2Zn in toluene
215
measurement. It should be noted that the diethylzinc: ligand: ketone ratio of 2:1:1
was intentionally taken and is optimal in understanding the structure of the complex
responsible for catalysis. The influence of THF can also be seen when compared
with toluene during the ethylation of the ketone in the presence of the
paracyclophane ligand. This might imply a likely binding of THF molecules to zinc
as studied in earlier chapters.
8.2.4 Diethylzinc addition to Imines
Further XAS studies on the asymmetric diethylzinc addition to imines with
paracyclophane were also carried out. The XANES below compares DEZ and the
influence of paracyclophane, the ketone and the imine. The influence of the former
has been discussed and focus will now be on the later which shows an interesting
trend over time. From the following illustration the resonance peak of DEZ at 9662
eV clearly drops and moves to the right with the addition of the paracyclophane
ligand. A shift in the 2nd
peak of DEZ at 9675 eV to lower photon energy is also
observed. The same trend is seen in the 2:1:1 molar ratio where a slightly deeper
trough is seen compared to the 2:1.
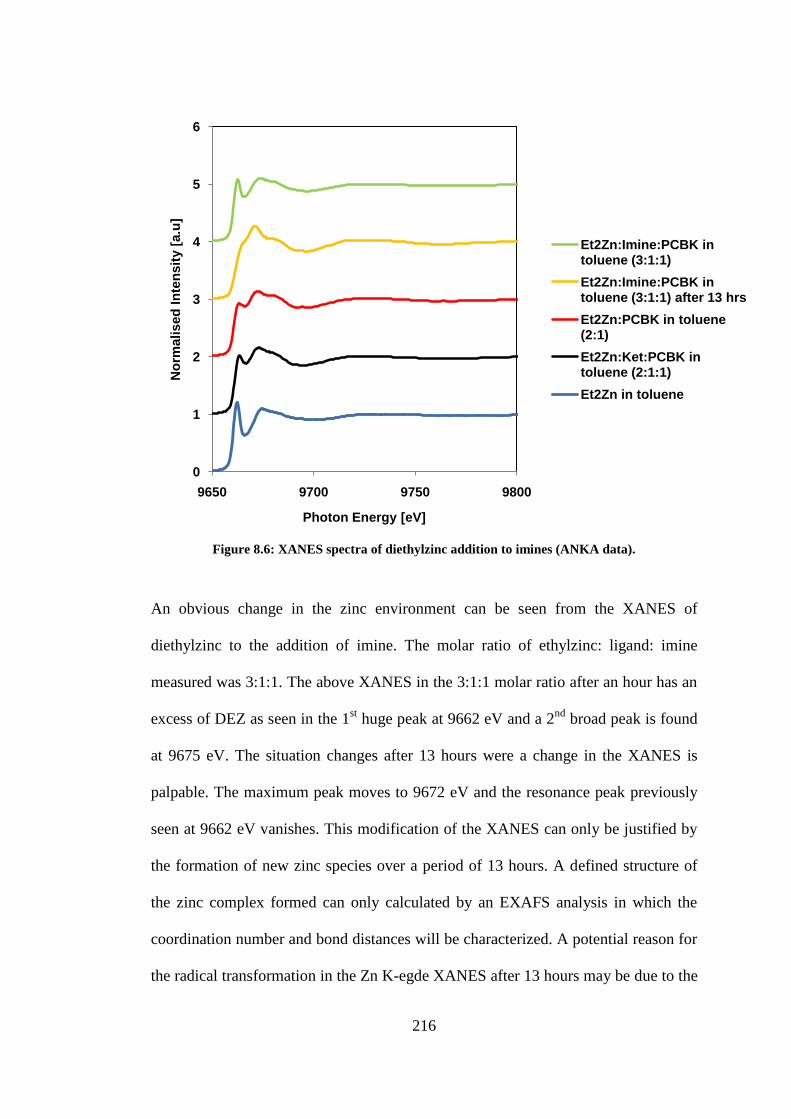
216
Figure 8.6: XANES spectra of diethylzinc addition to imines (ANKA data).
An obvious change in the zinc environment can be seen from the XANES of
diethylzinc to the addition of imine. The molar ratio of ethylzinc: ligand: imine
measured was 3:1:1. The above XANES in the 3:1:1 molar ratio after an hour has an
excess of DEZ as seen in the 1st huge peak at 9662 eV and a 2
nd broad peak is found
at 9675 eV. The situation changes after 13 hours were a change in the XANES is
palpable. The maximum peak moves to 9672 eV and the resonance peak previously
seen at 9662 eV vanishes. This modification of the XANES can only be justified by
the formation of new zinc species over a period of 13 hours. A defined structure of
the zinc complex formed can only calculated by an EXAFS analysis in which the
coordination number and bond distances will be characterized. A potential reason for
the radical transformation in the Zn K-egde XANES after 13 hours may be due to the
0
1
2
3
4
5
6
9650 9700 9750 9800
No
rmalised
In
ten
sit
y [
a.u
]
Photon Energy [eV]
Et2Zn:Imine:PCBK in toluene (3:1:1)
Et2Zn:Imine:PCBK in toluene (3:1:1) after 13 hrs
Et2Zn:PCBK in toluene (2:1)
Et2Zn:Ket:PCBK in toluene (2:1:1)
Et2Zn in toluene
217
low solubility of Imine. The XANES after an hour therefore displays the interaction
of DEZ and paracyclophane. In addition, it has been reported that deprotonation to
give the intermediate is the rate-limiting step and the alkyl- addition itself is fast.[115,
116]
8.2.5 EXAFS Refinement of ANKA data
As seen in other sections of this report, the XANES compliments the EXAFS
analysis. The EXAFS analysis is vital in understanding zinc geometry. The core of
this study is to contribute to the reaction mechanism by describing the nature of the
zinc complexes in solution. As afore mentioned the same experiments carried out at
APS were not alike with that at ANKA. This obviously led to suspicion of the
reliability of the results at ANKA which were arduous to fit. Fitting experimental and
theoretical data was not possible with the results from ANKA in contrast to APS.
Only unacceptably high R-factor values were achievable. The reasons for the
intolerable fit may be a hint of contaminated samples. The EXAFS analysis was not
possible and therefore not considered in this section.
8.3 Conclusion
In this chapter the XANES spectra of dimethyl-, diethyl-, dibutyl and diisopropylzinc
are comparable though the XANES Zn K edge spectra at ANKA and APS were poles
apart with a conspicuously huge resonance peak seen in the XAS data collected from
the APS and ESRF.
From the beamtime at ANKA, THF reduces the resonance probably as a result of the
binding of THF molecules to the zinc atom thus changing the zinc environment. Its
influence is not only seen in dialkylzincs alone but also on the ethylating of ketones

218
in the presence of paracyclophane. The XANES spectra of diethylzinc and DMAE is
different from that with paracylophane suggesting difference in the change in the
electron density of the zinc atom. A surplus of DEZ over the ligand results in a
modification of the XANES compared to the 1:1 mixture where the resonance peak
is comparably lower and more to the right i.e. higher photon energy values.
Significant changes can be seen in the XANES during the ethylating of imines over
time. This may be as a result of the reported low solubility of imines since
deprotonation to give the intermediate occurs rapidly.
No full explanation is available for the discrepancy concerning the XAS data
acquired at ANKA and APS. Both light sources have an international reputation and
have S/N ratios within acceptable limits. The results from both lights sources should
therefore be comparable. Assuming that the reason for the inconsistency is not from
the light source, the only other source of error would be from the sample. This is
broad ranging from the content of the chemicals to the manner in which the samples
were prepared. It should be noted that the method of sample preparation at ANKA
was different from APS where the solvents were not distilled but bought as
anhydrous solvents from Sigma Aldrich. In addition at APS air exclusion during
sample preparation was achieved by using a glove bag filled with nitrogen. At
ANKA a Schlenk line was put in place and the samples were prepared under argon.
No structures were determined from the EXAFS analysis as only unacceptable
results were obtained. The benefit of the study at ANKA was the XANES which was
different depending on the experiment and also coherent. In addition, repeatable
results were possible meaning that the results in terms of trend were believable. It
must be noted that a follow up of this beam time was the previously seen

219
experiments at the ESRF, Grenoble, France which tally with the results from the
APS.

220
9. Summary
This dissertation reports a series of studies that address the structural properties of
key organometallic species involved in dialkyzinc-catalysed enantioselective
reactions, with a particular view to the Soai chiral amplification process.
Structural causes of solvent effects were revealed through XANES of dialkylzinc
species in various solvents. According to this study non polar solvents such as
toluene are favourable in asymmetric amplification because they do not bind to the
zinc centres, which remain monomeric in the absence of the prochiral reactants.
EXAFS calculations propose dimers or tetramers in the presence of THF. The
binding of THF to zinc may also be responsible for the slow turnover, thus producing
low yield and little enantiomeric excess. The interaction with THF is, relative to that
with toluene, so strong that even small vol% (~10%) of THF in a mixture with
toluene cause a significant change to the XANES. Furthermore the influence of
concentration is more dramatic on the XANES than the polar/non polar solvent ratio.
The XANES at higher concentrations is different than at lower concentrations where
the dialkylzinc molecules may be interacting with water molecules (impurities). In
conjunction with Denisov‟s NMR study from 1975, which has previously not been
considered in studies on the Soai reaction, the tendency of different solvents to form
solvate species with dialkylzinc has been introduced as an important concept for
solvent selection. The EXAFS models also show a distinction between iPr2Zn and
DEZ in THF. Dimethylzinc on the other hand has a slightly higher first resonance
peak compared to the other two. This work also demonstrates that over a long period
dialkylzinc decomposes to a product similar to zinc oxide when slow air ingress into

221
the reactor takes place. There is however also a possibility of the presence of zinc
hydroxide due to residual H2O which was found to have a higher R-factor than ZnO.
An examination of the complex formed between a chiral ligand and dialkylzinc
suggests that dimers or tetramers are possibly formed. The XANES does not change
drastically with changes in the stoichiometric amount of dialkylzinc and 2-butanol.
The contrary is the case with DMAE where a considerable change is observed
probably because it is less reactive. This is likely attributed to the presence of two
electronegative atoms (O and N) in DMAE which cause a significant electronic
effect. Overall the XAFS study confirms the possible presence of a monomer, dimer,
tetramer or a mixture of species in a 1:1 molar ratio of DEZ:DMAE, suggesting that
no specific specie can be identified, which are central for the Noyori mechanistic
schemes for chiral amplification.
One of the most significant contributions of this study is the determination of the
complex responsible for the catalysis in the Soai autocatalytic reaction. Despite the
numerous scientific studies no proposal has been made that provides electronic and
structural information of the proposed dimer structures. For the first time using X-ray
absorption spectroscopy, we are able to confirm that the transition state structure is a
dimer built around a centre with a Zn-Zn distance of approximately 3 Å, with no
significant metal-metal bonding between zinc atoms. Such dimer complexes are
formed with all aldehydes studied.
However, the reason for the outstanding performance of iPr2Zn over Et2Zn could not
be substantiated. From the XANES it appears that pyrimidyl aldehydes bind more
strongly than benzaldehyde, suggesting that a strongly bound complex is preferable
for the Soai autocatalytic reaction. This is observed by varying the stoichiometric
amount of dialkylzinc and aldehyde. Different structures have been established in
222
this evaluation by changing the stoichiometric ratios of dialkylzinc and aldehyde.
The EXAFS investigation confirms the possibility of trigonal and tetrahedral zinc
sites in the alkoxide complex depending on the stoichiometric amounts.
The XANES of a mixture of DEZ, DMAE and cinnamaldehyde is distinct from that
of DEZ and DMAE. The colour change from pale green (DEZ and DMAE) to red
(DEZ, DMAE and cinnamaldehyde) over time is likely because of zinc catalyzed
polymerization. Evidence of this transformation is seen from UV and X-ray
absorption analysis.
Results from several synchrotron radiation sources and using a number of
experimental approaches to the organometalic synthesis at a synchrotron radiation
source were considered in this study. The findings from Schlenk and glove box
laboratory experimentation at ANKA were consistent but different from those
obtained with small volume glove bag experiments at APS and ESRF. An expected
huge resonance peak of dialkylzinc in toluene was not seen at ANKA suggesting that
the small volume glove bag approach is more reliable than transferring home
laboratory techniques to a synchrotron setting.
The accomplishment of the microcentrifuge tube reactor work overshadows that of
the continuous flow reactor which is limited due to the formation of a precipitate on
the inner reactor wall.
Mainly three coordination numbers of the different measurements of this study can
be identified as seen in the table below. The table compares the coordination
numbers predicted from the XANES analysis based on Kau et al (coordination
number determined from the nature of the resonance peak) and the EXAFS
calculations.
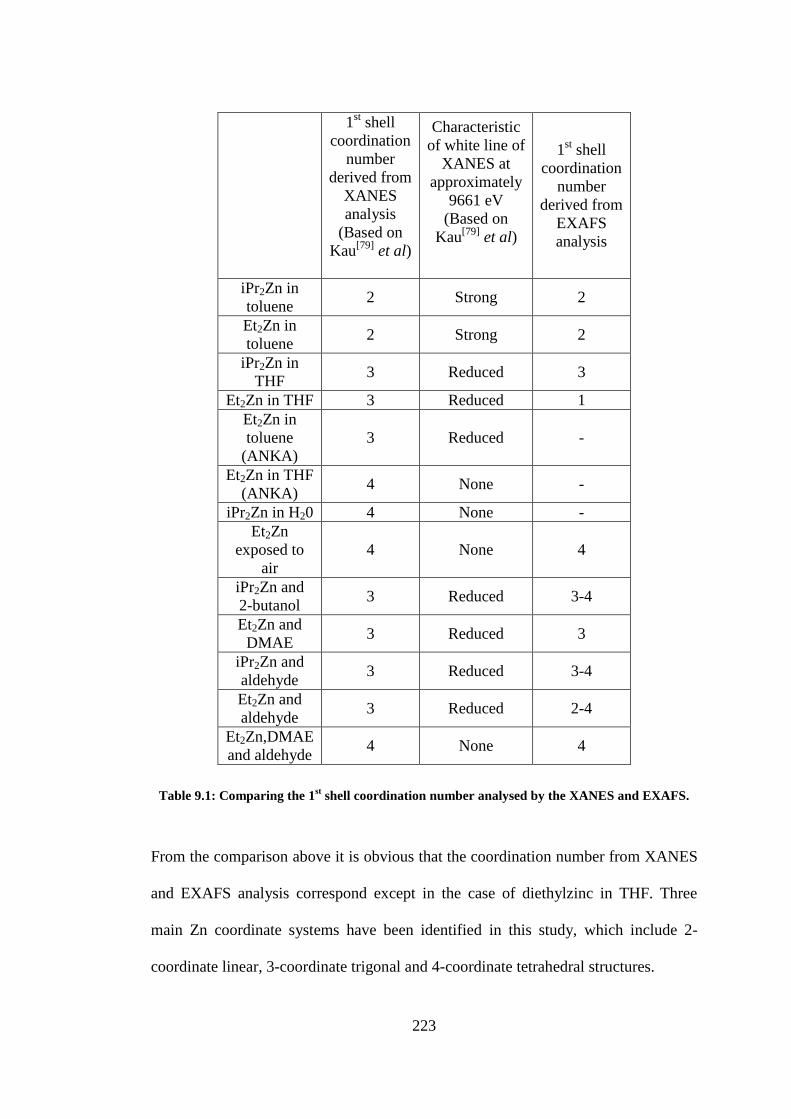
223
1st shell
coordination
number
derived from
XANES
analysis
(Based on
Kau[79]
et al)
Characteristic
of white line of
XANES at
approximately
9661 eV
(Based on
Kau[79]
et al)
1st shell
coordination
number
derived from
EXAFS
analysis
iPr2Zn in
toluene 2 Strong 2
Et2Zn in
toluene 2 Strong 2
iPr2Zn in
THF 3 Reduced 3
Et2Zn in THF 3 Reduced 1
Et2Zn in
toluene
(ANKA)
3 Reduced -
Et2Zn in THF
(ANKA) 4 None -
iPr2Zn in H20 4 None -
Et2Zn
exposed to
air
4 None 4
iPr2Zn and
2-butanol 3 Reduced 3-4
Et2Zn and
DMAE 3 Reduced 3
iPr2Zn and
aldehyde 3 Reduced 3-4
Et2Zn and
aldehyde 3 Reduced 2-4
Et2Zn,DMAE
and aldehyde 4 None 4
Table 9.1: Comparing the 1st shell coordination number analysed by the XANES and EXAFS.
From the comparison above it is obvious that the coordination number from XANES
and EXAFS analysis correspond except in the case of diethylzinc in THF. Three
main Zn coordinate systems have been identified in this study, which include 2-
coordinate linear, 3-coordinate trigonal and 4-coordinate tetrahedral structures.
224
10. Future Work
Precise time resolved measurements are essential in order to fully understand the
molecular mechanism of organozinc reactions. The continuous tubular flow reactor is
excellent in design but poor in providing persuasive results. Highly rated results can
only be achieved if the deposit which builds in the inner wall is eliminated. This
system may benefit a reaction that does not produce a precipitate. Experiments using
a stop flow reactor[117]
would be essential towards the development of an efficient
continuous flow reactor. In addition to X-ray absorption spectroscopy it would be
beneficial to integrate different methods such as IR and XRD simultaneously with
the XAS measurements.
From this study the rationale behind the excellence of iPr2Zn has not been fully
endorsed. It is important to carry out further investigation on the difference between
iPr2Zn and DEZ. It may also be beneficial to do XAFS studies on a mixture of
dialkylzincs to understand their interaction with the intention of getting more
information on their diversity.
Based on the different stoichiometric amounts of reactants it would make sense to
correlate the XAFS studies with kinetic models that should explain the reaction
mechanism. The kinetic together with XAFS data should build a mathematical model
capable of explaining asymmetric autocatalysis.
The Mannich reaction[118-120]
is another example of an autocatalytic reaction.
Studying this reaction using X-ray absorption spectroscopy would be of great interest
and may provide information on the molecular mechanism.
More emphasis should be placed on ab initio calculations based on the structural
models derived from this EXAFS study. The structures produced from X-ray

225
absorption analysis should be converted to XYZ coordinates in order to generate Feff
files. Feff calculations should reveal a theoretical XANES which should be
compared to the experimental. The agreement between theoretical and experimental
data should provide evidence on the accuracy of the model.
Homogenous reactions in which the product is not the catalyst should be studied
using the continuous flow and batch reactor. Catalysts such as copper[121, 122]
have
been reported in asymmetric synthesis. It would be attention-grabbing to understand
the change of the catalysts with increasing residence time.
226
11. Peer reviewed work
“Reducibility of supported gold (III) precursors: influence of the metal oxide
support and consequences for CO oxidation activity.”Laurent Delannoy,
Norbert Weiher, Nikolaos Tsapatsaris, Angela M. Beesley, Luanga Nchari,
Sven L. M. Schroeder and Catherine Louis: (Top. Catal.). (2007)
“Continuous Tubular Flow Reactor for XAFS Studies of Organometallic
Reactions: Possibilities and Limitations for Studies of the Soai Reaction.”
Nchari L.N, Hembury, G. A.; Beesley, A. M.; Meehan D.J.; Tsapatsaris N.;
Schroeder S. L. M., (Journal of Physics, Conference proceeding). (2009)
227
12. References
[1] T. Shibata, T. Hayase, J. Yamamoto, K. Soai, Tetrahedron-Asymmetry 1997,
8, 1717.
[2] R. Morrison, R. Boyd, Organic Chemistry 1992, 6th Edition.
[3] T. Graham Solomons, C. Fryhle, Organic Chemistry 2007, 9th edition.
[4] F. A. Carey, Organic Chemistry 1992, 2nd Edition.
[5] J. D. Carroll, Chirality 2009, 21, 354.
[6] W. Fuss, Chirality 2009, 21, 299.
[7] L. Rosaria, A. D'Urso, A. Mammana, R. Purrello, Chirality 2008, 20, 411.
[8] C. A. Challener, Chiral intermediates, Ashgate, Aldershot, 2001.
[9] A. N. Collins, G. N. Sheldrake, J. Crosby, Chirality in industry : the
commercial manufacture and applications of optically active compounds,
Wiley, Chichester ; New York, 1992.
[10] M. A. Fox, Organic Chemistry 2004, 3rd Edition.
[11] S. N. Kilnyi, R. A. Aitken, Asymmetric synthesis, Blackie Academic &
Professional, London, 1992.
[12] V. Davankov, Chirality 2006, 18, 459.
[13] J. G. Smith, Organic Chemistry 2006.
[14] M. Breuer, K. Ditrich, T. Habicher, B. Hauer, M. Keßeler, R. Stürmer, T.
Zelinski, Angew. Chem., Int. Ed. 2004, 43, 788.
[15] J. Clayden, N. Greeves, S. Warren, P. Wothers, Organic Chemistry 2001.
[16] F. C. Frank, Biochimica Et Biophysica Acta 1953, 11, 459.
[17] C. Girard, H. B. Kagan, Angew. Chem., Int. Ed. 1998, 37, 2923.
[18] M. Kitamura, S. Okada, S. Suga, R. Noyori, J. Am. Chem. Soc. 1989, 111,
4028.
[19] I. Sato, D. Omiya, K. Tsukiyama, Y. Ogi, K. Soai, Tetrahedron-Asymmetry
2001, 12, 1965.
[20] I. Sato, H. Urabe, S. Ishiguro, T. Shibata, K. Soai, Angew. Chem., Int. Ed.
2003, 42, 315.
[21] T. Shibata, S. Yonekubo, K. Soai, Angew. Chem., Int. Ed. 1999, 38, 659.
[22] K. Soai, T. Kawasaki, Chirality 2006, 18, 469.
[23] K. Soai, T. Kawasaki, Amplification of Chirality 2008, 284, 1.
[24] K. Soai, T. Shibata, H. Morioka, K. Choji, Nature 1995, 378, 767.
[25] K. Soai, T. Shibata, I. Sato, Acc. Chem. Res. 2000, 33, 382.
[26] K. Soai, T. Shibata, I. Sato, Nippon Kagaku Kaishi 2001, 141.
[27] K. Soai, T. Shibata, I. Sato, Bull. Chem. Soc. Jpn. 2004, 77, 1063.
[28] D. Indar, MEng Dissertation University of Manchester 2009.
[29] C. Puchot, O. Samuel, E. Dunach, S. Zhao, C. Agami, H. B. Kagan, J. Am.
Chem. Soc. 1986, 108, 2353.
[30] M. Kitamura, S. Suga, H. Oka, R. Noyori, J. Am. Chem. Soc. 1998, 120,
9800.
[31] F. Lutz, T. Igarashi, T. Kinoshita, M. Asahina, K. Tsukiyama, T. Kawasaki,
K. Soai, J. Am. Chem. Soc. 2008, 130, 2956.
[32] I. Sato, D. Omiya, H. Igarashi, K. Kato, Y. Ogi, K. Tsukiyama, K. Soai,
Tetrahedron-Asymmetry 2003, 14, 975.
[33] T. Shibata, H. Morioka, T. Hayase, K. Choji, K. Soai, J. Am. Chem. Soc.
1996, 118, 471.
228
[34] I. D. Gridnev, J. M. Brown, Proc. Natl. Acad. Sci. U. S. A. 2004, 101, 5727.
[35] S. P. Mathew, H. Iwamura, D. G. Blackmond, Angew. Chem., Int. Ed. 2004,
43, 3317.
[36] K. Soai, T. Shibata, J. Synth. Org. Chem. Jpn. 1997, 55, 994.
[37] S. Sugiyama, Y. Aoki, K. Ishii, Tetrahedron-Asymmetry 2006, 17, 2847.
[38] M. H. Todd, Chemical Society Reviews 2002, 31, 211.
[39] D. G. Blackmond, J. Am. Chem. Soc. 1997, 119, 12934.
[40] F. G. Buono, D. G. Blackmond, J. Am. Chem. Soc. 2003, 125, 8978.
[41] D. G. Blackmond, Proc. Natl. Acad. Sci. U. S. A. 2004, 101, 5732.
[42] D. G. Blackmond, C. R. McMillan, S. Ramdeehul, A. Schorm, J. M. Brown,
J. Am. Chem. Soc. 2001, 123, 10103.
[43] D. G. Blackmond, Acc. Chem. Res. 2000, 33, 402.
[44] D. G. Blackmond, Tetrahedron-Asymmetry 2006, 17, 584.
[45] F. G. Buono, H. Iwamura, D. G. Blackmond, Angew. Chem., Int. Ed. 2004,
43, 2099.
[46] D. G. Blackmond, Adv. Synth. Catal. 2002, 344, 156.
[47] T. Buhse, Tetrahedron-Asymmetry 2003, 14, 1055.
[48] J. R. Islas, D. Lavabre, J. M. Grevy, R. H. Lamoneda, H. R. Cabrera, J. C.
Micheau, T. Buhse, Proc. Natl. Acad. Sci. U. S. A. 2005, 102, 13743.
[49] I. D. Gridnev, J. M. Serafimov, H. Quiney, J. M. Brown, Org. Biomol. Chem.
2003, 1, 3811.
[50] I. D. Gridnev, J. M. Serafimov, J. M. Brown, Angew. Chem., Int. Ed. 2004,
43, 4884.
[51] J. M. Brown, I. Gridnev, J. Klankermayer, Amplification of Chirality 2008,
284, 35.
[52] J. Klankermayer, I. D. Gridnev, J. M. Brown, Chem. Commun.2007, 3151.
[53] P. Coppens, J. Penner-Hahn, Chem. Rev. 2001, 101, 1567.
[54] NSLS, EXAFS Data Collection and Analysis Workshop 2003.
[55] H. D. Kelly S.D, Ravel B, Soil Science of America 2008, Part 5, 367.
[56] D. C. Koningsberger, B. L. Mojet, G. E. van Dorssen, D. E. Ramaker, Top.
Catal. 2000, 10, 143.
[57] A. Filipponi, A. Dicicco, T. A. Tyson, C. R. Natoli, Solid State Commun.
1991, 78, 265.
[58] B. Ravel, M. Newville, J. Syn. Rad. 2005, 12, 537.
[59] G. Bunker, "XAFS class notes"; http://sparky.csrri.iit.edu/xafsdocs/. 1983.
[60] B. K. Teo, EXAFS-Basic principles and Data Analysis 1986.
[61] M. Newville, J. J. Kas, J. J. Rehr, 14th International Conference on X-Ray
Absorption Fine Structure (Xafs14), Proceedings 2009, 190.
[62] ATOMS, http://leonardo.phys.washington.edu/~ravel/atoms/ Manual.
[63] M. Brivio, W. Verboom, D. N. Reinhoudt, Lab on a Chip 2006, 6, 329.
[64] P. Watts, Abstracts of Papers of the Am. Chem. Soc. 2005, 229, 024.
[65] P. Watts, S. J. Haswell, C. Wiles, Abstracts of Papers of the Am. Chem. Soc.
2005, 230, 700.
[66] C. Wiles, P. Watts, S. J. Haswell, Abstracts of Papers of the Am. Chem. Soc.
2005, 230, 293.
[67] P. D. I. Fletcher, S. J. Haswell, E. Pombo-Villar, B. H. Warrington, P. Watts,
S. Y. F. Wong, X. L. Zhang, Tetrahedron 2002, 58, 4735.
[68] J. Rolland, X. C. Cambeiro, C. Rodriguez-Escrich, M. A. Pericas, Beilstein J.
Org. Chem.2009, 5.

229
[69] NSLS, EXAFS Data Collection and Analysis Workshop 2001.
[70] D. R. Roberts, R. G. Ford, D. L. Sparks, J. Colloid Interface Sci. 2003, 263,
364.
[71] X. C. Liu, E. W. Shi, Z. Z. Chen, B. Y. Chen, W. Huang, L. X. Song, K. J.
Zhou, M. Q. Cui, Z. Xie, B. He, S. Q. Wei, J. Alloys Compd.s 2008, 463, 435.
[72] L. N. Nchari, G. A. Hembury, A. M. Beesley, D. J. Meehan, N. Tsapatsaris,
M. Hudson, M. Thomason, S. L. M. Schroeder, 14th International
Conference on X-Ray Absorption Fine Structure (Xafs14), Proceedings 2009,
190.
[73] D. J. Meehan, PhD Thesis, University of Manchester 2009.
[74] V. M. Denisov, Y. P. Kuznetsov, Bulletin of the Academy of Sciences of the
Ussr Division of Chemical Science 1975, 24, 2595.
[75] G. Mahmoud, MSc Dissertation, University of Manchester 2010.
[76] A. Haaland, S. Samdal, R. Seip, J. Org. Chem. 1978, 153, 187.
[77] J. Weston, Organometallics 2001, 20, 713.
[78] A. Haaland, J. C. Green, G. S. McGrady, A. J. Downs, E. Gullo, M. J. Lyall,
J. Timberlake, A. V. Tutukin, H. V. Volden, K. A. Ostby, Dalton Trans.
2003, 4356.
[79] L. S. Kau, D. J. Spirasolomon, J. E. Pennerhahn, K. O. Hodgson, E. I.
Solomon, J. Am. Chem. Soc. 1987, 109, 6433.
[80] J. L. Fulton, M. M. Hoffmann, J. G. Darab, Chem. Phys. Lett. 2000, 330, 300.
[81] J. L. Fulton, M. M. Hoffmann, J. G. Darab, B. J. Palmer, E. A. Stern, J. Phys.
Chem. A 2000, 104, 11651.
[82] T. Jarusuwannapoom, W. Hongroijanawiwat, S. Jitjaicham, L. Wannatong,
M. Nithitanakul, C. Pattamaprom, P. Koombhongse, R. Rangkupan, P.
Supaphol, Eur. Polym. J. 2005, 41, 409.
[83] L. Wannatong, A. Sirivat, P. Supaphol, Polym. Int. 2004, 53, 1851.
[84] M. P. Bertrand, L. Feray, R. Nouguier, P. Perfetti, J. Org. Chem. 1999, 64,
9189.
[85] T. Akindele, K. I. Yamada, K. Tomioka, Acc. Chem. Res. 2009, 42, 345.
[86] F. A. Houle, W. D. Hinsberg, Annual Reports in Computational Chemistry
2006, 2,3.
[87] B. Goldfuss, M. Steigelmann, Journal of Molecular Modeling 2000, 6, 166.
[88] F. Lauterwasser, J. Gall, S. Hofener, S. Brase, Adv. Synth. Catal. 2006, 348,
2068.
[89] S. Brase, S. Dahmen, S. Hofener, F. Lauterwasser, M. Kreis, R. E. Ziegert,
Synlett 2004, 2647.
[90] S. Dahmen, S. Brase, Tetrahedron-Asymmetry 2001, 12, 2845.
[91] S. Dahmen, S. Brase, Org. Lett. 2001, 3, 4119.
[92] M. Kreis, M. Nieger, S. Brase, J. Org. Chem. 2006, 691, 2171.
[93] S. Tanj, A. Ohno, I. Sato, K. Soai, Org. Lett. 2001, 3, 287.
[94] W. J. E. Beek, R. A. J. Janssen, in Hybrid Nanocomposites for
Nanotechnology, Springer US, 2009, pp. 1.
[95] A. Daprano, D. I. Donato, V. Agrigento, J. Solution Chem. 1981, 10, 673.
[96] J. J. Makosz, Acta Phys. Pol. A 1990, 78, 907.
[97] T. Thenappan, U. Sankar, J. Mol. Liq. 2006, 126, 38.
[98] A. Lennartson, A. Hedstrom, M. Hakansson, Acta Crystallographica Section
E-Structure Reports Online 2007, 63, M123.
230
[99] P. Obrien, M. B. Hursthouse, M. Motevalli, J. R. Walsh, A. C. Jones, J. Org.
Chem. 1993, 449, 1.
[100] D. G. Blackmond, M. Klussmann, Aiche Journal 2007, 53, 2.
[101] R. Plasson, H. Bersini, A. Cornmeyras, Proc. Natl. Acad. Sci. U. S. A. 2004,
101, 16733.
[102] K. Soai, I. Sato, T. Shibata, Chemical Record 2001, 1, 321.
[103] P. D. Bailey, Journal of the Chemical Society-Chem. Commun.1995, 1797.
[104] Y. Park, S. Kim, J. H. Lee, D. H. Jung, C. C. Wu, J. Park, Organic
Electronics 2010, 11, 864.
[105] Y. Tanaka, T. Ishisaka, A. Inagaki, T. Koike, C. Lapinte, M. Akita,
Chemistry-a European Journal 2010, 16, 4762.
[106] Y. Y. Wang, X. X. Gong, L. Y. Dai, Chinese J. Org. Chem. 2009, 29, 1470.
[107] A. Dhakshinamoorthy, M. Alvaro, H. Garcia, Adv. Synth. Catal., 352, 711.
[108] K. Mogilaiah, T. K. Swamy, A. V. Chandra, N. Srivani, K. Vidya, Indian J.
Chem., Sect. B: Org. Chem. Incl. Med. Chem., 49, 382.
[109] C. E. Sabel, J. L. Shepherd, S. Siemann, Anal. Biochem. 2009, 391, 74.
[110] A. de Meijere, S. I. Kozhushkov, A. A. Fokin, I. Emme, S. Redlich, P. R.
Schreiner, Pure Appl. Chem. 2003, 75, 549.
[111] R. V. Muralidhar, R. R. Chirumamilla, R. Marchant, V. N. Ramachandran, O.
P. Ward, P. Nigam, World Journal of Microbiology & Biotechnology 2002,
18, 81.
[112] C. Orrenius, F. Haeffner, D. Rotticci, N. Ohrner, T. Norin, K. Hult, Biocatal.
Biotransform. 1998, 16, 1.
[113] C. Bergquist, H. Storrie, L. Koutcher, B. M. Bridgewater, R. A. Friesner, G.
Parkin, J. Am. Chem. Soc. 2000, 122, 12651.
[114] N. S. Lebedeva, N. A. Pavlycheva, E. V. Parfenyuk, A. I. Vyugin, J. Chem.
Thermodyn. 2006, 38, 165.
[115] S. Dahmen, S. Brase, J. Am. Chem. Soc. 2002, 124, 5940.
[116] S. Hofener, F. Lauterwasser, S. Brase, Adv. Synth. Catal. 2004, 346, 755.
[117] J. A. Marafie, J. D. Moseley, Org Biomol Chem 2010, 8, 2219.
[118] P. Galzerano, D. Agostino, G. Bencivenni, L. Sambri, G. Bartoli, P.
Melchiorre, Chemistry 2010, 16, 6069.
[119] X. Wang, Y. Zhang, H. Tan, Y. Wang, P. Han, D. Z. Wang, J. Org. Chem.
2010, 75, 2403.
[120] J. Xia, R. H. Qiu, S. F. Yin, X. W. Zhang, S. L. Luo, C. T. Au, K. Xia, W. Y.
Wong, J. Org. Chem. 2010, 695, 1487.
[121] M. L. McIntosh, C. M. Moore, T. B. Clark, Org. Lett. 2010, 12, 1996.
[122] T. Arai, A. Mishiro, N. Yokoyama, K. Suzuki, H. Sato, J. Am. Chem. Soc.
2010, 132, 5338.