in Network Infrastructure Public Policies and Investment policies and investment in network... ·...
25
From: OECD Journal: Economic Studies Access the journal at: http://dx.doi.org/10.1787/19952856 Public Policies and Investment in Network Infrastructure Douglas Sutherland, Sónia Araújo, Balázs Égert, Tomasz Kozluk Please cite this article as: Sutherland, Douglas, et al. (2011), “Public Policies and Investment in Network Infrastructure”, OECD Journal: Economic Studies, Vol. 2011/1. http://dx.doi.org/10.1787/eco_studies-2011-5kg51mlvk6r6
Transcript of in Network Infrastructure Public Policies and Investment policies and investment in network... ·...

From:OECD Journal: Economic Studies
Access the journal at:http://dx.doi.org/10.1787/19952856
Public Policies and Investmentin Network Infrastructure
Douglas Sutherland, Sónia Araújo, Balázs Égert, Tomasz Kozluk
Please cite this article as:
Sutherland, Douglas, et al. (2011), “Public Policies and Investmentin Network Infrastructure”, OECD Journal: Economic Studies, Vol.2011/1.http://dx.doi.org/10.1787/eco_studies-2011-5kg51mlvk6r6

This document and any map included herein are without prejudice to the status of orsovereignty over any territory, to the delimitation of international frontiers and boundaries and tothe name of any territory, city or area.

OECD Journal: Economic Studies
Volume 2011
© OECD 2011
161
Public Policies and Investment in Network Infrastructure
byDouglas Sutherland, Sónia Araújo, Balázs Égert and Tomasz Koźluk*
How can public policy influence investment in infrastructure in network industries?Network industries rely mainly on fixed networks to deliver services, withinvestment being lumpy and largely irreversible. As a result, public policies – suchas public provision, the introduction of competition and the regulatory environment– can potentially have an important impact on investment behaviour, with the neteffect depending on the extent that policies boost socially-productive investment orreduce inefficient investment. Drawing on responses to a unique questionnaireassessing public policy in the network sectors, the information in this paper presentsa systematic picture of relevant policies in place across OECD countries. Econometricanalysis – both at the sectoral and firm level – finds that public policies can havesignificant quantitative effects. In particular, the introduction of competitivepressures through the reduction of barriers to entry and the combination ofregulator independence and incentive regulation can promote investment in thesector.
JEL Classification: H40, L90, O40, Q48
Keywords: Infrastructure, growth, network industries, investment, regulation
* Douglas Sutherland ([email protected]), Sónia Araújo ([email protected]), Balázs Égert([email protected]) and Tomasz Koźluk ([email protected]). The authors were all members ofthe OECD Economics Department at the time the article was written. The authors are indebted toJørgen Elmeskov, Jean-Luc Schneider, Giuseppe Nicoletti, Fabio Schiantarelli, Giuseppe Berlingieri,Vincenzo Spiezia, José Enriqué Garcilazo and Irene Sinha. The opinions expressed in this paper arethose of the authors.

PUBLIC POLICIES AND INVESTMENT IN NETWORK INFRASTRUCTURE
OECD JOURNAL: ECONOMIC STUDIES – VOLUME 2011 © OECD 2011162
How can public policy influence investment in infrastructure in network industries?
Over the past few decades, the provision of infrastructure has undergone profound
changes. The public sector was often responsible for provision, but over time, given the
combination of privatisation, technological change and the development of new
contracting techniques coupled with the establishment of independent regulatory
authorities, private provision accounts for an increasingly large share of total investment.
This raises questions about how the emerging institutional frameworks affect incentives to
investment in infrastructure.
In order to address these questions, the analysis in this paper focuses on
infrastructure in energy, water, transport and communications. These sectors are chosen
not only because of their importance to the economy, but because they rely mainly on fixed
networks to deliver their services, with investment in infrastructure assets being lumpy
and largely irreversible. As there are elements of natural monopoly and market failure,
public policies are often important. Addressing market failure has been a major motive for
public intervention in infrastructure provision, intending to prevent the under-provision or
non-provision of infrastructure, when externalities or public good features are
predominant, or to limit the exercise of market power to the extent to which a natural
monopoly is present.
Where supply entails a natural monopoly, as is typical in the network industries, the
private sector will usually be willing to provide the service, though normally at a level that
is below, and a price that is above, the social optimum. This will often result in some type
of arm’s length regulation. Investment will depend on standard investment determinants,
such as the cost of capital, but due to the often extremely large fixed costs and the
irreversibility of investment decisions, investment decisions are also particularly sensitive
to the regulatory environment. As a result, direct public provision, the introduction of
competition and the regulatory environment can potentially have an important impact on
investment behaviour.
Despite the rationales for public provision to counter under-provision of
infrastructure, the move towards greater private provision and more independent
regulatory regimes does not necessarily imply lower investment levels. By better aligning
incentives for investment and reducing uncertainty stemming from regulatory risk, the
innovations seen in recent decades could provide a spur for investment.
The empirical literature assessing the impact of policies on investment has faced a
number of difficulties. Data limitations on the diversity of policies in place make it difficult
to measure the impact of a particular policy on investment for an individual sector yet
alone across a number of sectors. Researchers are often better able to examine the impact
of a change in policy through case study evidence or for policies (often a single regulatory
policy) for an individual sector. For example, Edwards and Waverman (2006) find that
greater regulatory independence is important for the telecommunications sector while
Cambini and Rondi (2010) find that investment is higher in firms under incentive
PUBLIC POLICIES AND INVESTMENT IN NETWORK INFRASTRUCTURE
OECD JOURNAL: ECONOMIC STUDIES – VOLUME 2011 © OECD 2011 163
regulation. More aggregate empirical studies have sometimes pooled the data for the
sectors covered and thus say little about how the measured effects differ across sectors. For
example, in time-series regressions using sectoral data, Alesina et al. (2005) noted that
lowering barriers to entry was found to boost the investment rate. The empirical work in
this paper addresses how general some of these types of findings are across different
sectors and also considers interactions between policies.
The structure of the paper is as follows. Section 1 discusses the channels through
which public policy affects infrastructure investment, drawing on responses to a unique
questionnaire on infrastructure investment. Section 2 contains a discussion of the
econometric approaches at sectoral and firm level to assess the impact of public policies on
infrastructure investment, which is followed by a presentation of the results. Finally,
Section 3 concludes.
1. Public policies in the infrastructure sectorsThis section describes how public policies can influence investment behaviour in the
infrastructure sectors and draws on two principal sources of information to describe actual
public policies in OECD countries.1 The first source of information is derived from
responses to the OECD Regulatory Indicators Questionnaires (Wölfl et al., 2009). This is a
regular OECD questionnaire, issued every five years, which is much broader in scope than
infrastructure but contains specific questions on policies for some network sectors. For
example, the questionnaires contain responses on public ownerships, market structure,
barriers to entry and regulator independence for energy, telecommunications and
transportation.
A second source of information on public policies is an ad hoc questionnaire on
infrastructure investment (http://dx.doi.org/10.1787/888932482365) submitted to the OECD
member governments in December 2007. The aim of the questionnaire was to collect
comparable cross-country information, complementing and extending the existing
regulatory indicators. The questionnaire was divided into three sections concerning
regulation (covering regulators and pricing policies), specific questions on concessions and
franchises as well as questions on infrastructure planning and financing.2 The
questionnaire covered the energy (electricity and gas), water supply and sewerage,
transport (railroad, road, water and air transport), and the telecommunication (fixed line,
mobile and internet services) sectors. Respondents were requested to answer reflecting the
regulatory settings at the time of response and not to anticipate changes. When
appropriate, central governments were asked to respond basing their answers on
institutions prevailing in the most representative sub-central governments or a subset of
them that best characterised each country's institutional settings. As with the Regulatory
Indicators Questionnaire, questions typically required a yes/no response.
The questionnaire was quite detailed and despite the burden it imposed, response
rates were relatively good. In total, the questionnaire asked 38 sets of questions, which
taking into account the sectoral coverage implied a possible 1 370 separate responses.
Of the 30 OECD members at the time, 25 countries responded to the questionnaire
(http://dx.doi.org/10.1787/888932482384).3 The section on regulators and pricing policies had
the highest response rate, with all respondents answering questions on the existence of
sectoral regulators, their mandates and competencies. On average for this section, the
response rate for specific questions was 83%. The response rate to the section on pricing

PUBLIC POLICIES AND INVESTMENT IN NETWORK INFRASTRUCTURE
OECD JOURNAL: ECONOMIC STUDIES – VOLUME 2011 © OECD 2011164
policies was 75%. Three-quarters of countries responded that they used concessions and
franchises, though for the specific questions in this section the response rate sometimes
dropped to 50%, often due to limited sectoral coverage. Finally, the response rate for the
section on investment planning was around 60% while response rates to specific questions
on public-private partnerships (PPPs) were around two-fifths, though conditional on the
countries having noted experience of using PPPs the response rate rose to around one-half.
1.1. Public ownership and provision
There are a number of different delivery modes involving the public or private sector
to a greater of lesser extent. These include public ownership and procurement, which has
often characterised the water supply and road networks; concessions and public private
partnerships, which are increasingly involving the private sector in the delivery of
infrastructure; and fully privately-owned companies, which has often been the case in the
energy sector. Until the late 1980s, public ownership was the dominant ownership form for
many network industries. According to OECD indicators, public ownership only declined in
importance in some of them quite recently (Figure 1). In the water sector, which is not
covered by these indicators, public ownership characterised the ownership structure in
two-thirds of OECD countries quite recently (OECD, 2004).
The decline of public ownership partly reflects recognition among OECD governments
that it can contribute to inefficient investment in infrastructure. For instance,
overinvestment may occur as public managers engage in “empire building” behaviour to
strengthen their support with the politicians who appointed them (e.g. by expanding
capacity and employment in public enterprises). Indeed, some telecom operators cut back
ambitious plans to expand fibre-optic networks in the wake of privatisation. At the other
extreme, underinvestment may occur, if public authorities pay insufficient attention to the
long-term benefits of investment in a context of fiscal pressures. Public investment may
also lead to the misallocation of resources across regions and sectors. For example,
policymakers may allocate resources to a given region or project at the expense of other
potentially higher return investments in more deserving regions or projects (Cadot et al.,
2006; Castells and Solé-Ollé, 2005). Investment may also be allocated sub-optimally over
time if it is allowed to be influenced by the electoral cycle.
Public ownership can also create disincentives for privately-operated firms to invest in
network industries. First, the lack of a level playing field – often due to the state-owned
company’s soft budget constraint – is a disincentive for private firms to invest. Second,
there may be confusion between the role of the state as the regulator and owner, which
serves to amplify regulatory discretion and risk (this is discussed below). Finally, state
ownership can be a de facto barrier to foreign direct investment.
Against this background, private sector provision has become increasingly attractive.
First, in some sectors – such as telecoms and electricity – the extent of the natural
monopoly element has been redefined, in part as a result of technical progress or as a
result of sunk costs having already been incurred, opening the door to competitive private
provision. Second, refinements in regulatory techniques (see below) have made “arm’s
length” regulation of private providers of infrastructure more desirable than direct public
provision. Similarly, new contracting techniques were designed, which made contracting
out of infrastructure provision more attractive than in the past. Finally, particularly in the
presence of mature networks, specific distributional objectives were often found to be
more efficiently achieved by other mechanisms, such as targeted social transfers.

PUBLIC POLICIES AND INVESTMENT IN NETWORK INFRASTRUCTURE
OECD JOURNAL: ECONOMIC STUDIES – VOLUME 2011 © OECD 2011 165
1.2. Unbundling and market structure
Greater private provision and competitive pressures for efficient infrastructure
investment can also be introduced through the unbundling of the natural monopoly
elements of networks. The implications of vertical separation and of the ownership of the
“core” network (the particular segment that is a natural monopoly also sometimes termed
“essential facility”) are important for investment. An attraction of coupling entry liberalisation
in competitive markets with vertical separation of the network industries is that the
private sector will determine the appropriate level of investment in the competitive
Figure 1. The declining importance of public ownership in network utilitiesScale 0-6 from lowest to highest degree of public ownership
Note: These plots display the box that covers the observations between the 1st and 3rd quartiles, as well as themedian (the horizontal bar) and the mean (the point). The whiskers extending from the box give the range thatcaptures the observations which lie within 1.5 times the inter-quartile range from the 1st and 3rd quartiles. Pointsoutside this range are considered outliers, which are marked by an asterisk.The sample coverage is the same for each period. For electricity the countries included are: Australia, Austria,Belgium, Canada, Czech Republic, Denmark, Finland, France, Germany, Greece, Hungary, Iceland, Ireland, Italy, Japan,Korea, Luxembourg, Netherlands, New Zealand, Norway, Mexico, Poland, Portugal, Slovak Republic, Spain, Sweden,Switzerland, Turkey, United Kingdom, United States. For gas, the country coverage is the same as electricity with theexception of the Slovak Republic. For rail the country coverage is the same as electricity with the exception of Iceland.For telecoms the country coverage is the same as electricity with the exception of Iceland and Luxembourg.In the rail and telecommunication utilities, public ownership was predominant until the early 1990s in almost allcountries.
Source: Regulatory indicators questionnaire.
1977 1982 1987 1992 1997 2002 2007
6
5
4
3
2
1
0
1977 1982 1987 1992 1997 2002 2007
6
5
4
3
2
1
0
1977 1982 1987 1992 1997 2002 2007
6
5
4
3
2
1
0
1977 1982 1987 1992 1997 2002 2007
6
5
4
3
2
1
0
Electricity
Rail
Gas
Telecoms

PUBLIC POLICIES AND INVESTMENT IN NETWORK INFRASTRUCTURE
OECD JOURNAL: ECONOMIC STUDIES – VOLUME 2011 © OECD 2011166
segment of the industry. For example, while a vertically-integrated firm may innovate,
particularly if there are first mover advantages and the market is contestable, more
competition creates incentives to expand capacity and may give sharper incentives to
invest in cost-saving technologies and organisational forms (as observed, for instance, in
the development of low-cost air transport and innovations in mobile telephony after
liberalisation). However, appropriate ownership and regulatory settings would still be
needed to ensure an efficient level of investment in the core network.
The argument for retaining a vertically-integrated firm largely depends on the loss of
economies of scale and scope and possible co-ordination problems and higher transaction
costs in a vertically separated industry. In some sectors, such as mature electricity and gas
networks, these factors are not crucial, supporting their unbundling, which was
implemented especially in the electricity sector of OECD countries over the past decade. In
the case of railroads a large range of options exist across the OECD, running from vertically-
integrated public enterprises to vertically-separated private companies. In this sector, the
problems created by vertical separation are arguably severe. Train operating companies are
relatively unconcerned with lowering high marginal costs for the network operator, and
the network operator – not benefitting from higher revenue from train operators – has little
incentive to improve its services. Not only may this constellation of incentives lead to
under provision of rail track services, some studies suggest that the resulting losses of
economies of scope increase production costs by between 20% and 40% when the sector is
fully separated (OECD, 2006).
In some parts of the network industries, there may be reasons for maintaining a
vertically-integrated firm, such as allowing facilities-based competition to emerge in the
long run while allowing service-based competition in the short run to create pressure to
increase cost efficiency (in parts of telecommunication networks, for example). In this
case, the network operator provides wholesale services to downstream competitors, which
may blunt incentives to invest in quality (Auriol, 1998). The resulting regulatory problems
are severe, and firms need careful monitoring to prevent the exercise of market power with
care also needed in setting the appropriate access regime and price as this is complicated
by the firm operating in both regulated and unregulated markets (see below).
When vertical separation is desirable, a central question concerns the ownership
structure of the core network. Countries differ markedly with respect to different
organisational forms. In the electricity sector, for example, the electricity transmission grid
is privately owned and operated in the United Kingdom and Germany, privately owned and
operated by an independent company in some parts of the United States, state-owned and
run by an independent company in Italy and state owned and operated by a state-owned
enterprise in the Netherlands. In some cases, the regulatory authorities have mandated
that the “essential facility” be operated by a different entity than a user (to prevent
foreclosure). The different types of organisational forms have potentially different
consequences for investment (OECD, 2001).4
● Accounting and legal separation: Formal separation has generally been insufficient to
change the behaviour of the incumbent, often amounting to de facto vertical integration,
and does little to relieve the regulator’s burden in determining the appropriate level of
investment. For example, in the early 1990s, the UK competition authorities found that a
greater degree of separation was desirable for British Gas, then a vertically integrated gas

PUBLIC POLICIES AND INVESTMENT IN NETWORK INFRASTRUCTURE
OECD JOURNAL: ECONOMIC STUDIES – VOLUME 2011 © OECD 2011 167
company. Accounting and legal separation characterises industry structures in energy,
rail and telecommunications in many EU countries that implemented the minimum
requirements set by EU directives.
● Operation separation: This occurs when an independent entity controls the non-
competitive component. A key element is whether this entity should be allowed to
generate profits. If the governing entity has no interest in the profitability of the non-
competitive component it may have little incentive for efficient and innovative
investment in the non-competitive activity. Operational separation is a form used in the
US electricity industry. But in the United States, electricity retailing companies have
complained that (operationally-separate) transmission companies have not been
responsive to changes in demands nor innovative (OECD, 2001).
● Ownership separation: In this case, the owner of the network will not discriminate among
users and thus many of the competition problems that can arise in other organisational
structures are mitigated. An example is the National Grid in the United Kingdom. In the
absence of co-ordination problems, creating appropriate investment incentives depends
on the regulatory framework and the setting of access prices, which are discussed below.
● Club ownership: Club ownership – when the core network is owned by a consortium of
firms using the network – will help align incentives for network operators and
downstream competitors. However, when the number of downstream competitors is
small, collusion and foreclosure may result and when the number of competitors is large
there may be principal-agent problems. Many EU countries have chosen club ownership
between the major airlines and the slot allocation function at major airports or for
electricity transmission in Italy.
1.3. Regulation and other framework conditions
Regulation – which is prevalent in network industries – and other framework
conditions will play an important role in investment decision making through their effect
on determining the return on investment as well as ensuring efficient use and expansion
of infrastructure through the effects of pricing. This section discusses how these policies
can be designed to support such incentives, considering in turn institutional arrangements
for the regulator, network access conditions and the pricing regime.
An important factor affecting investment in regulated network industries is the nature
of the regulator. The regulator faces potential difficulties both in its relations with the
government and the sector it is regulating – including political and private interest
pressures – as well as problems related with lack of credibility and asymmetries of
information (OECD, 2005). Ensuring the regulator’s independence is central to preventing
regulatory capture and enhances the stability and credibility of the regulatory framework,
in a context where accountability to the government, the legislature and consumers should
nonetheless be preserved. To facilitate independence, desirable features for the regulator’s
operation include providing a legal mandate (including criteria and procedures for over-
ruling decisions), ensuring the regulator is separated and autonomous from the
government, and defining how appointments and dismissals of regulators are to take place
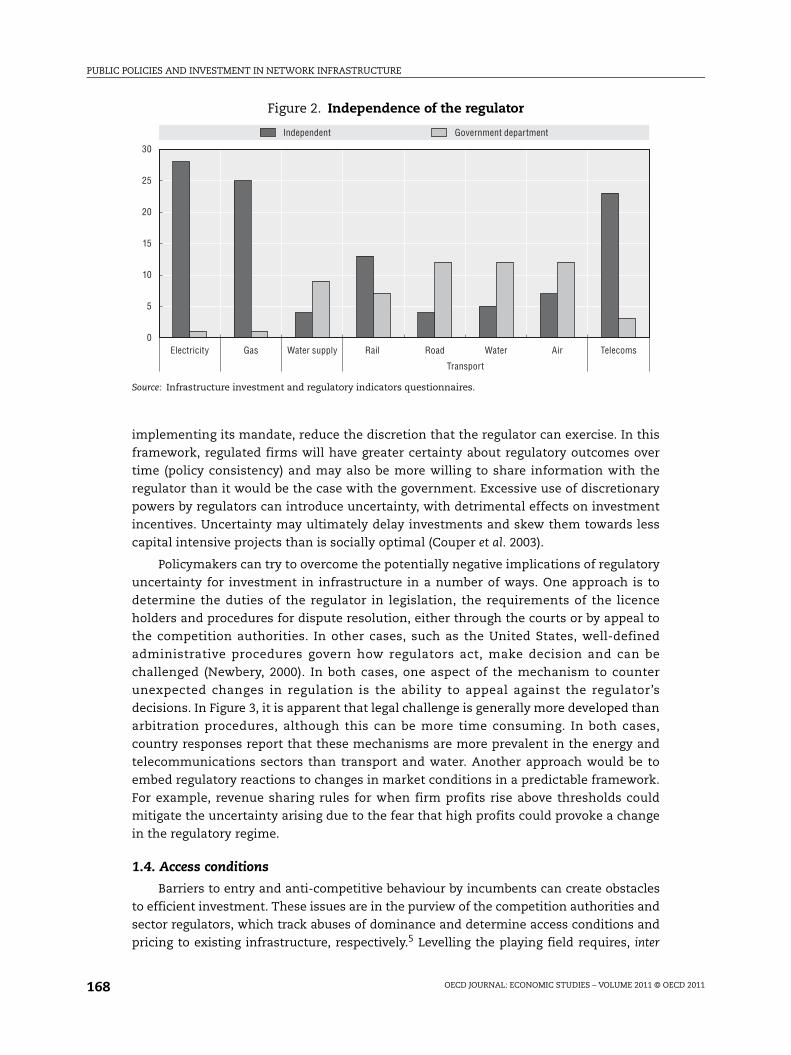
to minimise the possibility for pressure being applied to members. As can be seen in
Figure 2, regulator independence across sectors varies substantially.
When it is appropriately designed, regulatory independence should help both
improve the quality of regulation and, by holding the regulator accountable for
PUBLIC POLICIES AND INVESTMENT IN NETWORK INFRASTRUCTURE
OECD JOURNAL: ECONOMIC STUDIES – VOLUME 2011 © OECD 2011168
implementing its mandate, reduce the discretion that the regulator can exercise. In this
framework, regulated firms will have greater certainty about regulatory outcomes over
time (policy consistency) and may also be more willing to share information with the
regulator than it would be the case with the government. Excessive use of discretionary
powers by regulators can introduce uncertainty, with detrimental effects on investment
incentives. Uncertainty may ultimately delay investments and skew them towards less
capital intensive projects than is socially optimal (Couper et al. 2003).
Policymakers can try to overcome the potentially negative implications of regulatory
uncertainty for investment in infrastructure in a number of ways. One approach is to
determine the duties of the regulator in legislation, the requirements of the licence
holders and procedures for dispute resolution, either through the courts or by appeal to
the competition authorities. In other cases, such as the United States, well-defined
administrative procedures govern how regulators act, make decision and can be
challenged (Newbery, 2000). In both cases, one aspect of the mechanism to counter
unexpected changes in regulation is the ability to appeal against the regulator’s
decisions. In Figure 3, it is apparent that legal challenge is generally more developed than
arbitration procedures, although this can be more time consuming. In both cases,
country responses report that these mechanisms are more prevalent in the energy and
telecommunications sectors than transport and water. Another approach would be to
embed regulatory reactions to changes in market conditions in a predictable framework.
For example, revenue sharing rules for when firm profits rise above thresholds could
mitigate the uncertainty arising due to the fear that high profits could provoke a change
in the regulatory regime.
1.4. Access conditions
Barriers to entry and anti-competitive behaviour by incumbents can create obstacles
to efficient investment. These issues are in the purview of the competition authorities and
sector regulators, which track abuses of dominance and determine access conditions and
pricing to existing infrastructure, respectively.5 Levelling the playing field requires, inter
Figure 2. Independence of the regulator
Source: Infrastructure investment and regulatory indicators questionnaires.
30
25
20
15
10
5
0
Independent Government department
Rail Road Water AirElectricity Gas Water supply Telecoms
Transport

PUBLIC POLICIES AND INVESTMENT IN NETWORK INFRASTRUCTURE
OECD JOURNAL: ECONOMIC STUDIES – VOLUME 2011 © OECD 2011 169
alia, liberalising entry through vertical separation, where appropriate, and introducing
regulated third-party access. In OECD economies there has been substantial progress in
implementing such policies and removing other barriers to entry (Figure 4).
● This is particularly the case in telecommunications during the 1990s, when most legal
restrictions were lifted on both fixed and wholesale services. On average in 2007, the
market share of new entrants in mobile telephony exceeded 50%, with only Mexico
noticeably lower. For international calls, new entrants’ market share was slightly less on
average at around two-fifths with progress in opening up this market much slower in
some countries, such as Turkey and the Slovak Republic.
● Substantial easing of entry barriers also occurred in the electricity sector, where in 2007
almost all countries had implemented regulated third-party access (TPA), with only
Germany and Switzerland using negotiated TPA and Mexico without a TPA regime at all.
Furthermore only a handful of countries – Japan, Korea, Mexico, Switzerland and the
United States – permit vertically-integrated firms in the electricity sector. However,
bottlenecks in interconnection capacity restrain new entry.
● Progress in the gas sector has been less dramatic, but barriers to entry have begun to fall.
In the gas sector, both vertically-integrated firms and negotiated third-party access are
more common than in the electricity sector. In many countries storage remains largely
dominated by incumbents and bottlenecks in interconnection capacity restrains new
entry.
● In rail, where reforms have tended to be more recent, few countries have implemented
full vertical unbundling possibly recognising the severe co-ordination problems that can
arise. Reforms when they have occurred have tended to be for freight rather than
passenger transport. However, most countries have imposed legal or accounting
separation.
Rules that determine the access conditions to the core network and its pricing have
particularly important implications for infrastructure utilisation and investment. Regulated
Figure 3. Dispute settlement with the regulator
Source: Infrastructure investment questionnaire.
25
20
15
10
5
0
Yes No
Number of responding countries
Electr
icity Gas
Water
RailRoa
d
Water t
ransp
ort
Air
Telec
oms
Electr
icity Gas
Water
RailRoa
d
Water t
ransp
ort
Air
Telec
oms
Arbitration procedures exist Legal challenge is possible

PUBLIC POLICIES AND INVESTMENT IN NETWORK INFRASTRUCTURE
OECD JOURNAL: ECONOMIC STUDIES – VOLUME 2011 © OECD 2011170
or negotiated third-party access (TPA) regimes have been established in OECD countries, with
regulated access being considered the most favourable to the development of competition in
unregulated services. The effects of these regimes on infrastructure investment are
intimately related to dispute resolution in the case of negotiated TPA and the terms of access
conditions in the case of regulated TPA. In some cases, such regulations have been waived or
adapted in energy markets where security-of-supply considerations are important.
Where facilities-based competition is viable, such as with airports and maritime ports
and mobile telecommunications, ensuring a level playing field through appropriate
competition policy enforcement is crucial to encouraging efficient infrastructure
investment. Moreover, when the incumbent remains vertically integrated, but competition
Figure 4. Barriers to entryScale 0-6 from lowest to highest degree of barriers to entry
Note: These plots display the box that covers the observations between the 1st and 3rd quartiles, as well as themedian (the horizontal bar) and the mean (the point). The whiskers extending from the box give the range thatcaptures the observations which lie within 1.5 times the inter-quartile range from the 1st and 3rd quartiles. Pointsoutside this range are considered outliers, which are marked by an asterisk.The sample coverage is the same for each period. For electricity and telecoms the countries included are: Australia,Austria, Belgium, Canada, Czech Republic, Denmark, Finland, France, Germany, Greece, Hungary, Iceland, Ireland,Italy, Japan, Korea, Luxembourg, Netherlands, New Zealand, Norway, Mexico, Poland, Portugal, Spain, Sweden,Switzerland, Turkey, United Kingdom, United States. For gas and rail the country coverage is the same as forelectricity and telecoms with the exception of Iceland.
Source: Regulatory indicators questionnaire.
1977 1982 1987 1992 1997 2002 2007
6
5
4
3
2
1
0
1977 1982 1987 1992 1997 2002 2007
6
5
4
3
2
1
0
1977 1982 1987 1992 1997 2002 2007
6
5
4
3
2
1
0
1977 1982 1987 1992 1997 2002 2007
6
5
4
3
2
1
0
Electricity
Rail
Gas
Telecoms

PUBLIC POLICIES AND INVESTMENT IN NETWORK INFRASTRUCTURE
OECD JOURNAL: ECONOMIC STUDIES – VOLUME 2011 © OECD 2011 171
in the unregulated sectors is possible, new entrants can face considerable difficulties with
implications for investment:
● Strategic behaviour of a vertically-integrated incumbent can limit access to its regulated
infrastructure for competitors in unregulated upstream or downstream markets by
either foreclosing practices or insufficient expansion (or retention) of capacity.
● Even when the incumbent does not implement anti-competitive practices, new entrants
wishing to invest in infrastructure may still be put at a competitive disadvantage relative
to the incumbent, at least initially. This type of outcome has been a feature of telecom
liberalisation where the incumbent often enjoyed economies of scale or scope.
1.5. Pricing regimes
The decisions of regulatory institutions concerning the desired market structure
(reflecting the degree to which competition is possible), access regimes and pricing play
important roles in determining infrastructure supply and use. In particular, the regulator
often needs to set user costs, access prices or final prices, depending on whether the network
provider is vertically integrated and competition is feasible. Under certain conditions, setting
the price equal to the marginal social cost would be welfare maximising and when the
networks are characterised by constant returns to scale this form of pricing would also cover
investment costs. However, marginal cost pricing will not cover capital and operating costs if
investment is characterised by increasing returns to scale. In this context, subsidisation or
government provision may be warranted when the marginal social benefits arising from
additional infrastructure outweigh the marginal social costs. Alternatively, the regulator may
adopt an alternative pricing structure to cover investment costs. For example, multi-part
tariffs can help preserve pricing that reflects short-run marginal costs while recouping
investment costs (Gans, 2001). In other cases, so-called Ramsey pricing, which allows prices
to vary in line with elasticities of demand for different services, will minimise the welfare
losses arising from deviations from marginal cost pricing. Given the importance of pricing to
investment decisions, the credibility and consistency of the regulatory framework are
important determinants of infrastructure investment.
The regulator will need to set access prices when there is a vertically-separated firm
(such as some electricity transmission grids) and also when service-based competition is
feasible with the vertically-integrated firm (such as in telecommunications). In addition,
when core network providers have monopoly power, the regulator will need to set the final
price (such as in the water sector or operators of toll roads, bridges and tunnels) or a basket
of prices (such as for rail). There are two broad approaches to pricing; either basing prices
on costs (so that prices may change also to reflect the costs of investment) or using
incentive-based pricing policies (where, at least for a period, prices do not vary in response
to investment decisions).
Cost-based pricing – such as rate-of-return regulation – sets prices to cover production
costs and allow a permissible margin, which should allow the firm to recover investment costs
and can specifically relate to the return the firm is allowed to earn on its capital. In ensuring
efficient investment a critical regulatory parameter is the so-called “rate base” on which the
rate of return is calculated. However, measuring costs, particularly the common costs that are
shared across products, is a difficult task. On the whole, the empirical evidence suggests that
the outcome of cost-based regulation has tended to lead to inefficient investment and a slow
rate of technological progress. Cost-based pricing provides limited incentives for the firm to
PUBLIC POLICIES AND INVESTMENT IN NETWORK INFRASTRUCTURE
OECD JOURNAL: ECONOMIC STUDIES – VOLUME 2011 © OECD 2011172
invest in cost-reducing technologies and encourages over-investment if the allowable rate of
return exceeds the cost of capital (Averch and Johnson, 1962). Over-investment and the
ensuing excess capacity may also be used as a strategic tool to deter potential entrants. Starkie
(2006) reports evidence of this happening in the European gas industry and in the UK airport
sector. Finally, firms have often continued to depend on government subsidies because of the
poor incentives to eliminate inefficiencies.
Against the background of the difficulties in determining costs and the specific rate of
return, incentive-based pricing regimes – such as price caps – have gained popularity and often
accompanied deregulation and privatisation. In its most basic form of a price cap, prices are set
with no explicit consideration of a specific rate of return. The underlying idea is to give firms
“high-powered” incentives to invest in cost-saving technology and at the same time simulate
competitive conditions which constrain firms’ monopoly profits in the long run. To this end,
the regulator specifies a price basket that is allowed to increase in line with an exogenous
measure of input costs minus a pre-determined factor reflecting expected efficiency gains,
possibly allowing as well for expected increases in quality of service. Price cap reviews are
made at regular intervals and, when they are not too frequent, this price regime creates
incentives for firms to engage in long-term cost-reducing investment.
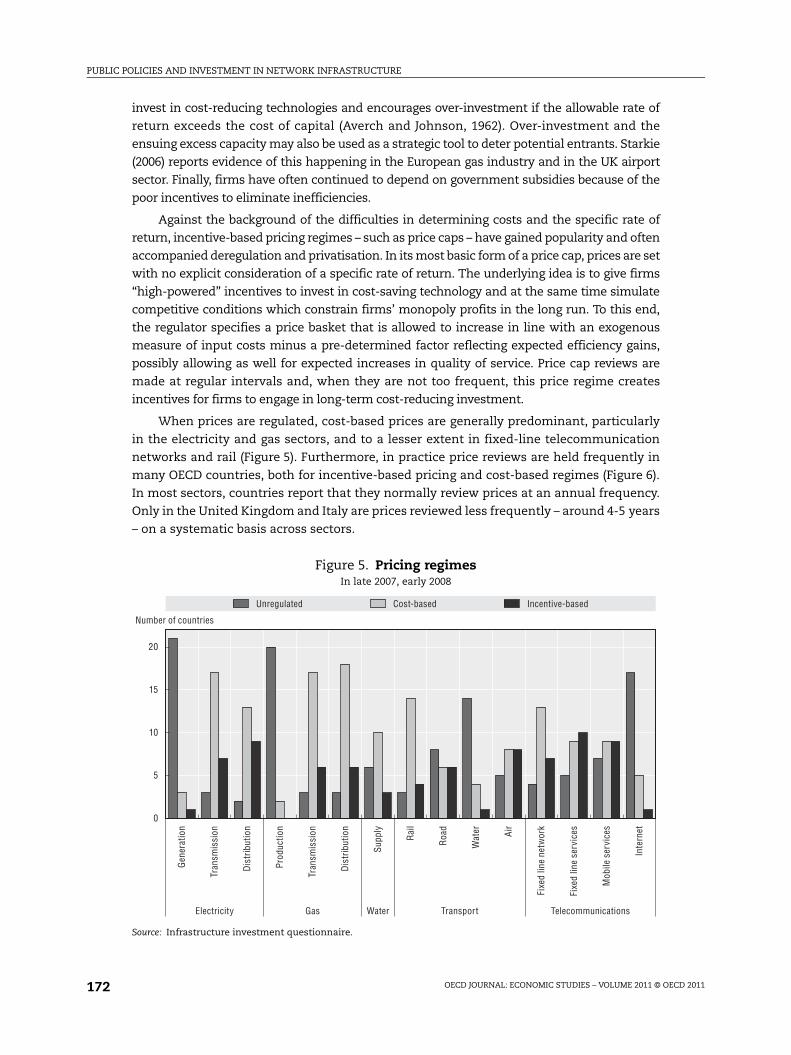
When prices are regulated, cost-based prices are generally predominant, particularly
in the electricity and gas sectors, and to a lesser extent in fixed-line telecommunication
networks and rail (Figure 5). Furthermore, in practice price reviews are held frequently in
many OECD countries, both for incentive-based pricing and cost-based regimes (Figure 6).
In most sectors, countries report that they normally review prices at an annual frequency.
Only in the United Kingdom and Italy are prices reviewed less frequently – around 4-5 years
– on a systematic basis across sectors.
Figure 5. Pricing regimesIn late 2007, early 2008
Source: Infrastructure investment questionnaire.
20
15
10
5
0
Number of countries
Unregulated Cost-based Incentive-based
Gen
erat
ion
Tran
smis
sion
Dis
trib
utio
n
Prod
uctio
n
Tran
smis
sion
Dis
trib
utio
n
Supp
ly
Rai
l
Roa
d
Wat
er Air
Fixe
d lin
e ne
twor
k
Fixe
d lin
e se
rvic
es
Mob
ile s
ervi
ces
Inte
rnet
Electricity Gas Water Transport Telecommunications

PUBLIC POLICIES AND INVESTMENT IN NETWORK INFRASTRUCTURE
OECD JOURNAL: ECONOMIC STUDIES – VOLUME 2011 © OECD 2011 173
In comparison with cost-based regulation, incentive regulation shifts some risk from
consumers to the shareholders and consequently raises the riskiness and the cost of
capital of the regulated firm. The implications are that if the regulated firm is not allowed
to earn a return on its capital that incorporates the higher risk the regulated firm faces, it
may tend to under-invest relative to a cost-based regime. Alexander and Irwin (1996) show
that a measure of volatility of a firm’s returns is higher for firms subject to price caps and
imply higher costs of capital of about 1 percentage point than a firm subjected to rate-of-
return regulation. An additional problem with incentive-based pricing is that quality may
be compromised. A price cap that does not account for quality changes can give incentives
to reduce quality (Vogelsang, 2003). Generally, case studies suggest that incentive pricing
can help the adoption of cost-saving technology. For example, a review of the effects of
incentive regulation on investment reported that price-cap incentive regulation may have
spurred investment in the telecommunications sector (Kridel et al. 1996; Guthrie, 2006).
However, the overall impact on the investment rate is a priori uncertain.
With respect to prices set at the price reviews, the central challenge for investment is
to ensure that it encourages efficient use of scarce network capacity while at the same time
preserving incentives to maintain quality and expand capacity where appropriate. In
practice, regulators can adopt a number of approaches to setting access prices. Setting the
wrong price and access conditions can run the risk of inefficient utilisation, which in turn
can generate either over or under-investment:
● Not only may excessively high access prices induce the incumbent to overspend to
develop its own infrastructure, but they may also encourage new entrants to over-invest
in alternative networks to bypass the existing infrastructure. While bypass is potentially
a serious threat in telecommunications it is less so in other industries such as water and
Figure 6. Frequency of price reviewsIn late 2007, early 2008
Source: Infrastructure investment questionnaire.
9
8
7
6
5
4
3
2
1
0
Annual Longer
Number of countries
Gen
erat
ion
Tran
smis
sion
Dis
trib
utio
n
Prod
uctio
n
Tran
smis
sion
Dis
trib
utio
n
Supp
ly
Pass
enge
r
Frei
ght
Infr
asrt
uctu
re
Roa
d
Wat
er Air
Fixe
d lin
e ne
twor
k
fixed
line
ser
vice
s
Mob
ile s
ervi
ces
Inte
rnet
Electricity Gas Water Rail Transport Telecommunications

PUBLIC POLICIES AND INVESTMENT IN NETWORK INFRASTRUCTURE
OECD JOURNAL: ECONOMIC STUDIES – VOLUME 2011 © OECD 2011174
sewerage and railroads where the sunk costs of duplicating the network are extremely
high.
● Setting prices too low leads to underinvestment for opposite reasons and by preventing
the incumbent from recovering investment costs, depresses its investment activity.
Furthermore, if the access charge is determined without taking into account the option
value of delaying investment by potential new entrants, the net present value of using
the incumbent’s network is higher than building a competing network (Crandall,
Ingraham and Singer, 2004).
● Low access prices may also have spillover effects on investment in the upstream or
downstream markets. For example, if the services provided by train operators depend on
the quality of the railroad network, a lack of investment in the network will tend to
depress train operators’ investment. Strategic co-operation between the network
operator and the train operators may provide a way out.
2. Econometric approach and resultsThis section first describes the econometric approach and the associated results at the
sectoral level and then at the firm level (Egert, 2009; Araújo, 2011). In both cases, the data
that complement the responses to the infrastructure questionnaire are also described. The
sectoral level analysis concentrates on the importance of regulatory independence and the
associated pricing regime, whereas the firm-level analysis looks at other aspects of the
regulatory environment.
2.1. Sectoral level
As questionnaire responses only provide a snapshot of regulation in late 2007 and
early 2008, the data on the type of regulatory and pricing regime do not have a time
dimension. For this reason, only cross-sectional regressions are carried out in the analysis
(with sectoral investment being the dependent variable). For the sectoral-level analysis,
investment data for energy and water (electricity, gas and water), transportation (rail, road, and
water and air transportation) and telecommunications were available for 13 countries (Austria,
Belgium, Denmark, Finland, France, Germany, Italy, Japan, Netherlands, Norway, Portugal,
United Kingdom and the United States). Data were available for 1995-2006 and non-
overlapping 6-year averages were computed. The investigation of investment determinants
uses an investment equation with sectoral investment as a ratio to gross value added. The
estimations use both country fixed effects and then industry fixed effects as well as the
explanatory variables lagged one period. The structure of the estimated equation is:
(1)
where (ItVA) is the ratio of investment to sectoral value added, (OG) the output gap to
control for business cycle fluctuations, (RIR) the real interest rate to capture the impact of
the cost of capital on investment and (X) variables capturing aspects of the regulatory
environment, (FEC) and (FEI) denote country and industry fixed effects. The regulatory
environment variables include a measure of barriers to entry and public ownership, a
measure of regulatory independence and whether the sector had no price regulation as
well as a variable that captured whether the sector was subject to incentive regulation. The
last variable was also interacted with the regulatory independence variable to assess
t
I
m
Im
country
l
Cl
i
k
jitjjtt
V At
V At F EF E XRIRO GII
11
2
1 1,3131211

PUBLIC POLICIES AND INVESTMENT IN NETWORK INFRASTRUCTURE
OECD JOURNAL: ECONOMIC STUDIES – VOLUME 2011 © OECD 2011 175
whether the consistency in policy stance is important. The regulatory variables as well as
the controls are lagged to address potential endogeneity arising between them and the
investment ratio. An exception is the variable capturing incentive regulation because
observations are only available for the most recent period.
As a robustness check of the simple OLS results, Bayesian model averaging was carried
out. Bayesian averaging is a comprehensive analytical tool to check the extent to which any
given explanatory variable improves the explanatory power of the estimated models when
it is included. In other words, it investigates the probability with which any given variable
would be included in the estimated models. This approach requires the estimation of all
possible combinations of the candidate explanatory variables (of number K) that is usually
quantified as 2K.
Bayesian averaging of classical estimates (BACE) first determines the posterior
probability attributed to each single model Mi that includes the given variable and
conditioned on the underlying dataset y (P(Mi|y)).
(2)
where SSE is the sum of squared residuals, T is the number of observations, k denotes the
number of explanatory variables included in the specific model and K is the number of all
explanatory variables considered. The expression above shows the extent to which any
given model contributes to explaining the dependent variable as compared with the other
models. These expressions are then summed up for the models that contain the variable of
interest to obtain the posterior inclusion probability of this variable.
(3)
where P(Xm|y) is the posterior inclusion probability of a given variable. j denotes the models
that include variable Xm and n equals 2k/2. If the posterior inclusion probability is higher
than the prior inclusion probability, one can conclude that the specific variable should be
included in estimated models. We estimate all possible combinations of the explanatory
variables. In this case, the prior inclusion probability is 0.50.
The posterior mean conditional on inclusion (E(y)) is the average of the individual
OLS estimates weighted by P(Mi|y). Note that the unconditional posterior mean considers
all regressions, even those without the variable of interest. Hence, the unconditional
posterior mean of any given variable can be derived as the product of the conditional
posterior mean and the posterior inclusion probability. The posterior variance of (Var( y))
can be calculated as follows:
(4)
The posterior mean and the square root of the variance (standard error) conditional on
inclusion can be used to obtain t-statistics and to determine the significance of the
individual variables upon inclusion.
Investment data are obtained from the OECD’s STAN and SNA (Sectoral National
Accounts) database. These two databases have two serious shortcomings. Firstly, the level
of disaggregation is limited to three broad categories: first, electricity, gas and water
K
i
j
i
Ti
ki
Ti
ki
i
SSETMP
SSETMPyMP
2
1
2/2/
2/2/
)(
)()(
n
j
i
Ti
ki
Tj
kj
m K
i
j
SSETMP
SSETMPyXP
1 2
1
2/2/
2/2/
)(
)()(
KK
jjjj
jj yEyMPMyVaryMPyVar
2
1
22
1))(ˆ) ((),()()(

PUBLIC POLICIES AND INVESTMENT IN NETWORK INFRASTRUCTURE
OECD JOURNAL: ECONOMIC STUDIES – VOLUME 2011 © OECD 2011176
supply; second, transportation (road, rail, water, air and associated storage); and third,
telecommunications (which also includes postal services). Secondly, the capital stock data
needed to calculate the investment-to-capita stock ratio are available only for a limited
number of OECD countries and are not fully comparable across countries. In principle, one
could compute capital stock series using investment flows and the perpetual inventory
method, but these estimates are extremely sensitive to the underlying assumptions. Given
long asset lives, one often still needs an estimate of the value of the capital stock to anchor
the series, which is not readily available. As a result, sectoral value added is used to
construct the investment ratio at the sectoral level. Overall, the sectoral dataset covers
13 countries for the three sectors.
2.2. Sectoral level resultsThe main findings are presented in Table 1. A simple OLS regression shows that three
variables are significantly correlated with investment: these are lagged investment, the
measure of barriers to entry and the interaction term for regulatory independence and
incentive regulation. Barriers to entry are found to influence investment negatively. The
interaction term has a positive coefficient while, when taken separately, regulatory
independence and incentive regulation appear to have no effect on investment. This
suggests that a consistent policy mix is important in underpinning efficient investment
incentives in network industries.
Using questionnaire responses, cross-country industry-level estimations looking at
the effects of different types of price regulation on investment were estimated. The results
suggest that incentive price regulation has a positive impact on investment in
infrastructure only when it is accompanied by an independent regulator. Synergies
between the regulator’s independence and price regimes, for instance, could be enhanced
in the electricity and (parts of) telecommunication sectors if France, Portugal, Spain and
the United Kingdom moved to incentive regulation, while greater independence of the
regulator in the Danish, Japanese and Norwegian telecom sectors could enhance the
effects of the incentive price regulation that is in place.
As a robustness check of the simple OLS results, Bayesian model averaging was carried
out. The measures of barriers to entry and the interaction term combining incentive
regulation with regulatory independence consistently contribute to a better fit of the
model. These results hold both when country and industry fixed effects are used. The
results also reveal that the absence of price regulation is correlated with lower investment,
however this result is sensitive to the inclusion of observations for the United States.
In terms of the economic significance of the results, the estimated coefficient for the
interaction term suggests that reforms can have a large impact on investment. The size of
the coefficient estimates for the different subsamples suggests that on average a one-step
change in the interaction term (e.g. a change that would be slightly smaller than that of
fixed-line telecommunications adopting incentive pricing when the regulator is
independent) would induce an average increase of the investment ratio of 5.3 percentage
points. Given that the observed investment ratios are between 18% and 74%, the impact of
such a reform is potentially sizeable. Similarly, a one-step decrease in the measure of
barriers to entry (which would be somewhat larger than the impact of introducing
regulated third-party access) would be related to an average rise of 1.6 percentage points in
the investment ratio. Given the expected influence of barriers to entry to specific sectors,
these figures likely masks differences across sectors.

PUBLIC POLICIES AND INVESTMENT IN NETWORK INFRASTRUCTURE
OECD JOURNAL: ECONOMIC STUDIES – VOLUME 2011 © OECD 2011 177
2.3. Firm levelFor the firm-level analysis, in order to exploit data which varies over time, the
concentration is on the importance of the independence of the sector regulator and
regulatory indicators (described above). The approach adopted is to estimate the Euler
equation. The estimated equation relates yearly firm investment rates (defined as
investment-to-capital ratios) to one-year-lagged levels of the linear and quadratic
investment rate, cash flow-to-capital ratios, and the user cost of capital. Similarly to Bond
et al. (2003), we introduce the output-to-capital ratio term to account for either non-
constant returns to scale or by monopolistic competition in the product market. The user
cost of capital term in the Euler equation is replaced in the empirical specification by time
effects and firm-specific effects in the estimated regression similarly to Bond et al. (2003).
The Euler equation is then augmented to include variables that attempt to capture specific
features of the regulatory environment faced by firms:
(5)
where I denotes gross investment, K the previous year’s capital stock, Y output, CF cash-
flow, REG is the set of sector specific regulatory indicators, unobserved year fixed effects
and firm-specific fixed effects All variables were lagged once. The analysis does not
Table 1. Sector-level results: Investment equations using OLSand Bayesian model averagingWith country and industry fixed effects
Dependent variable: Investment OLS
Bayesian model averaging
Posterior inclusion probability
Posterior mean and standard error
conditional on inclusion
Lagged investment 0.865*** 1 0.880
(0.161) (0.166)
Real interest rate 0.009 0.654 0.006
(0.006) (0.003)
Barriers to entry –0.046*** 0.998 –0.043
(0.164) (0.012)
Public ownership 0.004 0.151 0.000
(0.010) (0.002)
Regulatory independence –0.026 0.184 –0.004
(0.040) (0.006)
Incentive regulation –0.003 0.141 0.000
(0.019) (0.002)
No price regulation –0.016 0.975 –0.015
(0.010) (0.008)
Independence and incentive regulation interaction term 0.060*** 0.996 0.053
(0.017) (0.014)
Adjusted R-squared 0.741
Regressions run 256
Prior Inclusion probability 0.5
Note: Posterior inclusion probability measures the extent to which any given model contributes to explaining thedependent variable as compared with the other models. Bold figures for the posterior inclusion probability indicatethat it is higher than the prior inclusion probability of 0.5. The posterior mean conditional on inclusion is the meanof the individual OLS estimates weighted by the posterior inclusion probability of the individual models including agiven variable.* denotes significance at the 10% level, ** at the 5% level and *** at the 1% level.
icsticttcsticsticsticsticsicst
REGK
CFKY
KI
KI
KI
1,51,
41,
3
2
1,2
1,1

PUBLIC POLICIES AND INVESTMENT IN NETWORK INFRASTRUCTURE
OECD JOURNAL: ECONOMIC STUDIES – VOLUME 2011 © OECD 2011178
evaluate operating cost or service provision. The equation is estimated using the difference
GMM estimator to control for biases due to unobserved firm-specific effects and
endogenous explanatory variables and is appropriate for dynamic models with many
cross-sections and few time periods.
To allow for firm-level analysis, a panel was constructed of companies operating in
18 OECD economies over the period 1983-2005 in the electricity, gas, rail and telecoms
sectors. Firm-level variables come from the Worldscope (Thomson Financial) database. The
main variables used from the Worldscope database are investment flows, capital stocks,
cash flow and output. Investment flows are obtained from uses of funds accounts, which
contain primary information on additions to fixed capital stocks. Output is proxied by firm
sales and cash-flow by operating profits. The capital stock uses the book value of capital
stock which may be flawed, but given the short history available for firms this measure is
likely to be preferable to a measure derived from the perpetual inventory method.6 The
final dataset is obtained by merging data from the regulatory indicators with the data on
firm-level investment. It results in an unbalanced panel, covering 565 firms operating in the
electricity, gas, railways and telecoms sector in 28 OECD countries over the period 1980-2006.
Summary statistics are presented in Table 2.
2.4. Firm-level results
The results from the first-difference GMM estimations reveal that barriers to entry
have a negative effect on investment when all the sectors are pooled (Table 3), consistent
with the sector-level analysis and also found by Alesina et al. (2005). There is no evidence of
other regulatory framework affecting investment rates in the firm-level pooled-sector
regressions. The sector-specific regressions show a different picture: legal barriers to entry
Table 2. Firm-level summary statistics
Variable N min p25 p50 mean p75 p90 max sd
ELECTRICITY
Investment-to-capital ratio 2 054 0 0.03 0.05 0.08 0.08 0.12 3.8 0.15
Output-to-capital ratio 2 054 0 0.24 0.33 0.6 0.48 0.77 144.9 4.17
Cashflow-to-capital ratio 1 557 –23.97 0.05 0.09 0.08 0.14 0.21 15.09 0.89
IRA 2 160 0 0 0 0.32 1 1 1 0.47
BE 2 160 0 1 5 3.98 6 6 6 2.35
PO 2 160 0 1.5 1.5 2.6 4.5 6 6 1.81
VI 2 160 0 4.5 4.5 4.59 6 6 6 1.82
GAS
Investment-to-capital ratio 1 510 0 0.05 0.08 0.11 0.11 0.19 3.24 0.15
Output-to-capital ratio 1 509 0 0.35 0.56 0.71 0.84 1.25 17.81 0.84
Cashflow-to-capital ratio 1 178 –0.28 0.09 0.14 0.16 0.21 0.28 1.33 0.11
IRA 1 550 0 0 0 0.36 1 1 1 0.48
BE 1 550 0 1.4 2 2.44 4 5 6 1.49
PO 1 550 0 0 0 0.43 0 2 6 1.26
VI 1 550 0 0 2.4 2.13 3.3 6 6 2.28
TELECOMS
Investment-to-capital ratio 1 350 0 0.07 0.11 0.19 0.18 0.37 11.61 0.42
Output-to-capital ratio 1 350 0.02 0.37 0.5 1.76 0.95 2.73 203.84 7.78
Cashflow-to-capital ratio 1 204 –10.55 0.09 0.19 0.56 0.37 0.84 37.09 2.25
IRA 1 375 0 0 0 0.33 1 1 1 0.47
BE 1 375 0 0 0 0.8 0.34 3.75 6 1.76
PO 1 375 0 0 0 1.1 2.57 3.72 6 1.77

PUBLIC POLICIES AND INVESTMENT IN NETWORK INFRASTRUCTURE
OECD JOURNAL: ECONOMIC STUDIES – VOLUME 2011 © OECD 2011 179
act as a deterrent of investment in the electricity sector. In the gas sector, higher levels of
public ownership seem to be associated with higher investment rates. The coefficient on
the level of public ownership is significant at the 10% level when all the instruments
available are used but restricting the number of instruments renders the coefficient
insignificant. In telecommunications, the existence of an independent regulator has a
positive effect on investment: the coefficient is stable and always significant at the 1% level
throughout the regressions making use of different sets of instruments.
The results from the firm-level analysis reveal differences in the importance of
regulatory variables across the sectors that are masked when the sectors are pooled. To
some extent this may reflect differences in samples, but is also likely to reflect
the interaction of different market structures with regulation. For example, the
telecommunication sector has undergone the largest switch to private ownership and the
regulatory environment has moved furthest towards an incentive regulation framework. In
this context and consistent with the sectoral results, the independence of the regulator
becomes an important factor in reducing uncertainty for potential investors. The
differences between the energy sectors may arise due to the greater difficulties in
introducing competition in the gas market, where many countries are typically dependent
on imported supplies (Newbery, 2000). In the electricity sector, on the other hand,
competition can be introduced relatively easily in generation, which may account for the
importance of barriers to entry in this sector.
Table 3. Firm-level results: Euler equations using first difference GMM
Dependent variable: Investment-to-capital ratio Whole sample Electricity Gas Telecoms
Investment-to-capital ratio (t-1) 0.816*** 1.383** 1.242*** 0.263***
(0.164) (0.579) (0.249) (0.100)
Squared investment-to-capital ratio (t-1) –0.311** –0.887* –0.499*** –0.022
(0.144) (0.468) (0.161) (0.041)
Output-to-capital ratio (t-1) 0.033** 0.062 0.015 0.008**
(0.016) (0.045) (0.010) (0.003)*
Cashflow-to-capital ratio (t-1) –0.036 –0.284 0.188 0.034
(0.088) (0.282) (0.259) (0.021)
Barriers to entry (t-1) –0.005** –0.007* –0.002 0.001
(0.002) (0.004) (0.004) (0.008)
Public ownership (t-1) –0.001 –0.007 0.007* 0.004
(0.006) (0.010) (0.004) (0.008)
Vertical integration (t-1) 0.001 0.004 0.001
(0.003) (0.006) (0.003)
Independent regulator (t-1) –0.008 –0.013 –0.001 0.07***
(0.009) (0.015) (0.014) (0.026)
Observations 2 274 1 210 926 847
Number of firms 323 173 134 160
Arellano-Bond test for AR(1) (p-value) 0.073 0.024 0.105 0.016
Arellano-Bond test for AR(2) (p-value) 0.483 0.300 0.340 0.311
Hansen test for overidentifying restrictions 0.663 0.472 0.187 0.549
Note: All regressions include year-fixed effects. Standard errors in parentheses are robust to heteroskedasticity andwithin serial correlation.* denotes significance at the 10% level, ** at the 5% level and *** at the 1% level.

PUBLIC POLICIES AND INVESTMENT IN NETWORK INFRASTRUCTURE
OECD JOURNAL: ECONOMIC STUDIES – VOLUME 2011 © OECD 2011180
3. ConclusionsThe private sector has become increasingly involved in the provision of infrastructure
across the OECD. This development has been accompanied by the development of new
regulatory and policy environments. Past experience has shown that exclusive public sector
ownership and provision can lead to inefficient investment decisions while rate of return
regulation could induce firms to overinvest. Against this backdrop, harnessing greater private
sector involvement in the provision of infrastructure could be feared to lead to a drop in
investment, albeit more investment would be better targeted. However, changes in pricing
mechanisms could encourage more investment (especially when sectors are particularly
inefficient) and the move towards independent regulators could reduce uncertainty stemming
from regulatory risk. In this light, the overall effect on investment is ambiguous.
The findings presented in this article suggest that greater private sector participation
in the provision of infrastructure when accompanied by a supporting regulatory
environment can boost investment. A number of policies appear to be more conducive to
investment, though this can depend on the characteristics of the particular sector. Overall,
a competitive environment appears generally supportive of more efficient use of resources.
For example, there is evidence that removing barriers to entry – such as requiring vertical
unbundling and establishing regulated third-party access regimes – can foster higher rates
of investment in the network industries. Such barriers appear to be harmful for
investment, especially in the electricity sector. Incentive regulation, such as setting price
caps for infrastructure services, can help ensure that investment is cost reducing and
mimics a competitive environment. Independence and accountability of the sectoral
regulators can help establish a stable and credible framework for investment. Empirically,
the evidence presented in this article suggests that price-cap regulation when combined
with regulatory independence boosts investment. The importance of an independent
regulator is particularly apparent in telecommunications. Policy settings vary considerably
across OECD countries, suggesting in some cases scope to improve policy by drawing on
the experience of others. The results also suggest that policy interactions are important
and as more time series information becomes available further investigation of this aspect
of the regulatory regime would be warranted.
Notes
1. Other factors influencing investment decisions are described in the appendix.
2. A copy of the questionnaire and a table giving the responses can be found by clicking on the linksin the text.
3. The non-respondents were Greece, Iceland, Luxembourg, Sweden and Poland.
4. There are also organisational forms where the network is separated into reciprocal or smallerparts, which can be introduced with cellular telephony. While this choice can have implications forcompetition, the direct influence on investment is less clear cut.
5. There are a number of options available to the regulators to restrain ex ante such incumbents fromabusing their monopoly power on the wholesale market. These include setting quality standardsand introducing rewards and penalties or implementing parity standards.
6. Firms needed to have at least 80% of their revenues coming from a single sector. Firms withunusually high investment rates were also dropped from the dataset.

PUBLIC POLICIES AND INVESTMENT IN NETWORK INFRASTRUCTURE
OECD JOURNAL: ECONOMIC STUDIES – VOLUME 2011 © OECD 2011 181
References
Alesina, A., S. Ardagna, G. Nicoletti, F. Schiantarelli (2005), “Regulation and Investment”, Journal of theEuropean Economic Association, pp. 1-35.
Alexander, I., and T. Irvin (1996), “Price Caps, Rate-of-Return Regulation and the Cost of Capital”, PublicPolicy Forum for the Private Sector, The World Bank.
Araújo, S. (2011), “Has Deregulation increased Investment in Infrastructure? Firm-Level Evidence fromOECD Countries”, OECD Economics Department Working Paper [forthcoming].
Auriol, E. (1998), “Deregulation and Quality”, International Journal of Industrial Organization 16, pp. 169-194.
Averch, H., and L. Johnson (1962), “Behavior of the Firm Under Regulatory Constraint”, AmericanEconomic Review, 52(5), pp. 1052-1069.
Bond, S., J. Elston, J. Mairesse and B. Mulkay (2003), “Financial Factors and Investment in Belgium,France, Germany and the UK: A Comparison Using Company Panel Data”, Review of Economics andStatistics, 85, pp. 153-165.
Cadot, O., L-H. Röller and A. Stephan (2006), “Contribution to Productivity or Pork Barrel? The TwoFaces of Infrastructure Investment”, Journal of Public Economics, 96, pp. 1133-1153.
Castells, A. and A. Solé-Ollé (2005), “The Regional Allocation of Infrastructure Investment: The Role ofEquity, Efficiency and Political Factors”, European Economic Review, 49, pp. 1165-1205.
Cambini, C., and L. Rondi (2010), “Incentive Regulation and Investment: Evidence from EuropeanEnergy Utilities”, Journal of Regulatory Economics, Vol. 38, p. 1-26.
Couper, E., J. Hejkal, and A. Wolman (2003), “Boom and Bust in Telecommunications”, Federal ReserveBank of Richmond Economic Quarterly 89/4.
Crandall, R., A. Ingraham and H. Singer (2004), “Do Unbundling Policies Discourage CLEC Facilities-Based Investment”, Topics in Economic Analysis and Policy, 4(1).
Edwards, G. and L. Waverman (2006), “The Effects of Public Ownership and Regulatory Independenceon Regulatory Outcomes”, Journal of Regulatory Economics, 29 (1), pp. 23-67.
Egert, B. (2009), “Infrastructure Investment in Network industries: The Role of Incentive Regulationand Regulatory Independence”, OECD Economics Department Working Paper, No. 688.
Gans, J. (2001), “Regulating Private Infrastructure Investment: Optimal Pricing for Access to EssentialFacilities”, Journal of Regulatory Economics, 20(2), pp. 167-189.
Guthrie, G. (2006), “Regulating Infrastructure: The Impact on Risk and Investment”, Journal of EconomicLiterature, XLIV, pp. 925-972.
Kridel, D., D. Sappington and D. Weisman (1996), “The Effects of Incentive Regulation in theTelecommunications Industry: A Survey”, Journal of Regulatory Economics, 9, pp. 269-306.
Newbery, D. (2000), Privatization, Restructuring, and Regulation of Network Utilities, The MIT Press.
OECD (2006), “Structural Reform in the Rail Industry”, OECD Journal of Competition Law and Policy, 8(2),pp. 67-175.
OECD (2005), “Designing Independent and Accountable Regulatory Authorities for High QualityRegulation”, Proceedings of an Expert Meeting in London, United Kingdom, 10-11 January 2005,Working Party on Regulatory Management and Reform.
OECD (2001), Restructuring Public Utilities for Competition, Paris.
Starkie, D. (2006), “Investment Incentives and Airport Regulation”, Utilities Policy, 14, pp. 262-265.
Sutherland, D., S. Araújo, B. Égert and T. Koźluk (2009), “Infrastructure Investment: Links to Growthand the Role of Public Policies”, OECD Economics Department Working Paper, No. 686.
Vogelsang, I. (2003), “Price Regulation of Access to Telecommunications Networks”, Journal of EconomicLiterature, 41(3), pp. 830-862.
Wölfl, A., I. Wanner, T. Koźluk and G. Nicoletti (2009), “Ten Years of Product Market Reform in OECDCountries: Insights from a Revised PMR Indicator”, OECD Economics Department Working Paper,No. 695.

PUBLIC POLICIES AND INVESTMENT IN NETWORK INFRASTRUCTURE
OECD JOURNAL: ECONOMIC STUDIES – VOLUME 2011 © OECD 2011182
APPENDIX I
Factors influencing investment in infrastructure
Addressing market failure has been a major motive for public intervention in
infrastructural sectors. Governments have intervened to prevent the under-provision or
non-provision of infrastructure, when externalities or public-good features are
predominant or to limit the exercise of market power to the extent to which a natural
monopoly is present. The resulting decisions about ownership and regulation are
important factors affecting the supply and demand of infrastructure (these are
summarised in the Appendix Figure).
The structure of infrastructure supply depends on the nature of the market failure.
Where supply entails a natural monopoly, the private sector will usually be willing to
provide the service, though normally at a level that is below, and a price that is above, the
social optimum. This will often result in some type of arm’s length regulation. Investment
will depend on standard investment determinants, such as the cost of capital, but due to
the often extremely large fixed costs and the irreversibility of investment decisions,
investment decisions are also particularly sensitive to the regulatory environment.
When the government is involved in infrastructure provision, investment decision-
making should use the standard criterion of setting the level of provision that equates the
marginal social benefit to the marginal social cost, which is related to the marginal costs of
public funds and production costs. However, due to the characteristics of networks, the
marginal benefits of additional investments are often low and declining, but not always,
particularly in well-developed networks.
There are a number of different delivery modes involving the public or private sector
to a greater of lesser extent. These include public ownership and procurement, which has
often characterised the water supply and road networks; concessions and public private
partnerships, which are increasingly involving the private sector in the delivery of
infrastructure; and fully privately-owned companies, which has often been the case in the
energy sector.
The decisions of regulatory institutions concerning the desired market structure
(reflecting the degree to which competition is possible), access regimes and pricing play
important roles in determining infrastructure supply and use. In particular, the regulator
often needs to set user costs, access prices or final prices, depending on whether the
network provider is vertically integrated and competition is feasible. Under certain
conditions, setting the price equal to the marginal social cost would be welfare maximising
and when the networks are characterised by constant returns to scale this form of pricing
would also cover investment costs. Alternatively, the regulator may adopt a different

PUBLIC POLICIES AND INVESTMENT IN NETWORK INFRASTRUCTURE
OECD JOURNAL: ECONOMIC STUDIES – VOLUME 2011 © OECD 2011 183
pricing structure to cover investment costs. Given the importance of pricing to investment
decisions, the credibility and consistency of the regulatory framework are important
determinants of infrastructure investment.
Infrastructure in the network sectors is also often a congestible public good with
congestion-raising production costs and reducing individuals’ utility. When pricing is
introduced, the optimal toll – determined by the difference between the marginal social
cost (reflecting congestion costs and wear and tear of the infrastructure) and private costs
– will reduce demand and, by enhancing the efficient use of existing infrastructure, will
damp the need for investment in additional capacity. Efficient investment decisions would
then equate marginal costs to the marginal benefits of infrastructure capacity and quality,
which the revenues from the congestion toll would indicate when additional investment is
warranted.
Appendix Figure. Factors influencing investment in infrastructure
Reasons for public policy
Ownership regime
Framework for investmentdecision making
Regulatory environment
Vertical integration
Price regimes
Natural monopoly Non-excludability
Private ownershiparm’s length regulation Public provision
Concessionregimes
PublicownershipPPPs Public
procurement
Market structure regulation
Unbundling Vertical integration
Access prices Final prices User charges
Congestion
Demand
“Exogenous” influences
Supply
Privateinvestment
Regulatoryinstitutions
Externalitiesand distribution