In Copyright - Non-Commercial Use Permitted Rights ...40825/... · 5.1...
159
Research Collection Doctoral Thesis Creep and fatigue behaviour of eutectic Sn62Pb36Ag2 solder Author(s): Weber, Ludger Publication Date: 1997 Permanent Link: https://doi.org/10.3929/ethz-a-001827915 Rights / License: In Copyright - Non-Commercial Use Permitted This page was generated automatically upon download from the ETH Zurich Research Collection . For more information please consult the Terms of use . ETH Library
Transcript of In Copyright - Non-Commercial Use Permitted Rights ...40825/... · 5.1...
Research Collection
Doctoral Thesis
Creep and fatigue behaviour of eutectic Sn62Pb36Ag2 solder
Author(s): Weber, Ludger
Publication Date: 1997
Permanent Link: https://doi.org/10.3929/ethz-a-001827915
Rights / License: In Copyright - Non-Commercial Use Permitted
This page was generated automatically upon download from the ETH Zurich Research Collection. For moreinformation please consult the Terms of use.
ETH Library
Diss. ETH No. 12251
Creep and Fatigue Behaviour of Eutectic
Sn62Pb36Ag2 Solder
A dissertation submitted to the
SWISS FEDERAL INSTITUTE OF TECHNOLOGY ZURICH
for the degree of
Doctor of Technical Sciences
presented by
Ludger Weber
Dipl. Werksting. ETH
born April 5, 1969
citizen of Stein am Rhein (SH)
accepted on the recommendation of
Prof. Dr. A. Birolini, referee
Prof. Dr. PJ. Uggowitzer, co-referee
1997

I
"[Stagnum] fit et alio modo, mixtis albi plumbi nigriquelibris; hoc nunc aliqui argentarium appellant. Iidem et
tertiarium uocant, in quo duae sunt nigri portiones et tertia
albi.[...] Hoc fistulae solidantur."
"[Stagnum] may be produced also by other means, mixingone part tin with one part lead; some call this mixture
'argentarium'. The same say 'tertiarium' to a mixture of two
parts lead and one part tin. [...] This is used for soldering of
plumbings."
Plinius Gaius Secundus, around 75 AD
Acknowledgements
I am deeply grateful to Prof. Dr. Alessandro Birolini for having given me
the opportunity to do this work and for supporting it. I would also like to
thank Prof. Dr. Peter J. Uggowitzer for accepting to co-examine this thesis.
The support of Dr. K. Heiduschke and his encouraging as well as
scientifically sound comments are gratefully appreciated. The cheerful
company of my peers G. Grossmann and M. Held was a source of relaxingmoments in hard times.
My thanks go also to Prof. Dr. H. Hieber and Dr. Ing. T. Ahrens of Centrum
fur Mikroelektronik in Neumiinster, Germany for helpful suggestions and
valuable technical discussions.
I wish to thank also all my colleagues at Reliability Lab. and, especially, mywife Nathalie for having endured my wavering mood and responding to it
with steady friendship and love.
This work was partly funded by the KTI of the Swiss government.
Leer - Vide - Empty

m
Contents
Abstract W
Zusammenfassung DC
1 Introduction 1
1.1 Presentation of the problem 1
1.2 Aim of this thesis 3
1.3 Structure of the thesis 3
2 Mechanical behaviour of eutectic tin-lead solder - a state of
the art review S
2.1 Microstructure and properties 6
2.1.1 Microstructures after solidification and working 6
2.1.2 Mechanical properties of the different microstructures 10
2.1.3 Summary 19
2.2 Constitutive equations for eutectic tin-lead solder 20
2.2.1 Norton's power-law and some extensions 20
2.2.2 The approach of Garofalo 24
2.2.3 Hart's Model 25
2.2.4 The X,-law and other theories of unified plasticity 27
2.2.5 Summary 28
2.3 Fatigue lifetime estimations 28
2.3.1 The approach of Coffin and Manson and related
models 29
2.3.2 Crack propagation and fracture mechanics 33
2.3.3 Homogeneous damage 35
2.4 Mechanical testing strategies 37
2.4.1 Specimen design 38
2.4.2 Unidirectional loading 40
2.4.3 Cyclic loading 43
3 Experimental procedure 47
3.1 Geometry of the test specimen3.2 Processing of the specimen
47
49
rv
3.3 Testing strategies 51
3.3.1 Unidirectional testing 51
3.3.2 Cyclic Testing 53
3.4 Sample preparation for light microscopy 53
4 Evolution of microstructure and mechanical behaviour
during straining 55
4.1 Characterisation of mechanical behaviour and
microstructure after soldering 56
4.1.1 Microstructures after solidification 56
4.1.2 Mechanical behaviour after solidification 58
4.2 Changes due to straining 62
4.3 Modes of fracture 73
4.4 Elastic behaviour of eutectic Sn62Pb36Ag2 solder 75
5 Implementing microstructural evolution into a constitutive
equation's framework 77
5.1 Modelling of the transition from the as-soldered to the
recrystallised state 78
5.2 Evolution and modelling of damage 88
5.2.1 Damage evolution in slowly cooled specimen 88
5.2.2 Damage evolution in quenched specimen 92
5.3 Verification of the model 94
5.4 Generalisation to any given geometry 98
6 Cyclic straining and fatigue experiments 101
6.1 Cyclic deformation experiments 101
6.1.1 Cyclic straining of slowly cooled specimen 102
6.1.2 Cyclic straining of quenched specimen 104
6.1.3 Comparison of fatigue damage evolution in quenchedand slowly cooled specimen 106
6.2 Differences and analogies between unidirectional and cyclicstraining 109
6.3 Fatigue damage evolution modelling in a FEA environment 110
7 Discussion and conclusions 113
7.1 Relation to previous work 113
7.1.1 The constitutive equation 113
7.1.2 The change in microstructure after deformation 119
7.1.3 Strain localisation 120
V
7.1.4 Damage evolution and fracture behaviour 122
7.1.5 Comparison of unidirectional and cyclic testing 124
7.1.6 Implications for production and testing in the SMT 126
7.1.7 Direction of future work 127
7.2 Conclusions 128
Al Mechanical Analysis of a Single-Lap-Joint Specimen 131
A2 List of Symbols and Abbreviations 136
References 139
Curriculum Vitae 147
Leer - Vide - Empty
vn
Abstract
Broken solder joints represent a frequently observed mode of field failure of
surface mounted devices. Finite Element Modelling (FEM) of service
conditions has been established as tool for lifetime assessment of solder
joints. For physically meaningful simulation, an appropriate constitutive
description of the solder is crucial. In this work, a comprehensiveconstitutive description of eutectic lead-tin-silver solder is presented
including microstructural features such as coarsened shear band formingand recrystallisation.
The constitutive behaviour in terms of stress-strain rate relation has been
determined using single lap joint specimens. After soldering, strain rates
depend on stresses by a power-law with exponent 7. The solder softened
during further deformation and the exponent of the stress decreased
gradually to a value of 3.3 within 100% engineering strain. Both features
were related to the development of coarsened shear bands in the solder
joint. These shear bands formed owing to local recrystallisation. The
thickness of the shear band depended on the rate of cooling duringsolidification and on the applied strain rate being the thicker the slower the
cooling rate and the higher the strain rate.
The kinetics of the development of coarsened shear bands were determined
by monitoring the softening in tensile tests. The extent of recrystallisationwithin the shear band was found to depend on the amount of local
deformation. The imposed deformation was increasingly localised in the
shear band as recrystallisation proceeded. Hence, strains and strain rates
were determined with respect to the shear band thickness.
Damage in form of homogeneously distributed reduction in load bearingarea accumulated as deformation increased. In uniaxial deformation, the
rate of damage per unit strain was proportional to the applied stress and the
remaining load-bearing area.
Creep strain-controlled cyclic loading was performed in order to compare
evolution of the microstructure in unidirectional and cyclic deformation.
vm
Both, shear band formation as well as transition from high to low stress
exponent was observed. However, quantitative modelling by the equations
determined in uniaxial testing fell short. Damage evolved according to a
Coffin-Manson approach and depended thus on the deformation path.

DC
Zusammenfassung
Das Brechen von Lotstellen stellt einen oft beobachteten Ausfallmecha-
nismus fiir oberflachenmontierte Bauteile dar. Die Finite Element Model-
lierung (FEM) von Feldbelastungen ist daran, sich als Werkzeug zur
Beurteilung der Lebensdaueraussichten von Lotstellen zu etablieren. Eine
grundlegende Bedingung fiir aussagekraftige Resultate ist die Verwendung
angemessener Materialmodelle. Diese Arbeit stellt eine umfassende
Materialmodellierung von eutektischem Blei-Zinn-Silber Lot vor, die auch
Eigenheiten der Mikrostruktur, insbesondere die Bildung vergroberterScherbander und Rekristallisation, berucksichtigt.
Das Materialverhalten in Form einer Spannungs-Dehngeschwindigkeits-
beziehung wurde an single-lap-joint Proben bestimmt. Nach dem Loten
hangt die Dehngeschwindigkeit iiber ein Potenzgesetz mit Exponent 7 von
der Spannung ab. Das Lot erweicht unter Aufbringen von Dehnung und der
Spannungsexponent sinkt innerhalb 100% Ingenieurdehnung stetig bis auf
einen Wert von 3.3 ab. Beide Veranderungen konnen mit der Ausbildung
von vergroberten Scherbandern in Zusammenhang gebracht werden. Die
Scherbander entstehen aufgrund lokaler Rekristallisation. Die Dicke der
Scherbander hangt von der Kuhlgeschwindigkeit bei der Erstarrung und von
der angelegten Dehngeschwindigkeit ab: sie ist umso grosser je geringer die
Kuhlgeschwindigkeit und je hoher die aufgebrachte Dehngeschwindigkeit.
Die Entwicklungskinetik der vergroberten Scherbander wurde mittels des
Erweichungsverhaltens in Zugversuchen bestimmt. Die Vollstandigkeit der
Rekristallisation isst abhangig von der aufsummierten lokalen Deformation.
Die an der Probe aufgebrachte Deformation konzentriert sich mit
voranschreitender Rekristallisation im Scherband. Daher miissen die
Dehnungen und Dehngeschwindigkeiten auf die Dicke des Scherbands
umgerechnet werden.
Schadigung in Form von homogen verteilter Abnahme des tragenden
Querschnitts entwickelt sich mit zunehmender Deformation. Die Zunahme
in der Schadigung pro Deformationseinheit ist proportional zur angelegten
Spannung und dem verbleibenden tragenden Querschnitt.
X
Kriechdehnungskontrollierte Wechsellastversuche wurden durchgefiihrt, um
die Entwicklung des Gefiiges in einachsiger und Wechselbeanspruchung
vergleichen zu konnen. Sowohl die Bildung von Scherbandern als auch das
Absinken des Spannungsexponenten konnte beobachtet werden. Die
quantitative Modellierung dieser Phanomene mittels der fiir den einachsigen
Fall bestimmten Gleichungen fuhrte zu keinem befriedigenden Ergebnis.
Schadigung entwickelt sich in Wechsellasttests gemass eines Coffin-
Manson Ansatzes und ist somit wegabhangig.

1
1
Introduction
1.1 Presentation of the problem
The miniaturisation of electronic devices and the increasingly compact
design of printed circuits in the electronic industry has substantially been
supported by the introduction of the surface mount technology (SMT), as
replacement of the 'through-hole'-technique. This change adds a new
element to the requirement profile of the connection between device and
printed circuit board (PCB): beside the electrical contact it has to ensure the
mechanical adhesion as well. These interconnections are traditionally made
of (low-melting) eutectic or near-eutectic lead-tin(-silver)-solders. As the
performance of the integrated circuits further increases, a further increase in
number of pins per device is required. Since the production technology is
restricted to a certain minimum distance between the pins, the increase of
pins is gained by enlarging the casing of the integrated circuit.
By switching the device on and off, and thus heating it up and letting it cool
down again, the solder joint is cyclically loaded due to the difference in the
thermal expansion coefficients of both device and PCB, which results in
fatigue of the solder material. Since the introduction of the SMT, thermo-
mechanical fatigue failure of solder joints has been found to be one of the
main life-limiting factors for surface m ounted devices (SMD).
Consequently, a lot of work has been focused on this topic in recent years.
There are mainly two ways to deal with the problem: some research has

2
been directed to the development of new connecting materials, e.g. filled
glue or other low-melting solders, in order to achieve higher fatigueresistance. However, the success in doing so has been rather limited so far.
On the other hand, efforts have been made to develop models for life-time
prediction of stressed interconnections by quantifying the impact of the
main influencing parameters—e.g. thermal expansion mismatch,
temperature amplitude, connection geometry, dimension of die device—on
the fatigue behaviour. Herein, two different approaches have been followed:
On the one hand, several assemblies are tested under varying test conditions
until failure. Using these data enables to estimate the number of temperature
cycles to failure under given field conditions by interpolation [Eng92]; on
the other hand (triggered by the fast increasing availability of computing
performance), the more general approach of the Finite Element Analysis
(FEA) has gained importance in recent years. In a FEA, a geometry-
independent material model allows to calculate the number of cycles to
failure for given geometry and test condition. Obviously, the quality of the
material model is of major importance for any physically meaningfulsimulation.
Preliminary investigation of different alternative materials have revealed
that die resistance against fatigue is at its best the same as in eutectic lead-
tin but is usually worse than in the currently used alloy. Hence, the focus is
set on the characterisation of actual solder material. While the former of the
above described approaches offers merely information about an assemblyafter very time-consuming testing, the latter may also be helpful in
designing and provide reliable data in shorter times with only some few
tests.
The difficulty of this approach lies in finding an appropriate description of
the material. Many models are given in the literature, ranging from pure
elastic-plastic behaviour to various creep-behaviour descriptions. A possiblereason for this is that there is not a unique mechanical behaviour of eutectic
lead-tin solder. Depending on the condition of solidification and subsequentmechanical treatment, the mechanical behaviour varies from superplastic to
seemingly normal-plastic.
To further complicate the matter, eutectic lead-tin in soldered joints exhibits
a highly unstable microstructure, which results in coarsening and recrystalli-
3
sation. The latter gives rise to inhomogeneous deformation patterns.
However, neither inhomogeneous deformation nor microstructural instabili¬
ties leading to transitional behaviour has so far been accounted for in
constitutive modelling.
1.2 Aim of this thesis
The aim of this thesis is to investigate the mechanical behaviour of solder
material over a wide range of temperatures and stresses. In contrast to
previous work, the focus is set on the use of specimen with solder layers of
about 60 um, instead of bulk or thick-layered specimen, in order to be as
close as possible to the conditions encountered in SMT solder joints.
Furthermore, the work is aiming at the integration of both inhomogeneousdeformation and microstructural instabilities in the framework of the
material model. Comparing studies of unidirectional straining behaviour and
cyclic straining shall offer some basic insight about the connection between
these two types of loading conditions.
1.3 Structure of the thesis
Current knowledge of mechanical behaviour of lead-tin eutectic is reviewed
in Chapter 2. The various currently used constitutive models and lifetime-
estimation methods are critically assessed on their physical basis and their
aptitude for FEA. Testing strategies and set-ups as well as specimen designsused in the literature are reviewed.
Chapter 3 deals with the specimen preparation and the presentation of the
testing procedures. Moreover, a sample preparation technique without
etching is presented that reveals grain boundaries in light microscopy.
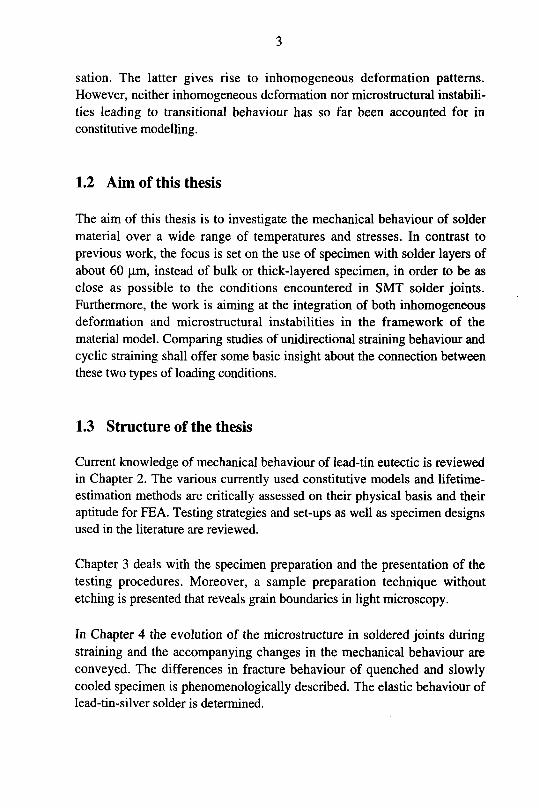
In Chapter 4 the evolution of the microstructure in soldered joints during
straining and the accompanying changes in the mechanical behaviour are
conveyed. The differences in fracture behaviour of quenched and slowlycooled specimen is phenomenologically described. The elastic behaviour of
lead-tin-silver solder is determined.
4
Using the results of Chapter 4, the constitutive behaviour incorporating both
inhomogeneous deformation and microstructural instabilities is developedin Chapter 5. Evolution of damage is described as well. Subsequently, some
predictions and direct consequences of the model are discussed. The last
part of die chapter deals with the generalisation of the model necessary for
implementation in FEA.
Analogies and differences between unidirectional straining and cyclicdeformation are outlined and discussed in Chapter 6 in connection with
difficulties to be expected in FEA.
General conclusions are given in the last Chapter.

5
2
Mechanical behaviour of eutectic tin-lead
solder—a review of the states of the art
In spite of all tiiose Material Handbooks that offer whole sets of mechanical
data about eutectic lead-tin solder, the matter is not as settled as it mightseem. In fact, we now know that 'there is no such thing as the mechanical
behaviour of a particular solder; it depends on the microstructure, which
depends ... on how the solder is processed' [Mor94]. It is, therefore,
necessary to give first an idea what kind of microstructure is present in
solidified solder, how it depends on the cooling rate and how it may be
influenced by mechanical treatment. We then will see what mechanical
behaviour results from the different microstructures. This shall be treated in
section 2.1.
The constitutive behaviour of materials—i.e., their general response to
stress in function of temperature and of structural parameters such as grainsize—is required for mechanical modelling by means of Finite Elements.
The mathematical form of the constitutive equation and the incorporated
parameters are not simply a matter of curve-fitting but reflect the assumed
phenomenology of the behaviour as well. Therefore, various frequentlyused types of constitutive models for tin-lead solder and the corresponding
phenomenologies are discussed in section 2.2. Since cracking due to cyclicdeformation is the main limiting factor in solder joint's life, fatigue lifetime
evaluation techniques are discussed in section 2.3. Finally, different
currently used testing strategies, specimen geometries and specimen
6
preparation techniques for mechanical testing are presented and discussed in
section 2.4.
2.1 Microstructure and properties
2.1.1 Microstructures after solidification and after working
Alloys of lead and tin have been in use for over 2000 years. Even the
Romans were using at least two different types of lead-tin alloys thoughnone was of eutectic composition. The alloys were employed as mirror
coatings and as solder materials in plumbings [Pli89]. Other applicationswere in medicine. The first investigation reported on the binary phase
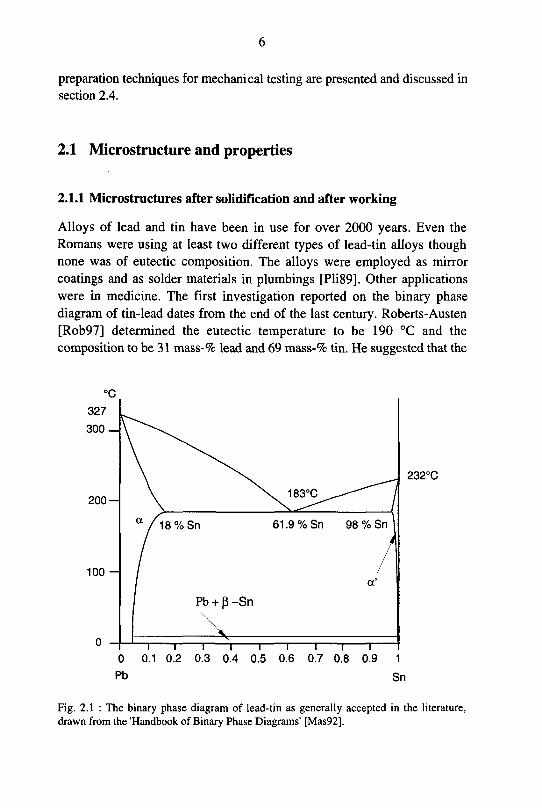
diagram of tin-lead dates from the end of the last century. Roberts-Austen
[Rob97] determined the eutectic temperature to be 190 °C and the
composition to be 31 mass-% lead and 69 mass-% tin. He suggested that the
232°C
T 1 1 1 1 1 T
0 0.1 0.2 0.3 0.4 0.5 0.6 0.7 0.8 0.9 1
Pb Sn
Fig. 2.1 : The binary phase diagram of lead-tin as generally accepted in the literature,
drawn from the 'Handbook of Binary Phase Diagrams' [Mas92].
7
solid solution of tin in lead and vice versa was negligible Ten years later,
Rosenhain and Tucker [Ros09] published their data correcting the eutectic
composition to 37 mass-% lead and the remainder tin The eutectic melting
point was given at 183°C As concerns the solubility of lead in tin, they
agreed with the previous investigation while for tin in lead they determined
the solid solution limit to be 18 mass-% at the eutectic temperature
Nowadays, the eutectic composition is accepted to be at 61 9% tin and
38 1% lead The binary phase diagram is given in Fig 2 1 [Mas92] For
simplicity's sake, the tin-rich phase is called tin-phase while the lead-rich
phase is referred to as lead-phase The ternary alloy containing 2 mass-%
silver is slightly off the ternary eutectic composition being at 1 4 mass-%
silver and 62 mass-% tin the remainder being lead The melting point of the
ternary alloy is at 178°C [Vil95]
Since the density of the tin-phase and the lead-phase differs considerably',the volume fraction of the phases cannot be derived from the composition
by a simple lever law Density-corrected calculation leads to 66 vol -% tin-
phase and 34 vol -% lead-phase This results in a structure where the tin-
phase builds the matrix in which the lead-phase is embedded Rosenhain
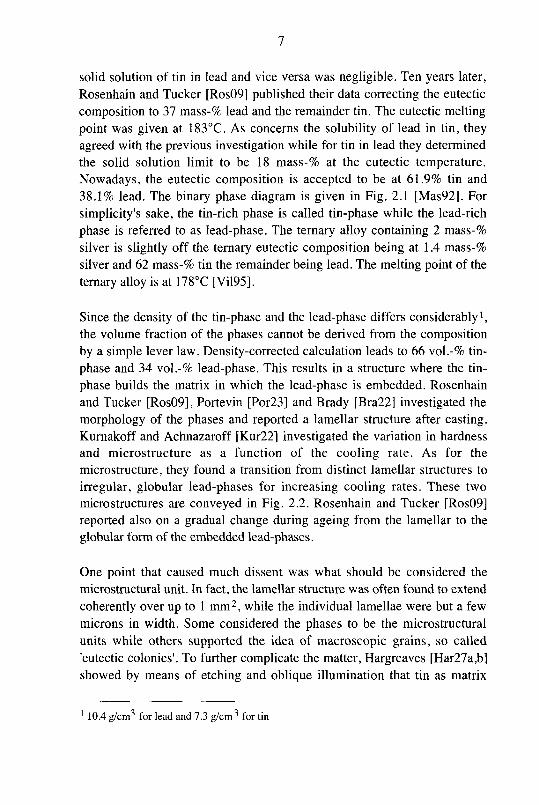
and Tucker [Ros09], Portevin [Por23] and Brady [Bra22] investigated the
morphology of the phases and reported a lamellar structure after casting
Kurnakoff and Achnazaroff [Kur22] investigated the variation in hardness
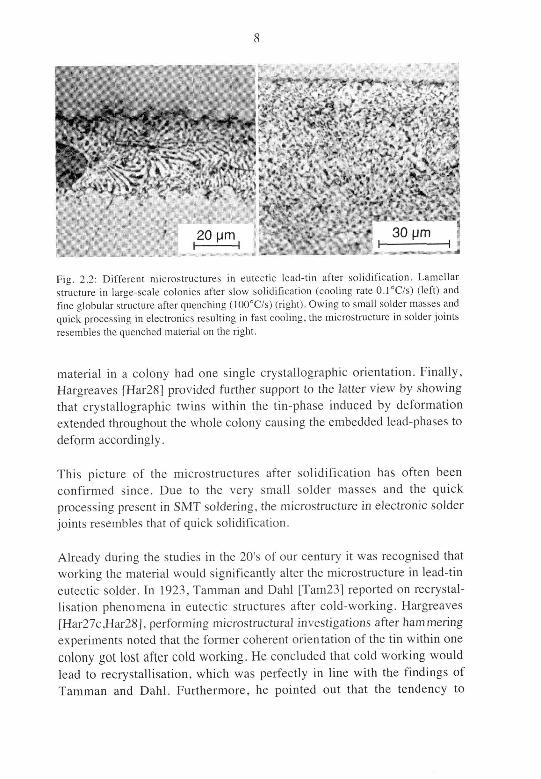
and microstructure as a function of the cooling rate As for the
microstructure, they found a transition from distinct lamellar structures to
irregular, globular lead-phases for increasing cooling rates These two
microstructures are conveyed in Fig 2 2 Rosenhain and Tucker [Ros09]
reported also on a gradual change during ageing from the lamellar to the
globular form of the embedded lead-phases
One point that caused much dissent was what should be considered the
microstructural unit In fact, the lamellar structure was often found to extend
coherently over up to 1 mm2, while the individual lamellae were but a few
microns in width Some considered the phases to be the microstructural
units while others supported the idea of macroscopic grains, so called
'eutectic colonies' To further complicate the matter, Hargreaves [Har27a,b]
showed by means of etching and oblique illumination that tin as matrix
10 4 g/cirr for lead and 7 3 g/cm for tin
8
t »ias«efcX»?w»l
Fig 2 2 Different microstructures in eutectic lead tin after solidification Lamellar
structure in large-scale colonies after slow solidification (cooling rate 0 l°C/s) (left) and
fine globular structure after quenching (100°C/s) (right) Owing to small solder masses and
quick processing in electronics resulting in fast cooling, the microstructure in solder joints
resembles the quenched material on the right
material in a colony had one single crystallographic orientation Finally,
Hargieaves [Har28] provided further support to the latter view by showing
that crystallographic twins within the tin-phase induced by deformation
extended throughout the whole colony causing the embedded lead-phases to
deform accordingly
This picture of the microstructures after solidification has often been
confirmed since Due to the very small solder masses and the quick
processing present in SMT soldering, the microstructure in electronic solder
joints resembles that of quick solidification
Already during the studies in the 20's of our century it was recognised that
working the material would significantly alter the microstructure in lead-tin
eutectic solder In 1923, Tamman and Dahl [Tam23] reported on recrystal¬
lisation phenomena in eutectic structures after cold-working Hargreaves
[Har27c,Har28], performing microstructural investigations after hammering
experiments noted that the former coherent orientation of the tin within one
colony got lost after cold working He concluded that cold working would
lead to recrystallisation, which was perfectly in line with the findings of
Tamman and Dahl Furthermore, he pointed out that the tendency to
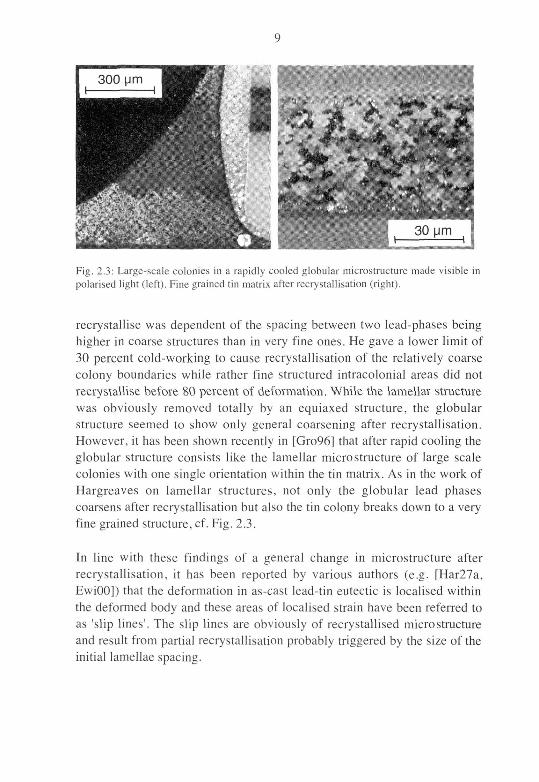
Fig. 2.3. Large-scale colonies in a rapidly cooled globular microstructure made visible in
polarised light (left) Fine grained tin matrix after recrystallisation (right).
recrystallise was dependent of the spacing between two lead-phases being
higher in coarse structures than in very fine ones. He gave a lower limit of
30 percent cold-working to cause recrystallisation of the relatively coarse
colony boundaries while rather fine structured intracolonial areas did not
recrystallise before 80 percent of deformation. While the lamellar structure
was obviously removed totally by an equiaxed structure, the globular
structure seemed to show only general coarsening after recrystallisation.However, it has been shown recently in [Gro96] that after rapid cooling the
globular structure consists like the lamellar microstructure of large scale
colonies with one single orientation within the tin matrix. As in the work of
Hargreaves on lamellar structures, not only the globular lead phases
coarsens after recrystallisation but also the tin colony breaks down to a very
fine grained structure, cf. Fig. 2.3.
In line with these findings of a general change in microstructure after
recrystallisation, it has been reported by various authors (e.g. [Har27a,
EwiOO]) that the deformation in as-cast lead-tin eutectic is localised within
the deformed body and these areas of localised strain have been referred to
as 'slip lines'. The slip lines are obviously of recrystallised microstructure
and result from partial recrystallisation probably triggered by the size of the
initial lamellae spacing.
10
The said formation of slip lines has recently become a commonly reportedfeature in solder joint investigations. They appear as bands of about 10 um
width of coarsened and equiaxed microstructure and are therefore often
referred to as 'coarsened shear bands'. Deformation and ultimate failure is
usually localised in these bands as will be discussed in the next subsection.
2.12 Mechanical properties of the different microstructures
The mechanical behaviour of any microstructure is dominantly affected bythe testing temperature. In case of lead-tin eutectic testing at ambient
temperature is a high temperature treatment with regard to the low melting
point of the alloy. Therefore, typical high-temperature phenomena, e.g.
creep, recovery, and recrystallisation, are present. Hence, mechanical
response to stress is given in terms of steady state creep rate rather than
strain rate independent yield stress or tensile strength models.
Early qualitative investigations on changes in mechanical behaviour of
different microstructures in lead-tin date back to the twenties of our century.
Hargreaves [Har27c,Har28] pointed out that cold working did significantlyreduce the Brinell-hardness compared to the as-cast state, but that this effect
was partly removed after annealing. In 1928, Jenkins [Jen28] performed
comparing studies of lead-tin and cadmium-zinc eutectic. The tensile
strength of both alloys was highest in the as-cast state and was considerablylowered if cold working was applied. Both alloys exhibited elongations to
fracture of several hundred percent though in the cold-worked condition and
at relatively low strain rates only. In the as-cast state, creep deformations to
rupture were limited to some 50% accompanied by significant necking in
the final stage.
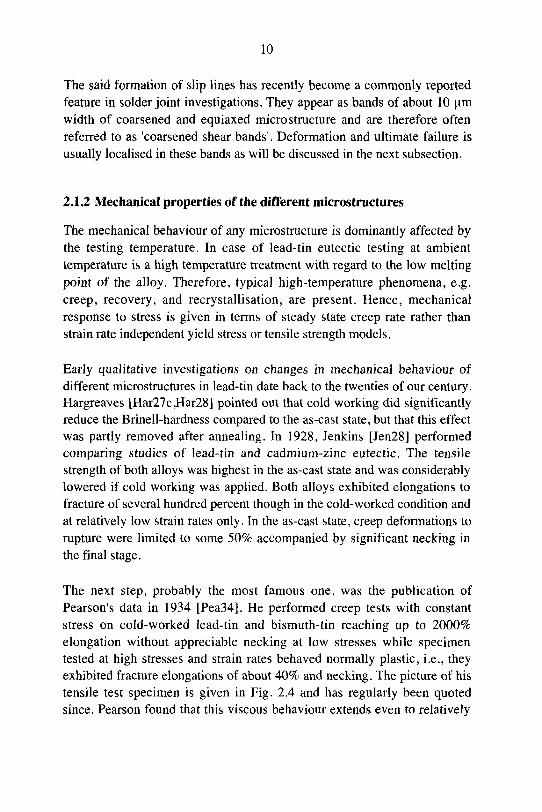
The next step, probably the most famous one, was the publication of
Pearson's data in 1934 [Pea34]. He performed creep tests with constant
stress on cold-worked lead-tin and bismuth-tin reaching up to 2000%
elongation without appreciable necking at low stresses while specimentested at high stresses and strain rates behaved normally plastic, i.e., theyexhibited fracture elongations of about 40% and necking. The picture of his
tensile test specimen is given in Fig. 2.4 and has regularly been quotedsince. Pearson found that this viscous behaviour extends even to relatively
11
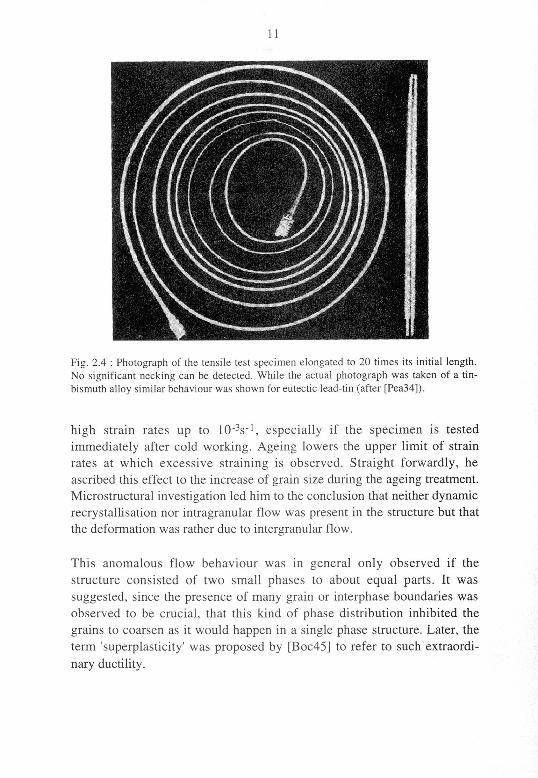
Fig 2 4 Photograph of the tensile test specimen elongated to 20 times its initial length.No significant necking can be detected While the actual photograph was taken of a tin-
bismuth alloy similar behaviour was shown for eutectic lead-tin (after [Pea34]).
high strain rates up to 10"V, especially if the specimen is tested
immediately after cold working. Ageing lowers the upper limit of strain
rates at which excessive straining is observed. Straight forwardly, he
ascribed this effect to the increase of grain size during the ageing treatment.
Microstructural investigation led him to the conclusion that neither dynamic
recrystallisation nor intragranular flow was present in the structure but that
the deformation was rather due to intergranular flow.
This anomalous flow behaviour was in general only observed if the
structure consisted of two small phases to about equal parts. It was
suggested, since the presence of many grain or interphase boundaries was
observed to be crucial, that this kind of phase distribution inhibited the
grains to coarsen as it would happen in a single phase structure. Later, the
term 'superplasticity' was proposed by [Boc45] to refer to such extraordi¬
nary ductility.
12
It was not before the 60's that the obviously strongly differing creep
behaviour of as-cast and rolled lead-tin was quantitatively described in a
general way using a so-called 'power-law' description originating from
Norton [Nor29],cf. (2.1):
y = A-(lj-exV[-Q/RT] (2.1)
where the stress t is divided by the shear modulus G in order to omit units
other than s"1 in the pre-factor A. The temperature dependence is accounted
for by an Arrhenius factor and the temperature dependence of the shear
modulus. A major advantage of this kind of description is that the
parameters Q and n have been recognised to be indicative for the micro-
mechanisms governing the creep deformation.
Since the reported superplastic behaviour seemed to offer new ways to
accomplish complex structures by deep drawing, much effort was dedicated
to understanding the micromechanisms responsible for the superplasticbehaviour of the structure of rolled lead-tin. Thus, a large number of
publications was concerned with this microstructural state. The findings of
these investigations can be summarised as follows:
Mechanical behaviour ofthe as-cast structure
The steady-state creep rates of the as-cast structure obey a Norton-law with
one single set of parameters (cf. e.g. [Cli67]) for temperatures between 0
and 100°C and strain rates ranging from 10~7 to 10~2 s_1. This comes up with
a straight line for each temperature in a double-logarithmic plot of stress vs.
strain rate. The slope of the line is identified with 1/n, the inverse of the
stress exponent. This value is usually referred to as the 'strain rate
sensitivity' (SRS). Typical values for n are 7...8 and, thus, the SRS is about
0.12...0.15. The activation energy Q is in the order of 70-90 kJ/mol. These
values indicate that dislocation climb controlled by intragranular diffusion
is die rate controlling step in creep deformation.
In creep tests, the following features are encountered: considerable primary
creep, necking, and elongated grains after testing. The elongation to fracture
is in die range of 20% to 50%.
13
Mechanical behaviour oflead-tin after rolling
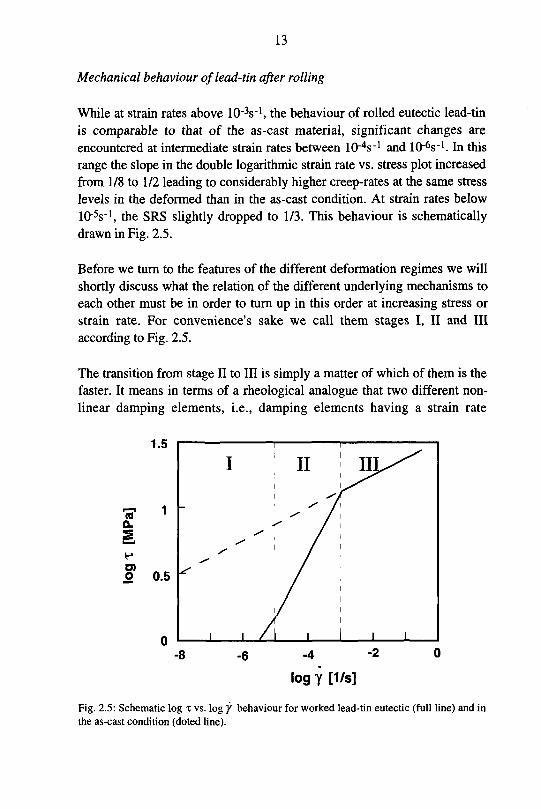
While at strain rates above lO'V1, the behaviour of rolled eutectic lead-tin
is comparable to that of the as-cast material, significant changes are
encountered at intermediate strain rates between lO^s1 and 10-6s_1. In this
range the slope in the double logarithmic strain rate vs. stress plot increased
from 1/8 to 1/2 leading to considerably higher creep-rates at the same stress
levels in the deformed than in the as-cast condition. At strain rates below
10-V1, the SRS slightly dropped to 1/3. This behaviour is schematicallydrawn in Fig. 2.5.
Before we turn to the features of the different deformation regimes we will
shortly discuss what the relation of the different underlying mechanisms to
each other must be in order to turn up in this order at increasing stress or
strain rate. For convenience's sake we call them stages I, II and III
according to Fig. 2.5.
The transition from stage II to III is simply a matter of which of mem is the
faster. It means in terms of a rheological analogue that two different non¬
linear damping elements, i.e., damping elements having a strain rate
1.5
,_, 1n
Ql
2
H
O)0 0.5
I II
i
m/^
S*
i y /\ ' /< /
^ /S
s-
I I
/ i
\ i 1 i i
log y [1/s]
Fig. 2.5: Schematic log T. vs. log / behaviour for worked lead-tin eutectic (full line) and in
the as-cast condition (doted line).
14
sensitivity other than unity, are working in parallel. At the intersection of
lines II and III, both mechanisms give way at equal speed. Increasing the
stress gives rise to a higher acceleration in mechanism guiding stage III than
in that of stage II. On the other hand, lowering the stress decelerates III
stronger than II. Applying the same arguments to the transition from stage I
to stage II leads to the conclusion that there always the slower mechanism is
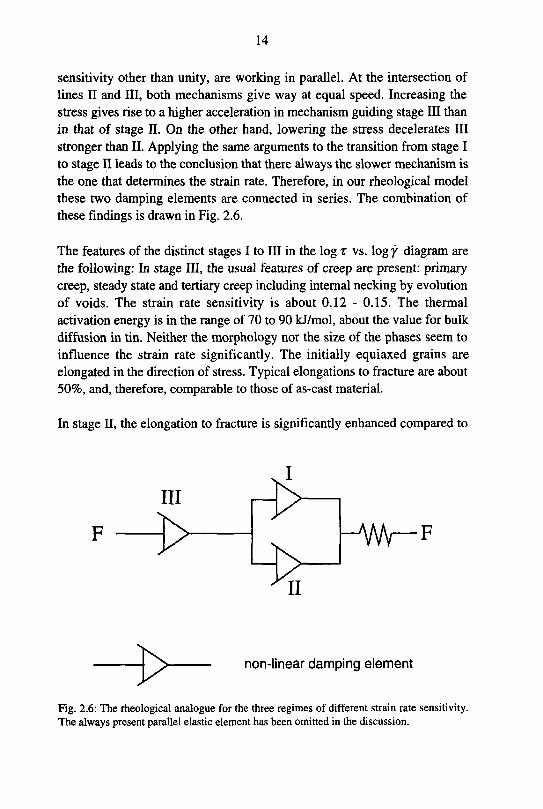
the one that determines the strain rate. Therefore, in our rheological model
these two damping elements are connected in series. The combination of
these findings is drawn in Fig. 2.6.
The features of die distinct stages I to III in the log T vs. log y diagram are
the following: In stage III, the usual features of creep are present: primary
creep, steady state and tertiary creep including internal necking by evolution
of voids. The strain rate sensitivity is about 0.12 - 0.15. The thermal
activation energy is in the range of 70 to 90 kJ/mol, about die value for bulk
diffusion in tin. Neither the morphology nor the size of the phases seem to
influence the strain rate significantly. The initially equiaxed grains are
elongated in the direction of stress. Typical elongations to fracture are about
50%, and, merefore, comparable to those of as-cast material.
In stage II, the elongation to fracture is significantly enhanced compared to
^WV-F
non-linear damping element
Fig. 2.6: The rheological analogue for the three regimes of different strain rate sensitivity.The always present parallel elastic element has been omitted in the discussion.
15
stage III. Proper testing results in a fracture elongation of as much as 50
times the initial length [Moh75]. The grains do not change their shape
seemingly but slide along each other. This phenomenon is called grain
boundary sliding. Interestingly enough, void formation as would be
expected to occur at triple-points is virtually absent in tensile testing while
cyclic bending led to some extent to formation of cavities [Ram87]. For the
activation energy values varying from 40 kJ/mol to 90 kJ/mol are reported.The former is in the order of the activation energy for grain boundarydiffusion while the latter is close to that for bulk diffusion. The strain rate
sensitivity is about 0.5. There is, as would be expected, a strong dependenceof the strain rate on the grain size d in this region cf. table 2 in [Kas81].
Equation (2.1) is then extended to
^<§J{0exp[-Q,Rr](2.2)
where b, the Burger's vector, is introduced in order to retain the dimension
s_1 for the factor A. The grain size exponent p is -2...-3 [Zeh68], which is
between the value for Herring-Nabarro creep [Her50], where the diffusion
path is through the bulk, and Coble creep [Cob63], where grain boundaries
are carrying the diffusion. In stage II, no or only little primary creep is
encountered. Therefore, dislocation movement within the grain is
considered to be not rate controlling for the mechanism present.
The features of stage I are somehow a mixture of the characteristics of stageII and III: at one hand the activation energy is similar to that of bulk
diffusion and the strain rate sensitivity is about 1/3. Moreover, little primary
creep and hardening is present. On the other hand, there is a grain size
dependence similar to stage II. Some researchers [Ash73], [Hor74] deny the
existence of this stage invoking some internal backstress to account for die
decreasing strain rate sensitivity at very low stresses. Though the postulatedvalues for the backstress have been found to be too high. However,
considerable disagreement about numerical parameters and variations in
experimental data in this stage makes it difficult to rule out one or the other
point of view. Weertman in 1967 [Wee67] pointed out that improper
testing, i.e., measuring strain rates over too small deformation ranges, mightbe the source of these equivocal results as other non-steady-statemechanisms may account for it.
16
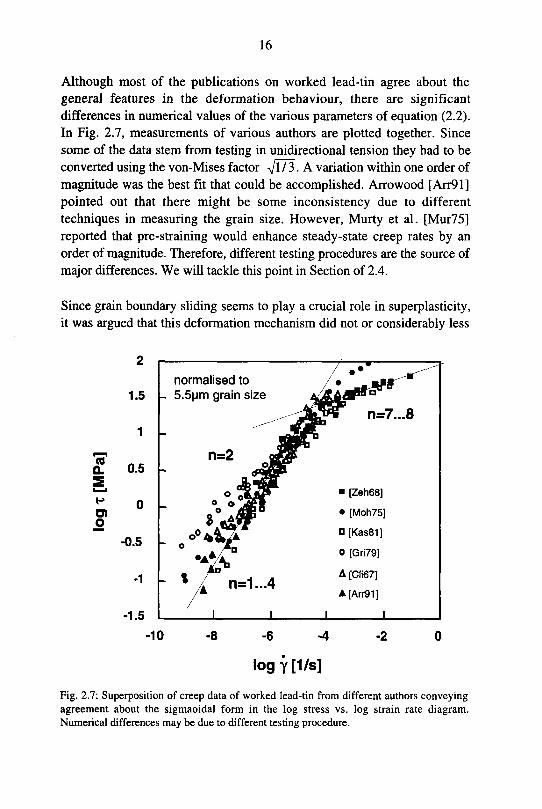
Although most of the publications on worked lead-tin agree about the
general features in the deformation behaviour, there are significantdifferences in numerical values of the various parameters of equation (2 2)
In Fig 2 7, measurements of vanous authors are plotted together Since
some of the data stem from testing in unidirectional tension they had to be
converted using me von-Mises factor ^Jl/3 A variation within one order of
magnitude was the best fit that could be accomplished Arrowood [Arr91]
pointed out that there might be some inconsistency due to different
techniques in measuring the grain size However, Murty et al. [Mur75]
reported that pre-straining would enhance steady-state creep rates by an
order of magnitude Therefore, different testing procedures are the source of
major differences We will tackle this point in Section of 2 4
Since grain boundary sliding seems to play a crucial role in superplasticity,it was argued that this deformation mechanism did not or considerably less
normalised to
- 5 5pm grain size
£ 0.5
O)o
-10
log y [1/s]
Fig 2 7 Superposition of creep data of worked lead-tin from different authors conveying
agreement about the sigmaoidal form in the log stress vs log strain rate diagramNumerical differences may be due to different testing procedure
17
than other mechanisms damage the structure. Therefore, a superplasticmaterial should exhibit outstanding fatigue resistance as well.
On the other hand, the analysis of the stability of a tensile test specimen
against necking revealed that the SRS-value becomes the key-factor if net
work-hardening is zero. This is the case in steady state creep deformation.
Hence, there has been some arguing whether the outstanding ductility of
superplastic material is due to the non-damaging nature of grain boundary
sliding or merely a consequence of the low SRS suppressing necking. The
former view has been experimentally supported when first in shear tests
deformations to fracture of several hundred percent were reported [Mei91a].
Moreover, Aldrich and Avery [Ald70] performing low cycle fatigue
experiments on worked lead-tin reported that superplastic material exhibited
a higher fatigue resistance man other materials.
Mechanical behaviour ofeutectic lead-tin in solderedjoints
Recent investigations on eutectic lead-tin solder joints call in questionwhether all three of the above described regimes are present. Most of the
data [S0I86], [Dar92], [Wil90], [Lee93] determined in the temperature
range from 0°C to 100°C indicate that merely strain rate sensitivities of 1/3
(low stresses) and 1/7 to 1/10 (high stresses) are present, i.e., the
intermediate or 'superplastic' stage is dropped or probably shifted to higher
temperatures. Moreover, the transition from stage I to stage III varies up to
a factor of 103 in strain rate indicating that other not yet qualified influences
are relevant.
The presence of so called 'coarsened shear bands' in the commonly used
shear test specimen may partly account for this uncertainty. Depending on
the relative width of the shear band compared to the solder joint thickness
the strain rate present in the shear band can significantly exceed the 'over¬
all' strain rate.
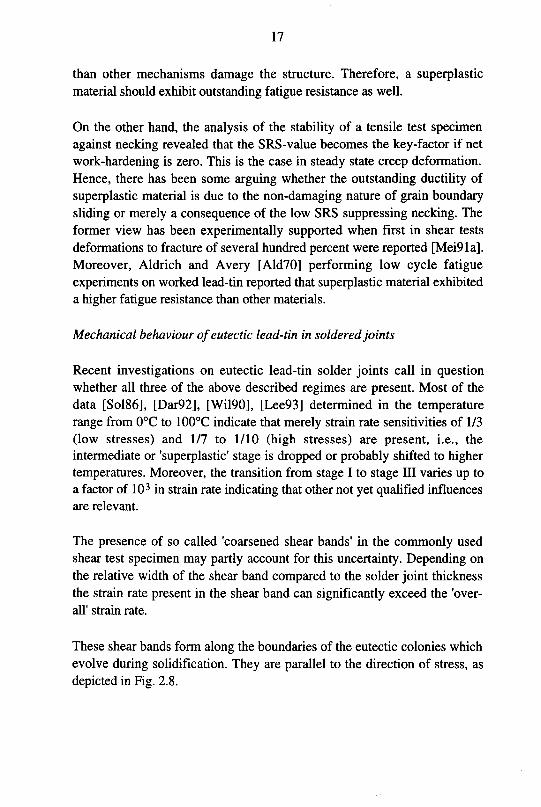
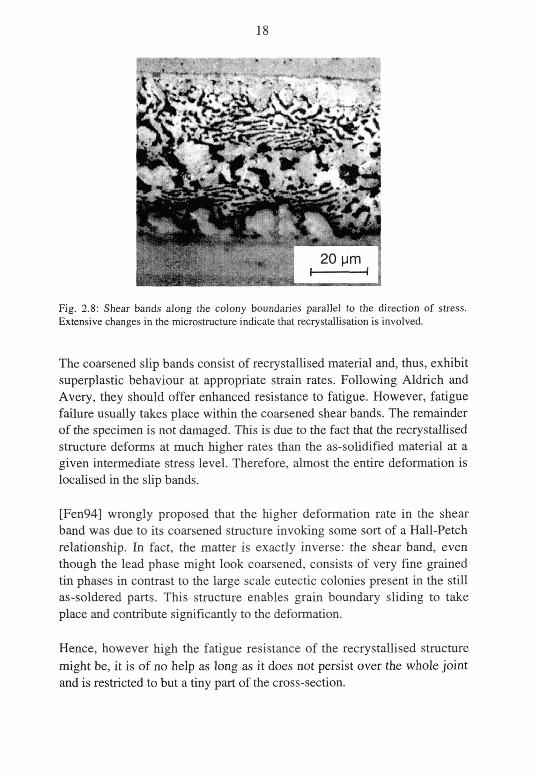
These shear bands form along the boundaries of the eutectic colonies which
evolve during solidification. They are parallel to the direction of stress, as
depicted in Fig. 2.8.
18
Fig. 2.8: Shear bands along the colony boundaries parallel to the direction of stress.
Extensive changes in the microstructure indicate that recrystallisation is involved.
The coarsened slip bands consist of recrystallised material and, thus, exhibit
superplastic behaviour at appropriate strain rates. Following Aldrich and
Avery, they should offer enhanced resistance to fatigue. However, fatiguefailure usually takes place within the coarsened shear bands. The remainder
of the specimen is not damaged. This is due to the fact that the recrystallised
structure deforms at much higher rates than the as-solidified material at a
given intermediate stress level. Therefore, almost the entire deformation is
localised in the slip bands.
[Fen94] wrongly proposed that the higher deformation rate in the shear
band was due to its coarsened structure invoking some sort of a Hall-Petch
relationship. In fact, the matter is exactly inverse: the shear band, even
though the lead phase might look coarsened, consists of very fine grainedtin phases in contrast to the large scale eutectic colonies present in the still
as-soldered parts. This structure enables grain boundary sliding to take
place and contribute significantly to the deformation.
Hence, however high the fatigue resistance of the recrystallised structure
might be, it is of no help as long as it does not persist over the whole jointand is restricted to but a tiny part of the cross-section.
19
Facing these difficulties, Morris and Mei [Mor94] have reported on various
approaches to get homogeneously distributed recrystallised structures within
a solder joint:
• Inhibiting the slip band to extend over the whole area of the joint by
introducing large stable phases as present in off-eutectic solders
[Sum90] or by adding second phase dispersants [Kra92]. The off-
eutectic alloy was reported to exhibit a not quantified increase in fatigueresistance. The addition of gold-tin dispersants lowered the fatigueresistance due to the brittle dispersants.
• Refining the structure by rapid cooling, i.e., quenching in water
[Mei92], As was shown in Fig. 2.2, the microstructure of quenched
specimen is equiaxed and resembles very much the structure found in
worked material, though the structure is finer after quenching.
Quenching resulted in an increase of fatigue resistance by up to a factor
of 3.
• Suppressing the evolution of eutectic colonies or broadening the colony
boundaries, i.e., the future shear bands, using minor alloy additions
(about 2%), e.g. In, Sb, Bi, and Cd [Tri90]. While Bi and Sb have no
beneficial effect, the In and Cd additions resulted in quite homogenous
deformation within the first 50% strain in unidirectional shear testing.
In Chapter 5, we will give a model that incorporates local recrystallisationand thus inhomogeneous deformation in solder joints in a constitutive
equation framework.
2.13 Summary
The deformation behaviour of eutectic lead-tin is strongly influenced by its
microstructure. In one special state, after deformation and subsequent
recrystallisation, the material is able to deform in a stable manner over
several hundred percent. In this state, the fatigue resistance is increased as
well. The benefit of this structure is diminished as it is restricted to but a
fraction of the joint, the shear bands. The evolution of shear bands is
recognised to be due to the unstable microstructure after soldering.
20
22 Constitutive equations for eutectic tin-lead solder
The constitutive equation of a material is a quantitative description of its
deformation response to a given load condition. Skimming through the
literature about constitutive equations of lead-tin eutectics reveals that a lot
of different mathematical forms have successfully been used to describe
different types of mechanical behaviour, e.g. relaxation tests, creep data and
hysteresis loops in cyclic deformation.
However, as was pointed out by Stone and Rashid [Sto94], the constitutive
equation of a material should have 'a well defined phenomenology, a basis
in empirical data, and a basis in mechanism'. While most of the proposedconstitutive equations come more or less up to these requirements
individually, they vary significantly from each other. So, 'What is truth?"
(John 18:38)
200 years ago, the German philosopher Immanuel Kant postulated that the
perception of an object's quality depends not only on the object itself but
also on the means by which the quality is perceived. In our century,
quantum mechanics have taught us that Kant's statement was not restricted
to philosophical matters only. Accordingly, it is not surprising that different
ways of assessing a material's behaviour—according to the assumed
phenomenology—would produce 'reasonable' sets of parameters. It is,
however, commonplace that these models often fail in predicting data they
were not made for. The main reason is the inconsistency between postulatedmechanism and phenomenology and mechanism(s) effective in the material.
Therefore, various types of constitutive equations are currently used for
solder description. They are reviewed in the following with respect to their
appropriateness for modelling different features occurring in lead-tin solder
at temperatures and microstructures present in solder joints in electronic
applications.
22.1 Norton's power-law and some extensions
Already in 1929 Norton [Nor29] proposed an empirical description of
steady-state creep rate ycr dependence on stress t of the form
21
Ycr « *" (2.3)
where a denotes proportionality. Equation (2.3) reduces for n=l to New¬
tonian viscous flow. The description corresponds to a linear relationship in
double-logarithmic stress vs. strain rate plot, where \ln equals the slope.
The influence of the temperature is accounted for by an Arrhenius term. The
stress is normalised by the shear modulus G in order to perserve the units of
the pre-factor A as s_1 leading to
Y„ = A-\^\ -exp<Vi
RT (2.4)
Originally proposed as an empirical description, later work revealed the
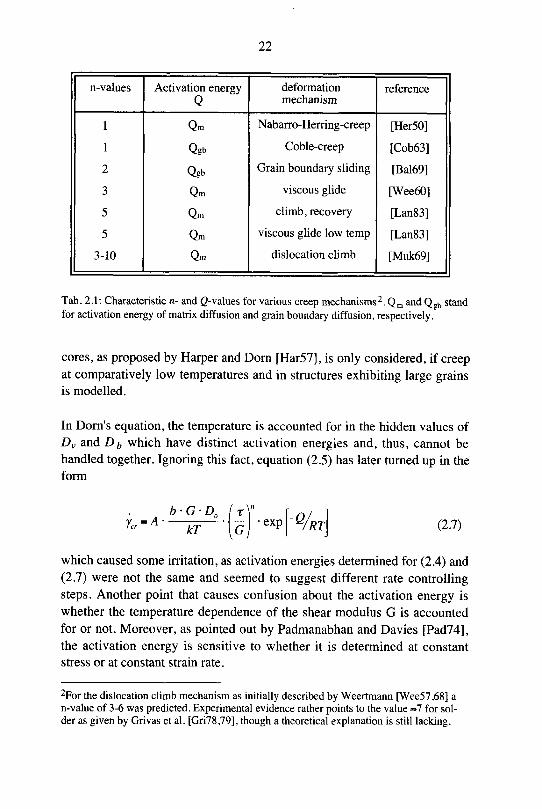
physical meaning of the power n and the activation energy Q: n- and Q-values are indicate for which deformation mechanism is rate controlling.Some of the established combinations of n and Q are compiled in Tab. 2.1.
In 1964, Dorn's equation, a special form of Norton's power-law (2.4) was
proposed [Bir64]
b-GDeff (tY
where b denotes the Burger's vector, G is the shear modulus, k is
Boltzmann's constant, T denotes the temperature, and A,n are material
constants. The effective rate of diffusion D^ is derived from a combination
of bulk diffusion rate originating from Nabarro [Nab48] and Herring
[Her50] and the rate of diffusion along phase or grain boundaries goingback to Coble [Cob63]:
(D„ 6-D„\
D*m\7 +
*"j-\ (2.6)
with d being the grain size, Dv denoting the bulk diffusion rate, D/, being the
diffusion rate along grain or phase boundaries, and 8. standing for the width
of the grain or phase boundary. A third diffusion path, along dislocation
22
n-values Activation energy
Q
deformation
mechanismreference
1 Qm Nabarro-Herring-creep [Her50]
1 Qgb Coble-creep [Cob63]
2 Qgb Grain boundary sliding [Bal69]
3 Qm viscous glide [Wee60]
5 Qm climb, recovery [Lan83]
5 Qm viscous glide low temp [Lan83]
3-10 Qm dislocation climb [Muk69]
Tab 2 1 Characteristic n and Q-values for various creep mechanisms2 Qm and Qgb stand
for activation energy of matrix diffusion and grain boundary diffusion, respectively
cores, as proposed by Harper and Dorn [Har57], is only considered, if creep
at comparatively low temperatures and in structures exhibiting large grains
is modelled
In Dorn's equation, the temperature is accounted for in the hidden values of
Dv and £>/, which have distinct activation energies and, thus, cannot be
handled together Ignoring this fact, equation (2 5) has later turned up in the
form
Ab'G'D" (*)" \ 0/ 1
ycr = AkT ^-j exp[%r] (2 7)
which caused some irritation, as activation energies determined for (2 4) and
(2 7) were not the same and seemed to suggest different rate controlling
steps Another point that causes confusion about the activation energy is
whether the temperature dependence of the shear modulus G is accounted
for or not. Moreover, as pointed out by Padmanabhan and Davies [Pad74],the activation energy is sensitive to whether it is determined at constant
stress or at constant strain rate
2For the dislocation climb mechanism as initially described by Weertmann [Wee57,68] a
n-value of 3-6 was predicted Experimental evidence rather points to the value =7 for sol¬
der as given by Gnvas et al [Gn78,79], though a theoretical explanation is still lacking

23
As pointed out in section 2.1, the mechanical behaviour of lead-tin or lead-
tin-silver eutectics cannot be described by a single power-law. The
rheological analogue (Fig 2.6) offers some help in constructing a combined
constitutive equation. However, considering all three stages, there is no
analytical solution for general parameters to lead to a constitutive equation.An expedient is provided by the fact that stage I is important at very low
strain rates only and may therefore be ignored. Thus, the usual form,
including only stages II and III only, is given by
fcr = A-\-\ expQdc/
'RT + B-\ ^ | -exp-0,
'RT (2.8)
However, even this simplification is not easy to treat mathematically in
terms of inverting and solving for stress x instead of strain rate, as analyticalsolutions exist for some special combinations of n and m only.
The advantage of (2.8) lies in the separation of mechanisms as each term
stands for a distinct mechanism. A constitutive equation of the form of (2.8)has been used by [Ros91], [Kas81], [Gri79], and [Shi88] for modelling the
mechanical behaviour of eutectic lead-tin solder while (2.4) has been
adopted by Piittner et al. [Piit94] and Schmidt and Seaman [Schmi90].
A slightly modified model has been presented by Knecht and Fox in 1990
[Kne90]. It featured a separation of the overall strain rate in an elastic, a
plastic, and a creep component
7 =7ei+ Ypl+rci
(2.9)
The elastic yd term was related to the stress change rate by Hook's Law
while the plastic part ypl was accounted for by a Ramberg-Osgood-type of
equation which is usually introduced to model plastic strain assuming strain
hardening effects
YP'~ *
(f \n< ^
(2.10)
24
The time-dependent or creep deformation ycr was described by a sum of
two power-laws using exponents as previously published by Grivas, Murty,and Morris [Gri79]
7cr=C0V2\T0J
+
(_\
v.Toy
i.\\
(2.11)
with C0 and T0 being materials parameter. The temperature dependence is
accounted for by varying both C0 and t0 with temperature. The usually
reported difference in activation energy of the two assumed mechanisms is
ignored in that work.
2.2.2 The approach of Garofalo
The power law description for steady state creep applies only up to
intermediate stress levels while at higher stresses the strain rate sensitivity
steadily decreases. This phenomenon is usually referred to as 'power-lawbreakdown'. In 1963, Garofalo [Gar63] offered a way to describe both
regimes with one single equation:
rcr = C,-[sinh(C2-T)]" (2.12)
where ycr denotes creep strain rate, T is the shear stress and Ci, C2 and n
are material dependent parameters. He took advantage of the fact, that
sinh(jr) = - (2.13)
for small arguments x. The above equation reduces to Norton's law for
small stresses r. Hence, the parameter A from Norton's description can be
identified as
A = Cl C2" and n = n (2.14)
Although the model was originally proposed for the description of the
power-law breakdown, it has also been successfully applied for modelling
25
bilinear solder-data in a double-logarithmic plot, cf. [Dar92], [Lau93b],
[Pan91]. A similar—though a bit more sophisticated—approach for a creep
steady state behaviour is implemented in the commercial FE-programme
Ansys.
The main advantage of the above mathematical description is that the
function can be inverted, i.e., there are two equivalent descriptions of the
creep behaviour, being a strain rate as function of stress and vice versa.
Garofalo's description allows an analytical solution while in equation (2.8),
the stress in order to achieve a certain strain rate can but be approximated
numerically.
On the other hand, the description of Garofalo is not based on mechanisms
and phenomenologies. Therefore, significant changes in the constitutive
behaviour, as they occur due to recrystallisation, cannot be handled byGarofalo's description.
2.2.3 Hart's Model
While Garofalo's mathematical description provided a single equation for a
changing strain rate-sensitivity, i.e., a steadily changing slope in a double-
logarithmic stress vs. strain rate plot, it could not solve the problem of
incorporating stage I as well. In 1967, Hart [Har67] proposed a mathe¬
matical description uiat incorporated phenomenological aspects as well. The
general idea is that grain boundary sliding (gbs) is governed by a linear-
viscous law, as later modelled by Raj and Ashby [Raj71], while matrix
creep is guided by a power-law. At high stresses, matrix creep dominates
the grain boundary sliding, leading to uniform deformation. At very low
stresses—owing to the high strain rate sensitivity—grain boundary slidingwould be much faster than matrix creep. As gbs alone without any
accommodation by matrix creep cannot lead to continuous deformation, the
rate of sliding is restricted by the accommodation process. Thereby, the
grain or phase boundaries act like flaws reducing thus the load bearing area.
Stage II is viewed as a mere transition between stages I and III both
governed by matrix creep.

26
GBS
MC
MC
GBS
rfefh
MC
Fig. 2.9: The two rheological analoga proposed by Hart to account for the high strain rate
sensitivity of grain boundaries. MC and GBS stand for matrix creep and grain boundary
sliding, respectively.
In order to determine the according constitutive equation he investigatedtwo possible rheological analoga which are depicted in Fig. 2.9. The model
on the top is just a special case of that shown in Fig. 2.6 (two similar non¬
linear damping elements, one linear damping element) and, thus, allows to
some extent an analytical treatment.
For the rheological analogue on the bottom of Fig. 2.9 he found the
following constitutive equation (for the version on the top the equation is
similar but a bit more complicated)
<T = o0-[y + (l-y)-Z]-e? (2.15)
where a and e are stress and strain rate, respectively, and ao and /J, are
material constants while y is a model parameter that includes the grain
boundary density or the grain size. The variable Z denotes the ratio of the
stresses transmitted through the matrix cm and over the grain boundary <rb
'O.(2.16)
27
The ratio that defines Z is obviously not trivial. However, Hart provides a
numerical method to obtain values for Z. He was thus able to model a set of
data published by Cline and Alden [Cli67].
2.2.4 The A,-law and other theories of unified plasticity
Another idea that owes its origins to a publication of Hart [Har70] is the so
called 'A,-law'. The original idea is to describe unified plasticity, i.e., plasticand creep strain, by state variables, using the 'hardness-parameter' cr* as
state variable. The plastic strain rate e is correlated to the stress a by
^YeWAf (Z17)
While A is a numerical parameter, the variable e* is connected to the
hardness-parameter a* by a power-law as given in equation (2.4). The
hardness-parameter cr* evolves by a rate equation in order to account for
hardening and recovery. In case of stationary structure, i.e., cr*= const.,
(2.17) describes a steady decrease of strain rate-sensitivity with increasingstress. This framework has been adopted for modelling of eutectic solder byStone et al. [Sto85]. He used different sets of parameters for matrix creep
and grain boundary flow by applying Hart's model. He was able to account
for Hall's data of stress temperature evolution of a simple SMD quite well.
State variable approaches are usually used in unified plasticity theories, i.e.,
theories that combine plasticity and creep features. To this class of models
count among others the model of Korhonen, Hannula and Li [Kor87], which
is a generalisation and extension of Hart's model and the approach of
Bodner and Partom (Bod87). Both models are well elaborated and hence
provide a complete framework of constitutive equations. There are even
models to account for specific straining effects such as Bauschinger effect,
microplasticity, directional hardening, and anelastic effects provided. The
description of these effects, however, requires a good deal of experimentalevaluation while their quantitative contribution in modelling of solder joints
may be negligible.
The form of the stress vs. strain rate relation is similar to that produced byGarofalo's sine hyperbolic-law. It may be shifted according to the evolution
28
of state variables but does not change its general form unless it is
incorporated in Hart's model and the state variables for matrix and grain
boundary creep are changed independently as performed by Stone et al.
[Sto85] for the X-law. However, the approach of Bodner and Partom has
recently been applied to constitutive modelling of eutectic lead-tin solder
[Ski96].
2.2.5 Summary
The common constitutive descriptions for creep phenomena have been
presented. As most of them have shown their aptitude to model eutectic
lead-tin solder behaviour, the choice of which to take must be based on the
effects to be modelled.
As it was reported by Guo et al. [Guo92a], the strain rate sensitivity of lead-
tin eutectic increased with increasing accumulated strain, while the stresses
in order to achieve high strain rates changed but insignificantly. Preliminary
experiments have confirmed such behaviour. Furthermore, microstructural
changes due to recrystallisation have been found to accompany this
transition having a significant impact on the creep behaviour of the solder.
As none of the above presented model is able to account for this in a direct
manner, a new model has to be established basing on the extended version
of Norton's law (equation (2.8)).
The phenomenological description and the equation's framework for this
new model including transient phenomena is presented in Chapter 5.
2.3 Fatigue lifetime estimations
In microelectronic applications the solder joint is usually exposed to cyclic
temperature changes and thus, because of the CTE mismatch, to mechanical
cyclic loading as well. As a large number of field failures of electronic
assemblies are due to broken solder joints, lifetime estimation models for
solder in a thermomechanical fatigue environment are crucial. The
customary models are shortly presented in the following with emphasis on
their aptitude for FE-modelling.
29
2.3.1 The approach of Coffin and Manson and related models
Fatigue lifetime assessment owes its origins to the German engineer August
Wohler, who published some basic results on me topic, e.g. a relationship of
stress amplitude to cycles to failure, in 1856. His results were restricted to
the elastic deformation range and hence talking about cycles to failure >104.
At the beginning of our century, Basquin [BaslO] established die equation
N/-Ac = CB<118)
which related the stress amplitude Aa to the number of cycles to failure
Nf, where ft and CB are materials parameter, and fS is in the range of
0.1...0.15. Half a century later, Coffin [Cof54] and Manson [Man53]
proposed independently a method to assess fatigue lifetime for structural
materials based on the plastic strain amplitude. As under those conditions,
the number of cycles to failure is usually <104, their results provided an
extension of Wohler's and Basquin's description. Accordingly, there is a
distinction between low cycle fatigue (LCF) for failure caused by plasticstrain amplitudes and high cycle fatigue (HCF) for failure caused by cyclicelastic strains only. As cyclic deformation in solder joints is of
predominantly plastic character, models describing LCF are generallyapplied.
The relation of number of cycles to failure Nf and the plastic strain ampli¬tude AepI proposed by Coffin and Manson is
AV-Ae, = C (2-19)
where Cc.m and a' are materials constants3. Mark the similar structure of
(2.18) and (2.19). As a' has usually values of = 0.5, doubling of the plasticstrain amplitude Aepl reduces the number of cycles to failure by a factor of
about 4.
In the following, some modifications of the Coffin-Manson relation are
considered.
3Cc.m is sometimes related to the elongation to fracture ef by Cc.m =(l/4)°'-Ef
30
1. Thefrequency-modified Coffin-Manson relationship
While (2.19) is able to model most of the data set of various metals and
alloys, significant deviation occur if testing conditions namely cycle shapeand cycle frequency are varied. In case of viscoplastic materials (e.g.solders at and above ambient temperature) the impact of frequency is
especially important. There is great need for a modification of the Coffin-
Manson relation that includes the test frequency v. A first approach to come
up to this requirement has been proposed by Coffin [Cof71], [Cof73] as
(Nf-vk-if-Aepl = Cc.m (2.20)
where v denotes the test frequency and k is a numerical parameter.
Obviously, for k=l, (2.20) transforms to (2.19). This is the case for high
frequencies and low temperatures, whereas at high temperatures and low
frequencies (v in the order of 10"3 s1), k comes close to zero [S0I88] and,
hence, the time to failure becomes constant at a fixed plastic strain
amplitude. The frequency dependent results are often due to difficulties in
separating the elastic and plastic strains. Especially when the total strain—
which is usually controlled—is small, the relaxation at longer times or
lower frequencies may change the ratio of elastic to plastic strain. This
problem is accentuated if thin film shear specimen are used where the
elastically stored deformation of the substrate exceeds by far the plasticdeformation in the solder joint.
2. The strain range partitioning approach
An alternative way to account for the shape and the frequency of the load
cycle is the strain rate partitioning (SRP) approach first proposed byManson et al. [Man71] and later extended by Halford and Manson [Hal76].
The general idea is to distinguish whether a cycle shape produces instanta¬
neous plastic strain or creep strain and whether the one or the other is
encountered in tension or compression. A further assumption is that for
every 'pure' form of die duty cycle (i.e., creep in tension and compression or
instantaneous plastic flow in both or creep in tension and plastic flow in
compression or vice versa) an equation of the form of (2.19) holds. Be Fy
31
the part of the cycle with condition i in tension and; in compression (with
ij...c(reep), p(lastic flow)) men the number of cycles to failure Nf is:
with Nl} being the number of cycles to failure for the pure cycle shape ij.
This is obviously a special case of the Palmgren-Miner-law that predictsfailure if
l£ = * <2-22>
with i? =1, if no interaction of the various steps or duty parts N1 occurs.
There are two applications of the SRP-approach which deserve special
mentioning: The first is that proposed by Solomon (S0I88) in order to
account for the case where k (from (2.20)) becomes zero and thus die time
to failure becomes constant (for a given plastic strain amplitude). Then, for
symmetric cycles (2.21) reduces to
1/ KJ+FPp-y (2.23)/ '/ / lcc / lypp
where tf is the time to failure, t^ denotes the time to creep failure, and v,
Fee, Fpp, and Npp have their above defined meaning.
Another interesting situation follows from the approach presented by Shine
and Fox [Shi88]. They assume that according to the constitutive behaviour
two distinct mechanisms have part in deformation which they call matrix
creep and grain boundary sliding. While matrix creep (mc) takes place at
higher stresses, the grain boundary sliding part (gbs) is prominent at low
strain rates. They formulated analogously to the SRP approach:
A=%,+%. (2-24)
where F, and N, have similar meanings as in (2.21) with i...gbs or mc. As in
superplastic materials the large deformations are only achieved if extensive
32
grain boundary sliding is present, it was further assumed that Ngbs » Nmc.Then (2.24) reduces to
N y =C(125)
"f Imc ^S-F
as 7mcx^mc- Q-f is determined to 890%. This result is especially
interesting for FEA implementation as it allows for assessment of damage
by simple accumulation of the overall strain independent from the strain
amplitude per cycle. For Coffin-Manson parameters with values *1, the
damage parameter co,with (o =0 for no damage and co =1 for complete
damage, may be estimated using the Palmgren-Miner-law and sum over the
different strain amplitudes i already encountered:
•*- N'^
co (2.26)'#;•#
It is thus possible to apply a 'localised Coffin-Manson approach' for local
damage evolution to a general joint geometry where the strain amplitudevaries throughout the joint.
The main difficulty with the whole SRP approach and its variations is the
determination of the portion of the various 'pure' cycle shapes. Moreover,
for the general description as in (2.21) at least 8 parameters have to be
determined independently.
3. The deformation energy approach
Another variation of the Coffin-Manson equation (2.19) is given by
N"' F -C(2.27)
where the plastic strain amplitude is replaced by the deformation energy,
given by die area of the hysteresis loop expressed by EcyC and the remaining
symbols keep their usual meaning. This description is ascribed to Morrow
[Mor65] although he provides even earlier sources. It seems to be a matter
of taste whether the original approach of Coffin and Manson or the
Morrow's model is used.
33
There is also a comprehensive approach to solder joint lifetime prediction
presented by Engelmaier, cf. e.g. [Eng83], [Eng85], [Eng92]. Starting from
a Coffin-Manson kind of equation, his model derives the total strain
amplitudes from geometrical data of the assembly. For leadless
components, he gives
*, =!
f2
LDAaATeI/O!'
(2.28)
and for leaded components results
N.=-f 2
F KD-(LD-AaATe)2A-A-1.38MPa
\lo(
(2.29)
where Lp denotes half the distance between two solder joints, Aa is
difference of the thermal expansion coefficient of PCB and device, A7^stands for the effective temperature range, h is the height of the solder joint,A is the load bearing area, Kr> stands for the diagonal flexural stiffness of
the lead, and F represents a free numerical parameter, which does not vary
considerably from 1. The Coffin-Manson parameter a' is given as
a' = -0.42 - 0.0006 • Ta + 0.0174 • (ln(l + 360/fD)) (2.30)
where Ta denotes the average temperature in °C and to stands for half the
cycle dwell time in minutes.
While the accuracy of the result depends to some extent on the free
numerical parameter F, Engelmaier's model is a good rule of thumb for a
wide range of applications, though extrapolation to not yet assessed geome¬
tries is to be called in question.
2.3.2 Crack propagation and fracture mechanics
In the Coffin-Manson approach the way by which the solder joint fails is
not specified. However, evolution of damage may well be considered as die
34
growth of a single crack. This is the case in joint failure estimations based
on fracture mechanics considerations.
The basic approach has been proposed by Paris and Erdogan [Par63].
^ = CPAK,r (2.31)dN
where the stress intensity range AK„ is related to the crack propagation per
cycle da/dN. Cp, np are material and environment dependent parameters. As
the stress intensity depends on the actual crack length a by AK„ « x 4a,the number of cycles to failure Nf can be determined by integration of (2.31)
leading to
AW . ,* (2-32)
where a0 is the initial crack length and a/ is the crack length at failure, i.e.,the length of the solder joint. The crucial assumption is the correct choice of
the initial crack length, as most of the life will be spend while the crack is
still small. However, as was shown by Solomon [Sol72] this approach maylead to erroneous results as it is based simply on stress state considerations
neglecting both plastic deformation range and time. Hence, fatigue life
prediction based on stress intensity ranges only should be treated with
caution.
These problems might be overcome by adopting the J-integral approach cf.
[Ric68], [Dow76,77,79]. Instead of stress intensity, the J-integral uses the
energy dissipated by plastic deformation in the region ahead of the crack.
Thus, the crack growth rate is given as
^- = C]AJn' (2.33)dN
where again Cj and tij are material and environmental parameters. Althoughthe J-integral is not defined for unloading, equation (2.33) has successfullybeen applied to modelling eutectic lead-tin solder [Guo92b,92c]. The
35
correlation of the cyclic strain energy, i.e., the area of the hysteresis loop, to
the crack growth rate has been comparatively successful [Guo92c].
Recently, the viscous analogue to the J-integral approach, the C*-integral,has been adopted to fatigue crack growth modelling cf. [Pao90,92]. The
data sets investigated by this approach are still rare, although preliminaryresults exhibit good agreement with data from the literature.
A major advantage of the modelling of the crack growth is that it is well-
suited for FEA. However, the implemented constitutive equation has a
tremendous impact on the crack growth rate, as stresses and strains are of
major importance. Furthermore, the assumption of one single crack growing
through the solder joint might be called in question; there is rather some
microcrack growth and coalescence reported [Sol94].
2.3.3 Homogeneous damage
The direct opposite to the single crack growth modelling is the assumptionof damage which is homogeneously distributed, i.e., it has no specific form.
The damage parameter co can be given as reduced load-bearing area:
m = ^r^- (2.34)
where A„ is the initial and A the actual load-bearing area. This concept has
first been proposed by Kachanov [Kac58] (see also [Kac86] and [Lem92]).
The value of the damage is not necessarily constant throughout the whole
structure under consideration, i.e., the solder joint. The homogeneousdistribution is assumed for a volume element with given damage parameter,but it may well differ for any neighbouring volume element. The effective
stress acting on the material is then
(T,=-2- (2.35)'<#1-ffl
36
where a denotes the smeared stress. As the constitutive behaviour is
considered to be independent of the damage state, the damage may be
introduced in any constitutive equation by replacing the applied stress bythe effective stress. This kind of description is well-suited for FE-
applications.
The evolution of the damage parameter co is usually given in form of a rate
equation. The main challenge is therefore to determine the variables and
their influence on the damage evolution. Another difficulty is to assess the
state of damage which is performed by monitoring depending variables, e.g.
electric resistivity, load drop, Young's modulus, density, hardness etc., as
discussed by Pluvinage and Raguet [Plu83]. Direct access might be
provided by ultrasonic microscopy as shown by Solomon [S0I86].
Solomon [Sol91] assessed the damage evolution in eutectic (60-40) tin-lead
solder in shear by monitoring the shear load drop in function of the number
of cycles. Provided the constitutive behaviour does not change its
characteristic throughout the test, the load drop is related to the damage
parameter coby
AP -APCO =
m (2.36)m
where AP denotes the actual loading range and APm the initial (or after earlystrain hardening: the maximal) loading range. He finds that the damageevolves according to
C0 = Aa-NB°> (2.37)
where N is the number of cycles and Aa, B^are numerical parameter. Bm
varies between 0.4 and 1.4 being smaller for smaller strain ranges.
In general, the state of damage CO can be expressed by a modified Palmgren-Miner-law:
37
where i denotes the different strain ranges in terms of size and AP the
number of cycles performed of each type i. Equation (2.38) requires that the
damage rate per cycle is independent of the actual damage state parameter
co.
The homogeneous damage approach differs considerably from the ideas
presented in die previous subsections. On the one hand, die form of damageevolution is distinct from that assumed in single crack growth: While in
crack propagation theories a volume element is broken (or not), the
homogeneous damage approach allows for a continuous transition from
co=0 to co=l. On the other hand, there is no scaling applied in the
homogeneous damage approach in order to transform results determined on
large specimen onto small scale specimen, e.g. solder joints. This impliesthat the form of the damage can be scaled arbitrarily, while microstructural
investigations usually report on cracks along grain-boundaries, which are
the same in large scale specimen as in small ones. On the other hand, singlecrack propagation as required for the analysis in subsection 2.3.2 is usuallythe case neither. Microcrack coalescence as 'real' damage behaviour lies
somewhere in between me two approaches discussed.
2.4 Mechanical testing strategies
One of the basic assumptions in mechanical testing is the independence of
specimen geometry and mechanical behaviour. While tiiis assumption holds
at a macroscopic level, it is no longer valid if the dimensions of the
deforming volume are of the order of the microstructural unit of the
material, i.e., grain or phase size. As was shown in Fig. 2.4, a solder joint in
the SMT is made up of but a few eutectic colonies. Therefore, the
mechanical behaviour of the solder in SMT solder joints may differ from
that encountered in bulk specimen.
In recent years, several publications have dealt with determining the
mechanical behaviour of solder material in thin solder joints. The various
specimen geometries and testing procedures in use are shortly reviewed and
discussed in the following.

38
2.4.1 Specimen design
As solder joints in SMD's are supposed to deform mainly in simple shear,
most of the proposed specimen geometries are designed for shear testing. A
synopsis of these various geometries is given in Fig. 2.10.
The solder joint are in general compared to the whole testing structure
consisting of the loading substrate and the joint. The assemblies either have
an axis (or a point) of symmetry in the specimen, Fig. 2.10a,b or there is a
plane of symmetry, Fig. 2.10c,d. The former are referred to as 'single lap-
joint specimen' while the latter are called 'double lap-joint specimen'. The
single lap joint has often been criticised since there is a bending moment in
the substrate due to the non-collinearity of the load. This causes additional
forces perpendicular to the solder joint and rotation of the solder joint plane
resulting in complex states of stress. Undoubtedly, design b in Fig. 2.10 is
an attempt to reduce this problem. However, the problem is not solved since
V\
solder
.-joint
imi
IFig. 2.10: Different designs of test specimen for thin solder joint shear testing, a) single
lap-joint specimen [Mei90] b) single lap-joint [Guo92a] c) double lap-joint [Tri88] and d)double lap-joint specimen [Mei92].
39
close to the solder joint the forces do not act on the same line.
Double lap-joint specimen, on the other hand, are suggested to solve the
problem owing to their higher symmetries. They don't really. They simplyinhibit rotation of the solder joint while the problem of bending still
remains. As mechanical analysis of the single lap-joint specimen in
appendix A shows, the rotation of the solder joint plane leads to normal
forces in the solder joint of about one thousandth part of the shear force
while bending resulted in normal stresses of a twentieth of the shear stress.
Since there is in fact no significant difference between single lap-joints and
double lap-joint specimen in terms of the mechanical situation, a distinction
may result from other features, e.g. production process and/or testing
requirements. One important point is the constancy of the solder joint'sthickness. Although at solder joint thickness of 200 to 300 um the problemof co-planarity is not that severe, the designs a,b, and d of Fig. 2.10 lack the
possibility to control the achieved solder joint thickness before testing.
Moreover, non-destructive microstructural investigations before and during
testing are not feasible. For even smaller joint thickness of about 50 um as
encountered in SMT, it is very difficult to produce double lap-joint
specimen with two solder joints of identical thickness.
The state of stress is far from simple shear close to the edge of the solder
joint as shear stresses must be zero at free surfaces and the stress tensor is
symmetric. As a rule of thumb the simple shear state is achieved at a
distance thrice the joint thickness from the solder joint's edge. Thus, a largecoherent soldered area minimises these boundary effects.
However, special care is required to avoid internal voids and bubbles in
soldering large areas. This becomes a severe problem for solder jointsthinner than 80 um. As the retaining forces acting onto the bubbles bysurface friction are about constant, the driving force owing to the buoyancydecreases with decreasing joint's thickness.
As mentioned above, the joint thickness has usually been kept in the range
between 150 and 300 um in recent investigations [Mei92, Fre88, Guo92a].
Thus, its dimension is about three orders of magnitude smaller than that of
the load frame. The elastic strain of the latter (typically about 0.1%) may
40
well lead to displacements in the order of the plastic strains within the
solder joint, as discussed in the following.
2.4.2 Unidirectional loading
Isothermal testing at various temperatures is considered the most appro¬
priate way to determine constitutive behaviour. If ever thermomechanical
fatigue is to be modelled by FEA, the material's behaviour will be described
in terms of isothermal data.
There are three testing procedures for the determination of time-dependent
plastic behaviour: 1) the creep test, during which the load (or the stress) is
kept constant and the strain is monitored versus time; 2) the relaxation test,
where the total strain (or more likely the displacement) is kept constant and
the stress level at different times is recorded; and 3) the tensile test, where
the strain rate (or in fact the cross-head speed) is kept constant and the
stress is measured in function of die strain.
The existence of a constitutive equation suggests that determining the
mechanical behaviour by one single testing procedure should enable to
predict the behaviour in any other testing procedure. However, as was
reviewed by Stone and Rashid [Sto94] there are significant differences in
constitutive parameters by determining them in different testing procedures.
The main reason for these differences are due to the fact that general
assumptions usually connected with different testing methods are no longervalid if testing is performed at small solder joint specimen instead of
comparably large bulk specimen.
As for the creep test the general assumption is that the strain rate decreases
in a first stage until it reaches a minimum value, the so-called steady-stateor stage II, followed by the stage of tertiary creep where the strain rate
steadily increases until rupture takes place. This picture is encountered in a
large number of typical structural materials and is schematically drawn in
Fig. 2.11. Without going into further detail, it results from building of a
stable dislocation network in primary creep, deforming in a state where
strain hardening (i.e., further production of dislocations) is consumed by
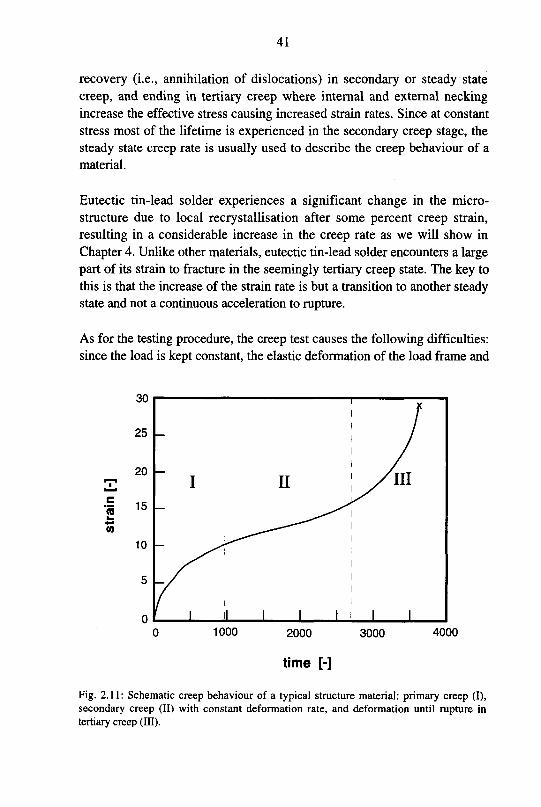
41
recovery (i.e., annihilation of dislocations) in secondary or steady state
creep, and ending in tertiary creep where internal and external neckingincrease the effective stress causing increased strain rates. Since at constant
stress most of the lifetime is experienced in the secondary creep stage, the
steady state creep rate is usually used to describe the creep behaviour of a
material.
Eutectic tin-lead solder experiences a significant change in the micro-
structure due to local recrystallisation after some percent creep strain,
resulting in a considerable increase in the creep rate as we will show in
Chapter 4. Unlike other materials, eutectic tin-lead solder encounters a large
part of its strain to fracture in the seemingly tertiary creep state. The key to
this is that the increase of the strain rate is but a transition to another steadystate and not a continuous acceleration to rupture.
As for the testing procedure, the creep test causes the following difficulties:
since the load is kept constant, the elastic deformation of the load frame and
JO
25
20 -
I
i
II An
train 15
tn
10
5
0 I ll I I I i i
1000 2000 3000
time [-]
4000
Fig. 2.11: Schematic creep behaviour of a typical structure material: primary creep (I),
secondary creep (II) with constant deformation rate, and deformation until rupture in
tertiary creep (III).
42
the substrate are constant as well except for some anelastic effects at the
beginning of the test. If stepped creep testing is applied, i.e., tests in which
the stress is changed after a certain amount of strain or time, there mightarise some problems especially at low strain rates (<5'10_6s1) owing to
anelastic effects, i.e., time dependent elasticity, in the substrate.
If stepped-load creep testing is applied, the problem arises whether there is
a change in microstructure during the test that would result in a change in
constitutive behaviour. This can be reduced if strain rates are measured over
small strain ranges only. Then, however, anelastic effects might influence
the results considerably.
Measuring strain rates over small strains is the characteristic feature of the
relaxation test. In fact, for the relaxation test the eminent assumption is that
the total strain is constant during die test, i.e.
ep, + eel = const.(2.39)
where eel denotes the elastic and epl the plastic strain during the test.
Differentiation of die above equation with respect to time leads to
Since the elastic deformation is proportional to the stress (Hook's law),
equation (2.40) equals
*„=-*/*<24,)
For bulk specimen, where the elastic strain is in the order of 10~3, relaxation
testing results in measuring strain rates over some orders of magnitudewithin a plastic strain range of 10-3 provided the elastic elongation of the
specimen is larger or of the same order as that in the load frame. As was
outlined above, the last assumption is no longer valid for thin solder joint
specimen. In mis case, the elastic strain in (2.40) is to be replaced by the
elastic elongation of either the load frame if testing is controlled by cross-
head displacement or the part of the substrate between the clips of the
elongation measuring unit. Moreover, the Young's modulus is to be
replaced by the ratio of assembly's stiffness k to the soldered area O.

43
If relaxation testing is performed at constant cross-head displacement the
plastic strain encountered by the solder joint may well be in the order of
100%. Thus, testing should not be expected to have taken place at constant
microstructure. Controlling the test by keeping the elongation of the clip
gauge constant may reduce the total plastic strain encountered by the solder
joint down to some few percents and comes quite close to testing at constant
microstructure. However, such tests require highly sophisticated equipment.
On the other hand, relaxation testing within some few percent plastic strain
reduces the influence of anelastic effects while it still provides creep data
over a wide range of strain rates.
Tensile testing, i.e., testing at a given strain rate, is usually not supposed to
raise any difficulties. However, if the stress changes during the test, it
becomes crucial whether the test is controlled by a constant cross-head
speed or by constant rate of elongation within the strain gauge. The plasticstrain rate yeff encountered by the soldered joint can be written as
7,ff= 7„-— (2-42)teff to
kh
where O is the soldered area and h stands for the solder joint thickness. yodenotes the rate of displacement imposed by the controlled movement of the
cross-head or the clips of the strain gauge. Again, k is the stiffness of the
load frame and f denotes the rate of load change. As the joint tiiickness
becomes small, the strain rate due to the decreasing load may be well largerthan the strain rate due to the regular displacement of the cross-head or
clips, respectively. Hence, in order to investigate any strain-hardening or
softening within lead-tin eutectic at constant strain rate, it is crucial to
control the strain rate by means of a clip gauge fixed as close as possible to
the solder joint. Alternatively, the additional strain rate due to load changes
may be accounted for in the testing software.
2.4.3 Cyclic loading
While in unidirectional testing the aim is mainly to determine the
parameters required for the constitutive equation, cyclic testing is applied in
order to simulate field conditions and their impact on fatigue life and relia-
44
bility of an electronic assembly. Owing to the shift of load cells, the thermal
expansion and the shift of the clip gauge and the thermal expansion of the
load frame that accompanies temperature changes, cyclic testing is usually
performed either isothermally by means of a cyclic changes of stress in a
tensile test machine or a fatigue apparatus or by cyclic variation of the
temperature in a heat chamber. In the latter case, the specimen is fixed in a
load frame whose thermal expansion differs from that of the specimen.Thus, cyclic deformation is applied in phase with the temperature cycles.
Isothermal testing
Isothermal testing is the most common way to assess fatigue behaviour of
solder material. If standard tensile test equipment and bulk specimen are
used, the parameters of testing, i.e., stress levels, strain amplitudes, and
strain rates, can easily be measured and controlled. For simplicity's sake
total strain controlled cyclic tests are performed frequently, which is
considered to provide results comparable to plastic strain controlled testing[Sol94]. Testing in the total strain control mode, the testing frequencybecomes important, especially at low total strain levels [Vay89]. This is due
to increasing fractions of plastic strain the more time is allowed to convert
elastic in plastic strain by relaxation.
Using shear test specimens, problems arise at decreasing joint thickness.
This is owing to the increasing stiffness of the solder joint compared to the
load frame and substrate [Sub89], [Wil90b]. In this case, a displacement,measured by either clip gauge or cross-head movement, is not necessarily a
plastic strain in the joint if the load changes as well. In displacementcontrolled testing, the displacement which is elastically stored in the
substrate may exceed the plastic amplitude of the solder joint. Here, the
cycle frequency is crucial in order to control the plastic strain owing to
relaxation.
Hence, tests on thin solder joints should be performed with care. The
simplest way to omit the mixing up of plastic strains in the joint and release
or accumulation of elastic strains in the substrate or load frame is to test in
constant load controlled mode.
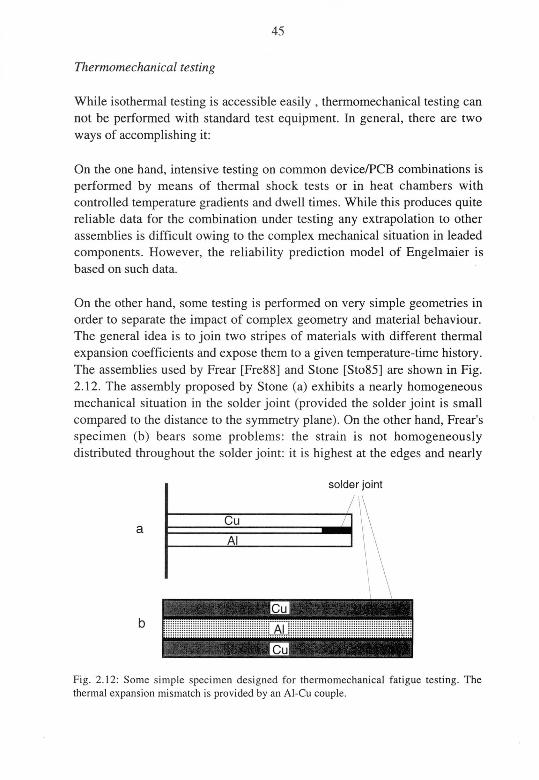
45
Thermomechamcal testing
While isothermal testing is accessible easily ,thermomechamcal testing can
not be performed with standard test equipment In general, there are two
ways of accomplishing it
On the one hand, intensive testing on common device/PCB combinations is
performed by means of thermal shock tests or in heat chambers with
controlled temperature gradients and dwell times While this produces quite
reliable data for the combination under testing any extrapolation to other
assemblies is difficult owing to the complex mechanical situation in leaded
components However, the reliability prediction model of Engelmaier is
based on such data.
On the other hand, some testing is performed on very simple geometries in
order to separate the impact of complex geometry and material behaviour
The general idea is to join two stripes of materials with different thermal
expansion coefficients and expose them to a given temperature-time history.The assemblies used by Frear [Fre88] and Stone [Sto85] are shown in Fig.2 12 The assembly proposed by Stone (a) exhibits a nearly homogeneousmechanical situation in the solder joint (provided the solder joint is small
compared to the distance to the symmetry plane) On the other hand, Frear's
specimen (b) bears some problems the strain is not homogeneouslydistributed throughout the solder joint it is highest at the edges and nearly
solder joint
Fig 2 12 Some simple specimen designed for thermomechamcal fatigue testing The
thermal expansion mismatch is provided by an Al Cu couple
46
vanishing at the centre.
In the 80's, Hall [Hal83,84,87] published a method to measure the strains
and stresses occurring in the solder joints of flat and stiff devices, e.g. a
ceramic resistor or a ceramic capacitor or a LCC(C). This method is based
on measuring the elastic deformation of the component, including bending,
and its changes due to temperature changes, from which the corresponding
stresses in the solder joint are derived. The bending is measured by
differential strain method and holographic interferometry. His data have
often been referenced since in order to validate the predictions of any
constitutive equation determined in isothermal testing, see Chapter 5.3 for
further comments.

47
Experimental procedure
3.1 Geometry of the test specimen
As discussed in the previous chapter, many different designs of shear test
specimens have been proposed in the literature. Some of them are single-lap-joint specimen as shown in Fig. 3.1, while others for reasons of higher
symmetry have been designed as double lap joint specimen (Fig. 2.10 d).
However, mechanical analysis reveals that the state of stress in a single lap
joint is quite close to simple shear, cf. Appendix A.l
In order to choose the appropriate specimen design, one has first to
formulate the goals of the testing and, thus, the boundary conditions. The
latter are in this case as follows:
/'" "• ' ' '' ..-I..—-*• - i —
Fig. 3.1: Picture of a single-lap-joint specimen as used in this work.
48
• Since real solder joints in electronics consist of but two or three largeeutectic colonies and as it has been found in microstructural
investigation that coarsened shear bands built at colony boundaries, the
thickness of the solder joint in testing is to be kept in the same order of
magnitude as in SMT applications, i.e. about 50 um. Accordingly, a
processing route is to be established that restricts solder joint thickness
variations to be smaller than 5 um.
• As microstructural investigation are planned to take place before,
during, and after testing, a specimen's geometry has to be chosen that
offers direct access to the joint by means of light microscopy and allows
direct checking of the joint diickness as well.
• Measuring the creep rates in small shear test specimen always means
measuring the rate of displacement at the substrate and divide it by the
joint thickness assuming that there is no creep in the substrate. It is well
known that usual creep rates of possible substrate materials, i.e. copper,
PCB material (reinforced epoxy), are much slower than those of lead-tin
solder. One though has to take into consideration the different
dimensions of the creeping objects. The substrate usually creeps over a
gauge length which exceeds the joint thickness by a factor of 103. Thus,
the creep rates of the substrate have to be slower than 105 times the
solder creep rate at a given force. This problem is accentuated the more
die solderjoint area exceeds the load bearing area of the substrate.
• Since the data are evaluated in terms of shear stress and shear creep
deformation, care is to be taken by inducing such a state of stress.
However, a field of simple shear stress is usually not attained near an
edge due to the symmetry of the stress tensor. Therefore, a solder jointshould exhibit a high (>50) width-to-thickness ratio.
Although various specimen geometries and processing routes have been
established in recent work (Section 2.4), none of them seems appropriate for
our case. Thus, a single lap joint specimen is designed that fulfils the above
mentioned requirements (Fig. 3.1). The requirement of a controlled solder
joint thickness is accounted for by placing an aluminium foil mask of
required thickness between the substrate plates defining the solder joint's
geometry (Fig. 3.2). The whole assembly is clamped together during the

49
bronze platelets
^ -^J^j^taluminium
Fig. 3.2: Explosion picture of the assembly used as single lap solder joint.
soldering process. Grinding and polishing on both sides allows to check the
joint thickness as well as to monitor the evolution of the microstructure
during testing. Since the creep resistance of pure copper is considered to be
too small, a CuSn8 bronze has been chosen as substrate material.
3.2 Processing of the specimen
Two CuSn8 bronze platelets of 15-20 mm width, 45 mm length and 3 mm
thickness were ground and polished on a copper/diamond disc since
grinding on emery paper would impair the planarity of the platelets by
significant cambering. The platelets were cleaned with acetone and covered
with a Multicore FSW 33 flux. Then the aluminium mask was placedbetween the substrate plates and a screwable clamp was tightly set around
the whole assembly. Subsequently, the whole assembly was dipped for 20 to
30 seconds into a solder bath at 230°C that was vibrated at about 400 Hz in
order to drive out any air bubbles that might still be in the joint.
To take care of the differences in fatigue behaviour depending on the
cooling rate of soldered joints [Mei92], the specimen were either quenchedin water or slowly cooled by placing them into a furnace at 230°C and
switching it off. Thus, cooling rates at 180°C in the order of 100°C/s and
about 0.04°C/s were achieved, cf. Fig 3.3.
After solidification, the solder was removed on both sides of the specimen
making microstructural investigation and joint thickness inspection possible.
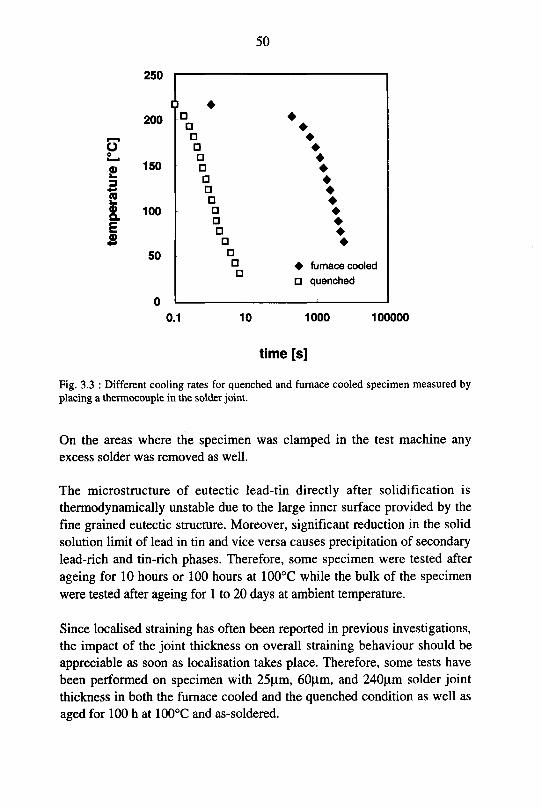
50
2
(0v.
0a
E
250
200
150
100
50
6D
D
D
D
D
D
D
D
D
D
D
D
Dfurnace cooled
D quenched
0.1 10 1000 100000
time [s]
Fig. 3.3 : Different cooling rates for quenched and furnace cooled specimen measured by
placing a thermocouple in the solder joint.
On the areas where the specimen was clamped in the test machine any
excess solder was removed as well.
The microstructure of eutectic lead-tin directly after solidification is
thermodynamically unstable due to the large inner surface provided by the
fine grained eutectic structure. Moreover, significant reduction in the solid
solution limit of lead in tin and vice versa causes precipitation of secondary
lead-rich and tin-rich phases. Therefore, some specimen were tested after
ageing for 10 hours or 100 hours at 100°C while the bulk of the specimen
were tested after ageing for 1 to 20 days at ambient temperature.
Since localised straining has often been reported in previous investigations,the impact of the joint thickness on overall straining behaviour should be
appreciable as soon as localisation takes place. Therefore, some tests have
been performed on specimen with 25pm, 60pm, and 240pm solder joint
thickness in both the furnace cooled and the quenched condition as well as
aged for 100 h at 100°C and as-soldered.
51
3.3 Testing strategies
3.3.1 Unidirectional testing
There are some constraints in testing since some crucial assumptions for
tensile testing and relaxation testing do not hold in case of thin solder joints.The problem is generally due to the fact that the test conditions, i.e. constant
rate of displacement and constant displacement, respectively, are controlled
by cross-head speed and cross-head position. This problem can be reduced
by controlling the test using an extensiometer.
The tests were run on a Zwick020 universal testing machine with a
temperature chamber covering a temperature range from -20°C up to 270°C.
The displacement measurement device is a two-sided Zwick inductive
extensiometer with a resolution limit of 4 nm. The extensiometer is limited
to a maximum displacement of ±2 mm and a maximum temperature of
80°C. The oven is able to keep the temperature constant within ±1°C.
For determination of general constitutive behaviour, load-step creep tests
have been used. Starting at high strain rates the stress was decreased by a
certain amount after the specimen had encountered a given plasticdeformation, usually 1.5% plastic strain or, alternatively, had been tested for
a given time, usually 1000 seconds. Within the whole deformation at a
given stress the strain rate was constant, not giving rise to prolonged strain
intervals as might be required in presence of extensive transition
phenomena.
Thus, steady state creep data were determined between 0°C and 80°C for
strain rates varying from 10~7 to lO'V.
In order to monitor the possible localisation of the strain, scratches were
drawn across the solder joint using a razor-blade.
It has been recognised that fracture did not take place immediately after the
onset of 'ternary creep' which was in line with findings of Morris and Mei
[Mor91]. Therefore, creep tests have been performed far into the ternary
52
creep range (80% overall strain) in order to find out about the generalbehaviour in this stage.
As the creep rates increased during these tests easily by two orders of
magnitude, the data recording became difficult due to a limited transient
memory. Therefore, tensile tests controlled by the inductive extensiometer
were used to monitor the creep behaviour over large deformations, i.e.
200% engineering strain. Since the elastic deformation in the substrate
between the gauges was in the order of 10% overall strain of the joint, the
displacement-rate of the extensiometer should be corrected in function of
the stress release rate in the test programme as was outlined in the previous
chapter. It turned out, however, that the combination of an internal and an
external controlling loop was too difficult to adjust. Thus, the test was
controlled by the extensiometer's displacement only, leading to variations in
the strain rate of 10% of the given value.
Load-step creep tests after the tensile tests revealed that the constitutive
behaviour had significantly changed not only in terms of generalacceleration but also in the strain rate sensitivity. Therefore, a test was
designed including both extended straining at constant rate and repeated
monitoring of the constitutive behaviour by means of load-step creep tests.
These tests were performed at a broad variety of test conditions, e.g.
temperature, ageing condition, and processing path of the specimen.
Since on one hand, a strain rate sensitivity for the recrystallised, coarsened
shear bands of 0.33 is reported in the literature and on the other hand, it was
argued that the shear band may deform superplastic, there was a need to
check whether grain boundary sliding (gbs), which is considered to be
indicative for superplastic deformation, is present in the solder joint. Hence,
the specimen were first polished down to 1/4 pm diamond paste and
subsequently shortly set on a rotating polishing disc containing 3 pm
diamond paste. Thus, a very fine pattern of scratches over the solder jointwas produced. If grain boundary sliding was present, offsets in scratches
over a grain or phase boundary would appear.
53
3.3.2 Cyclic Testing
In order to find a correlation between unidirectional behaviour and fatigue,some isothermal cyclic testing was performed at 40°C. Here again, the
strain controlled testing was done either at constant stress or constant strain
rate. The plastic strain ranges were varied between 1% and 15%.
Load-controlled cyclic straining was performed by applying a given load
and holding it until a certain amount of creep strain was reached.
Subsequently, the load was reversed and held until the same creep strain
was achieved. Thus one cycle was performed. As the testing was performedon shear specimen, there is no meaningful difference between tension and
compression as would exist while using tensile test specimen.
The strain rate-controlled testing was performed by applying a given load at
which creep rates were still slow and thus determining the stiffness of the
specimen. After having set the strain to zero, the machine was controlled bythe rate of displacement of the clip gauge allowing for changes in load. The
strain was calculated using the actual position of the clip gauge and the
change in load combined with the machine's stiffness. As soon as the
intended strain was reached, the actual load was reversed and, again, the
measurement was continued by controlling the rate of displacement of the
clip gauge.
3.4 Sample preparation for light microscopy
Sample preparation for light microscopy of tin-lead eutectics has been
successfully performed from the beginning of our century. The steps were
typically: grinding, polishing and subsequent etching. Difficulties arise in
microelectronics as large metallic parts are in electric contact with the
solder. Having a lower electro-chemical potential than Alloy42 or copper,
lead-tin dilutes very quickly in any etching process. Thus, preparation of
individual grains by grain boundary etching becomes difficult. In case of
our bronze-substrate solder joint specimen the problem is even accentuated.
Hence, a preparation technique that managed without etching is required.Such a technique has been developed by Wulff at CEM in Neumiinster
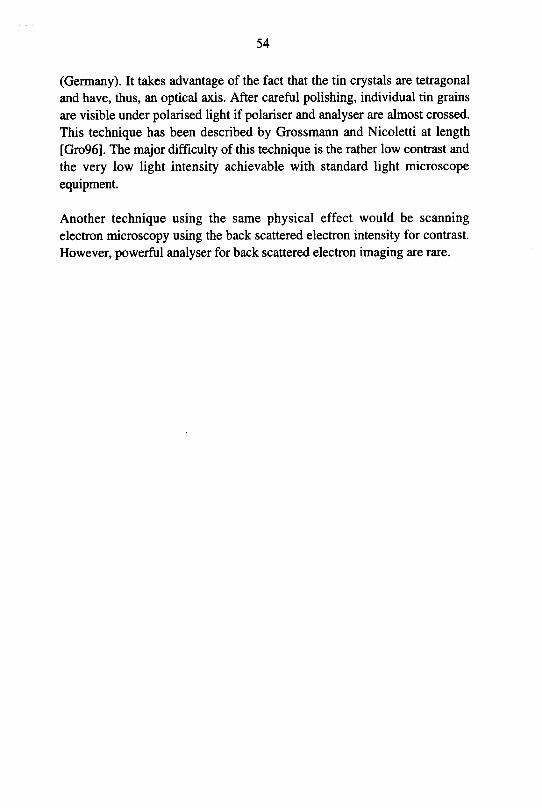
54
(Germany). It takes advantage of the fact that die tin crystals are tetragonal
and have, thus, an optical axis. After careful polishing, individual tin grains
are visible under polarised light if polariser and analyser are almost crossed.
This technique has been described by Grossmann and Nicoletti at length
[Gro96]. The major difficulty of this technique is the rather low contrast and
the very low light intensity achievable with standard light microscope
equipment.
Another technique using the same physical effect would be scanning
electron microscopy using the back scattered electron intensity for contrast.
However, powerful analyser for back scattered electron imaging are rare.
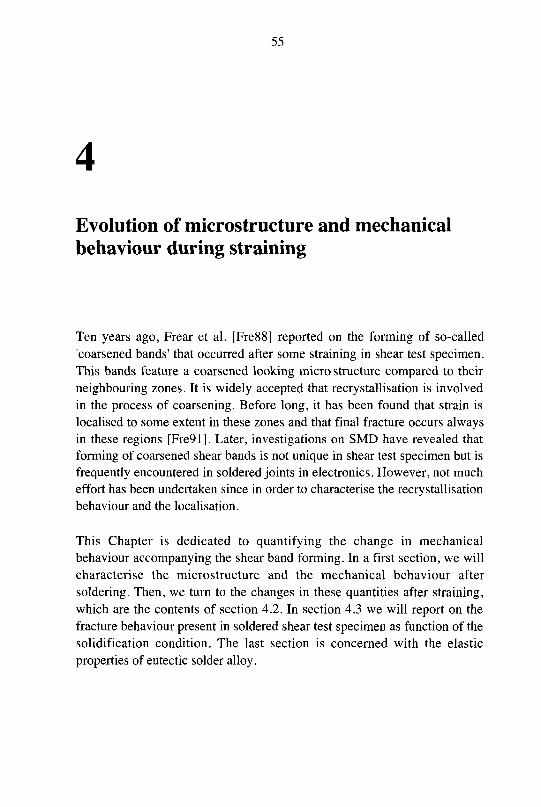
55
4
Evolution of microstructure and mechanical
behaviour during straining
Ten years ago, Frear et al. [Fre88] reported on the forming of so-called
'coarsened bands' that occurred after some straining in shear test specimen.This bands feature a coarsened looking micro structure compared to their
neighbouring zones. It is widely accepted that recrystallisation is involved
in the process of coarsening. Before long, it has been found that strain is
localised to some extent in these zones and that final fracture occurs always
in these regions [Fre91]. Later, investigations on SMD have revealed that
forming of coarsened shear bands is not unique in shear test specimen but is
frequently encountered in soldered joints in electronics. However, not much
effort has been undertaken since in order to characterise the recrystallisationbehaviour and the localisation.
This Chapter is dedicated to quantifying the change in mechanical
behaviour accompanying the shear band forming. In a first section, we will
characterise the microstructure and the mechanical behaviour after
soldering. Then, we turn to the changes in these quantities after straining,which are the contents of section 4.2. In section 4.3 we will report on the
fracture behaviour present in soldered shear test specimen as function of the
solidification condition. The last section is concerned with the elastic
properties of eutectic solder alloy.

56
4.1 Characterisation of mechanical behaviour and
microstructure after soldering
The mechanical behaviour of the eutectic lead-tin solder is significantlyinfluenced by the microstructure present and the process it has been
achieved by. As any kind of controlled working—which would change the
microstructure—is not viable in electronics, the only way to influence the
microstructure after soldering is by varying the rate of cooling during
solidification. Variation of the solder's composition, which would also
change the microstructure as proposed by Morris and Mei [Mor91] is not
considered in this work.
The thesis in hand deals with specimen soldered by two different solidifi¬
cation processes, the one being quenching in water and the other being slow
cooling in a switched-off furnace. We will first have a look on the micro-
structures present after both solidification processes and later the resulting
mechanical properties is presented.
4.1.1 Microstructures after solidification
After quenching, the microstructure consists of very fine dispersed lead-
phases, i.e., phase size of 1...2 um, embedded in a tin matrix. The
morphology of the lead phases is slightly elliptical, cf. the left hand picture
in Fig. 4.1. In the furnace cooled specimen the lead phases are generally
larger and more rod-like. The lead phases are oriented in the same direction
over large areas. At some spots even the typical lamellar eutectic structure
has evolved, as shown in Fig. 4.1 on the right. In the furnace cooled
specimen, there are some primary lead phases and some large intermetallics
presumably of the type CugSns present. The reason for the formation of the
former is the consumption of tin owing to the formation of the latter. In
quenched specimen where only little time is allowed to form intermetallics
neither large intermetallics nor primary lead-phases are present.
The large areas of correlated orientation of the lead phases found in the
slowly cooled specimen are identified as eutectic colonies as frequently
described in the literature. In fact, using the preparation technique given in
section 3.4, the tin phase in these colonies is found to exhibit one single
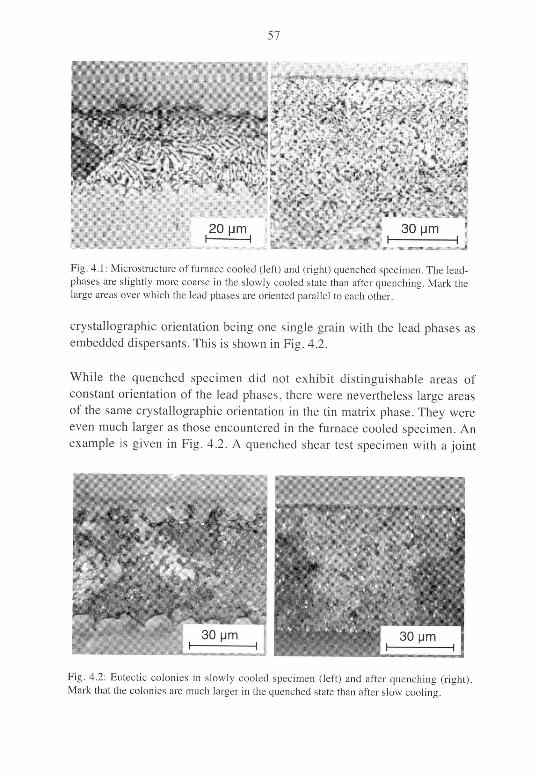
57
SJ ,""S I * * ««»* ^u^NmI
20 pm*
* 30 pm—l *. <-*"
,I
Fig 4 1 Microstructure of furnace cooled (left) and (right) quenched specimen The lead
phases are slightly more coarse in the slowly cooled state than after quenching Mark the
large areas over which the lead phases are oriented parallel to each other
crystallographic orientation being one single grain with the lead phases as
embedded dispersants This is shown in Fig 4 2
While the quenched specimen did not exhibit distinguishable areas of
constant orientation of the lead phases, there were nevertheless large areas
of the same crystallographic orientation in the tin matrix phase They were
even much larger as those encountered in the furnace cooled specimen An
example is given in Fig 4 2 A quenched shear test specimen with a joint
Fig 4 2 Eutectic colonies in slowly cooled specimen (left) and alter quenching (right)Mark that the colonies are much larger in the quenched state than after slow cooling
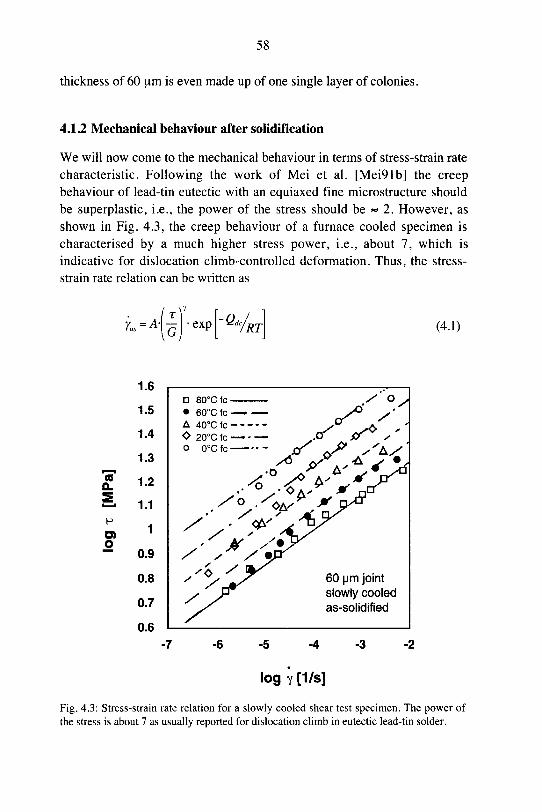
58
thickness of 60 um is even made up of one single layer of colonies.
4.12 Mechanical behaviour after solidification
We will now come to the mechanical behaviour in terms of stress-strain rate
characteristic. Following the work of Mei et al. [Mei91b] the creep
behaviour of lead-tin eutectic with an equiaxed fine microstructure should
be superplastic, i.e., the power of the stress should be < 2. However, as
shown in Fig. 4.3, the creep behaviour of a furnace cooled specimen is
characterised by a much higher stress power, i.e., about 7, which is
indicative for dislocation climb-controlled deformation. Thus, the stress-
strain rate relation can be written as
r--A\o •exp0*
'RT (4.1)
aa.
o
1.6
1.5
1.4
1.3
1.2
1.1
1
0.9
0.8
0.7
0.6
80°Cfc-
• 60°CfC-
/ Oy
cr yA 40°Cfc-----
O20°Cfc,.-
o 0°cfc y s>, ^''**
•y
60 pm joint
slowly cooled
as-solidified
-6 -4 -3
log y [1/s]
Fig. 4.3 Stress-strain rate relation for a slowly cooled shear test specimen. The power of
the stress is about 7 as usually reported for dislocation climb in eutectic lead-tin solder.
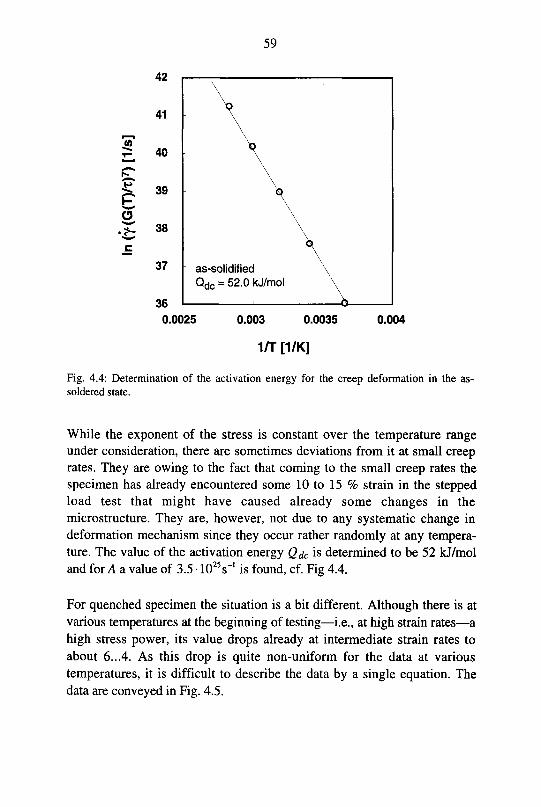
59
a
c
1/r [1/K]
Fig. 4.4: Determination of the activation energy for the creep deformation in the as-
soldered state.
While the exponent of the stress is constant over the temperature range
under consideration, there are sometimes deviations from it at small creep
rates. They are owing to the fact that coming to the small creep rates the
specimen has already encountered some 10 to 15 % strain in the steppedload test that might have caused already some changes in the
microstructure. They are, however, not due to any systematic change in
deformation mechanism since they occur rather randomly at any tempera¬
ture. The value of the activation energy Qdc is determined to be 52 kJ/mol
and for A a value of 3.5 • 1025s"' is found, cf. Fig 4.4.
For quenched specimen the situation is a bit different. Although there is at
various temperatures at the beginning of testing—i.e., at high strain rates—a
high stress power, its value drops already at intermediate strain rates to
about 6...4. As this drop is quite non-uniform for the data at various
temperatures, it is difficult to describe the data by a single equation. The
data are conveyed in Fig. 4.5.
42
41
40
39
38
37
36
0.0025
as-solidified
Qdc = 52.0 kJ/mol
0.003 0.0035 0.004
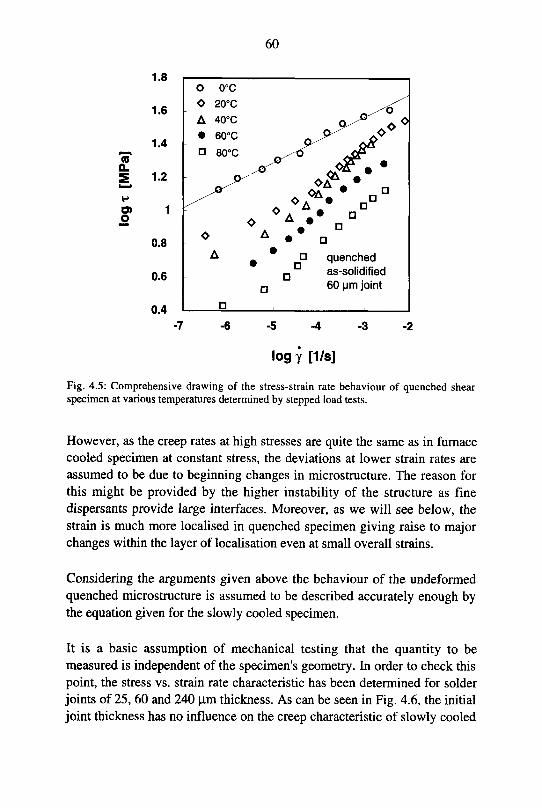
60
aQ.
o>o
1.8
1.6
1.4
1.2
1
0.8
0.6
0.4
n quenchedas-solidified
60 pm joint
-7 -6 -5 -4 -3 -2
log y [1/S]
Fig. 4.5: Comprehensive drawing of the stress-strain rate behaviour of quenched shear
specimen at various temperatures determined by stepped load tests.
However, as the creep rates at high stresses are quite the same as in furnace
cooled specimen at constant stress, the deviations at lower strain rates are
assumed to be due to beginning changes in microstructure. The reason for
this might be provided by the higher instability of the structure as fine
dispersants provide large interfaces. Moreover, as we will see below, the
strain is much more localised in quenched specimen giving raise to major
changes within the layer of localisation even at small overall strains.
Considering the arguments given above the behaviour of the undeformed
quenched microstructure is assumed to be described accurately enough bythe equation given for the slowly cooled specimen.
It is a basic assumption of mechanical testing that the quantity to be
measured is independent of the specimen's geometry. In order to check this
point, the stress vs. strain rate characteristic has been determined for solder
joints of 25, 60 and 240 um thickness. As can be seen in Fig. 4.6, the initial
joint thickness has no influence on the creep characteristic of slowly cooled
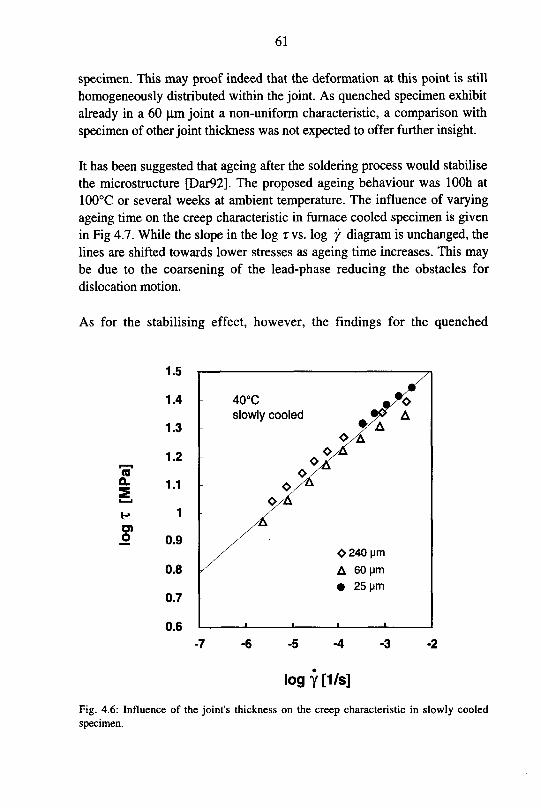
61
specimen. This may proof indeed that the deformation at this point is still
homogeneously distributed within the joint. As quenched specimen exhibit
already in a 60 um joint a non-uniform characteristic, a comparison with
specimen of omer joint thickness was not expected to offer further insight.
It has been suggested that ageing after the soldering process would stabilise
the microstructure [Dar92]. The proposed ageing behaviour was lOOh at
100°C or several weeks at ambient temperature. The influence of varying
ageing time on the creep characteristic in furnace cooled specimen is given
in Fig 4.7. While the slope in the log x vs. log y diagram is unchanged, the
lines are shifted towards lower stresses as ageing time increases. This may
be due to the coarsening of the lead-phase reducing the obstacles for
dislocation motion.
As for the stabilising effect, however, the findings for the quenched
1.5
1.4
1.3
1.2
75"
I "
p 1
O)O 0.9
0.8
0.7
0.6
-7 -6 -5 -4 -3 -2
log y [1/S]
Fig. 4.6: Influence of the joint's thickness on the creep characteristic in slowly cooled
specimen.
40°C^*0
slowly cooled *P A
o/L
o/^<>/*
OxA
/ <> 240 |im
/ A 60 um
• 25 um
i i i

62
aa.
o
1.5
1.3
1.1
0.9
0.7
0.5
60 pm joint40°C
slowly cooled
D no age
A 10h 100°C
O 100h 100°C
-7 -6 -3
logY [1/s]
Fig. 4.7: Influence of the ageing time on the creep characteristic in slowly cooled
specimen.
microstructure indicate that there is no significant influence of the ageing as
the data at lower strain rates are still far from keeping to a straight line.
42 Changes due to straining
Performing creep tests to rupture, it has been recognised that the strain rate
at constant load increased after about 5 to 10% deformation suggesting that
the material had entered the stage of tertiary creep, which is usuallyconsidered to be the beginning of catastrophic failure. However, rupture did
not take place within the next 80% of deformation. Subsequent testingrevealed that the stress strain rate characteristic has significantly changed bythe preceded deformation. While a power-law was still able to describe the
data, the stress power had changed indicating that the basic rate controlling
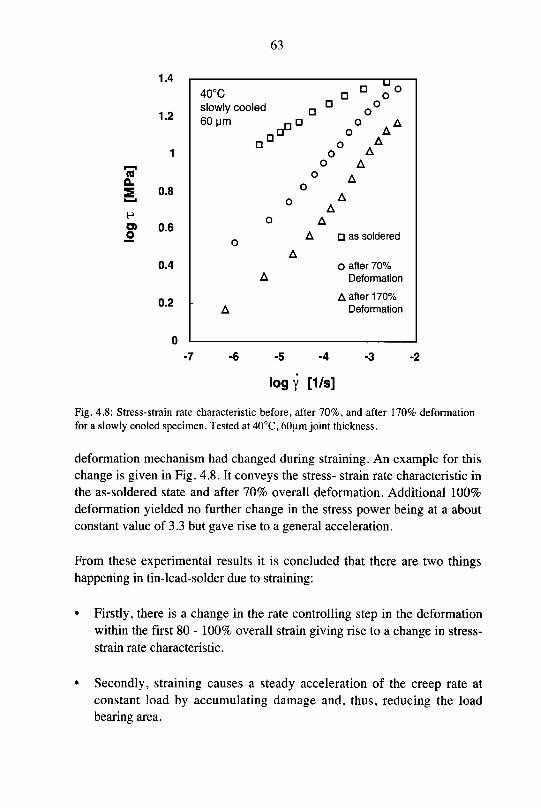
63
Q.
1.4
1.2
0.8
9> 0.6
0.4
0.2
40°C D O
slowly cooled D OD O
60 um
D
D ° aADu O A
O A
O A
°A
o
o A
oA n as soldered
A
O after 70%
A Deformation
A after 170%
A Deformation
-5 -4
logy [1/s]
-2
Fig 4 8 Stress-strain rate characteristic before, after 70%, and after 170% deformation
for a slowly cooled specimen Tested at 40°C, 60um joint thickness
deformation mechanism had changed during straining An example for this
change is given in Fig 4 8 It conveys the stress- strain rate characteristic in
the as-soldered state and after 70% overall deformation Additional 100%
deformation yielded no further change in the stress power being at a about
constant value of 3 3 but gave rise to a general acceleration
From these experimental results it is concluded that there are two things
happening in tin-lead-solder due to straining
• Firstly, there is a change in the rate controlling step in the deformation
within the first 80 - 100% overall strain giving rise to a change in stress-
strain rate characteristic
Secondly, straining causes a steady acceleration of the creep rate at
constant load by accumulating damage and, thus, reducing the load
bearing area
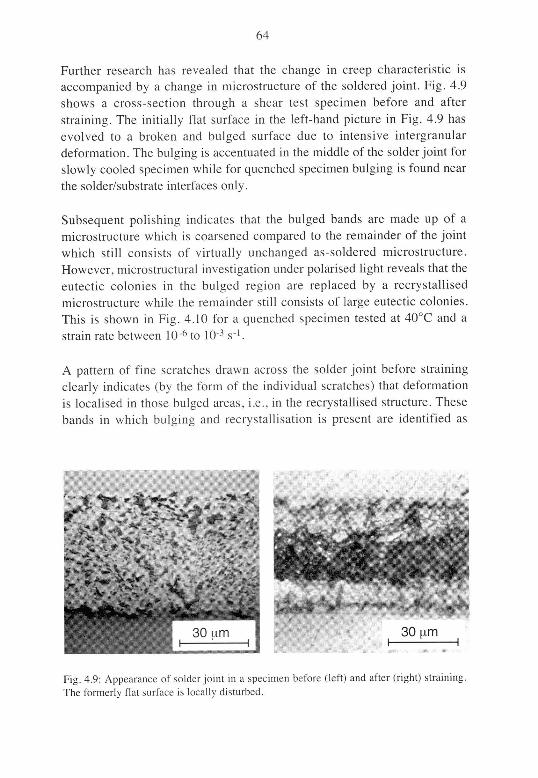
64
Further research has revealed that the change in creep characteristic is
accompanied by a change in microstructure of the soldered joint. Fig. 4.9
shows a cross-section through a shear test specimen before and after
straining. The initially flat surface in the left-hand picture in Fig. 4.9 has
evolved to a broken and bulged surface due to intensive intergranular
deformation. The bulging is accentuated in the middle of the solder joint for
slowly cooled specimen while for quenched specimen bulging is found near
the solder/substrate interfaces only.
Subsequent polishing indicates that the bulged bands are made up of a
microstructure which is coarsened compared to the remainder of the joint
which still consists of virtually unchanged as-soldered microstructure.
However, microstructural investigation under polarised light reveals that the
eutectic colonies in the bulged region are replaced by a recrystallised
microstructure while the remainder still consists of large eutectic colonies.
This is shown in Fig. 4.10 for a quenched specimen tested at 40°C and a
strain rate between 10~6 to 10~3 s'.
A pattern of fine scratches drawn across the solder joint before straining
clearly indicates (by the form of the individual scratches) that deformation
is localised in those bulged areas, i.e., in the recrystallised structure. These
bands in which bulging and recrystallisation is present are identified as
Fig. 4.9: Appearance of solder joint in a specimen before (left) and after (right) straining.
The formerly flat surface is locally disturbed.
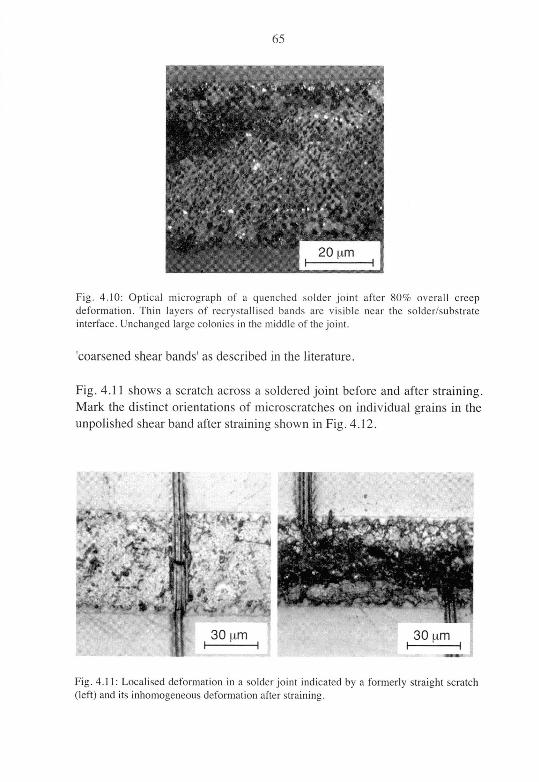
65
Fig 4 10 Optical micrograph of a quenched solder joint after 80% overall creep
deformation Thin layers of recrystallised bands are visible near the solder/substrate
interface Unchanged large colonies in the middle of the joint
'coarsened shear bands as described in the literature
Fig 4 11 shows a scratch across a soldered joint before and after straining
Mark the distinct orientations of microscratches on individual grains in the
unpolished shear band after straining shown in Fig 4 12
30 um 30 um1 I —
Fig 4 11 Localised deformation in a solder joint indicated by a formerly straight scratch
(left) and its inhomogeneous deformation after straining
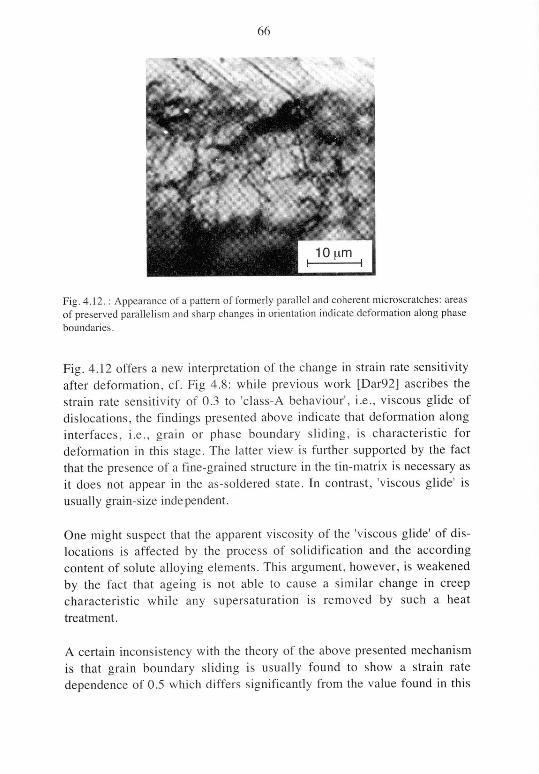
66
Fig. 4.12. : Appearance of a pattern of formerly parallel and coherent microscratches: areas
of preserved parallelism and sharp changes in orientation indicate deformation along phase
boundaries.
Fig. 4.12 offers a new interpretation of the change in strain rate sensitivity
after deformation, cf. Fig 4.8: while previous work [Dar92] ascribes the
strain rate sensitivity of 0.3 to 'class-A behaviour', i.e., viscous glide of
dislocations, the findings presented above indicate that deformation along
interfaces, i.e., grain or phase boundary sliding, is characteristic for
deformation in this stage. The latter view is further supported by the fact
that the presence of a fine-grained structure in the tin-matrix is necessary as
it does not appear in the as-soldered state. In contrast, 'viscous glide' is
usually grain-size independent.
One might suspect that the apparent viscosity of the 'viscous glide' of dis¬
locations is affected by the process of solidification and the according
content of solute alloying elements. This argument, however, is weakened
by the fact that ageing is not able to cause a similar change in creep
characteristic while any supersaturation is removed by such a heat
treatment.
A certain inconsistency with the theory of the above presented mechanism
is that grain boundary sliding is usually found to show a strain rate
dependence of 0.5 which differs significantly from the value found in this
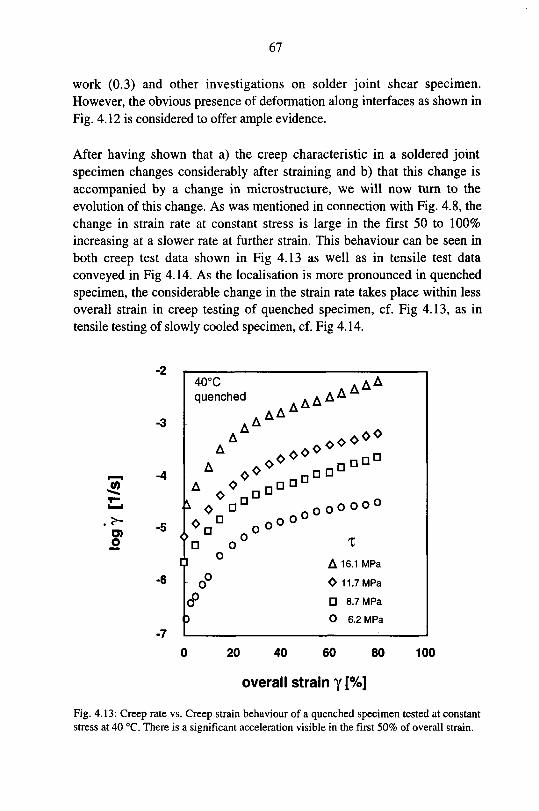
67
work (0.3) and other investigations on solder joint shear specimen.
However, the obvious presence of deformation along interfaces as shown in
Fig. 4.12 is considered to offer ample evidence.
After having shown that a) the creep characteristic in a soldered joint
specimen changes considerably after straining and b) that this change is
accompanied by a change in microstructure, we will now turn to the
evolution of this change. As was mentioned in connection with Fig. 4.8, the
change in strain rate at constant stress is large in the first 50 to 100%
increasing at a slower rate at further strain. This behaviour can be seen in
both creep test data shown in Fig 4.13 as well as in tensile test data
conveyed in Fig 4.14. As the localisation is more pronounced in quenched
specimen, the considerable change in the strain rate takes place within less
overall strain in creep testing of quenched specimen, cf. Fig 4.13, as in
tensile testing of slowly cooled specimen, cf. Fig 4.14.
-2
i—i -4
JO
O)o
40°C
quenched
AA',aA'
AAV^
A 0° DDO°A A°n°D
0Dn oO°0°D O
O
o*00
0°
oooooo
x
A 16.1 MPa
O 11.7 MPa
8.7 MPa
O 6.2 MPa
20 40 60 80
overall strain y[%]
100
Fig. 4.13: Creep rate vs. Creep strain behaviour of a quenched specimen tested at constant
stress at 40 CC. There is a significant acceleration visible in the first 50% of overall strain.
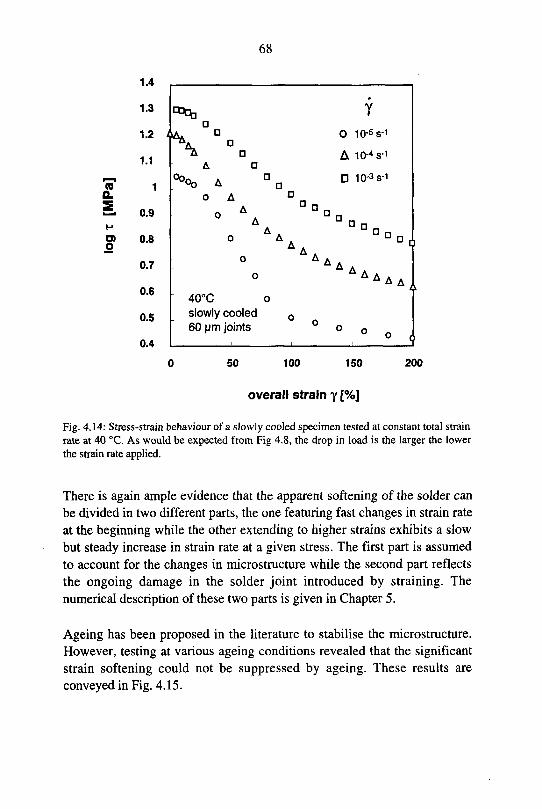
68
aQ.
o
1.4
1.3 **)|
1.1
*a
1.2 AA* a
T\ o
A
1 l°°°° A
O A
0.9
0.8
0.7
0.6
0.5
0.4
Y
O 10-5 S"1
A 10-4S-1
10-3S-1
AAAA
40°C o
slowly cooled0
60 pm joints
0 50 100 150 200
overall strain y [%]
Fig. 4.14: Stress-strain behaviour of a slowly cooled specimen tested at constant total strain
rate at 40 °C. As would be expected from Fig 4.8, the drop in load is the larger the lower
the strain rate applied.
There is again ample evidence that the apparent softening of the solder can
be divided in two different parts, the one featuring fast changes in strain rate
at the beginning while the other extending to higher strains exhibits a slow
but steady increase in strain rate at a given stress. The first part is assumed
to account for the changes in microstructure while the second part reflects
the ongoing damage in the solder joint introduced by straining. The
numerical description of these two parts is given in Chapter 5.
Ageing has been proposed in the literature to stabilise the microstructure.
However, testing at various ageing conditions revealed that the significant
strain softening could not be suppressed by ageing. These results are
conveyed in Fig. 4.15.

69
There is, as was expected from Fig. 4.7, a decrease of general stress level
with increasing ageing time. The form and the kinetics of the transition,
however, are not affected by ageing.
One of the direct implications of the above described localised deformation
is that the initial joint thickness is important, as measurement is usually
performed in terms of relative displacement of the two substrate platelets.
The strain rate in the solder is then calculated by dividing the rate of
displacement by the joint's thickness. If localised strain is present in a shear
band, the remainder of the joint contributes virtually nothing to the
displacement compared to the strain in the shear band. Therefore, it is the
thickness of the shear band that influences the measurable rate of dis¬
placement rather than the joint thickness. The calculation of the strain rate,
however, is significantly affected.
1.5
1.4
1.3
[MPa]1.2
1.1
k
log1
0.9
0.8
0.7
0.6
0 50 100 150 200
overall strain y [%]
Fig. 4.15: Stress-strain behaviour of slowly cooled specimen at various ageing conditions
tested at constant overall strain rate at 40°C. The decrease in applied stress in the specimen
is of similar nature for all specimen.
O no age
A10h100°C
100h 100°C
60 pm
slowly cooled
40°C
overall strain rate 10"3s"1
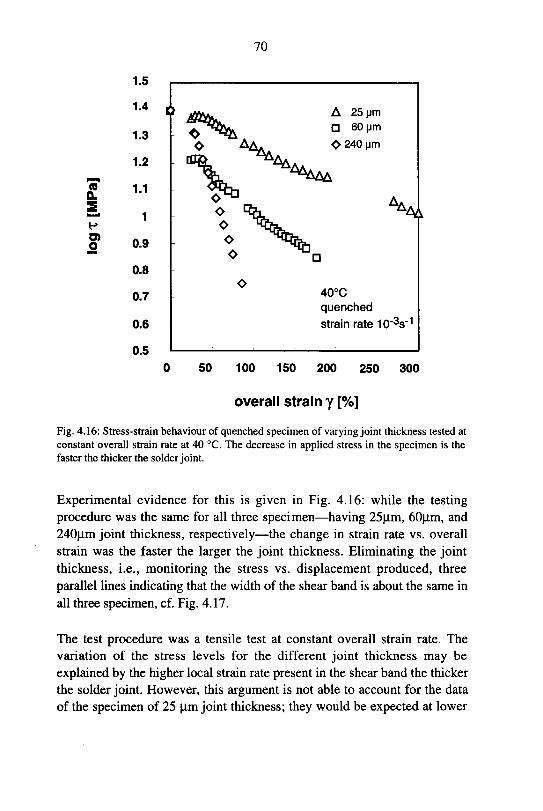
70
1.5
1.4
1.3
1.2
ToQ.
2
1.1
1
log 0.9
0.8
0.7
0.6
0.5
0 50 100 150 200 250 300
overall strain y [%]
Fig. 4.16: Stress-strain behaviour of quenched specimen of varying joint thickness tested at
constant overall strain rate at 40 °C. The decrease in applied stress in the specimen is the
faster the thicker the solder joint.
Experimental evidence for this is given in Fig. 4.16: while the testing
procedure was the same for all three specimen—having 25(im, 60|im, and
240(i.m joint thickness, respectively—the change in strain rate vs. overall
strain was the faster the larger the joint thickness. Eliminating the jointthickness, i.e., monitoring the stress vs. displacement produced, three
parallel lines indicating that the width of the shear band is about the same in
all three specimen, cf. Fig. 4.17.
The test procedure was a tensile test at constant overall strain rate. The
variation of the stress levels for the different joint thickness may be
explained by the higher local strain rate present in the shear band the thicker
the solder joint. However, this argument is not able to account for the data
of the specimen of 25 p.m joint thickness; they would be expected at lower
fV^ t^ja.60 pm
O A&. O 240 um
o
o
o
40°C
quenched
strain rate 10"3s"1
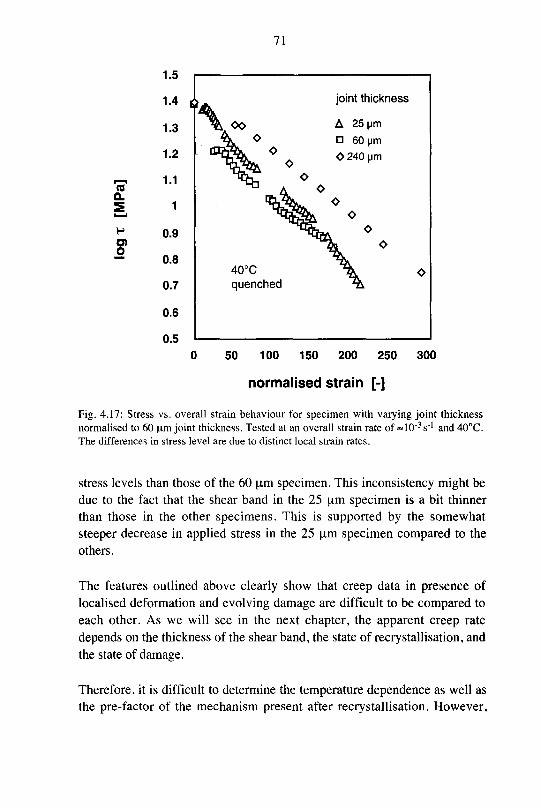
71
(00.
O)O
joint thickness
A 25 pm
60 um
O 240 um
50 100 150 200 250
normalised strain [-]
300
Fig 4 17 Stress vs overall strain behaviour for specimen with varying joint thickness
normalised to 60 um joint thickness Tested at an overall strain rate of ~10 3s ' and 40°C
The differences in stress level are due to distinct local strain rates
stress levels than those of the 60 um specimen This inconsistency might be
due to the fact that the shear band in the 25 um specimen is a bit thinner
than those in the other specimens This is supported by the somewhat
steeper decrease in applied stress in the 25 um specimen compared to the
others
The features outlined above clearly show that creep data in presence of
localised deformation and evolving damage are difficult to be compared to
each other As we will see in the next chapter, the apparent creep rate
depends on the thickness of the shear band, the state of recrystallisation, and
the state of damage
Therefore, it is difficult to determine the temperature dependence as well as
the pre-factor of the mechanism present after recrystallisation However,
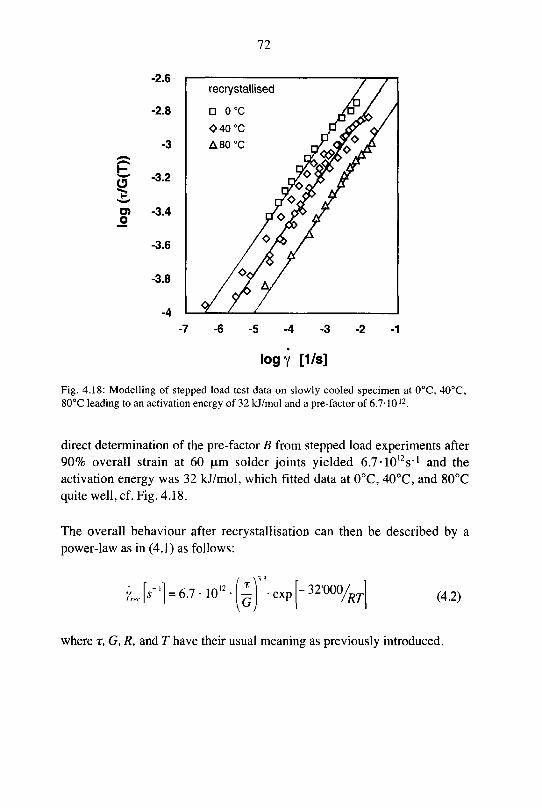
72
O
o
-7
logy [1/s]
Fig 4 18 Modelling of stepped load test data on slowly cooled specimen at 0°C 40°C
80°C leading to an activation energy of 32 kJ/mol and a pre factor of 6 7 1012
direct determination of the pre-factor B from stepped load experiments after
90% overall strain at 60 um solder joints yielded 6 7 1012s ' and the
activation energy was 32 kJ/mol, which fitted data at 0°C, 40°C, and 80°C
quite well, cf Fig 4 18
The overall behaviour after recrystallisation can then be described by a
power-law as in (4 1) as follows
[*-'] = 6 7 1012 exp32''000/
RT (4 2)
where t, G, R, and T have their usual meaning as previously introduced
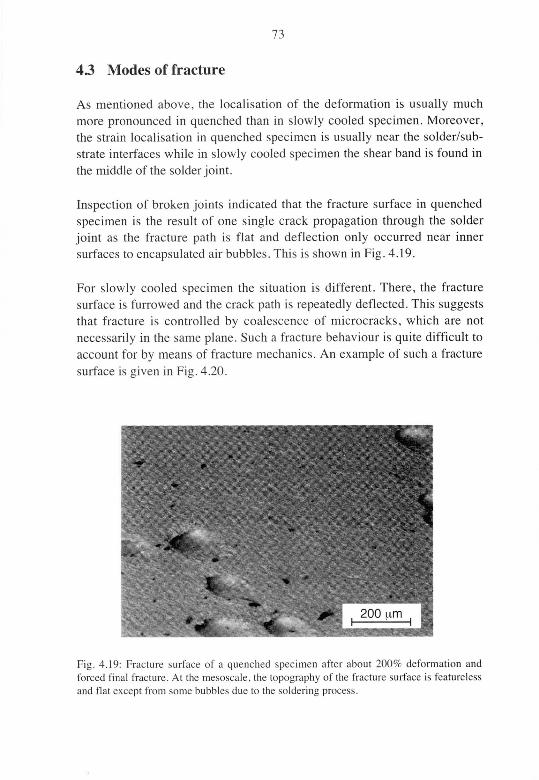
73
43 Modes of fracture
As mentioned above, the localisation of the deformation is usually much
more pronounced in quenched than in slowly cooled specimen. Moreover,
the strain localisation in quenched specimen is usually near the solder/sub¬
strate interfaces while in slowly cooled specimen the shear band is found in
the middle of the solder joint.
Inspection of broken joints indicated that the fracture surface in quenched
specimen is the result of one single crack propagation through the solder
joint as the fracture path is flat and deflection only occurred near inner
surfaces to encapsulated air bubbles. This is shown in Fig. 4.19.
For slowly cooled specimen the situation is different. There, the fracture
surface is furrowed and the crack path is repeatedly deflected. This suggests
that fracture is controlled by coalescence of microcracks, which are not
necessarily in the same plane. Such a fracture behaviour is quite difficult to
account for by means of fracture mechanics. An example of such a fracture
surface is given in Fig. 4.20.
Fig 4.19' Fracture surface of a quenched specimen after about 200% deformation and
forced final fracture. At the mesoscale, the topography of the fracture surface is featureless
and flat except from some bubbles due to the soldering process.
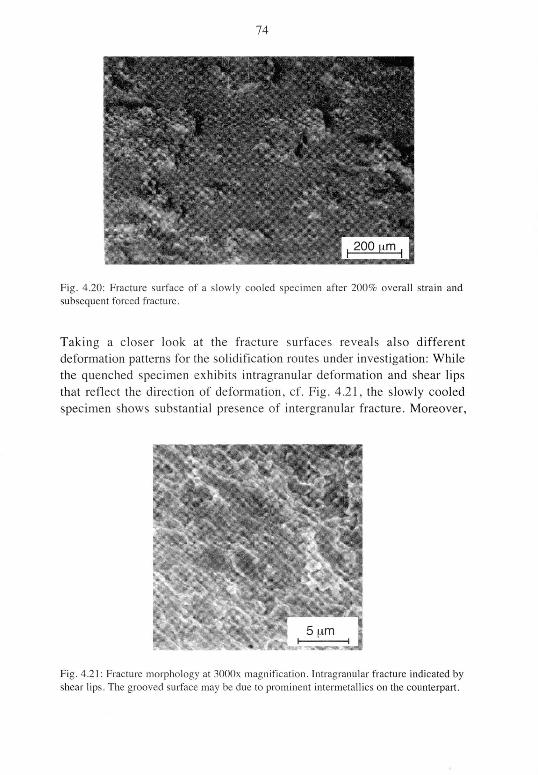
74
Fig 4 20 Fracture suilace of a slowly cooled specimen after 200% overall strain and
subsequent forced fracture
Taking a closer look at the fracture surfaces reveals also different
deformation patterns for the solidification routes under investigation While
the quenched specimen exhibits intragranular deformation and shear lipsthat reflect the direction of deformation, cf Fig 4 21, the slowly cooled
specimen shows substantial presence of intergranular fracture Moreover,
Fig 4 21 Fracture morphologv at 3000x magnification Intragranular fracture indicated byshear lips The grooved surface may be due to prominent intermetallics on the counterpart
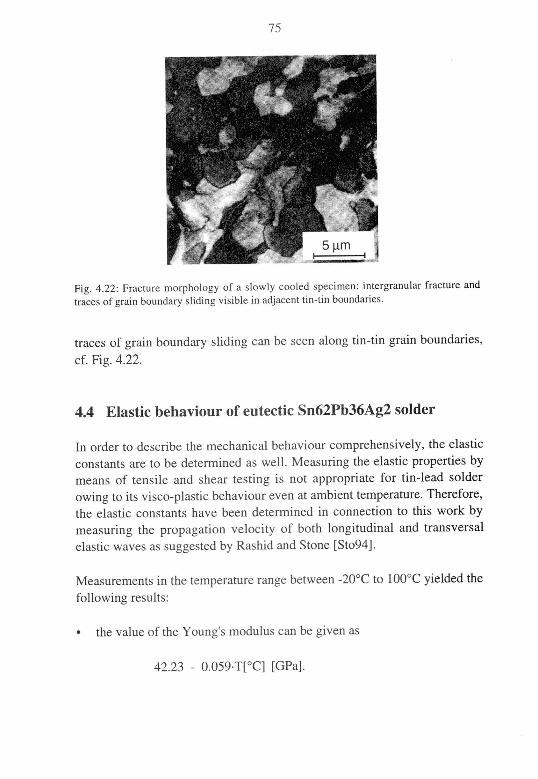
75
Fig. 4.22: Fracture morphology of a slowly cooled specimen: intergranular fracture and
traces of grain boundary sliding visible in adjacent tin-tin boundaries.
traces of grain boundary sliding can be seen along tin-tin grain boundaries,
cf. Fig. 4.22.
4.4 Elastic behaviour of eutectic Sn62Pb36Ag2 solder
In order to describe the mechanical behaviour comprehensively, the elastic
constants are to be determined as well. Measuring the elastic properties by
means of tensile and shear testing is not appropriate for tin-lead solder
owing to its visco-plastic behaviour even at ambient temperature. Therefore,
the elastic constants have been determined in connection to this work by
measuring the propagation velocity of both longitudinal and transversal
elastic waves as suggested by Rashid and Stone [Sto94].
Measurements in the temperature range between -20°C to 100°C yielded the
following results:
• the value of the Young's modulus can be given as
42.23 - 0.059-T[°C] [GPa].
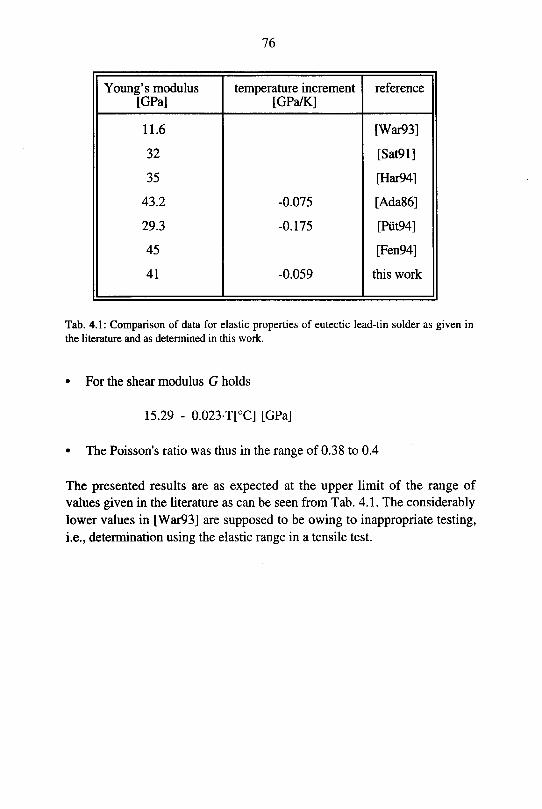
76
Young's modulus
[GPa]temperature increment
[GPa/K]
reference
11.6 [War93]
32 [Sat91]
35 [Har94]
43.2 -0.075 [Ada86]
29.3 -0.175 [Put94]
45 [Fen94]
41 -0.059 this work
Tab. 4.1: Comparison of data for elastic properties of eutectic lead-tin solder as given in
the literature and as determined in this work.
• For the shear modulus G holds
15.29 - 0.023-T[°C] [GPa]
• The Poisson's ratio was thus in the range of 0.38 to 0.4
The presented results are as expected at the upper limit of the range of
values given in the literature as can be seen from Tab. 4.1. The considerablylower values in [War93] are supposed to be owing to inappropriate testing,
i.e., determination using the elastic range in a tensile test.

77
5
Implementing microstructural evolution into a
constitutive equation's framework
Chapter 4 has dealt with the evolution of microstructure and mechanical
behaviour in conjunction with straining. In this chapter, we develop how
this behaviour can be integrated in a constitutive equation's framework. We
intentionally wrote 'can' since there might be different ways to incorporatethe features presented in the last section, although it has not been performedso far. However, we choose a form in which the parameters in use have a
physical meaning.
As postulated by Stone and Rashid [Sto94], a constitutive description has to
be based on 'a well defined phenomenology, a basis in empirical data, and a
basis in mechanism'. Having provided the basis in empirical data and
having discussed to some extent the underlying mechanisms we will now
turn to die phenomenology.
We start at the mechanical behaviour present in the unstrained state after
soldering. We postulate that in this state the stress-strain rate behaviour can
be described by a typical power-law expression, i.e.
7^3.5.1O»{0-exp[-52'OO%7,] (5-1)

78
as confirmed by Fig. 4.3. We further postulate, that straining—whetherlocalised or not—causes changes in the microstructure which mainly result
from recrystallisation. The recrystallised part, then, exhibits a characteristic
mechanical behaviour distinct from that in the as-soldered parts. This
characteristic behaviour of the recrystallised part is also described by a
power-law (i.e. appears as a linear relationship in a double logarithmic plot)as demonstrated in Fig. 4.18. We further postulate that deforming the
recrystallised structure causes damage. In the following section we will
develop the mathematics necessary to model the transition from the as-
soldered to the recrystallised state. The introduction of damage will be the
contents of section 5.2. In section 5.3 the capability of the model in
describing independent data sets is tested. Section 5.4 deals with the
generalisation of the results presented in the preceding sections.
5.1 Modelling of the transition from the as-soldered to the
recrystallised state
Consider a 2.5-dimensional model of a solder joint as shown in Fig. 5.1.
divided in k*l rod-like volume elements which are identified by the
subscript indices i and j of their position with 1 < i < k and 1 <j<l. For
simplification's sake we assume that a) the stress transmitted from the y'th
layer to the y'+7th is constant and b) for reasons of continuity the shear
deformation of all elements i in a layer j must be equal.
Consider the solder joint in unidirectional shear at constant temperature and
moderate strain rates, i.e., < 10~4s-'. Assumed a random volume element agh
Fig 5.1 Schematic drawing of the mechanical model The model extends in the
direction perpendicular to the drawing plane by a thickness of unity
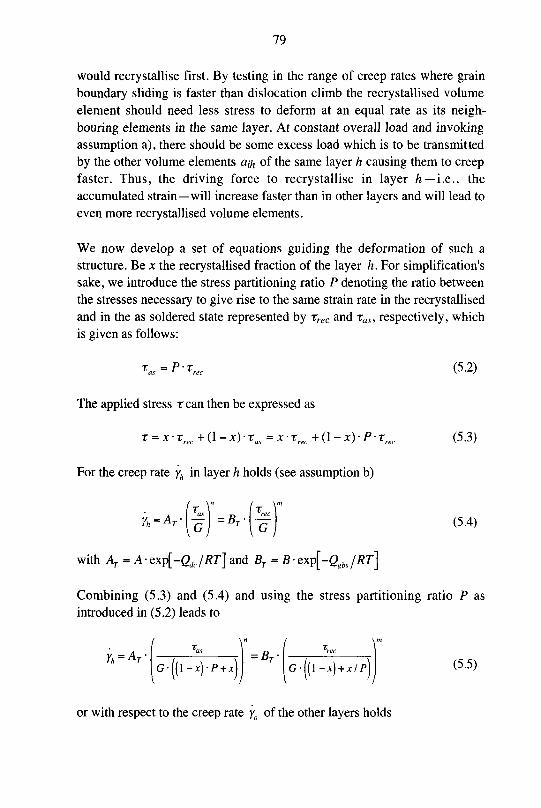
79
would recrystallise first. By testing in the range of creep rates where grain
boundary sliding is faster than dislocation climb the recrystallised volume
element should need less stress to deform at an equal rate as its neigh¬
bouring elements in the same layer. At constant overall load and invoking
assumption a), there should be some excess load which is to be transmitted
by the other volume elements ath of the same layer h causing them to creep
faster. Thus, the driving force to recrystallise in layer h — i.e., the
accumulated strain—will increase faster than in other layers and will lead to
even more recrystallised volume elements.
We now develop a set of equations guiding the deformation of such a
structure. Be x the recrystallised fraction of the layer h. For simplification's
sake, we introduce the stress partitioning ratio P denoting the ratio between
the stresses necessary to give rise to the same strain rate in the recrystallisedand in the as soldered state represented by rrec and ras, respectively, which
is given as follows:
ras = P-rm (5.2)
The applied stress rcan then be expressed as
r = x-trec + (l-x)-Tas = x-trec+(l-x)-P-Trec (5.3)
For the creep rate yh in layer h holds (see assumption b)
rec£'-*Yk = at
with \ = A-exp[-erfc//?r] and BT = B exp[-£8fa/RT]
(5.4)
Combining (5.3) and (5.4) and using the stress partitioning ratio P as
introduced in (5.2) leads to
Yk = AT-\ T. "\ \ =BT~G-((l-x)-P + x)\ \g-((1-x) + x/P\ (5.5)
or with respect to the creep rate y0 of the other layers holds
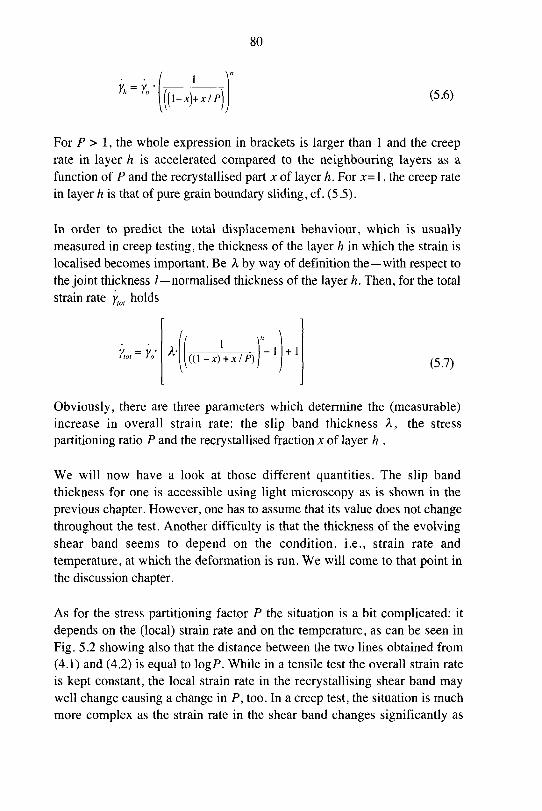
80
Yk-Yol\\-x)+x/P (5.6)
For P > 1, the whole expression in brackets is larger than 1 and the creep
rate in layer h is accelerated compared to the neighbouring layers as a
function of P and the recrystallised part x of layer h. For x= 1, the creep rate
in layer h is that of pure grain boundary sliding, cf. (5.5).
In order to predict the total displacement behaviour, which is usuallymeasured in creep testing, the thickness of the layer h in which the strain is
localised becomes important. Be X by way of definition the—with respect to
the joint thickness /—normalised thickness of the layer h. Then, for the total
strain rate y holds
Yioi Yo ((l-x) + x/P)+ 1
(5.7)
Obviously, there are three parameters which determine the (measurable)
increase in overall strain rate: the slip band thickness A, the stress
partitioning ratio P and the recrystallised fraction x of layer h.
We will now have a look at those different quantities. The slip band
thickness for one is accessible using light microscopy as is shown in the
previous chapter. However, one has to assume that its value does not change
throughout the test. Another difficulty is that the thickness of the evolvingshear band seems to depend on the condition, i.e., strain rate and
temperature, at which the deformation is run. We will come to that point in
the discussion chapter.
As for the stress partitioning factor P the situation is a bit complicated: it
depends on the (local) strain rate and on the temperature, as can be seen in
Fig. 5.2 showing also that the distance between the two lines obtained from
(4.1) and (4.2) is equal to log P. While in a tensile test the overall strain rate
is kept constant, the local strain rate in the recrystallising shear band may
well change causing a change in P, too. In a creep test, the situation is much
more complex as the strain rate in the shear band changes significantly as
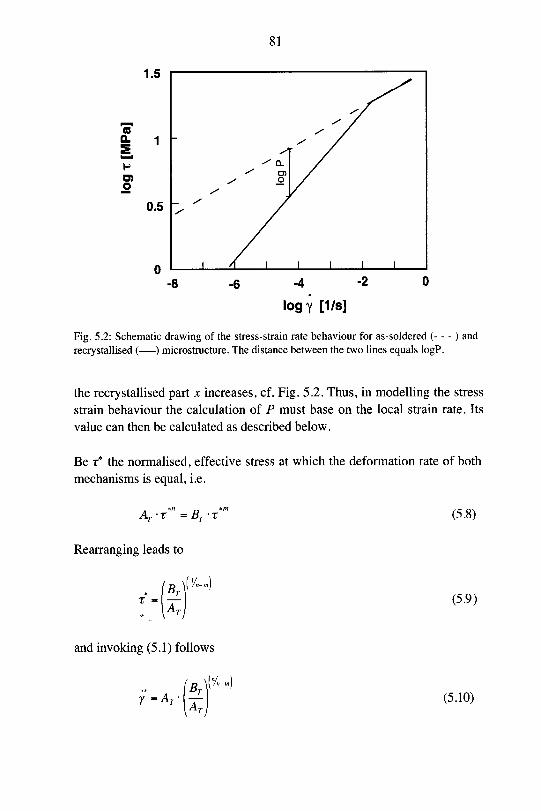
81
Q.
O)o
1.0
S/
/ /^ /
1 / /
/ a.
/ O)
s o
/
0.5
n
-/
I /
-8 -6 -4 -2 0
logy [1/s]
Fig 5 2 Schematic drawing of the stress-strain rate behaviour for as-soldered (- ) and
recrystallised ( ) microstructure The distance between the two lines equals logP
the recrystallised part x increases, cf Fig 5 2 Thus, in modelling the stress
strain behaviour the calculation of P must base on the local strain rate Its
value can then be calculated as described below
Be t* the normalised, effective stress at which the deformation rate of both
mechanisms is equal, l e
A _D
Rearranging leads to
(5 8)
* I **T'/..)
(5 9)
and invoking (5 1) follows
y'-At'\tt (5 10)
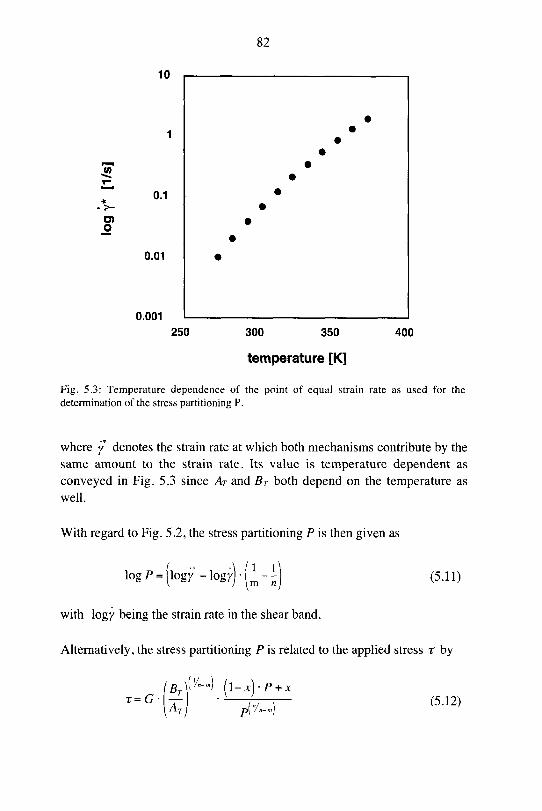
82
jo
O)o
10
0.1
0.01
0.001
250 300 350
temperature [K]
400
Fig 5 3 Temperature dependence of the point of equal strain rate as used for the
determination of the stress partitioning P
where y denotes the strain rate at which both mechanisms contribute by the
same amount to the strain rate Its value is temperature dependent as
conveyed in Fig 5 3 since At and BT both depend on the temperature as
well
With regard to Fig 5 2, the stress partitioning P is then given as
1 1^log P= logy -logy (5 11)
with logy being the strain rate in the shear band
Alternatively, the stress partitioning P is related to the applied stress x by
(BTiV" ") (I-*) P + x
x=Gli. (5 12)
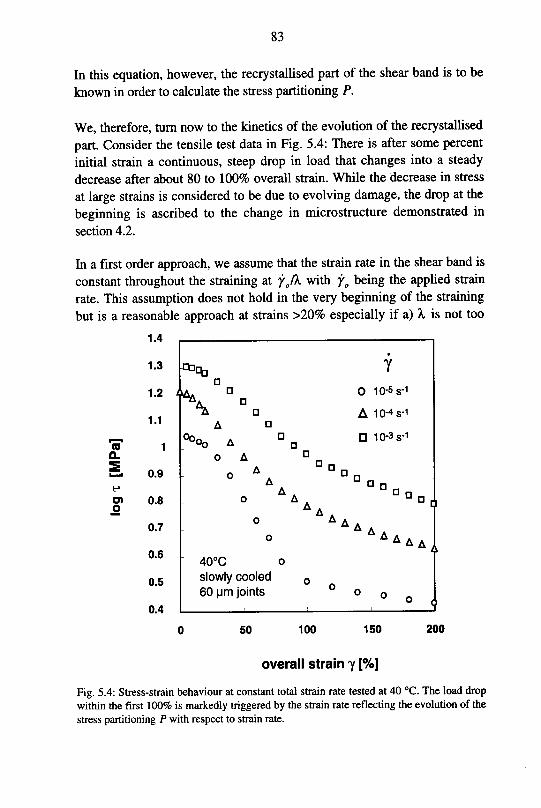
83
In this equation, however, the recrystallised part of the shear band is to be
known in order to calculate the stress partitioning P.
We, therefore, turn now to the kinetics of the evolution of the recrystallised
part. Consider the tensile test data in Fig. 5.4: There is after some percent
initial strain a continuous, steep drop in load that changes into a steady
decrease after about 80 to 100% overall strain. While the decrease in stress
at large strains is considered to be due to evolving damage, the drop at the
beginning is ascribed to the change in microstructure demonstrated in
section 4.2.
In a first order approach, we assume that the strain rate in the shear band is
constant throughout the straining at yofk with yo being the applied strain
rate. This assumption does not hold in the very beginning of the straining
but is a reasonable approach at strains >20% especially if a) A. is not too
1.4
(0O.
O)o
1.3
1.2
1.1
1
0.9
0.8
0.7
0.6
0.5
0.4
£fai
K
%
\ °u
Oo,
Oq A
o A
y
O 10-5 s-1
A 10-4 s-1
10-3 s-1
A
o AA
AAAa
40°C o
slowly cooled0
60 pm joints
50 100 150 200
overall strain y [%]
Fig. 5.4: Stress-strain behaviour at constant total strain rate tested at 40 °C. The load drop
within the first 100% is markedly triggered by the strain rate reflecting the evolution of the
stress partitioning P with respect to strain rate.
84
small and b) the stress partitioning is large, i.e. P>2. We further assume that
die linear decrease in stress at high strains can be extrapolated to low strains
denoting die stress present in the recrystallised part of the shear band.
The stress needed to produce the intended strain rate is then related to the
recrystallised part x by
— = (P + x-(l-P)) (5.13)*rec
using the above introduced notation. Taking the logarithmic form of the
above equation gives
log T - log xrec = log(P + x • (1 - P)) (5.14)
Using the previously mentioned extrapolation, the left hand side of the
above equation can be determined from Fig. 5.4. Assuming, that at zero
strain the structure is completely in the as soldered state (x=0) enables to
determine logP and further on x as function of the overall strain.
Talking about 'kinetics' usually means to give an evolution of a state in
function of time. The most common form of phase transformation or
recrystallisation kinetics is that widely known as the Johnson-Mehl-Avrami
equation given by
= 1 - exp4K
.3 4r-r
3(5.15)
where r denotes the growth rate of the transformed phase and t stands for
the time. The critical parameter in this equation is the phase size change rate
f. It is usually proportional to the Debye-frequency v and the energy gained
by the phase transformation, i.e.
r°= v • Ag if Ag«RT
In case of recrystallisation, the energy gain Ag is, generally speaking,
proportional to the dislocation density, the density of inner surfaces, i.e.,
interphase boundaries, and the oversaturation due to fast cooling. However,
85
the last two terms seem to be negligible since simple ageing does not lead to
any appreciable recrystallisation. It, hence, remains die dislocation density
p, which is under conditions of fast recovery proportional to the square of
the applied stress [Arg70]4. As function of strain rate, Ag may be given as
Ag oe p oc T2 =•: f" (5.16)
On the other hand, the time and total strain are connected as follows
y /. _ / tot/.n
Thus, the Johnson-Mehl-Avrami equation becomes
x = 1 - exp -r-f'"f<;^)4 (5.17)
One, therefore, should expect a strong dependency of the total strain to
recrystallise on the deformation rate. This, however, is not observed as
indicates Fig. 5.4. There is rather a direct dependence of the recrystalli¬sation on the total strain observed.
Let us assume that the dependence of the recrystallisation on the total strain
is of the form
x = l-exp(-P.yj) (5.18)
The evaluation of the parameters is performed using a Weibull-plot as
shown in Fig. 5.5. On the x-axis is then log(rto;) while on die y-axis there is
log(-log(l-x)). Strikingly enough, all of the three data sets fall on about the
same line exhibiting a slope of =2, i.e., the value of parameter a. For j8 onefinds values of 2...5.
4 For very low stresses, however, the dislocation density p is independent from the stress.
On the other hand, Ishida and McLean [Ish67] reported on a dependence to the third power
at high stresses for steel.

o>o
"35o
86
overall strain rate
o lO'V
n 10_4s_1
A 10"Js-
40°C
slowly cooled
-2-10 1
'og(Ytot) H
Fig. 5.5: Evaluation of the recrystallisation-guiding parameters by means of a Weibull-
plot. Variation of the strain rate within two orders of magnitude had virtually no impacton the evaluation of the parameter a. For the parameter p, however, a variation accordingto the thickness of the shear band is found.
In other words, the recrystallisation rate per unit strain is proportional to the
not yet recrystallised remainder of the shear band as well as the total strain
encountered, i.e.
dx P . .
*F=2(1-X)'r-(5.19).
We now come back once again to the normalised shear band thickness X.
We might well assume that the quantity relevant for the recrystallisation is
the local strain rather than the overall strain as used above. This, however,
implies that the parameter B in (5.19) is very likely to change as the shear
band thickness varies. This variation is accounted for by the 'X-independent'form given as
x = l-exp(-9t-y,oc2)(5.20)
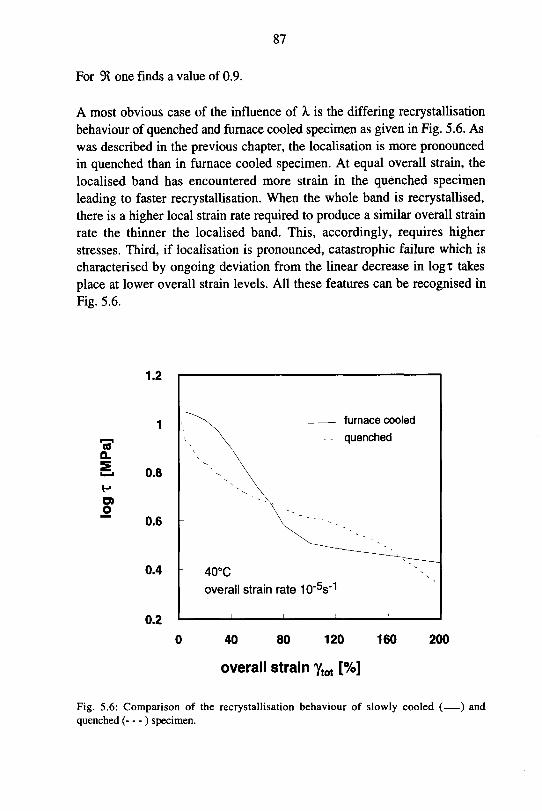
87
For 9t one finds a value of 0.9.
A most obvious case of the influence of X is the differing recrystallisationbehaviour of quenched and furnace cooled specimen as given in Fig. 5.6. As
was described in the previous chapter, the localisation is more pronounced
in quenched than in furnace cooled specimen. At equal overall strain, the
localised band has encountered more strain in the quenched specimen
leading to faster recrystallisation. When the whole band is recrystallised,
there is a higher local strain rate required to produce a similar overall strain
rate the thinner the localised band. This, accordingly, requires higher
stresses. Third, if localisation is pronounced, catastrophic failure which is
characterised by ongoing deviation from the linear decrease in logT takes
place at lower overall strain levels. All these features can be recognised in
Fig. 5.6.
1.2
(0
0.
!• 0.8
H
O)O~
0.6
0.4
0.2
furnace cooled
quenched
40°C
overall strain rate 10'5s"1
0 40 80 120 160 200
overall strain ytot [%]
Fig. 5.6: Comparison of the recrystallisation behaviour of slowly cooled (—) and
quenched (— ) specimen.
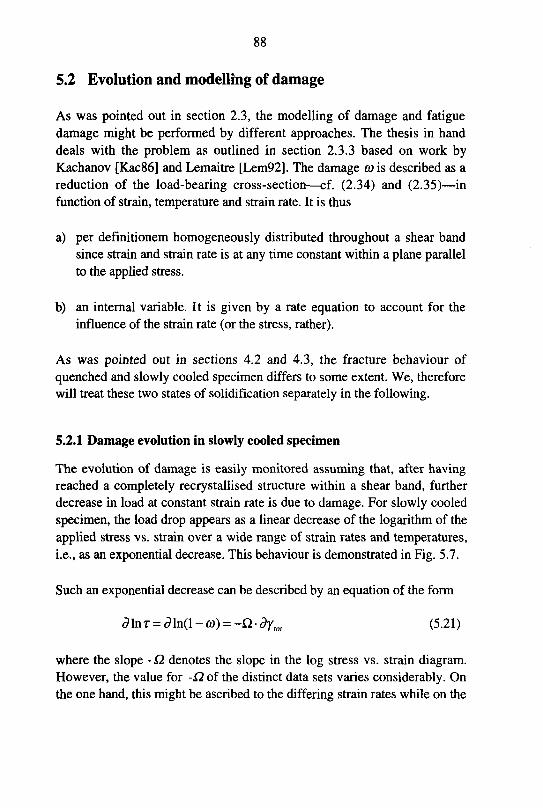
88
5.2 Evolution and modelling of damage
As was pointed out in section 2.3, the modelling of damage and fatigue
damage might be performed by different approaches. The thesis in hand
deals with the problem as outlined in section 2.3.3 based on work byKachanov [Kac86] and Lemaitre [Lem92]. The damage co is described as a
reduction of the load-bearing cross-section—cf. (2.34) and (2.35)—in
function of strain, temperature and strain rate. It is thus
a) per definitionem homogeneously distributed throughout a shear band
since strain and strain rate is at any time constant within a plane parallelto the applied stress.
b) an internal variable. It is given by a rate equation to account for the
influence of the strain rate (or the stress, rather).
As was pointed out in sections 4.2 and 4.3, the fracture behaviour of
quenched and slowly cooled specimen differs to some extent. We, therefore
will treat these two states of solidification separately in the following.
5.2.1 Damage evolution in slowly cooled specimen
The evolution of damage is easily monitored assuming that, after havingreached a completely recrystallised structure within a shear band, further
decrease in load at constant strain rate is due to damage. For slowly cooled
specimen, the load drop appears as a linear decrease of the logarithm of the
applied stress vs. strain over a wide range of strain rates and temperatures,
i.e., as an exponential decrease. This behaviour is demonstrated in Fig. 5.7.
Such an exponential decrease can be described by an equation of the form
d\nx = dln(l-co) = -Qdy,0, (5.21)
where the slope -£2 denotes the slope in the log stress vs. strain diagram.
However, the value for -12 of the distinct data sets varies considerably. On
the one hand, this might be ascribed to the differing strain rates while on the
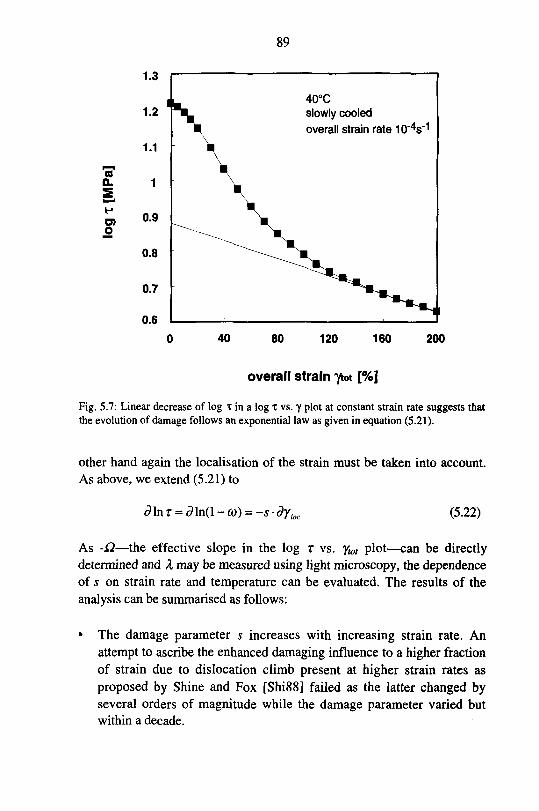
89
nQ.
5
o>o
40°C
slowly cooled
overall strain rate IcV1
40 80 120 160 200
overall strain ytot [%]
Fig. 5.7: Linear decrease of log t in a log T vs. y plot at constant strain rate suggests that
the evolution of damage follows an exponential law as given in equation (5.21).
other hand again the localisation of the strain must be taken into account.
As above, we extend (5.21) to
dlnT = (?ln(l - co) = -s dyk (5.22)
As -Q—the effective slope in the log t vs. ylot plot—can be directlydetermined and X may be measured using light microscopy, the dependenceof s on strain rate and temperature can be evaluated. The results of the
analysis can be summarised as follows:
The damage parameter s increases with increasing strain rate. An
attempt to ascribe the enhanced damaging influence to a higher fraction
of strain due to dislocation climb present at higher strain rates as
proposed by Shine and Fox [Shi88] failed as the latter changed byseveral orders of magnitude while the damage parameter varied but
within a decade.
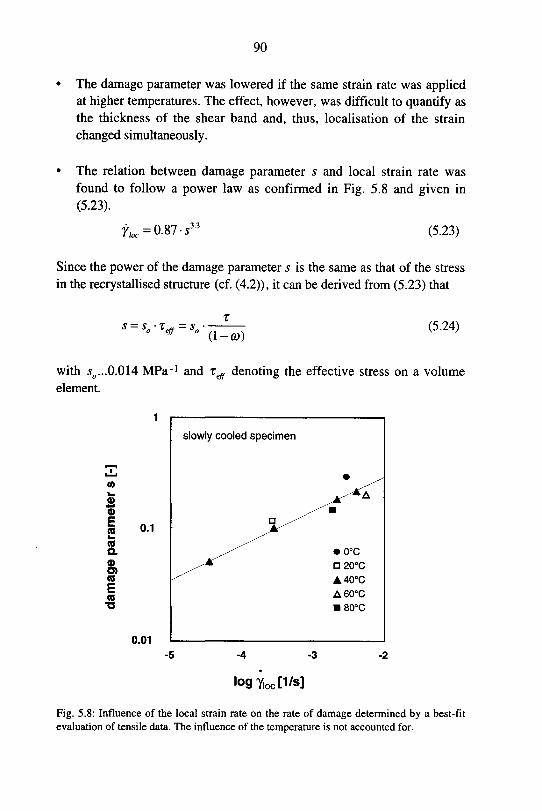
90
• The damage parameter was lowered if the same strain rate was appliedat higher temperatures. The effect, however, was difficult to quantify as
the thickness of the shear band and, thus, localisation of the strain
changed simultaneously.
• The relation between damage parameter s and local strain rate was
found to follow a power law as confirmed in Fig. 5.8 and given in
(5.23).
7foc=0.87-533 (5.23)
Since the power of the damage parameter s is the same as that of the stress
in the recrystallised structure (cf. (4.2)), it can be derived from (5.23) that
* =W =v(l-©)
(5.24)
with sa...0.014 MPa-1 and xeff denoting the effective stress on a volume
element.
1
(0
a>
a>
Eco^
ao.
o>O)CO
Eao
0.1
0.01
slowly cooled specimen
• o°c
20°C
A40°C
A60°C
80°C
-4 -3
logYbcfi/s]
Fig. 5.8: Influence of the local strain rate on the rate of damage determined by a best-fit
evaluation of tensile data. The influence of the temperature is not accounted for.

91
The rate of damage per strain is therefore proportional to the effective shear
stress xeff. This relationship can be seen from Fig. 5.9. The values for s have
been determined by a best-fit evaluation of tensile test data.
Equation (5.24) in combination with (5.22) allows for two alternative ways
to describe the evolution of damage, cf. equations (5.25) and (5.26):
YttK
ln(l-a» = -V \-ceff{yltK)dyl0 (5.25)
<» = V JW*) *t* as «9ln(l - co) = ^-^- (5.26)
While both descriptions represent the same material characteristic, theyreveal differences in distinct testing procedures. In (5.25), the integral maybe removed if the effective stress xeff is constant throughout the test, i.e., in
a tensile test. There, an exponential evolution of the damage vs. strain is
expected. On the other hand, (5.26) applies if the load is held constant as in
co
£CD
ECO
COa.
o>O)CO
Eto
0.1
0.01
slowly cooled specimen
• /
o°c
A20°C
A40°C
O60°C
• 80°C
1 10 100
effective stress xeff [MPa]
Fig. 5.9: Linear dependence of the damage parameter s on the effective stress.
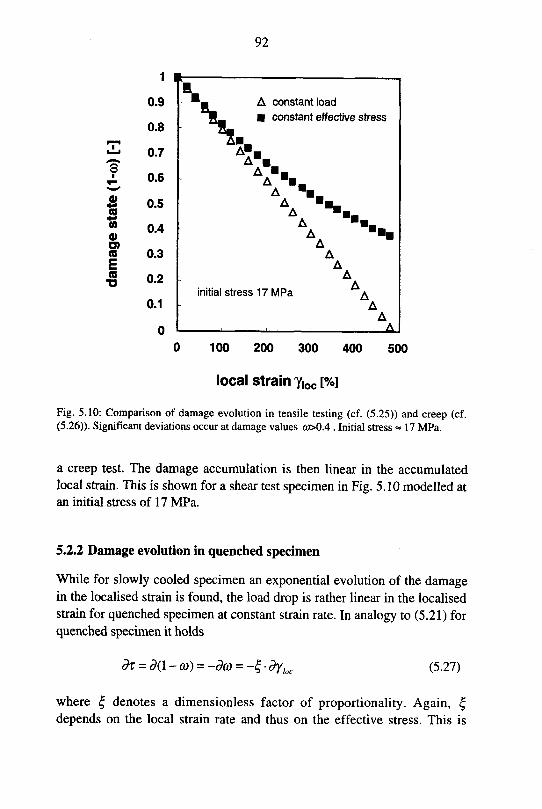
92
co
CO
0O)a
Eco
1
0.9
0.8
0.7
0.6
0.5
0.4
0.3
0.2
0.1
0
l— A constant load
g constant effective stress
A"_
AA
AA
initial stress 17 MPa
A
0 100 200 300 400 500
local strain Y|0C [%]
Fig. 5.10: Comparison of damage evolution in tensile testing (cf. (5.25)) and creep (cf.(5.26)). Significant deviations occur at damage values co>0.4
.Initial stress = 17 MPa.
a creep test. The damage accumulation is then linear in the accumulated
local strain. This is shown for a shear test specimen in Fig. 5.10 modelled at
an initial stress of 17 MPa.
5.2.2 Damage evolution in quenched specimen
While for slowly cooled specimen an exponential evolution of the damagein the localised strain is found, the load drop is rather linear in the localised
strain for quenched specimen at constant strain rate. In analogy to (5.21) for
quenched specimen it holds
dx = d{\ - co) = -dco = -£ dyiloc (5.27)
where £ denotes a dimensionless factor of proportionality. Again, £depends on the local strain rate and thus on the effective stress. This is
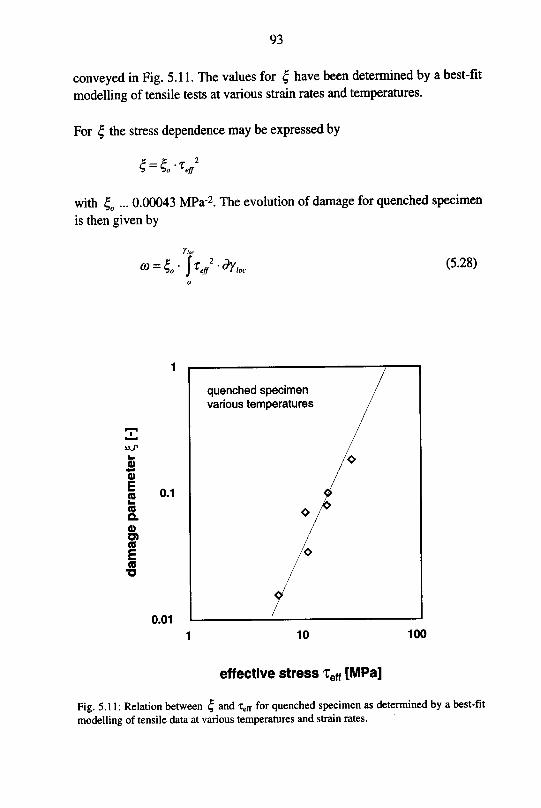
93
conveyed in Fig. 5.11. The values for £ have been determined by a best-fit
modelling of tensile tests at various strain rates and temperatures.
For | the stress dependence may be expressed by
with £,0 ...0.00043 MPa"2. The evolution ofdamage for quenched specimen
is then given by
co !&-JV-^ (5.28)
k.
&0)
E2COo.
0)O)CO
ECO
0.1
0.01
quenched specimenvarious temperatures
10 100
effective stress xeff [MPa]
Fig. 5.11: Relation between £ and xeff for quenched specimen as determined by a best-fit
modelling of tensile data at various temperatures and strain rates.
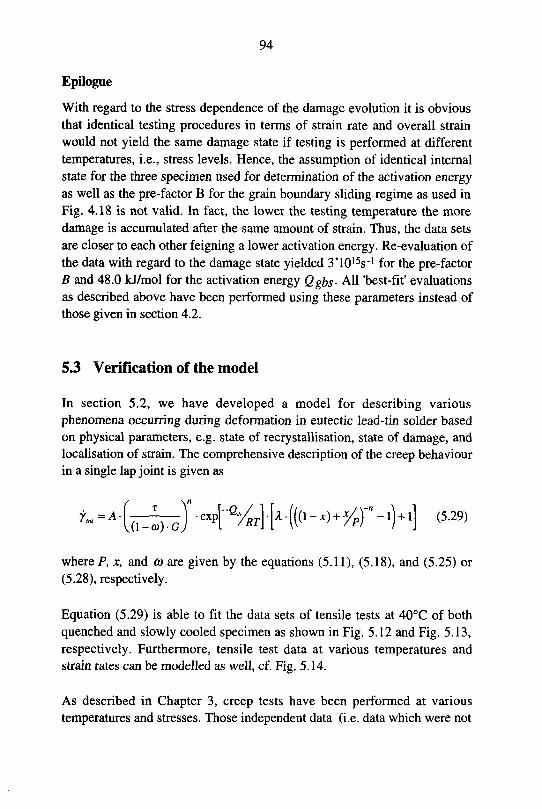
94
Epilogue
With regard to die stress dependence of the damage evolution it is obvious
that identical testing procedures in terms of strain rate and overall strain
would not yield the same damage state if testing is performed at different
temperatures, i.e., stress levels. Hence, the assumption of identical internal
state for the three specimen used for determination of the activation energy
as well as the pre-factor B for the grain boundary sliding regime as used in
Fig. 4.18 is not valid. In fact, the lower the testing temperature the more
damage is accumulated after the same amount of strain. Thus, the data sets
are closer to each other feigning a lower activation energy. Re-evaluation of
the data with regard to the damage state yielded 3'10'V1 for the pre-factorB and 48.0 kJ/mol for the activation energy Qgbs- All 'best-fit' evaluations
as described above have been performed using these parameters instead of
those given in section 4.2.
5.3 Verification of the model
In section 5.2, we have developed a model for describing various
phenomena occurring during deformation in eutectic lead-tin solder based
on physical parameters, e.g. state of recrystallisation, state of damage, and
localisation of strain. The comprehensive description of the creep behaviour
in a single lap joint is given as
7lo,=A-(\-co)G
•exp-a*
'BI A-(((l-x) + ^)"B-l) + l (5.29)
where P, x, and co are given by the equations (5.11), (5.18), and (5.25) or
(5.28), respectively.
Equation (5.29) is able to fit the data sets of tensile tests at 40°C of both
quenched and slowly cooled specimen as shown in Fig. 5.12 and Fig. 5.13,
respectively. Furthermore, tensile test data at various temperatures and
strain rates can be modelled as well, cf. Fig. 5.14.
As described in Chapter 3, creep tests have been performed at various
temperatures and stresses. Those independent data (i.e. data which were not
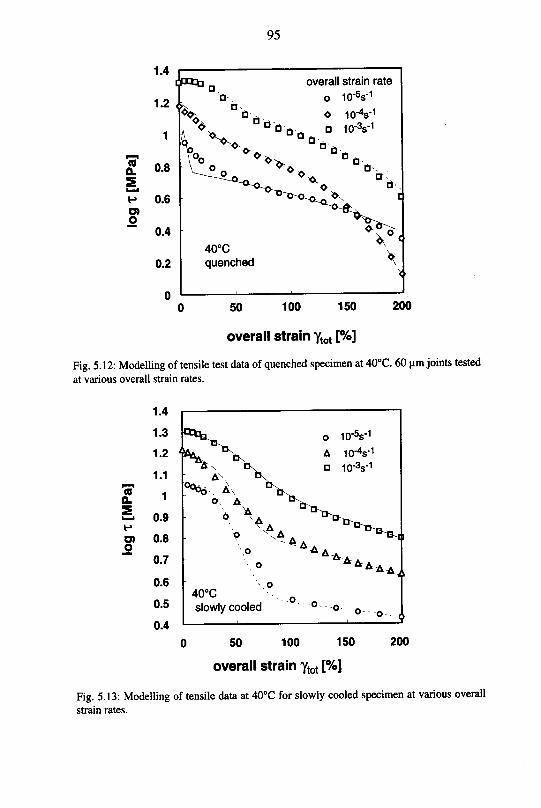
95
coQ.
O)O
overall strain rate
o 10"5s-1
10-V1
n 10-V1
50 100 150
overall strain ytot [%]
200
Fig. 5.12: Modelling of tensile test data of quenched specimen at 40°C. 60 p.m joints tested
at various overall strain rates.
COQ.
E
o>
1.4
1.3
1.2
1.1
1
0.9
0.8
0.7
0.6
0.5
0.4
o 10"5s-1
KX A 10-V
10-V1
°°0b A\ *^O A
o %o
o
4
40°C
slowly cooled 0C
° ° i50 100 150
overall strain ytot [%]
200
Fig. 5.13: Modelling of tensile data at 40°C for slowly cooled specimen at various overall
strain rates.
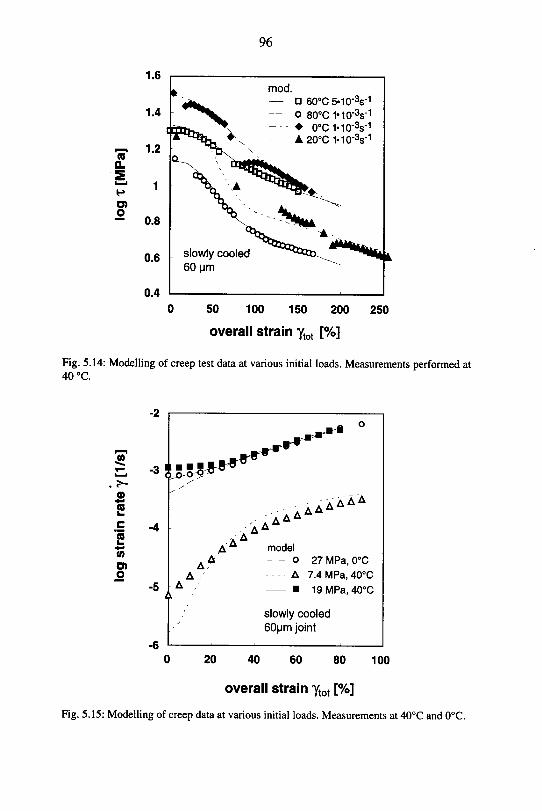
96
0 50 100 150 200 250
overall strain ytot [%]
Fig. 5.14: Modelling of creep test data at vanous initial loads Measurements performed at
40 °C
-2
JOC "3
. ?*-
CO1_
.E -4CO-
CO
eno
-6
0 20 40 60 80 100
overall strain ytot [%]
Fig. 5.15: Modelling of creep data at vanous initial loads Measurements at 40°C and 0°C
^^0
vr***^
A^AA
model
AA o 27 MPa, 0°C
A A 7 4MPa,40°CA
A19 MPa, 40°C
slowly cooled
60pm joint
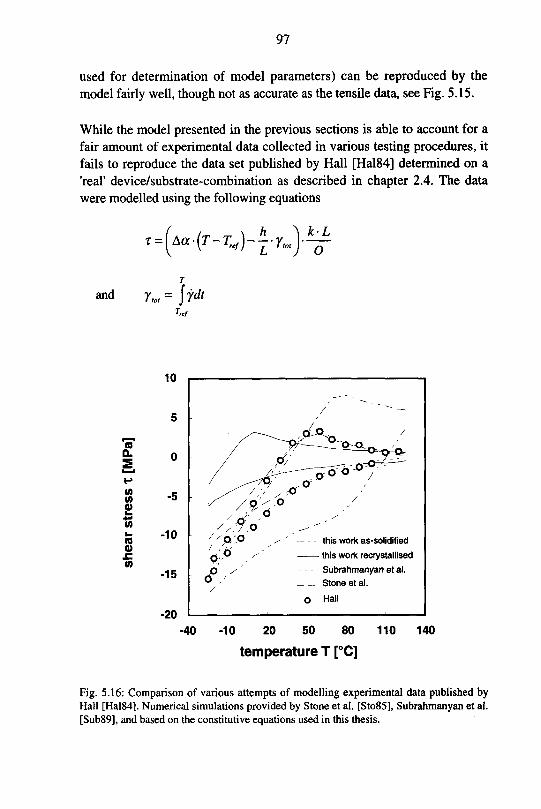
97
used for determination of model parameters) can be reproduced by the
model fairly well, tiiough not as accurate as the tensile data, see Fig. 5.15.
While the model presented in the previous sections is able to account for a
fair amount of experimental data collected in various testing procedures, it
fails to reproduce the data set published by Hall [Hal84] determined on a
'real' device/substrate-combination as described in chapter 2.4. The data
were modelled using the following equations
-(Mr-M-fr.)^
and y« = jfdt
10
coQ.
totoCD
to
%-
COCD£to
-10
-15
-20
_--
/^—
/ ft/ __^nsi^^
X/0,/O
— this work as-solidified
this work recrystallised
/
Subrahmanyan et al.
Stone et al.
O Hall
-40 -10 20 50 80 110 140
temperature T [°C]
Fig. 5.16: Comparison of various attempts of modelling experimental data published byHall [Hal84]. Numerical simulations provided by Stone et al. [Sto85], Subrahmanyan et al.
[Sub89], and based on the constitutive equations used in this thesis.

98
where O...soldered area, Tref...starting temperature of the cycle, 7\..actual
temperature, f...time, h...solder joint height, C...stiffness of the assembly,and L...half the distance between the solder joints. The stiffness of the
solder joint as such is assumed to be much higher than the stiffness if the
device and substrate, respectively. Hence, the change in elastic constants of
the solder is not taken into account as was proposed by [Sto94].
The geometry has been adopted from Hall's original paper while the
apparent device/substrate-stiffness is determined by graphical evaluation of
Hall's results. The comparison of both modelled and measured data is givenin Fig. 5.16. Other attempts to model Hall's data, published by Stone et al.
[Sto85] and Subrahmanyan et al. [Sub89] are also included in Fig. 5.16.
Instead of a power-law description of the stress-strain rate description theyboth used a A,-law-model as presented in section 2.2.3. Their numerical
modelling yielded better results as the description evolved in this work. To
what extent this inferiority in quantitative modelling is owing to the choice
of die constitutive model will be subject of the discussion.
5.4 Generalisation to any given geometry
As the aim of the thesis in hand is to provide a model that is suitable for
FEA application, one has to formulate the model independent from the
geometry on which its parameters have been determined. There will be for
instance neither such thing as a normalised shear band thickness X nor
something as a recrystallised fraction of a shear band in a general solder
joint geometry. However, one can assign to every volume element a value x
denoting the state of recrystallisation and a value co representing the state of
damage. Both of these values can be calculated using the 'X,-independent'forms for both evolution of x and co given in equations (5.20) and (5.25) or
(5.28), respectively. Equation (5.29) is then reduced to
y = A-
\"
(l-fij)G•exp %1-ft1-*) + #>)"" (530)
Localisation, as it is frequently observed in field solder joints, will evolve
due to deformation gradients and, thus, recrystallisation gradients owing to
the solder joint's geometry and the shape of the loading cycle.
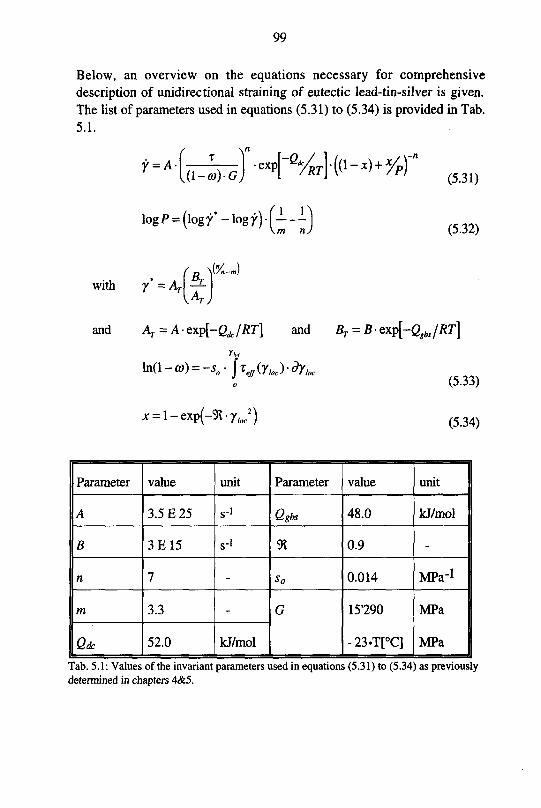
99
Below, an overview on the equations necessary for comprehensive
description of unidirectional straining of eutectic lead-tin-silver is given.The list of parameters used in equations (5.31) to (5.34) is provided in Tab.
5.1.
with
and
y-A-
<x
N"
(l-a)G•exp -VrtW-x) + X/p)~
logP = (log/*-logy)l 1
(5.31)
(5.32)
7 =AA;
AT = Aexp\-QJRT\ and BT = B exp[-Qgbs/RT]rioc
ln(l-fi>) = -v jr^{yloc)-dyloco
x = l-exp(-X-ylJ)
(5.33)
(5.34)
Parameter value unit Parameter value unit
A 3.5 E 25 S"> Qgbs 48.0 kJ/mol
B 3E15 s-' 9t 0.9 -
n 7 - So 0.014 MPa"1
m 3.3 - G 15'290
-23-T[°C]
MPa
MPaQdc 52.0 kJ/mol
Tab. 5.1: Values of the invariant parameters used in equations (5.31) to (5.34) as previouslydetermined in chapters 4&5.

Leer - Vide - Empty
101
6
Cyclic straining and fatigue experiments
In the preceding chapters we have concentrated on unidirectional shear
deformation only. As in microelectronic applications there is usually cyclic
straining encountered, we will now assess the evolution of damage and
microstructural changes in cyclic deformation, which are the contents of
section 6.1. In section 6.2, differences and analogies between unidirectional
and cyclic straining in terms of the evolution of the state variables x and co
are investigated. Finally, the incorporation of fatigue damage evolution in a
FEA environment is discussed.
6.1 Cyclic deformation experiments
Mei and Morris [Mei92] have reported on significant differences in fatigueresistance of eutectic lead-tin solder depending on the solidification
condition, i.e., the cooling rate. Hence, cyclic straining was performed on
both quenched and slowly cooled specimen. The conditions of solidification
are given in chapter 3, Fig. 3.3. As has shortly been mentioned in section
2.4, cyclic deformation may be introduced in a specimen either by holdingthe load constant and controlling the strain or by holding the overall strain
rate constant and again controlling die strain. While the constant load testing
procedure raises no difficulties as the elastic deformation of the substrate is
constant throughout the test, the changing elastic deformation of the
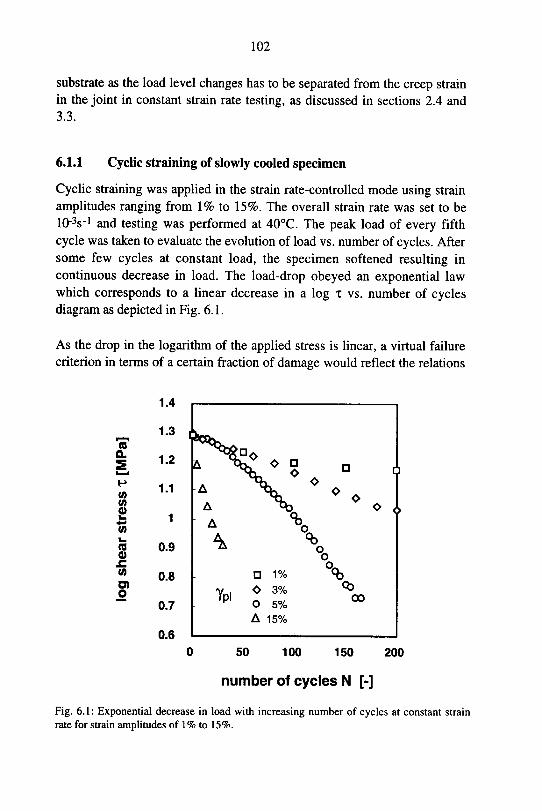
102
substrate as the load level changes has to be separated from the creep strain
in die joint in constant strain rate testing, as discussed in sections 2 4 and
33
6.1.1 Cyclic straining of slowly cooled specimen
Cyclic straining was applied in the strain rate-controlled mode using strain
amplitudes ranging from 1% to 15% The overall strain rate was set to be
10"3s ' and testing was performed at 40°C The peak load of every fifth
cycle was taken to evaluate the evolution of load vs number of cycles After
some few cycles at constant load, the specimen softened resulting in
continuous decrease in load The load-drop obeyed an exponential law
which corresponds to a linear decrease in a log t vs number of cyclesdiagram as depicted in Fig 6 1
As the drop in the logarithm of the applied stress is linear, a virtual failure
criterion in terms of a certain fraction of damage would reflect the relations
1.4
1.3 ,r—i
CO
Q.1.2
A ^ °<>vD
D r<>
^ 1
CO1.1 A V °
oCO0)
A *>n o <
CO
1A \
1_
CB 0.9 \o
0) o.C o,_CO
0.8 1% <fc
log0.7
0.6
Tpio
o
A
3% °J00
5%
15%
0 50 100 150 200
number of cycles N [-]
Fig 6 1 Exponential decrease in load with increasing number of cycles at constant strain
rate for strain amplitudes of 1 % to 15%
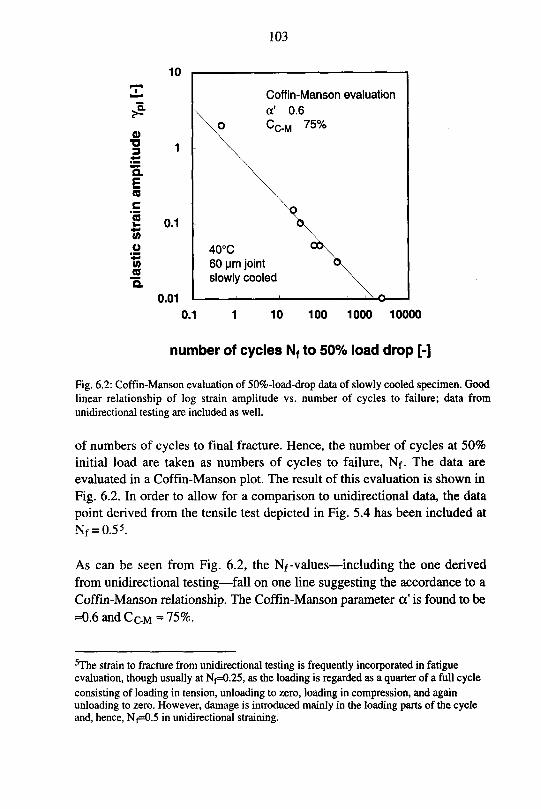
103
10
^
a3
Q.
Eco
c"5
2 0.1
co
o
(0CB
0.01
Coffin-Manson evaluation
a' 0.6
40°C
60 pm joint
slowly cooled
0.1 10 100 1000 10000
number of cycles Nf to 50% load drop [-]
Fig. 6.2: Coffin-Manson evaluation of 50%-load-drop data of slowly cooled specimen. Good
linear relationship of log strain amplitude vs. number of cycles to failure; data from
unidirectional testing are included as well.
of numbers of cycles to final fracture. Hence, the number of cycles at 50%
initial load are taken as numbers of cycles to failure, Nf. The data are
evaluated in a Coffin-Manson plot. The result of this evaluation is shown in
Fig. 6.2. In order to allow for a comparison to unidirectional data, the data
point derived from the tensile test depicted in Fig. 5.4 has been included at
Nf = 0.5*.
As can be seen from Fig. 6.2, the Nf-values—including the one derived
from unidirectional testing—fall on one line suggesting the accordance to a
Coffin-Manson relationship. The Coffin-Manson parameter a' is found to be
=0.6andCc-M = 75%.
5The strain to fracture from unidirectional testing is frequently incorporated in fatigueevaluation, though usually at Nf=0.25, as the loading is regarded as a quarter of a full cycle
consisting of loading in tension, unloading to zero, loading in compression, and againunloading to zero. However, damage is introduced mainly in the loading parts of the cycleand, hence, Nf=0.5 in unidirectional straining.

104
6.1.2 Cyclic straining of quenched specimen
Cyclic straining was performed by load-controlled testing as described in
section 3.3. The testing was done at 40°C using strain amplitudes of 3% and
5%. Two distinct load levels were applied in order to investigate the impactof stress on fatigue damage accumulation.
As encountered in unidirectional testing the strain rate accelerated as testing
proceeded. Again, the increase in strain rate was exponential in the number
of cycles, which is represented by a straight line in a log strain rate vs.
number of cycles diagram as given in Fig. 6.3.
It has been suggested by Shine and Fox [Shi88] that damage would onlyaccumulate due to deformation in the dislocation climb (dc) regime while
deformation controlled by grain boundary sliding (gbs) was assumed to be
virtually non-damaging.
jo
Q)
?C
'3
v>o>o
8.2 MPa 3%
• 11.4 MPa 5%
&*F
rf,DD'^
r.of„0
<P 40°C
quenched60pm joint
50 100 150
number of cycles N [-]
Fig. 6.3: Exponential increase in the strain rate with increasing number of cycles at constant
macroscopic stress.
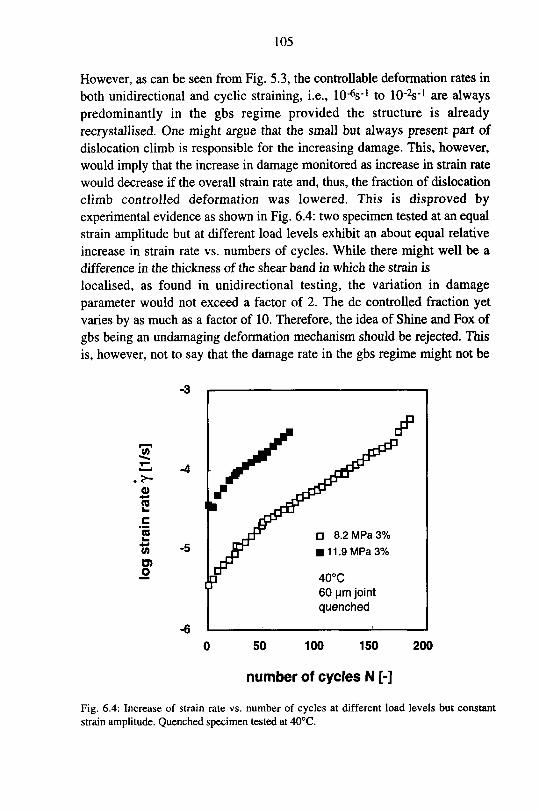
105
However, as can be seen from Fig. 5.3, the controllable deformation rates in
both unidirectional and cyclic straining, i.e., 10-V1 to 10_2s_1 are always
predominantly in the gbs regime provided the structure is already
recrystallised. One might argue that the small but always present part of
dislocation climb is responsible for the increasing damage. This, however,
would imply that the increase in damage monitored as increase in strain rate
would decrease if the overall strain rate and, thus, the fraction of dislocation
climb controlled deformation was lowered. This is disproved by
experimental evidence as shown in Fig. 6.4: two specimen tested at an equal
strain amplitude but at different load levels exhibit an about equal relative
increase in strain rate vs. numbers of cycles. While there might well be a
difference in the thickness of die shear band in which the strain is
localised, as found in unidirectional testing, the variation in damage
parameter would not exceed a factor of 2. The dc controlled fraction yet
varies by as much as a factor of 10. Therefore, the idea of Shine and Fox of
gbs being an undamaging deformation mechanism should be rejected. This
is, however, not to say that the damage rate in the gbs regime might not be
jo
IL -4.>-
CD<*-
CBi_
c
«
CO
O)
-5
D 8.2 MPa 3%
11.9 MPa 3%
40°C
60 pm joint
quenched
50 100 150 200
number of cycles N [-]
Fig. 6.4: Increase of strain rate vs. number of cycles at different load levels but constant
strain amplitude. Quenched specimen tested at 40°C.
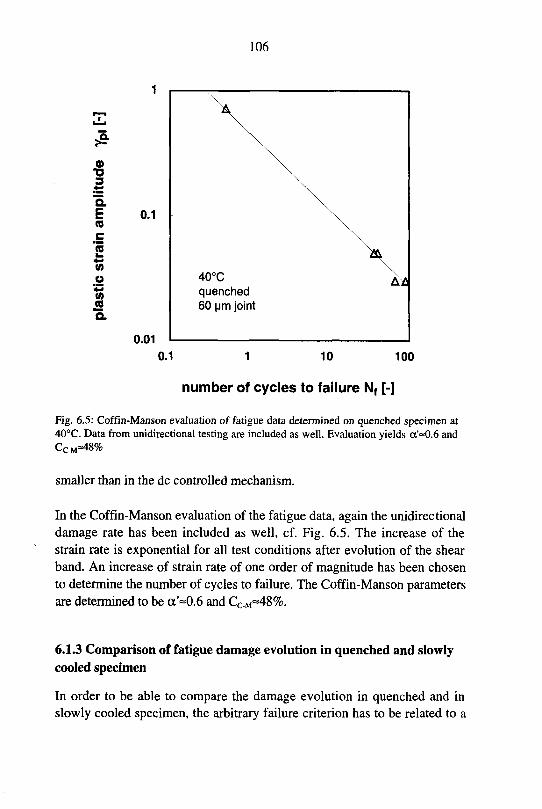
106
1
3
"5.E 0.1CB
C
SCO
,o
COCB
"5.
0.01
0.1 1 10 100
number of cycles to failure Nf [-]
Fig. 6.5: Coffin-Manson evaluation of fatigue data determined on quenched specimen at
40°C. Data from unidirectional testing are included as well. Evaluation yields 0t'=O.6 and
CC-m=48%
smaller than in the dc controlled mechanism.
In the Coffin-Manson evaluation of the fatigue data, again the unidirectional
damage rate has been included as well, cf. Fig. 6.5. The increase of the
strain rate is exponential for all test conditions after evolution of the shear
band. An increase of strain rate of one order of magnitude has been chosen
to determine the number of cycles to failure. The Coffin-Manson parameters
are determined to be ot'=0.6 and CCM=48%.
6.1.3 Comparison of fatigue damage evolution in quenched and slowly
cooled specimen
In order to be able to compare the damage evolution in quenched and in
slowly cooled specimen, the arbitrary failure criterion has to be related to a
quenched60 pm joint
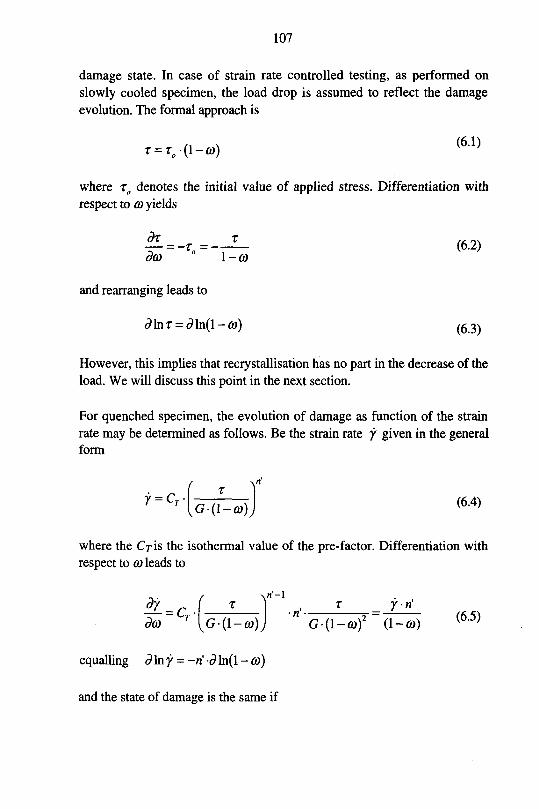
107
damage state. In case of strain rate controlled testing, as performed on
slowly cooled specimen, the load drop is assumed to reflect the damageevolution. The formal approach is
/i x (6.1)T = v(l-a>)
where xo denotes the initial value of applied stress. Differentiation with
respect to co yields
iU_T =__L_ (6.2)
dco°
1-u)
and rearranging leads to
d\nx = dh\(\-co) (6 3)
However, this implies that recrystallisation has no part in the decrease of the
load. We will discuss this point in the next section.
For quenched specimen, the evolution of damage as function of the strain
rate may be determined as follows. Be the strain rate y given in the generalform
y = CT(
x T
G-(l-a>),(6.4)
where the Cjis the isothermal value of the pre-factor. Differentiation with
respect to CO leads to
dy__r I r ) x_
y-ri
dco~CT\G(l-co)j nG(l-co)2'(l~co) (6-5)
equalling d In y = -ri d ln(l - co)
and the state of damage is the same if
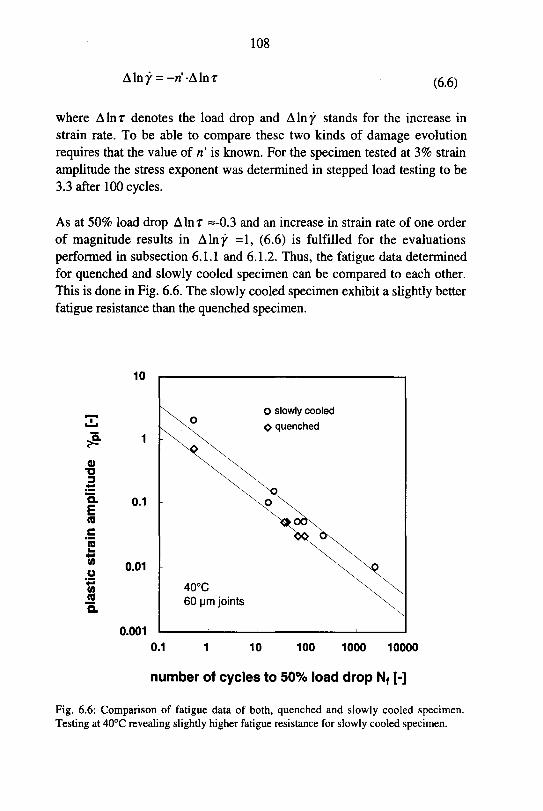
108
Alny = -n'Alnr(6.6)
where Alnr denotes the load drop and A In y stands for the increase in
strain rate. To be able to compare these two kinds of damage evolution
requires that the value of n' is known. For the specimen tested at 3% strain
amplitude the stress exponent was determined in stepped load testing to be
3.3 after 100 cycles.
As at 50% load drop Alnr =-0.3 and an increase in strain rate of one order
of magnitude results in A In y =1, (6.6) is fulfilled for the evaluations
performed in subsection 6.1.1 and 6.1.2. Thus, the fatigue data determined
for quenched and slowly cooled specimen can be compared to each other.
This is done in Fig. 6.6. The slowly cooled specimen exhibit a slightly better
fatigue resistance than the quenched specimen.
10
CD•o
a.
ECB
c
"5
too
COCB
0.1
0.01
0.001
O slowly cooled
0 quenched
40°C
60 pm joints
0.1 1 10 100 1000 10000
number of cycles to 50% load drop Nf [-]
Fig. 6.6: Comparison of fatigue data of both, quenched and slowly cooled specimen.
Testing at 40°C revealing slightly higher fatigue resistance for slowly cooled specimen.
109
6.2 Differences and analogies between unidirectional and
cyclic straining
While in both, unidirectional and cyclic straining, load drop indicative for
accumulation of damage is found at continuous straining or cycling,
respectively, there are some differences in the early stage of straining. In
unidirectional testing, the load drop can be divided in to parts, one at the
beginning of straining related to local recrystallisation and another
persisting over the whole test indicating accumulation of damage. In cyclic
straining, however, there is no sign of such a partition. There is rather one
steady decrease in load observed.
With regard to Fig. 5.4, one might argue that the load drop due to
recrystallisation is usually not very large at strain rates of 10_3s_1, especiallyif strain is highly localised as reported for cyclic straining by Morris and
Mei [Mor91]. Hence, testing at a strain amplitude of 5% was performed at
80°C and a strain rate of 10'V1 as well as at 40°C and a strain rate of 210"
4s_1, where the load drop due to recrystallisation was expected to be more
pronounced. As can be seen from Fig. 6.7, while there is a variation in
initial stress level according to the constitutive behaviour, the load dropbehaviour is virtually not affected by the altered testing parameters. This
suggests that either the damage evolution is unaffected by stress in cyclic
straining—which would contrast the established models of strain energy
approach and stress intensity influenced crack growtii—or the localisation is
the more pronounced the lower the stress so that the lower stress and the
higher local strain level out each other.
A third alternative would be that recrystallisation—for reasons still to be
found—did not occur in cyclic straining. However, quenched specimenexhibited a strain rate sensitivity of 0.3 after 50 cycles at 3% strain
amplitude. This indicates that a shear band has been built, i.e., recrystal¬lisation has taken place within the first 50 cycles.
In cyclic straining, the monitoring of qualitative changes as carried out for
unidirectional deformation is not easily accessible. Both, the high strain rate
sensitivity as well as the evolution of a shear band during cyclicdeformation indicate, that in general the same qualitative changes—i.e.
recrystallisation and localisation—occur as in unidirectional testing, but that

110
1.3
1.2
[MPa]1.1
1
H
stress0.9
0.8
shear 0.7
log 0.6
0.5
O80°C, 1*10'V1
O40°C, 1-10-3s"1
A40°C, ?10-4s'1
0.4
strain amplitude 5%
60 pm jointslowly cooled
50 100 150 200
Number of cycles N [-]
Fig. 6.7: Evolution of peak load at 5% strain amplitude tested at various strain rates and
load levels. The rate of load drop is virtually the same for all testing parameters suggesting
stress-independent damage evolution.
numerical description and production of experimental evidence is much
more difficult to accomplish than in unidirectional straining. Further
research has to be carried out in this direction.
6.3 Fatigue damage evolution modelling in a FEA
environment
As was already outlined in section 2.3, the description of damage evolution
in cyclic straining is usually performed either in terms of Coffin-Manson
evaluation or using crack propagation kinetics as given in e.g. the Paris-law.
While the former describes accurately most of the field data, the latter is
more appropriate for FEA. The difficulty in using the Coffin-Manson
approach in FEA is that there is no single strain amplitude in a generalsolder joint geometry (see also Section 2.3). In contrast, using crack
Ill
propagation kinetics, the situation is defined at any point on the time axis.
However, crack propagation models usually incorporate physical concepts
which are appropriate neither for tin-lead eutectic nor for cyclic
deformation. In the following a set of equations is presented that enables to
implement a local damage evolution in FEA based on the Coffin-Manson
description, cf. equation (2.19).
Similarly as the description in unidirectional deformation—and supported
by the experimental evidence confirmed in Figs. 6.1 to 6.7—we postulatethat the damage increase Aco during one thermocycle is proportional to the
present damage (1-co) and to a function q of the strain amplitude Aypiresulting in
Aco = {l-co)q(Aypl) (6?)
For q\AypA one finds
q(Aypl) = q0-Aypla (6.8)
The Coffin-Manson parameter a' as well as go have been determined to be
0.6 and 0.49, respectively, from Fig. 6.2. The damage rate parameter qo is
calculated for Aypi given in [p:m/|j.m]. As the plastic deformation is in
general not symmetric for a specific volume element and, thus, the meaningof Aypi is not clear, the plastic strain amplitude may be replaced by the half
of the equivalent strain encountered in one thermocycle.
Using the mathematical framework outlined above enables to calculate
iteratively the damage state of any individual volume element. As the
damage function approaches final failure asymptotically, an upper limit of
damage has to be set in order to define final fracture of a volume element.

Leer - Vide - Empty

113
7
Discussion and conclusions
7.1 Relation to previous work
The results presented in the previous chapters contain some points that
contrast with what is said about eutectic lead-tin solder or metallic materials
in general in the literature. We will hence have a closer look at tiiese pointsin order to provide further evidence or bring the apparent inconsistency in
line to previous research.
7.1.1 The constitutive equation
The bilinear appearance of stress vs. strain rate data for eutectic lead-tin
solder is widely accepted in the literature, although there are various
mathematical descriptions to account for it as shown in section 2.2. The
main difference in this work is that the range of strain rates where the strain
rate sensitivity is high is shifted to considerably higher strain rates (by a
factor of up to 104) compared to the values reported in the literature (cf.
[Sto94], [Dar92], [Wil90], [Lee93]). On the other hand, it is in good
qualitative agreement to the literature about the superplastic behaviour of
lead-tin eutectics, cf. [Cli67], [Kay81]. The strain rate sensitivity of 0.3 as
found in this study, however, is in good agreement with data determined on
model solder joints ([S0I86], [Dar92], [Wil90], [Mor91]), while the
'superplastic' literature usually favours an SRS of 0.5.
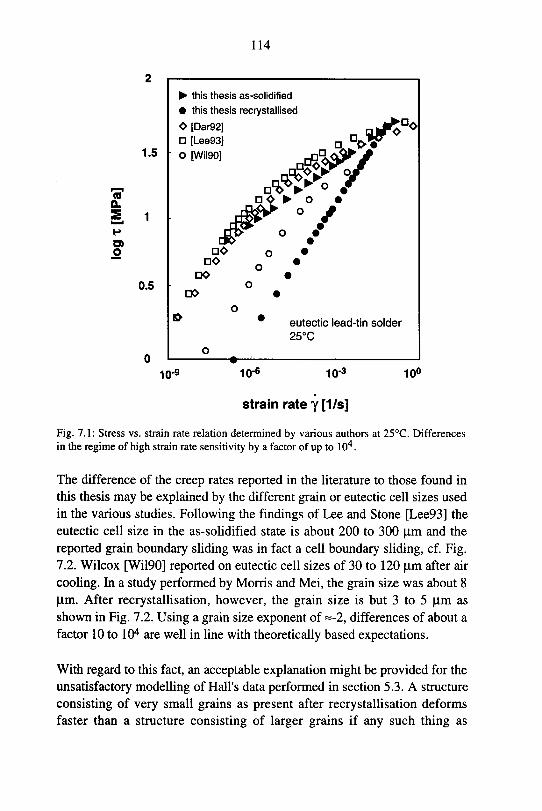
114
1.5
CBQ.
D>O
0.5
this thesis as-solidified
• this thesis recrystallised
O [Dar92] QjJoD°D[Lee93] a ^VvO [WII90] nd^V
DO O •
DO o •
DOQ
•
DO •
O
DO •
o
^ *eutectic lead-tin solder
25°C
o
10-9 10-6 10"3
strain rate y [Ms]
10°
Fig. 7.1: Stress vs. strain rate relation determined by various authors at 25°C. Differences
in the regime of high strain rate sensitivity by a factor of up to 104.
The difference of the creep rates reported in the literature to those found in
this thesis may be explained by the different grain or eutectic cell sizes used
in the various studies. Following the findings of Lee and Stone [Lee93] the
eutectic cell size in the as-solidified state is about 200 to 300 um and the
reported grain boundary sliding was in fact a cell boundary sliding, cf. Fig.7.2. Wilcox [Wil90] reported on eutectic cell sizes of 30 to 120 |0.m after air
cooling. In a study performed by Morris and Mei, the grain size was about 8
(Xm. After recrystallisation, however, the grain size is but 3 to 5 |im as
shown in Fig. 7.2. Using a grain size exponent of ~-2, differences of about a
factor 10 to 104 are well in line with theoretically based expectations.
With regard to this fact, an acceptable explanation might be provided for the
unsatisfactory modelling of Hall's data performed in section 5.3. A structure
consisting of very small grains as present after recrystallisation deforms
faster than a structure consisting of larger grains if any such thing as
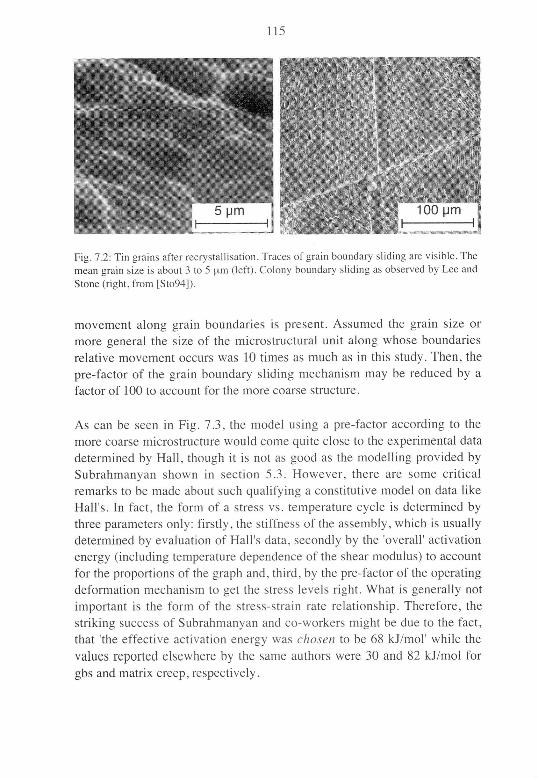
115
Fig 7 2 Tin grains after recrystallisation Traces ol grain boundary sliding are visible The
mean grain size is about 3 to 5 um (left) Colony boundary sliding as observed by Lee and
Stone (right from [Sto94])
movement along grain boundaries is present Assumed the grain size or
more general the size of the microstructural unit along whose boundaries
relative movement occurs was 10 times as much as in this study Then, the
pre factor of the gram boundary sliding mechanism may be reduced by a
factor of 100 to account for the more coarse structure
As can be seen in Fig 7 3, the model using a pre factor according to the
more coarse microstructure would come quite close to the experimental data
determined by Hall though it is not as good as the modelling provided by
Subrahmanyan shown in section 5 3 However there are some critical
remarks to be made about such qualifying a constitutive model on data like
Hall s In fact the form of a stress vs temperature cycle is determined bythree parameters only firstly the stiffness of the assembly which is usually
determined by evaluation of Hall s data, secondly by the overall activation
energy (including temperature dependence of the shear modulus) to account
for the proportions of the graph and, third, by the pre factor of the operating
deformation mechanism to get the stress levels right What is generally not
important is the form of the stress strain rate relationship Therefore, the
striking success of Subrahmanyan and co workers might be due to the fact,
that the effective activation energy was chosen to be 68 kJ/mol while the
values reported elsewhere by the same authors were 30 and 82 kJ/mol for
gbs and matrix creep respectively
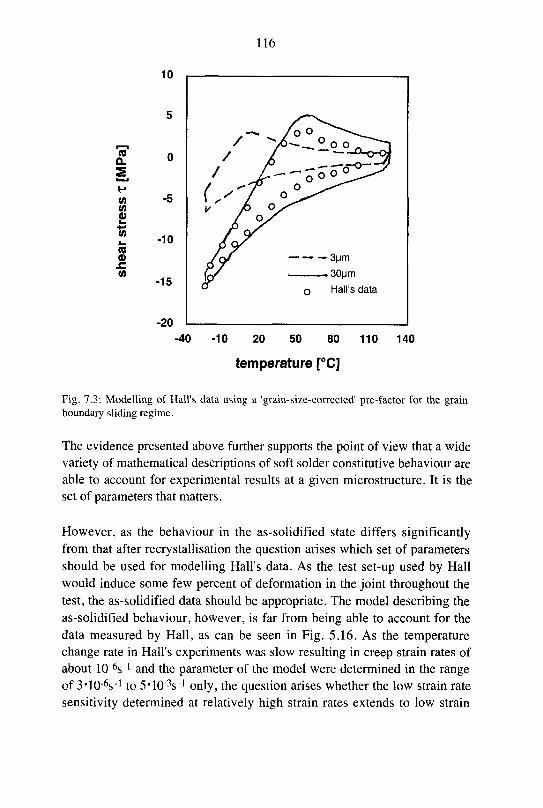
116
10
COOL
COCOCD^+>*
CO
i-
CO<DJZCO
-10
-15
-20
. 30pm
o Hall s data
-40 -10 20 50 80 110 140
temperature [°C]
Fig 7 3 Modelling of Hall s data using a gram-size corrected pre factor for the gram
boundary sliding regime
The evidence presented above further supports the point of view that a wide
variety of mathematical descriptions of soft solder constitutive behaviour are
able to account for experimental results at a given microstructure It is the
set of parameters that matters
However, as the behaviour in the as-solidified state differs significantlyfrom that after recrystallisation the question arises which set of parameters
should be used for modelling Hall's data As the test set-up used by Hall
would induce some few percent of deformation in the joint throughout the
test, the as-solidified data should be appropriate The model describing the
as-solidified behaviour, however, is far from being able to account for the
data measured by Hall, as can be seen in Fig 5 16 As the temperature
change rate in Hall's experiments was slow resulting in creep strain rates of
about 10 ^s ' and the parameter of the model were determined in the range
of 3*10 6s l to 5*10 3s ' only, the question arises whether the low strain rate
sensitivity determined at relatively high strain rates extends to low strain
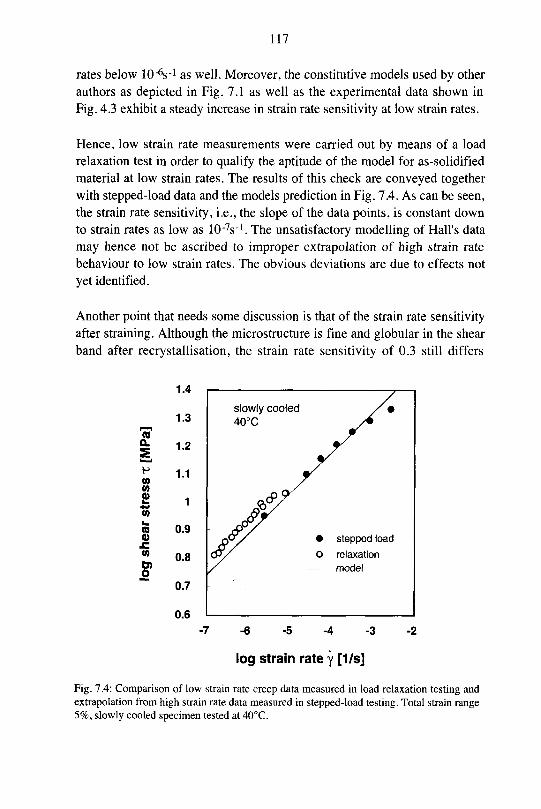
117
rates below 10-V1 as well Moreover, the constitutive models used by other
authors as depicted in Fig 7 1 as well as the experimental data shown in
Fig 4 3 exhibit a steady increase in strain rate sensitivity at low strain rates
Hence, low strain rate measurements were carried out by means of a load
relaxation test in order to qualify the aptitude of the model for as-solidified
matenal at low strain rates The results of this check are conveyed togetherwith stepped-load data and the models prediction in Fig 7 4 As can be seen,
the strain rate sensitivity, i e,the slope of the data points, is constant down
to strain rates as low as 10 7s ' The unsatisfactory modelling of Hall's data
may hence not be ascribed to improper extrapolation of high strain rate
behaviour to low strain rates The obvious deviations are due to effects not
yet identified
Another point that needs some discussion is that of the strain rate sensitivity
after straining Although the microstructure is fine and globular in the shear
band after recrystallisation, the strain rate sensitivity of 0 3 still differs
1.4
1.3
co
^ 1.2
S 1-1
CO
£ 1
CO
co 0.90)
• 0.8D)O~
0.7
0.6
-7 -6 -5 -4 -3 -2
log strain rate y [1/s]
Fig 7 4 Comparison of low strain rate creep data measured in load relaxation testing and
extrapolation from high strain rate data measured in stepped-load testing Total strain range
5%, slowly cooled specimen tested at 40°C
slowly cooled
40°C/•
J^f • stepped load
O relaxation
— model
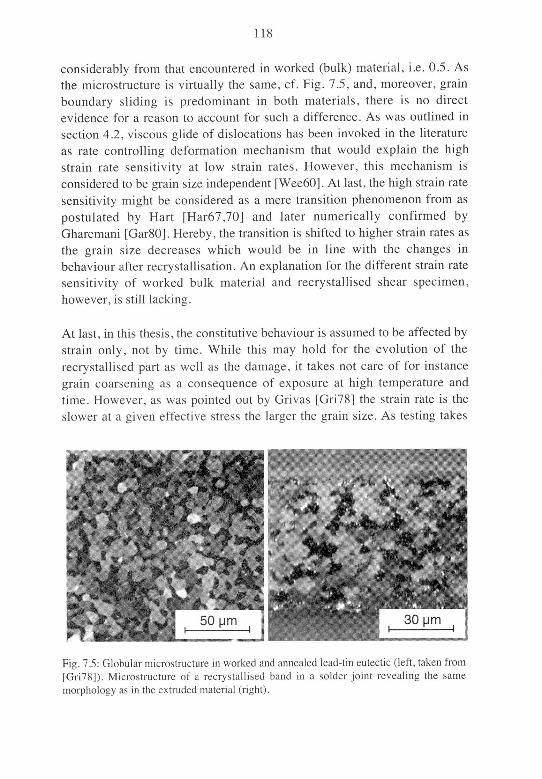
118
considerably from that encountered in worked (bulk) material, i.e. 0.5. As
the microstructure is virtually the same, cf. Fig. 7.5, and, moreover, grain
boundary sliding is predominant in both materials, there is no direct
evidence for a reason to account for such a difference. As was outlined in
section 4.2, viscous glide of dislocations has been invoked in the literature
as rate controlling deformation mechanism that would explain the high
strain rate sensitivity at low strain rates. However, this mechanism is
considered to be grain size independent [Wee60], At last, the high strain rate
sensitivity might be considered as a mere transition phenomenon from as
postulated by Hart [Har67,70] and later numerically confirmed by
Gharemani [Gar80], Hereby, the transition is shifted to higher strain rates as
the grain size decreases which would be in line with the changes in
behaviour after recrystallisation. An explanation for the different strain rate
sensitivity of worked bulk material and recrystallised shear specimen,
however, is still lacking.
At last, in this thesis, the constitutive behaviour is assumed to be affected by
strain only, not by time. While this may hold for the evolution of the
recrystallised part as well as the damage, it takes not care of for instance
grain coarsening as a consequence of exposure at high temperature and
time. However, as was pointed out by Gnvas [Gn78] the strain rate is the
slower at a given effective stress the larger the grain size. As testing takes
Fig. 7 5- Globular microstructure in worked and annealed lead-tin eutectic (left, taken from
[Gn78J) Microstructure of a recrystallised band in a soldei joint revealing the same
morphology as in the extruded material (right)
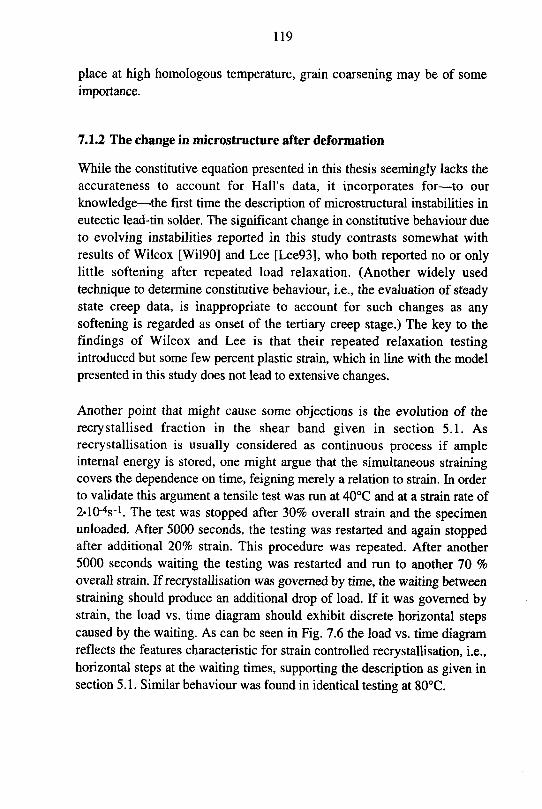
119
place at high homologous temperature, grain coarsening may be of some
importance.
7.1.2 The change in microstructure after deformation
While the constitutive equation presented in this thesis seemingly lacks the
accurateness to account for Hall's data, it incorporates for—to our
knowledge—the first time the description of microstructural instabilities in
eutectic lead-tin solder. The significant change in constitutive behaviour due
to evolving instabilities reported in this study contrasts somewhat with
results of Wilcox [Wil90] and Lee [Lee93], who both reported no or onlylittle softening after repeated load relaxation. (Another widely used
technique to determine constitutive behaviour, i.e., the evaluation of steadystate creep data, is inappropriate to account for such changes as any
softening is regarded as onset of the tertiary creep stage.) The key to the
findings of Wilcox and Lee is that their repeated relaxation testingintroduced but some few percent plastic strain, which in line with the model
presented in this study does not lead to extensive changes.
Another point that might cause some objections is the evolution of the
recrystallised fraction in the shear band given in section 5.1. As
recrystallisation is usually considered as continuous process if ampleinternal energy is stored, one might argue that the simultaneous strainingcovers the dependence on time, feigning merely a relation to strain. In order
to validate this argument a tensile test was run at 40°C and at a strain rate of
2»10-4s-'. The test was stopped after 30% overall strain and the specimenunloaded. After 5000 seconds, the testing was restarted and again stoppedafter additional 20% strain. This procedure was repeated. After another
5000 seconds waiting the testing was restarted and run to another 70 %
overall strain. If recrystallisation was governed by time, the waiting between
straining should produce an additional drop of load. If it was governed bystrain, the load vs. time diagram should exhibit discrete horizontal stepscaused by the waiting. As can be seen in Fig. 7.6 the load vs. time diagramreflects the features characteristic for strain controlled recrystallisation, i.e.,
horizontal steps at the waiting times, supporting the description as given in
section 5.1. Similar behaviour was found in identical testing at 80°C.
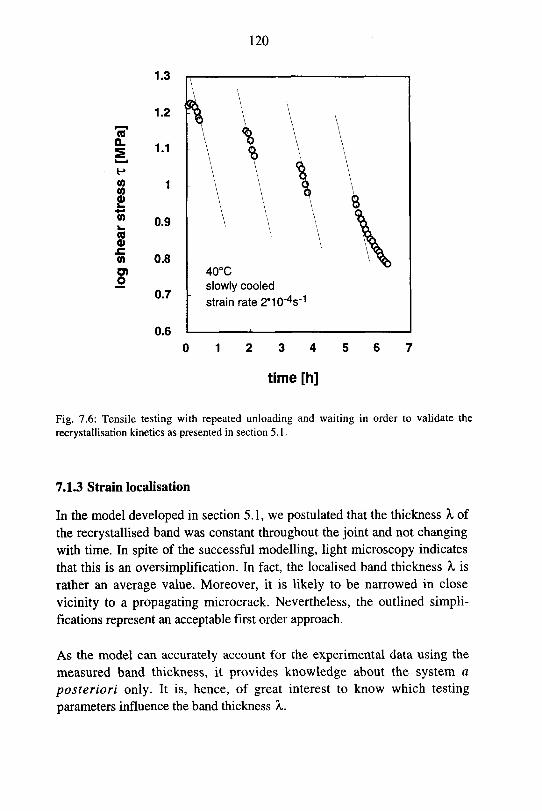
120
co
a.
t-»
coCOCD
CO
1_
COa>£CO
OD
0.9
0.8
0.7
0.6
40°C
slowly cooled
strain rate 2*10-V
0 12 3 4
time [h]
Fig. 7.6: Tensile testing with repeated unloading and waiting in order to validate the
recrystallisation kinetics as presented in section 5.1.
7.1.3 Strain localisation
In the model developed in section 5.1, we postulated that the thickness X of
the recrystallised band was constant throughout the joint and not changing
with time. In spite of the successful modelling, light microscopy indicates
that this is an oversimplification. In fact, the localised band thickness X is
rather an average value. Moreover, it is likely to be narrowed in close
vicinity to a propagating microcrack. Nevertheless, the outlined simpli¬
fications represent an acceptable first order approach.
As the model can accurately account for the experimental data using the
measured band thickness, it provides knowledge about the system a
posteriori only. It is, hence, of great interest to know which testing
parameters influence the band tiiickness X.
121
Intuitively, we would expect that the recrystallised band thickness is the
smaller the larger the ratio of local strain in the shear band to that in the as-
solidified part of the joint. This ratio changes from 1 (x=Q) to P" (x=l), cf.
equation (5.6) and, thus, depends mainly on the stress partitioning factor P.
In Fig. 7.7, me dependence of the shear band thickness on P is conveyed.While there is in fact a tendency towards thicker shear bands at low P-
values, the data scatter considerably. As concerns the very narrow shear
bands in quenched specimen, the first-principles-approach proposed above
cannot take care for it.
As can be seen from Fig. 7.7, the solidification condition of the specimen
plays a crucial role in determining the strain localisation. A reason for this
influence may be provided by the difference in initial cell size after
solidification. As was shown in Fig. 4.2, the microstructure after slow
solidification exhibits eutectic cell boundaries in any direction, i.e., parallel
10
O)
c
.o'•&
"£COa
CO(0
£M
CO
O slowly cooled
• quenched
0.01 0.1
shear band thickness X [-]
Fig. 7.7: Dependence of the shear band thickness A on the stress partitioning factor P
determined at various temperatures and strain rates on 60(xm joint specimen. For die slowlycooled specimen a inverse proportionality holds quite well. The quenched specimen exhibit
narrower shear bands.
122
and perpendicular to the applied stress, while after quenching the cell
boundaries are predominantly perpendicular to the direction of appliedstress except at the solder/substrate interface. As shear bands form
predominantly in eutectic cell boundary regions, they can evolve at various
places throughout the solder joint in slowly cooled specimen, while in
quenched specimen shear bands can form along solder/substrate-interfaces
only. However, the shear band thickness is not affected by the overall jointthickness neither in quenched nor in slowly cooled specimen. This indicates,
that the evolution of a shear band is affected but not completely controlled
by the microstructure. The findings presented above contrast with work
published by Mei et al. [Mei91a,b] where quenched material in solder jointshave been reported to exhibit higher fatigue resistance than slowly cooled
specimen. This has been ascribed to the decreased proneness to localise
strain owing to the fine and equiaxed structure in quenched specimen.
However, repeated investigation performed in this study supports that the
inverse is the case.
Although the shear band thickness could be determined by light microscopyafter testing there is some uncertainty about the actual value of X as it varied
throughout the solder joint and was influenced by large primary phases and
intermetallics. Thus, the value taken for X was rather 'the most likely
average' then an exact value. Moreover, it is not clear, whether the shear
band thickness changed during testing as only the situation after testing was
accessible. This at last raises the question to what extent the determined
values of the damage rate s are reliable as merely the ratio of s to X was
represented by the relative decrease in load Q per unit strain, which was
determined by experiment. However, tensile testing allow a further cross¬
check as the stress is related to the local strain rate, which in turn depends
on the shear band thickness X and the overall strain rate applied.
7.1.4 Damage evolution and fracture behaviour
As was shown in section 5.2, there are differences between slowly cooled
and quenched specimen in terms of damage evolution. These differences are
accounted for in the distinct damage evolution descriptions as given in
(5.25), (5.26), and (5.28), respectively. While both damage evolution laws
were developed as purely numerical descriptions they nevertheless may
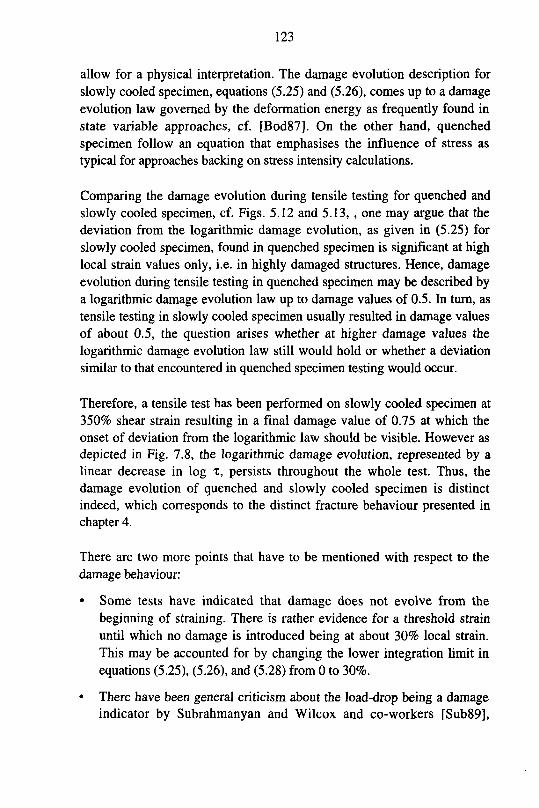
123
allow for a physical interpretation. The damage evolution description for
slowly cooled specimen, equations (5.25) and (5.26), comes up to a damageevolution law governed by the deformation energy as frequently found in
state variable approaches, cf. [Bod87]. On the other hand, quenched
specimen follow an equation that emphasises the influence of stress as
typical for approaches backing on stress intensity calculations.
Comparing the damage evolution during tensile testing for quenched and
slowly cooled specimen, cf. Figs. 5.12 and 5.13, ,one may argue that the
deviation from the logarithmic damage evolution, as given in (5.25) for
slowly cooled specimen, found in quenched specimen is significant at highlocal strain values only, i.e. in highly damaged structures. Hence, damageevolution during tensile testing in quenched specimen may be described bya logarithmic damage evolution law up to damage values of 0.5. In turn, as
tensile testing in slowly cooled specimen usually resulted in damage values
of about 0.5, the question arises whether at higher damage values the
logarithmic damage evolution law still would hold or whether a deviation
similar to that encountered in quenched specimen testing would occur.
Therefore, a tensile test has been performed on slowly cooled specimen at
350% shear strain resulting in a final damage value of 0.75 at which the
onset of deviation from the logarithmic law should be visible. However as
depicted in Fig. 7.8, the logarithmic damage evolution, represented by a
linear decrease in log X, persists throughout the whole test. Thus, the
damage evolution of quenched and slowly cooled specimen is distinct
indeed, which corresponds to the distinct fracture behaviour presented in
chapter 4.
There are two more points that have to be mentioned with respect to the
damage behaviour:
• Some tests have indicated that damage does not evolve from the
beginning of straining. There is rather evidence for a threshold strain
until which no damage is introduced being at about 30% local strain.
This may be accounted for by changing the lower integration limit in
equations (5.25), (5.26), and (5.28) from 0 to 30%.
• There have been general criticism about the load-drop being a damageindicator by Subrahmanyan and Wilcox and co-workers [Sub89],
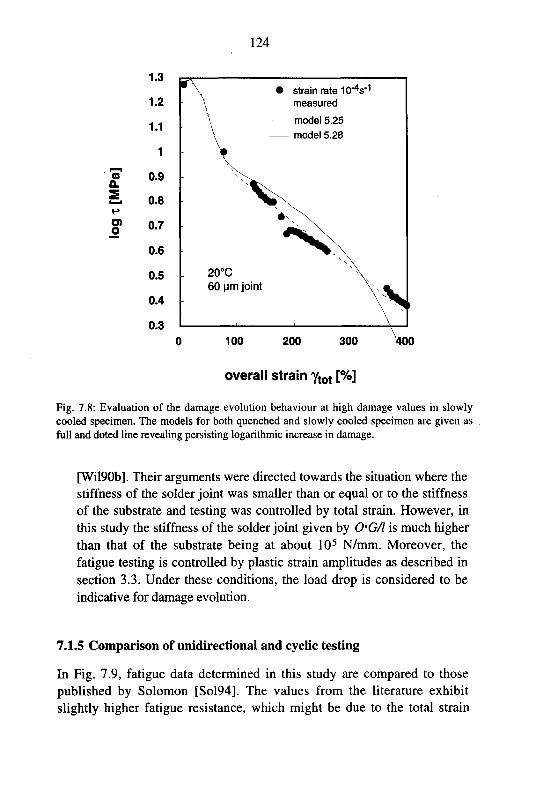
124
coQ.
o
strain rate 10"4s"1
measured
model 5.25
model 5.28
400
overall strain ytot [%]
Fig. 7.8: Evaluation of the damage evolution behaviour at high damage values in slowlycooled specimen. The models for both quenched and slowly cooled specimen are given as
full and doted line revealing persisting logarithmic increase in damage.
[Wil90b]. Their arguments were directed towards the situation where the
stiffness of the solder joint was smaller than or equal or to the stiffness
of the substrate and testing was controlled by total strain. However, in
this study the stiffness of the solder joint given by O'G/l is much higherthan that of the substrate being at about 105 N/mm. Moreover, the
fatigue testing is controlled by plastic strain amplitudes as described in
section 3.3. Under these conditions, the load drop is considered to be
indicative for damage evolution.
7.1.5 Comparison of unidirectional and cyclic testing
In Fig. 7.9, fatigue data determined in this study are compared to those
published by Solomon [Sol94]. The values from the literature exhibit
slightly higher fatigue resistance, which might be due to the total strain
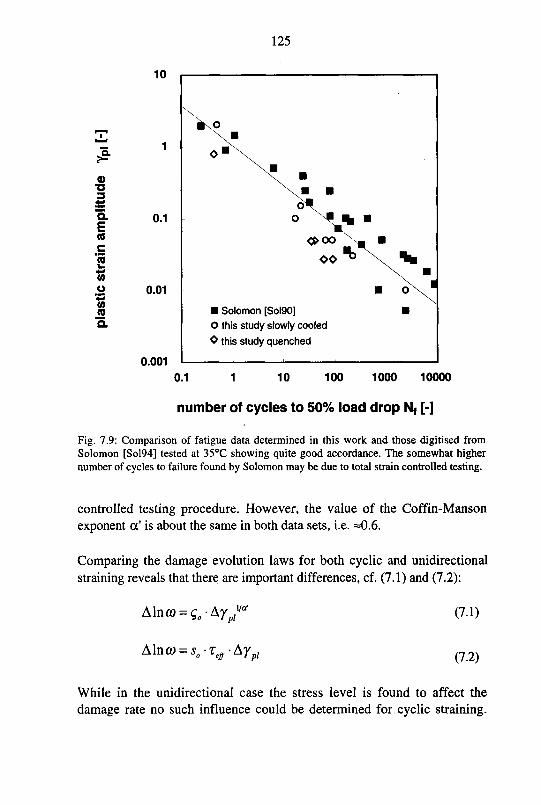
125
?&
o>o3
a
ECO
c
"co>_+•*
V)
o"^COCO
10
0.1
0.01
0.001
«»oo
OO
Solomon [Sol90]
O this study slowly cooled
O this study quenched
0.1 1 10 100 1000 10000
number of cycles to 50% load drop Nf [-]
Fig. 7.9: Comparison of fatigue data determined in this work and those digitised from
Solomon [Sol94] tested at 35°C showing quite good accordance. The somewhat highernumber of cycles to failure found by Solomon may be due to total strain controlled testing.
controlled testing procedure. However, the value of the Coffin-Manson
exponent a' is about the same in both data sets, i.e. =0.6.
Comparing the damage evolution laws for both cyclic and unidirectional
straining reveals that there are important differences, cf. (7.1) and (7.2):
A\nco = g0-AYpr
A\nco = s0-reff-Aypl
(7.1)
(7.2)
While in the unidirectional case the stress level is found to affect the
damage rate no such influence could be determined for cyclic straining.
126
However, there might be an effect of stress, cf. Fig. 6.4, but data are too rare
to allow for a reliable determination.
On the other hand, the deformation amplitude is found to affect the damage
per cycle other than linearly, which contrasts the findings in unidirectional
testing. At this stage, it is thus not possible to provide a unified theory of
damage evolution for both unidirectional and cyclic straining.
7.1.6 Implications for production and testing in the SMT
As has been outlined in the previous sections, the solidification process
strongly affects the resulting mechanical properties of the solder. Due to the
thinner shear bands, quenched solder joints exhibit a poorer resistance
against fatigue damage than slowly cooled solder joints. It is hence
advisable to use as slow solidification processes as possible in SMT
production.
The obviously widespread forming of shear bands in eutectic lead-tin solder
bears an implication for technical applications. As was suggested in
Engelmaier's equation, cf. (2.28), the height of the solder joint would
influence the number of cycles to failure. This is true if the strain amplitudeis calculated by division of the relative thermal displacement by the solder
height. However, if the thickness of the shear band, where virtually all of
the displacement is absorbed by local straining, is not affected by the solder
joint height, a further increase in joint thickness should not change the
fatigue resistance of the joint. Hence, applying of underfiller and gap-
provider in order to increase the fatigue resistance of the assembly may not
necessarily be successful.
A similar problem arises by using ball grid arrays and column grid arrays as
recently introduced: owing to differences in alloy composition and, thus,
strength, the strain will localise in the low-melting part of the solder joint,
cancelling the advantage of the higher solder joint. Generally speaking, the
solder height is important only if the joint geometry allows for significantelastic bending of the solder post or column, i.e., if the column is very thin.
127
Testing considerations are guided by the same arguments as presented in
section 2.4: Thermomechanical cycling leads imposes primarily an overall
strain amplitude on the device/PCB/solder joint combination. The amount of
plastic strain induced in the solder joint depends on the time during which
the stress is applied and on the stress level as the rate of plastic deformation
depends on the applied stress. The applied stress is influenced by the
temperature swing, the thermo-mismatch, and the stiffness of the assembly.
For compliant devices such as a QFP even large temperature amplitudeslead to small stresses only and hence require long dwell times in order to
result in appreciable plastic strain. On the other hand, stiff devices such as
ceramic capacitors transform most of the elastically stored strain in very
short dwell times (< 300s) at the upper temperature limit of the cycle. If the
lower temperature limit is below 0°C, the dwell time is of no use in
compliant devices while again a short dwell time is required for stiff
devices, especially if the temperature change rate is fast.
As for temperature change rates, the situation is just inverse: While
compliant devices are more or less unaffected by fast temperature change
rates, stiff components induce high stresses in the solder joint, provoking
damage rates which are larger than those at intermediate stresses including
the risk of promoting artificial failure mechanisms. Hence, in field tests a
temperature change rate larger than 10°C should not be exceeded.
Obviously, the choice of the test parameters prejudices which kind of
component in terms of stiffness is more likely to fail. It is thus, crucial to
understand the results of field fatigue testing with respect to the testing
parameters.
7.1.7 Direction of future work
As has been shown in this thesis, the proneness to microstructural changes
and the accompanying localisation of strain and premature failure
characterises the constitutive behaviour as well as the damage evolution in
eutectic lead-tin solder. It will, hence, be of major interest to learn more
about the relevant parameters that trigger the localised recrystallisation.Some efforts in this direction have already been made by Morris and co-
128
workers, cf. [Mor94]. However, basic understanding of these features is still
on demand.
Another point that needs some further investigation is the recrystallisationbehaviour in cyclic testing. As these preliminary studies have shown, there
is no pronounced transition to a completely recrystallised state in cyclic
testing. However, as unidirectional straining may be considered as limitingcase of cyclic straining the evolution of a shear band would be expected to
take place in cyclic deformation, too, resulting in a unified theory for both,
cyclic and unidirectional straining.
12 Conclusions
The thesis in hand has dealt with the creep deformation and fatiguebehaviour of a lead-tin-silver eutectic solder, as it is in use for soldering of
electronic devices. Therein, the focus has been set on the deformation
behaviour at large strains and on microstructural changes accompanying the
creep deformation. The contribution to the state-of-the-art-knowledge on
eutectic solder of this work can be summarised as follows:
1. The constitutive behaviour of eutectic lead-tin-silver solder and its
dependence on the microstructure is investigated at length. It is shown,
that straining causes significant changes in the creep characteristic in
terms of increased strain rate sensitivity compared to the stress vs. strain
rate behaviour after solidification.
2. The microstructural changes accompanying this transition, i.e.
recrystallisation, are qualified and demonstrated experimentally. It is
recognised that these changes are restricted to a fraction of the solder
joint only and this fraction is identified as coarsened shear band as being
regularly encountered in mechanically tested solder structures. In these
shear bands grain and phase boundary movement contributes
significantly to the deformation.
3. The evolution of damage is extracted from unidirectional as well as
cyclic deformation tests. For slowly cooled specimen, it is found that the

129
rate of damage evolution is proportional to the strain energy in
unidirectional testing. The damage evolution in cyclic straining is
described with a localised and discretised Coffin-Manson approach.
4. The structural changes as well as the localisation are incorporated—toour knowledge—for the first time in an overall constitutive description.The damage evolution following the description proposed by Kachanov
and Lemaitre is accounted for as well. This results in a state variable
approach, where three variables—the recrystallisation state x, the
damage state co, and the temperature T—completely define the (strain-)
response of a volume element to a given load
5. It is shown that the rate of recrystallisation is proportional to the not yet
recrystallised volume fraction in the shear band and the accumulated
local strain. This contrasts other kinetic models of phase transformation
such as the Johnson-Mehl-Avrami equation, where transformation is
governed by time.

Leer - Vide - Empty
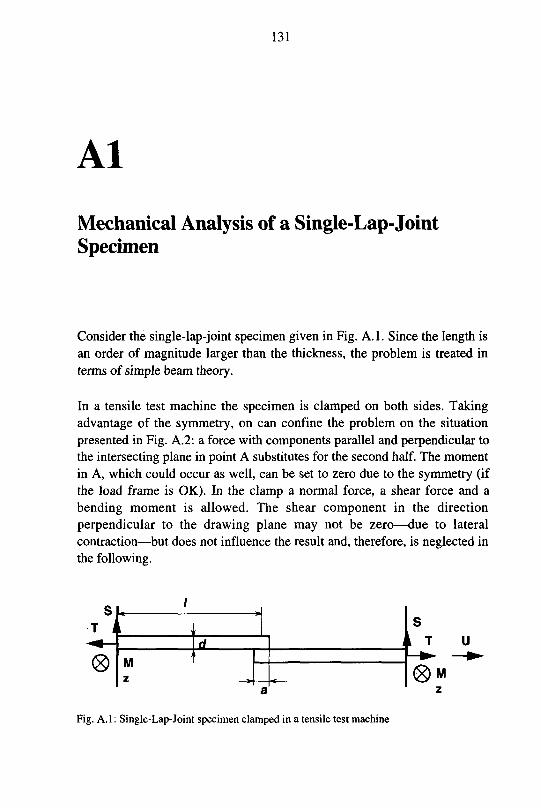
131
Al
Mechanical Analysis of a Single-Lap-JointSpecimen
Consider the single-lap-joint specimen given in Fig. A.l. Since the Iengtii is
an order of magnitude larger than the thickness, the problem is treated in
terms of simple beam theory.
In a tensile test machine the specimen is clamped on both sides. Taking
advantage of the symmetry, on can confine the problem on the situation
presented in Fig. A.2: a force with components parallel and perpendicular to
the intersecting plane in point A substitutes for the second half. The moment
in A, which could occur as well, can be set to zero due to the symmetry (if
the load frame is OK). In the clamp a normal force, a shear force and a
bending moment is allowed. The shear component in the direction
perpendicular to the drawing plane may not be zero—due to lateral
contraction—but does not influence the result and, therefore, is neglected in
the following.
s/
T < i
iId
® M
z —^~— <
T U
0M
Fig. A. 1: Single-Lap-Joint specimen clamped in a tensile test machine

132
A
M
z
frFig. A.2: Reduced problem using the symmetry of the specimen
Since the two forces T are not co-linear a bending moment is present in the
beam. Consequently, a displacement of A in direction perpendicular to the
beam but within the drawing plane is expected. Due to the symmetry, this
displacement must be cancelled by the normal force S in A. The magnitudeof 5 is estimated in the following:
The momentum of bending M is given as a function of T and 5 and the x-co-
ordinate as follows:
M(x) = T.^—S.(l-x)
The differential equation of the bending line is
M A-S.(l-x)
(A.1)
y =
E.J E.J(A.2)
with E...Young's modulus of the substrate, J... the moment of inertia about
the z-axis of the beam and
A = T.d + S
Integration leads to
y' = ——(j.S.x^A.x-l.S.x + CA (A3)

133
and the parameter C\ follows from the boundary condition y'(0) = 0 (rigid
fixation!) to be zero. Further integration leads to the bending line:
'-—-IsE.J \6
S.xi+liA.x1-h.S.x1 + c\ (A.4)
As above, the parameter C2 follows from the boundary condition y(0) = 0 to
be zero. The value of S follows from the boundary condition y(l) = 0:
5 = |.A.i = |.^.r (A.5)
Interestingly enough, the ratio of T and 5 does not depend on the bendingstiffness of the substrate. Therefore, the substrate is to keep as thin as
possible (since S is proportional to d+S).
A further source of normal forces in the solder joint might be the distortion
of the solder plane with respect to the shear forces T. This distortion can be
estimated using (A.3) and (A.5) for x = I:
,1 l.(d + 5).T
y =
8 E.J
Using the explicit form of the moment of inertia, /, the tangent of the
distortion angle and, thus, the additional part of the normal force can be
calculated:
,3 l. (d + S). a X
y = -• i—•—2d3 E
AS = /.T (A.6)
With respect to the used specimen geometry an additional normal force AS
of about lO3 times the shear force T develops due to the distortion.
The analysis presented above assumed the forces T and S to act on one
single point A. In fact, the normal force S is introduced via a finite area—
the solder joint—and, hence, the distribution of that force over the area has
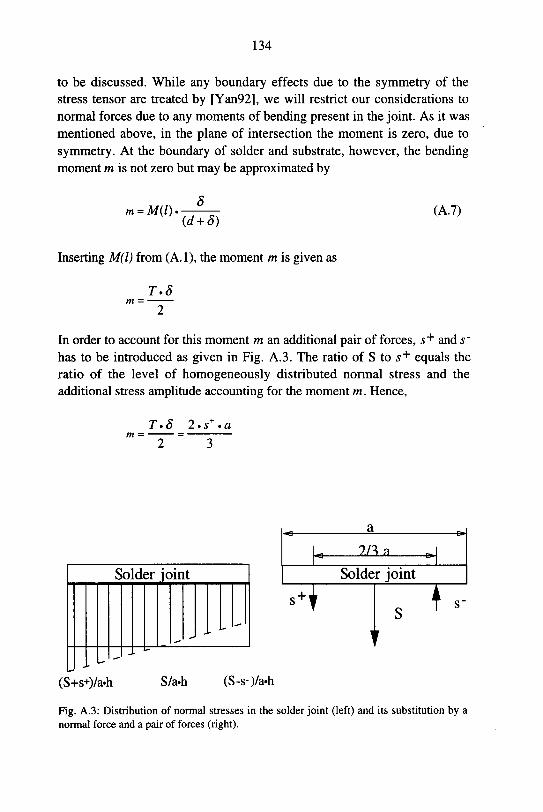
134
to be discussed. While any boundary effects due to the symmetry of the
stress tensor are treated by [Yan92], we will restrict our considerations to
normal forces due to any moments of bending present in the joint. As it was
mentioned above, in the plane of intersection the moment is zero, due to
symmetry. At the boundary of solder and substrate, however, the bendingmoment m is not zero but may be approximated by
m = M(l).(d + 8)
(A.7)
Inserting M(l) from (A.l), the moment m is given as
T.S
In order to account for this moment m an additional pair of forces, s+ and s~
has to be introduced as given in Fig. A.3. The ratio of S to s+ equals the
ratio of the level of homogeneously distributed normal stress and the
additional stress amplitude accounting for die moment m. Hence,
T.S 2.s+.a
Solder joint
2/3 a
TSolder joint
(S+s+)/a.h S/a-h (S-s-)/a-h
T
Fig. A.3: Distribution of normal stresses in the solder joint (left) and its substitution by a
normal force and a pair of forces (right).
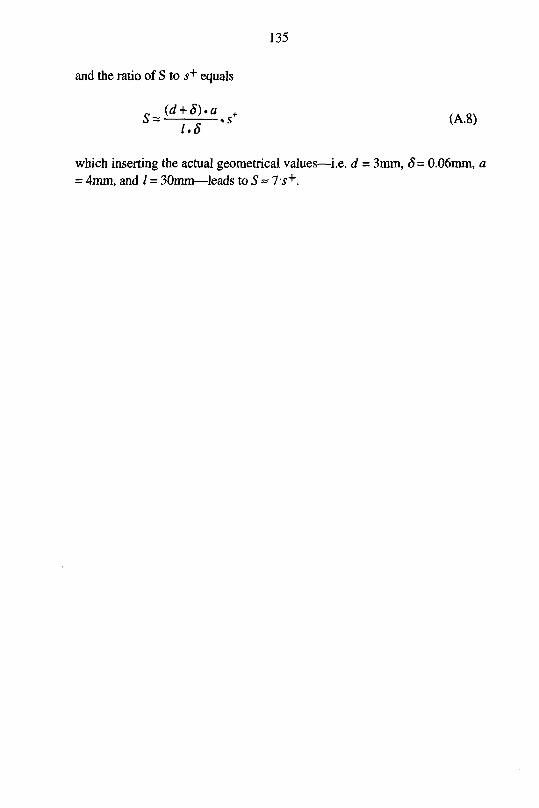
135
and the ratio of S to s+ equals
sJd+ 8).a%s+ (Ag)1.8
which inserting the actual geometrical values—i.e. d = 3mm, 8= 0.06mm, a
= 4mm, and / = 30mm—leads to S = 7s+.

136
A2
List of Symbols and Abbreviations
A power-law pre-factor for dislocation climb regime
Aj temperature integrated pre-factor A
b Burgers vector
B power-law pre-factor for grain boundary sliding
Bj temperature integrated pre-factor B
d grain size
dc dislocation climb
fc furnace cooled
G shear modulus
gbs grain boundary sliding
k stiffness of the assembly
/ solder joint thickness
m stress exponent in the power-law description of grain boundary
sliding controlled creep
n stress exponent in the power-law description of dislocation climb
controlled creep
P stress partitioning factor
PCB printed circuit board

137
Q(i) thermal activation energy
Qdc thermal activation energy for dislocation climb
Qgbs thermal activation energy for grain boundary sliding
qu quenched
R universal gas constant
r rate of grain growth
9t pre-factor in the Weibull plot in recrystallisation kinetics
s rate of damage accumulation
SMT surface mount technology
SMD surface mount devices
SRS strain rate sensitivity
T temperature
x recrystallised part of the shear band
a Weibull exponent in recrystallisation
B pre-factor in the Weibull plot in recrystallisation kinetics
ytal overall shear strain
yloc local shear strain
y total shear strain rate
y* shear strain rate of equal contribution of gbs and dc
f applied shear strain rate
y„ creep shear strain rate
yeff effective shear strain rate
yel elastic shear strain rate
yloc local shear strain rate
ypl plastic shear strain rate
70 initial shear strain rate
T numerical constant
Ag Gibb's free energy of recrystallisation

138
X shear band thickness
v Debye frequency, cycle frequency in fatigue testing
p dislocation density
x applied shear stress
T* stress at which dc and gbs contribute to equal parts to the creep rate
<" shear stress in the as soldered regions
T«c shear stress in the recrystallised regions
i rate of shear stress change
to damage variable
I low stress creep regime
II intermediate stress creep regime
in high stress creep regime
139
References
[Ada86] Adams, P.J.: M.Sc. thesis MIT (1986)
[Ald70] Aldrich, J.W.; Avery, D.H.: in Ultrafine grain Materials Saga¬
more Army Materials Research Conference 16 (1970) 397
[Arg70] Argon, A.S.: Scripta Met. 4 (1970) 1001
[Arr91] Arrowood, R.; Mukherjee, A.; Jones, W.B.: in Solder Mechanics
- A State of the Art Assessment, D.R.Frear W.B.Jones,
K.R.Kinsman (Eds.).TMS publications (1991) 107
[Ash73] Ashby, M.F.; Verrall, R.A.: Acta Met. 21 (1973) 149
[Bal69] Ball, A.; Hutchison, M.M.: Metal Sci. J. 3 (1969) 1
[BaslO] Basquin, O.H.: Proc. ASTM10 (1910) 625
[Bir64] Bird, J.; Mukherjee, A.K.; Dorn, J.E.: Qualitative Relation
between Properties and Microstructure, D.G. Branden, R.Rosen
(Eds.) Israel University Press, Haifa (1964)
[Boc45] Bochvar, A.A.; Sviderskaja, Z.A.: Izv. Akad. Nauk SSSR 9 (1945)
[Bod87] Bodner, S.R.: in Unified Constitutive Equations for Creep and
Plasticity, Ed. A.K.Miller, Elsevier Appl. Sci. Publ. (1987) 273
[Bra22] Brady, F.L.: /. Inst. Metals 28 (1922) 369
[Cli67] Cline, H.E.; Alden, T.H.: Trans. Metall. Soc. AIME 239 (1967)
710
[Cob63] Coble, R.L.: J. Appl. Phys. 34 (1963) 1679
[Cof54] Coffin Jr., L.F.: Trans. ASME 76 (1954) 931
[Cof71] Coffin Jr., L.F.: Met. Trans. 2 (1971) 3105
[Cof73] Coffin Jr., L.F.: ASTMSTP 520 (1973) 112
140
[Dar92] Darveaux, R.; Banerji, K.: IEEE Trans. Comp., Hyb. Man. 15
(1992) 1013
[Dow76] Dowling, N.E.; Begley, J.A.: ASTMSTP 590 (1976) 82
[Dow77] Dowling, N.E.: ASTM STP 637 (1977) 97
[Dow79] Dowling, N.E.: Fatigue Eng. Mat. Struct. 2 (1979) 129
[Eng83] Engelmaier, W.: IEEE Trans. Comp. Hyb. Man. Techn. 6 (1983)
232
[Eng85] Engelmaier, W.: Circuit World 11 (1985) 61
[Eng92] Engelmaier, W.: International Workshop on SMT Reliability and
Manufactoring Issues, ETH Zurich, 1992
[EwiOO] Ewing, J.A.; Rosenhain, W.: Phil. Trans. Roy. Soc. 193 (1900)
353
[Fen94] Fenech, A.; Hijazi, A.; Danto, Y.: Proc. ESREF '94 Glasgow(1994)405
[Fre88] Frear, D.R.; Grivas, D.; Morris Jr., J.W.: /. Metals 40 (1988) 18
[Fre91] Frear, D.R.: in Solder Mechanics-A State of the Art Assessment,
D.R.Frearet al. (Eds.), TMS publications (1991) 191
[Gar63] Garofalo, F.: Trans. Metall. Soc. AIME 227 (1963) 351
[Gri78] Grivas, D.: PhD. thesis, Berkley (1978)
[Gri79] Grivas, D.; Murty, K.L.; Morris Jr.; J.W.: Acta Met. 27 (1979) 731
[Gro96] Grossmann, G.; Nicoletti, G.: Materials Characterization 36 (1996)
235
[Guo92a] Guo, Z.; Sprecher, A.F.; Conrad, H.: J. Elec. Packaging 114
(1992)112
[Guo92b] Guo, Z.; Sprecher, A.F.; Conrad, H.: /. Elec. Packaging 114
(1992) 145
141
[Guo92c] Guo, Z.; Sprecher, A.F.; Conrad, H.: 5th ASM Elec. Mat.& Proc.
Congress ASM Int., Cambridge MA
[Hal76] Halford, G.R.; Manson, S.S.: ASTM STP 612 (1976) 239
[Hal83] Hall, P.M.; Dudderar, T.D.; Argyle, J.F.: IEEE Trans. Comp. Hyb.Man. Techn. 6 (1983) 544
[Hal84] Hall, P.M.: IEEE Trans. Comp. Hyb. Man. Techn. 7 (1984) 314
[Hal87] Hall, P.M.: IEEE Trans. Comp. Hyb. Man. Techn. 10 (1987) 556
[Har27a] Hargreaves, F.: J. Inst. Metals 37 (1927) 103
[Har27b] Hargreaves, F.: /. Inst. Metals 37 (1927) 106
[Har27c] Hargreaves, F.: J. Inst. Metals 38 (1927) 315
[Har28] Hargreaves, F.; Hills, R.J.: J. Inst. Metals 40 (1928) 41
[Har57] Harper, J.; Dorn, J.E.: Acta Met. 5 (1957) 654
[Har67] Hart, E.W.: Acta Met. 15 (1967) 1545
[Har70] Hart, E.W.: Acta Met. 18 (1970) 599
[Har94] Harning, M.; Warnke, A.; Schomburg, U.: DVM 26 Vortrags-
veranstaltung Arbeitskreis Bruchvorgdnge (1994) Magdeburg
[Her50] Herring, C: J. Appl. Phys. 21 (1950) 437
[Hor74] Horiuchi, R.; El-Sebai, A.B.; Otsuka, M.: phys. stat. sol. (a) 21
(1974) K89
[Ish67] Ishida, Y.; McLean, D.: /. Iron Steel Inst. 205 (1967) 88
[Jen28] Jenkins, C.H.M.: J. Inst. Metals 40 (1928) 21
[Kac58] Kachanov, L.M.: Izv. AN SSSR Otd. tehn. nauk 8 (1958) 26 (in
Russian)
[Kac86] Kachanov, L.M.: Introduction to Continuum Damage Mechanics
Martinus Nijhof publ., Dordrecht, The Netherlands (1986)

142
[Kas81] Kashyap, B.P.; Murty, G.S.: Mat. Sci. Eng. 50 (1981) 205
[Kne90] Knecht, S.; Fox, L.R.; IEEE Trans. Comp. Hyb. Man. Techn. 13
(1990) 424
[Kor87] Korhonen, M.A.; Hannula, S.-P.; Li, C.-Y: in Unified Constitutive
Equations for Creep and Plasticity, Ed. A.K.Miller, Elsevier
Appl. Sci. Publ. (1987) 89
[Kra92] Kramer, P.A.: M.S. Thesis, UC Berkeley (1992)
[Kur22] Kurnakoff, N.S.; Achnazaroff, A.N.: Z. anorg. Chem. 125 (1922)
185
[Lan83] Langdon, T.G.: Proc. ICSMA 6 3 (1983) 1105
[Lau93b] Lau, J.H.: IEEE Trans. Comp. Hyb. Man. Techn. 16 (1993) 794
[Lee93] Lee, S.M.: Creep and Creep-Fatigue Interaction in Pb-Sn
Eutectic and Eutectic Solder Joints Ph.D. Thesis, The Universityof Wisconsin, Madison (1993)
[Lem92] Lemaitre, J.: A Course on Damage Mechanics Springer Verlag,Berlin a.o. (1982)
[Man53] Manson, S.S.: NACA TN2933 (1953)
[Man71] Manson, S.S.; Halford, G.R.; Hirschberg, M.H.: NASA TM X-
67838(1911)
[Mas92] Massalski, T.B. (Ed. in-chief): Binary alloy phase diagrams 2nd
Ed. Volumes I-III, ASM International, Materials Park (1992)
[Mei90] Mei, Z.; Grivas, D.; Shine, M.C.; Morris Jr., J.W.: J. Elec. Mater.
19 (1990) 1273
[Mei91a] Mei, Z.; Morris Jr., J.W.; Shine, M.C.: /. Elec. Packaging 113
(1991) 109
[Mei91b] Mei, Z.; Morris Jr., J.W.; Shine, M.C.; Summers, T.S.E.: J. Elec.
Mater. 20 (1991) 599
[Mei92] Mei, Z.; Morris Jr., J.W.: J. Elec. Packaging 114 (1992) 104
143
[Moh75] Mohamed, F.A., Langdon, T.G.: Phil. Mag. 32 (1975) 697
[Mor64] Morrow, J.D.: ASTM STP 378 (1964) 45
[Mor91] Morris Jr., J.W.; Mei; Z.: in Solder Mechanics - A State ofthe Art
Assessment, D.R.Frear W.B.Jones, K.R.Kinsman (Eds.).TMS
publications (1991) 239
[Mor94] Morris Jr., J.W.; Freer-Goldstein, J.L.; Mei, Z.: in The Mechanics
of Solder Alloy Interconnects, Ed. D.R.Frear, Reinhold-Nostrand
New York (1994) 6
[Muk69] Mukherjee, A.K.; Bird, J.; Dorn, J.E.: Trans. ASM 62 (1969) 155
[Muk71] Mukherjee, A.K.: Mater. Sci. Eng. 8 (1971) 83
[Mur75] Murty, G.S.; Singh, U.P.; Iyengar, N.G.R.: J. Eng. Mat. Techn. 97
(1975) 187
[Nab48] Nabarro, F.R.N.: Rep. Conf Strength ofSteels Phys. Soc. London
(1948) 75
[Nor29] Norton, F.H.: The Creep of Steels at High Temperatures,
McGraw-Hill, NewYork-London
[Pad74] Padmanabhan, K.A.; Davies, G.J.: Rheol. Acta 13 (1974) 942
[Pan91] Pan, T.Y.: J. Elec. Packaging, 113 (1991) 8
[Pao90] Pao, Y.S.; Pan, T.Y.: J. Elec. Packaging, 111 (1990) 154
[Pao92] Pao, Y.S.: IEEE Trans. Comp. Hyb. Man. Techn. 15 (1992) 559
[Par63] Paris, P.C.; Erdogan, F.: J. Basic Eng. (1963) 528
[Pea34] Pearson, C.E.: /. Inst. Metals 54 (1934) 111
[Pli89] Plinius Secundus, G.: Naturalis Historia 34 Projektgruppe Plinius
(Ed.) Attempto-Verlag Tubingen (Germany) (1989) (in Latin)
[Plu83] Pluvinage, G.C.; Raguet, M.N.: Fatigue Mechanisms: Advances
in Quantitative Measurement of Physical Damage ASTM STP
144
811, J. Lankford, D.L. Davidson, W.L. Morris, and R.P. Wei
(Eds.) (1983) 139
[Por23] Portevin, A.M.; J. Inst. Metals 29 (1923) 239
[Put94] Puttner, A.; Rukwied, A.; Wilde, J.: Proc. DVS Berichte 158
(1994) 150
[Raj71] Raj, R.; Ashby, M.F.: Met. Trans. 2 (1971) 1113
[Ram87] Raman, V.; Reiley, T.C.: J. Mat. Sci. Let. 6 (1987) 549
[Ric68] Rice, J.R.: J. Appl. Mech. 35 (1968) 379
[Rob97] Roberts-Austen: 4th Report to the Alloys Research Comittee, Inst.
Mech. Eng. (1897)
[Ros09] Rosenhain, W.; Tucker, P.A.: Phil. Trans. Roy. Soc. 209 (1909)
89
[Ros91] Ross, R.G.: J. Elec. Packaging 113 (1991) 121
[Sat91] Satoh, R.; Arakawa, K.; Harada, M.; Matsui, K.: IEEE Trans.
Comp. Hyb. Man. Techn. 14 (1991) 224
[Schmi90] Schmidt, C.G.; Seaman, L.: NEPCON '90 (1990) 1330
[Shi88] Shine, M.C.; Fox, L.R.: Low Cycle Fatigue ASTM STP 942 (1988)
588
[Ski96] Skipor, A.F.; Harren, S.V.; Botsis, J.: /. Eng. Mat. Techn. 118
(1996) 1
[Sol72] Solomon, H.D.; J. Materials 7 (1972) 229
[S0I86] Solomon, H.D.: CRD Report No. 86CRD145, General Electric
(1986)
[S0I88] Solomon, H.D.: Low Cycle Fatigue ASTM STP 942 (1988) 342
[Sol89] Solomon, H.D.: J. Elec. Packaging 111 (1989) 75
[Sol90] Solomon, H.D.: /. Elec. Packaging 112 (1990) 123
145
[Sol91] Solomon, H.D.: in Solder Joint Reliability, Ed. J.H. Lau, Van
Nostrand Reinhold New York (1991) 406
[Sol94] Solomon, H.D.: in The Mechanics of Solder Alloy Interconnects,
Ed. D.R.Frear, Van Nostrand Reinhold, New York (1994) 199
[Sto85] Stone, D; Hannula S.-P., Li, C.-Y.: IEEE Electr. Comp. Conf.
(1985) 46
[Sto94] Stone, D.S.; Rashid, M.M.: in The Mechanics of Solder AlloyInterconnects, Ed. D.R.Frear, Van Nostrand Reinhold, New York
(1994) 87
[Sub89] Subrahmanyan, R.; Wilcox, J.R.; Li, C.-Y.: IEEE Trans. Comp.
Hyb. Man. Techn. 12 (1989) 480
[Sum90] Summers, T.S.E.; Morris Jr., J.W.: J. Elec. Packaging 111 (1990)
94
[Tam23] Tammann, G.; Dahl, K.: Z anorg. Chem. 126 (1923) 113
[Tri88] Tribula, D.; Grivas, D.; Frear, D.R.; Morris Jr., J.W.: Proc. ASME
Winter Meeting, Chicago (1988)
[Tri90] Tribula, D.; Morris Jr., J.W.: /. Elec. Packaging 112 (1990) 87
[Vay89] Vaynman, S.: IEEE Trans. Comp. Hyb. Man. Techn. 12 (1989)469
[Vay93] Vaynman, S.; McKeown, S.A.: IEEE Trans. Comp. Hyb. Man.
Techn. 16 (1993) 317
[Vei95] Veidt, M.: EMPA Research Report 154186/1-3 (1994-1995)
[Vil95] Villars, P.; Prince, A.; Okamoto H. (Eds.): Handbook of Ternary
alloy phase diagrams 3 ASM International, Materials Park (1995)
[War93] Warnke, A.; Harning, M.; Schomburg, U.: DVS Berichte 153
(1993) 140
[Wee55] Weertmann, J.: J. Appl. Phys. 26 (1955) 1213
[Wee57] Weertmann, J.: J. Appl. Phys. 28 (1957) 362

146
[Wee60] Weertmann, J.: Trans. AIME 218 (1960) 207
[Wee67] Weertmann, J.: Trans. AIME 239 (1967) 1989
[Wee68] Weertmann, J.: Trans. ASM 61 (1968) 681
[Wil90] Wilcox, J.R.: Inelastic Deformation and Fatigue Damage in
Metals at High Homologous Temperatures Ph.D. Thesis, Cornell
University, 1990
[Wil90b] Wilcox, J.R.; Subrahmanyan, R.; Li, C.-Y.: J. Elec. Packaging112(1990)115
[Yan92] Yang, Y.: Spannungssingularitdten in Zweistoffverbunden bei
mechanischer und thermischer Belastung VDI-Verlag, Diisseldorf
(1992)
[Zeh68] Zehr, S.W.; Backofen, W.A.: Trans. ASM 61 (1968) 300
147 147
Curriculum Vitae
I was born in Wettingen (Switzerland) on April 5,1969. In 1971, my family
moved to Stein am Rhein, where I attended primary and secondary school.
Starting in 1983, I visited the Kantonsschule in Schaffhausen, graduatingwith die Matura in 1988. After military service, I studied from 1989 to 1994
at the Swiss Federal Institute of Technology (ETH), Zurich, where I re¬
ceived the diploma in materials engineering (Dipl. Werkst.-Ing. ETH).
Since 1994,1 worked as a research scientist at the Reliability Laboratory of
the ETH on the field of constitutive equations and damage behaviour of
solder material.