IMRC - iMMAP
34
IMRC Information Management Resource Center Fuel Study North Syria
Transcript of IMRC - iMMAP

IMRCInformation Management Resource Center
Fuel StudyNorth Syria

ContentsAbbreviations 4
Introduction 5
Highlights 5
Background 7
Research Method and limitations 9
Oil Market System 10
Oil Market Environment 12
Oil Market Value Chain 14
Key Infrastructure, and Support Services 29
Impact of fuel price and availability on Farmers and food processing factories 32
Environmental Impact of local oil refinery 33
Conclusion and Recommendation 33

List of figuresFigure 1. Annual Oil & Gas Production in Syria 7
Figure 2. Main Security incidents at Fuel market system 13
Figure 3. Historical petroleum exploration in Syria. 15
Figure 4. Refinery Machine in Idleb Governorate 17
Figure 5. Challenges of Oil Refinery stations 18
Figure 6. Monthly Refined Quantity Per Refinery Station. 18
Figure 7. Volume of Sales at Refinery Stations. 18
Figure 8. Gross Profit at Processor Gate 19
Figure 9. Price of Oil Products 19
Figure 10. Traders Challenges at Fuel Market System 20
Figure 11. Oil-Wholesalers at Sub-District Level 21
Figure 12. Oil-Retailers at Sub-District Level 22
Figure 13. Oil-Wholesalers Volume of Sales 22
Figure 14. Oil-Retailers Volume of Sales 22
Figure 15. Type of Oil Products at Wholesalers Gate. 23
Figure 16. Type of Oil Products at Retailers Gate. 23
Figure 17. Price of Oil-Products at Wholesalers Gate 24
Figure 18. Price of Oil-Products at Retailers Gate 24
Figure 19. Oil-Traders Gross Profit in 2019 24
Figure 20. Individual Weekly Consumption of Oil Products 25
Figure 21. Consumer Challenges at Fuel Market System in Syria 26
Figure 22. Diesel Price at Consumer Gate 27
Figure 23. Gasoline Price at Consumer Gate 27
Figure 24. Home-Gas Price at Consumer Gate 28
Figure 25. Fuel Seasonal Calender in Syria 28
Figure 26. Wholesalers Restocking Challenges 30
Figure 27. Retailers Restocking Challenges 31
Figure 28. Daily Wages rate at Refinery Stations. 32
Figure 29. Refinery Station in Jarablus Sub-District. 33
List of mapsMap 1. Areas covered by the field research (June-July 2019) 10
Map 2. Oil Market System in NWS June-July 2019” 11
Map 3. Controlling actors over oil and gas resources in Syria 16

4 Fuel study in North Syria
Abbreviations BP British Petroleum
bpd Barrels per day
cbmd Cubic meters per day
EMMA Emergency Market Mapping Analysis tool
FGD Focus Group Discussions
FSL Food Security and Livelihood Cluster
GoS Government of Syria
HH Household
HTS Hayat Tahrir Al-Shaam
IDPs Internal Displaced People
IMRC Information Management Resource Center
ISIS Islamic State of Iraq and Syria
MW Megawatt
NES North East Syria
NMAGP North Middle Area Gas Plant
NWS North West Syria
sqm Square meter
SSG Syrian Salvation Government
TAF & NAO Turkish Armed Forces and National Army (opposition)
tcf trillion cubic feet
tmb thousand million barrels
USD United States Dollars

5 Fuel study in North Syria
IntroductioniMMAP Information Management Resource Center (IMRC) conducted a fuel market study focused on northwest Syria during the period of June-November 2019. The selection of fuel markets was carried out in close coordination with the Food Security and Livelihood Cluster (FSL) at the South Turkey Hub. This study aims to enhance the understanding of the situation of the fuel market system in NWS, identify the local dynamics of the fuel market, impact of the crisis on the fuel value chain market and pinpoint the main coping strategies that fuel market actors adopt as influenced by the crisis and its market environment.
Highlights Based on the secondary information and the collected primary data, this section presents main findings of this report as follow:
� The Syrian oil fields are concentrated in the Deir-ez-Zor governorate, near the Iraqi border in the eastern part of Syria, and Hassakeh governorate in the north-east Syria. There are also some oil fields located at Al Raqqa governorate in northeast Syria. According to the British Petroleum (BP) Statistical Review of World Energy 2019, Syria has oil reserves of 2.5 thousand million barrels (tmb), which corresponds to 0.1% of the world reserves. In addition, the country has 9.5 trillion cubic feet (tcf) of natural gas in 2018, corresponding to 0.1% of the total world reserves.1
� Syria’s oil-sector is in turmoil because of the ongoing civil conflict that began in the spring of 2011, with oil and natural gas production declining dramatically since then. According to the BP Statistical Review of World Energy 2019, the production of oil dramatically de-clined by 93 per cent (from 353,000 bpd2 /2011 to 24,000 bpd /2018). Likewise, the production of crude oil and condensate decreased by 95 per cent in 2018 as compared to 2011 (from 319,000 bpd/2011 to 16 bpd/2018). The Syrian crisis impact on the state’s natural gas liquids production was slightly lower, but still notable, with a 76 per cent decrease rate (from 34,000 bpd/2011 to 8,000 bpd/2018).
1 https://www.bp.com/content/dam/bp/business-sites/en/global/corporate/pdfs/energy-economics/statistical-review/bp-stats-review-2019-full-report.pdf
2 barrels per day.
3 https://www.syria-report.com/news/oil-gas-mining/hts-establishes-oil-monopoly-importing-europe
� Prior to the Syria crisis, oil market used to be entirely governed by the Government of Syria (GoS). Since the Syria crisis started in 2011, the domestic fuel market system has been dramatically changed and directly impacted by the governance approaches and rules of controlling actors (mainly the Islamic State of Iraq and Syria (ISIS) and Syria Democratic Forces (SDF)) who have/had control over the region of North East Syria (NES), where the majority of oil fields are located.
� Field data and the present study findings in-dicated that the exporting of crude oil that is under Kurdish (SDF) control to other territories is limited to two traders who have monopoly over the exporting of crude oil to other terri-tories. To be precise, one trader monopolizes the exporting of crude oil to areas controlled by Turkish Armed Forces and National Army (opposition) (TAF&NAO), and the second trad-er monopolizes the exporting of crude oil to GoS-controlled areas.
� Study participants reported that in 2018 a company called Watad Petroleum became a key player in the fuel market and rapidly gained a monopoly over the oil market in Idleb governorate. According to The Syria Report of April 2019: Watad was founded in Idleb in 2017, weeks after Hayat Tahrir Al-Shaam (HTS) established the Syrian Salvation Government (SSG), which granted it a monopoly on the import and distribution of oil products in all HTS areas3 . In the beginning of 2018, Watad started operating as a privately-owned oil supplier. Data indicated that both availability of oil products and access of oils products by households in Idleb governorate witnessed a notable improvement after the establishment of Watad company. Moreover, the literature review highlighted the lack of clarity about the ownership of Watad as a company and how it gained a monopoly of such a profitable and important fuel sector. However, Watad is perceived by the local community as an affiliation party to the SSG.

6 Fuel study in North Syria
� Oil felds in east and northeast Syria have been in a state of flux since the summer of 2012. The presence of several military actors has had a direct impact on the production and process-ing of oil products. During the reporting period, data showed that SDF controls most oil fields (around 70 percent of oil fields) which gives SDF the power over the crude oil, however, Watad has a monopoly over the imported oil from Turkey. Furthermore, some interviewed key informants reported that there was a lim-ited volume of gasoline being imported from Iraq via the Semalkih cross border.
� Military group’s influence on the oil market is well visualized and was reported by the inter-viewed fuel market actors as one of the main challenges they face. In addition to demanding fuel taxes at the border crossing and/or check points, military groups demand money from fuel market actors under different types of claims such as a shipping-protecting fee 4 known as “Tarfiq” in the field, and a land use fee by the refining stations.
� Diesel, Gasoline and Home-Gas are the main types of refined oil products that households use in their daily life activities. Study respon-dents reported that the individual weekly con-sumption of diesel deceased in 2019 as com-pared to 2018 by 23% (2.5 Litres/ 2019 and 3.25 Litres/ 2018). In contrast, individual weekly consumption of gasoline increased in 2019 compared to 2018 by 20% (6 Litres/ 2019 and 5 Litre/ 2018). The reported individual weekly consumption of home-gas was stable in 2018 and 2019 at 1.5 kg. In Menbij sub district (which is under SDF control) households, farmers and food processing factories reported that they have access to subsidized fuel: diesel for warming purposes and gasoline for automobile purposes.
4 Shipping-protectionfeeItcalledTarfiqinfieldanditisindicatingthatmilitarygroupaccompanytheshipmenttoprotectitfrombeingstolen.
5 https://www.sana.sy/?p=898529
� Explosions due to oil over-heating incidents and similar related incidents were reported across the assessed areas, due to the low quality of the refined oil products 5 and other cases of malfunctioning equipment/machines.
� The use of primitive methods in oil refining coupled with a lack of environment protec-tion measures across oil refining stations will likely proliferate to notable negative impact on human health, along with pollution of ag-ricultural lands and water resources near oil refinery stations.
� Human displacement due to the conflict con-tributed to an increase in the demand of fuel/oils in areas settled by Internally Displaced People (IDPs). However, the fuel demand did not reportedly increase at household (HH) level due to the dramatic decrease in the HH purchasing power. Hence, most of these HHs tended to substitute the refined-oil products, mainly diesel, with coal as a domestic energy source that can be utilized, for instance, for warming purposes.

7 Fuel study in North Syria
Background
6 https://www.imf.org/external/pubs/ft/scr/2010/cr1086.pdf
7 https://www.bp.com/content/dam/bp/business-sites/en/global/corporate/pdfs/energy-economics/statistical-review/bp-stats-review-2019-full-report.pdf
The ongoing conflict in Syria coupled with the subsequent political and economic sanctions that are imposed by the United States and the European Union has put the Syria’s oil-sector in turmoil, causing huge damage to the oil and natural gas pipelines and its industry across Syria, which has disrupted its regional oil value chain in the Middle East and North Africa region. This has negatively impacted the extractions, production, refining, development, and transport of the country’s oil and gas resources. The imports and exports oil products have also been affected by both the crisis and economic sanctions. This section presents a general background of oil-sector in Syria focusing on three main points: 1) Impact of the crisis on the oil-sector by looking at the production and exporting figures of oil products since 2011 to date. 2) The GoS coping strategy and action at oil-sector, and 3) Influence of Russia and Iran on the oil-sector.
Impact of Crisis on Oil-Sector (Production and Exporting)Although Syria is considered a small oil producer, its oil-sector used to have a significant contribution to its revenue with 26 per cent of the total revenue in 2018 (IMF, 2010) 6. According to the BP Statistical Review of World Energy 2019, oil and natural resources sector in Syria witnessed dramatic damage since the Syria crisis began in 2011. See “Figure 1: Annual Oil & Gas production in Syria”. The production of oil dramatically declined by 93 per cent (from 353,000 bpd/2011 to 24,000 bpd /2018). Likewise, the production of crude oil and condensate decreased by 95 per cent in 2018 as compared to 2011 (from 319,000 bpd/2011 to 16 bpd/2018). The impact on its natural gas liquids production was slightly lower with a 76 per cent decrease rate (from 34,000 bpd/2011 to 8,000 bpd/2018) 7.
Figure 1. Annual Oil & Gas Production in Syria
0
100
200
300
400
500
2008 2009 2010 2011 2012 2013 2014 2015 2016 2017 2018
Oil Production in thousands of barrels per day
Crude oil and condensate production in thousands of barrels per day
Natural gas liquids production in thousands of barrels per day*
Ann
ual p
rodu
ctio
n
Oil and Gas Production in Syria

8 Fuel study in North Syria
Subsequently, the country’s crude exports stopped. It is worth mentioning that Syria used to export more than 150,000 bpd of crude oil in 2010 8. Furthermore, according to the World Bank report, The Tall of War 2017 9. The capacity of Syria’s two state-owned refineries has fallen to half of its pre-conflict capacity (Energy Information Agency) The cause of this damage: the imposed economic sanctions.
GoS Coping Strategy to Meet its Oil-Needs US, European and Canadian-imposed economic sanctions has put huge pressure on GOS. Arabi 21 reported an ongoing oil-negotiation between SDF and GoS in April 201910 . Throughout these negotiations, there was an agreement to exchange oil products, in which GoS gets crude oil from SDF and in return GoS gives SDF refined oil products and access to electricity services. Furthermore, the exchange ratio between SDF and GoS was reported to be 75 barrels of refined oil products for 100 barrels of crude oil. The shipping was planned to take place from Al-Omar fields under SDF control to Al-Taim field under GoS control.
In line with the GoS effort towards reviving the oil-sector, a new gas well in Arak field located east of Palmyra started production on September 5, 2019. The estimated production of this gas well, named East Arak-2, was 175,000 cubic meters of gas per day (cbmd). East Arak-2 well feeds into the Arak Gas gathering plant which collects gas from five different wells. In mid-2017, the plant gathered 300,000 cbmd, which, with the help of East Arak-2 ,has increased to at least 475,000 cbmd. Meanwhile, the Syria Minister of Petroleum, announced in September 2019 that the North Middle Area Gas Plant (NMAGP), also known as Twinan, would operate at full capacity before the end of the year (2019). The plant was designed to process up to 3.2 million cbmd in addition to 2,000 barrels of oil per day of condensate. Of-note, the NMAGP, which is located west of the Raqqa governorate, was built by Russia’s Stroytransgaz at an initial cost of EUR 160 million. It was under the control of the Islamic State for several years, but was taken back by GoS forces in August 2017 11.
8 https://www.eia.gov/beta/international/analysis.php?iso=SYR
9 https://openknowledge.worldbank.org/bitstream/handle/10986/27541/The%20Toll%20of%20War.pdf shorturl.at/kns28
10 shorturl.at/kns28
11 https://www.syria-report.com/news/oil-gas-mining/syria-adds-gas-production-and-processing-capacity
12 https://www.syria-report.com/news/economy/reopening-key-border-crossing-iraq-delayed-again
With the aim to recover the GoS economy, on August 26, 2019, the Head of Syria Customs Department asked the governor of the Deir-ez-Zor governorate to prepare state institutions in the border area for the reopening of Syria’s Al-Boukamal border that crosses to the country of Iraqon September 1, 2019. Iraq is traditionally Syria’s main export partner outside crude oil. However, The Syria Report stated that on September 18, 2019, Al-Boukamal border crossing remained closed for various security and political reasons. The two other official crossings between the two countries are under the control, on the Syrian side, of the U.S.-supported Syrian Democratic Forces (Yarubieh, known as Al-Rabia on the Iraqi side) and the U.S. troops themselves (Al-Tanf, known as Al-Walid on the Iraqi side), and remain closed .12 However, the data collected under this study indicated that a small volume of gasoline was being imported by SDF from Iraq via an informal crossing point called Semalkih, which connects the Hassakeh governorate with the Iraqi Kurdistan region.

9 Fuel study in North Syria
Influence of Russia and Iran on the Oil-SectorChatham House reported in2019 that oil and gas are considered targeted sectors by Russia and Iran, who built up alliances with local businessmen in Syria and work towards having deep economic engagements 13. In that regard, Damascus still faces a number of challenges to revive the oil-sector. First, the USA and EU-imposed economic sanctions on Syria are not limited to the restrictions on oil sales, but also include foreign investments in its infrastructure and maintenance. Second, the majority of oil fields have been controlled by different actors, including ISIS, and were targeted and heavily damaged by international coalition forces airstrikes to end ISIS control of these oil fields as these militia groups were perceived to be funding themselves through these oil fields. Third, the extraction, refining and sales of oil produced in the east region of Syria were reported to be challenging. Fourth, the negotiations over the control of oil fields in northeast Syria, remain uncertain, even after the USA decision to withdraw from northeast Syria. However, in November2019, the US President insisted that the USA military presence in Syria was “only for the oil”, contradicting his own officials who have insisted that the remaining forces were there to fight ISIS14 .
In 2018, the Russian pavilion was among the largest, including 70 companies that were promoted widely in the media. In 2019, only 16 Russian companies attended the 61st Edition of the Damascus International Trade Fair and booked a stand of 200 square meters (sqm) compared to 500 in 2018. The fair did witness, however, a signing ceremony for three contracts in the oil and gas sector involving two Russian companies - the highlight of Russia’s involvement in the event. According to BBC News, Syria and Russia signed an energy co-operation agreement in 2018, giving Moscow exclusive rights to rebuild the Syrian oil and gas sector15 .
Iran’s participation in the Damascus International Trade Fair increased in 2019 as well, almost doubling to 60 companies in a 1,200 sqm stand - the largest in the fair. Among the contracts signed between Syrian and Iranian companies publicized by the local media : a deal to build a 5 Megawatt (MW) renewable energy power plant in the governorate of Homs, Syria16 .
Research Method and limitations This study centered on the mapping and analysis of the oil market system in Syria (primarily the northwest region),
13 https://www.chathamhouse.org/sites/default/files/publications/research/2019-03-08RussiaAndIranEconomicInfluenceInSyria.pdf
14 https://www.theguardian.com/us-news/2019/nov/13/donald-trump-syria-oil-us-troops-isis-turkey
15 https://www.bbc.com/news/50464561
16 https://www.syria-report.com/news/economy/summary-61st-edition-damascus-international-trade-fair
which entails three layers: the market environment, the market chain, and the key infrastructures, inputs and support services. The following two sub-sections present the research methodology and main research study limitations:
Research MethodsThe research gives a snapshot of the market system status and bottlenecks, through an exploratory approach of relevant actors and dynamics of the oil market in northwest Syria. This study was conducted using data available from scholarly journal research articles and the internet, including websites, social media networks, and online video-sharing platforms. This information was triangulated and supported through field visits to some of the points of sale and interviews with key informants in the oil market across northwest Syria. Emergency Market Mapping Analysis tool (EMMA) was used to map the oil market system. The sample size was not meant to be statistically representative, but study respondents were chosen according to their relevance to the bigger picture of the oil market system. This report summarizes the main findings of the conducted study.
Given the sensitive subject of this study, and to avoid exposing field enumerators to any security and safety risk, nine key informants were interviewed in February 2019 to enhance the designing of the data collection questionnaires. Inputs from these nine conducted key informants helped iMMAP select the locations, get an overview of current dynamic, and contextualize the data collection questionnaires.
iMMAP then selected seven sub-districts of three governorates; Al Bab, Azaz, Jarablus, and Menbij in Aleppo governorate, Idleb & Dana in Idleb governorate and Suran in Hama governorate. The presence of different territories, existence of markets, oil refinery stations, and oil-trading routes were the main reasons behind the location selection.
The field data collection then took place during June and July 2019. Forty-Two market actors were interviewed using face to face interviews, and Sixty-Two consumers participated in nine focus group discussions (FGDs). Market actors include refinery stations, traders (both wholesalers and retailers), service providers (mainly maintenance services and drivers) and key informants (mainly members of the local councils of the assessed areas, and employees at Watad). Furthermore, consumers who participated in FGDs were mainly households, farmers, and food processors (mainly dairy and olive oil processors).

10 Fuel study in North Syria
Map 1. Areas covered by the field research (June-July 2019)
Al Bab
A'zaz
Menbij
Jarablus
Suran
Idleb
Dana Aleppo
Homs
Hama
Lattakia
Idleb
Tartous
Ar-Raqqa
Turkey
۰ ۲٥ ٥۰۱۲.٥ Km
Market Actors
Retailers
Wholesalers
Oil_Refinery_Stations
Key_Informants
Service_Providers
Consumer_FGDs
Governorate
District
LimitationsGiven the sensitivity of the addressed subject under this study and limited access to information, the research team highlighted the main limitations of this study as follows: 1) Lack of statistics on oil production volume and trade, due to weak local governance structures and extension services, especially in Opposition-controlled areas. At the national level, statistics were also barely available and could not be considered as representative;2) Given the security situation, participants at field research were hesitant to give detailed answers especially when it comes to impact and role of influential and controlling actors in the oil market;3) Shifting and mercurial conflict dynamics in northwest Syria that had a direct effect on the oil market system.
Given the above-mentioned limitations, it is important to note that all field-reported data took place during June and July 2019, while the literature reviews were conducted till late November 2019.
Oil Market System Based on the field collected data, iMMAP mapped the oil market system using the Emergency Market Mapping Analysis tool (EMMA). Below is the market system map: “Map 2: Oil Market System in NWS June-July 2019” This represents the market system map for oil in the functioning areas of coverage of this study in June-July 2019. This market system map has three layers:
! The central layer illustrates the oil market chain: the chain of actors who are involved in producing, processing, trading and consuming the commodity (as explained in the Oil Market Chain sub-section).
! The top layer represents the oil market environment or context: all regulations, rules, norms and factors that influence the way the actors interact within the oil market chain (as explained in the Oil Market Environment sub-section).
! The bottom layer shows key inputs, support services and infrastructures that support a good functioning of the oil market chain (as explained in the Key Infrastructure sub-section, and support services).

Fuel study in North Syria11
Buying Price of Crude oil atProcessor Gate 2018) 15K-45K SYP/Barrel2019) 20K-35K SYP/Barrel
The market chain:market actors & their linkages
Amount of monthly re�nedoil products per processor. 2018) 150_2000 Barrel2019) 200-700 Barrel
Traders Monthly volumeof Sales:Wholesalers 2018) 30-648 Barrel2019) 36-750 BarrelRetailers 2018) 4-114 Barrel2019) 6-86 Barrel
HH weekly Consumption 2011 2018 2019Diesel 6-54 L 12-60 L 11-30 LGasoline 6-90 L 7-72 L 6-71 LHome Gas 5-15 KG 3-15 KG 5-15 KG
Price of Imported Oil Products atConsumer Gate 2018 2019Diesel 350-400 SYP/L 350-500 SYP/LGasoline 275-500 SYP/L 440-575 SYP/L
Price of Domestic Oil Products atConsumer Gate 2018 2019Diesel 175-300 SYP/L 170-375 SYP/LSubsidized 50-52 SYP/L 50-52 SYP/L-DieselGasoline 200-450 SYP/L 250-550 SYP/L
Price of home gas at Consumer Gate 2018
3,500-15,000 SYP/10KG 2019
2,800-5,800 SYP/10KG
FINANCIAL SERVICES
The Market Environment
Key Infrastructureinputs, market-support services
Institutions, rules, norms & trendsOil Market System North Syria June-July 2019
Currency FluctuationRules and Regulation
Access to SubsidizedOil Products
Low Purchasing Power
Political Situation Trade Routes Court SystemGovernmental Support Role Quality Control System
Critical IssueMajor Disruption Partial Disruption
Imported Re�ned-OilProducts (Turkey)
via Watad Company
Locally ExtractedCrude-Oil
Locally ImportedRe�ned-Oil
Products (GOS)
SDF-Af�liatedTraders
Sadcope-Re�neryStations
Sadcope
GoS
Truck Drivers
SDF-AuthorizedCommittee
Wholesalers FoodFactories
FoodFactories
Farmers
Households
Farmers-at SDF Areas
HH-at SDF Areas
Re�nery Stations
Licensed Stations
Retailers/Fuel Stations
Community-Based Shops
Non-licensed Traders
Imported Re�ned-OilProducts (Iraq)
Subsidized Oil ProductsRe�ned Oil Products Crude Oil
Us and EuropeSanctions
Control overCrude Oil
Trading AcrossLines
Increase in # ofRe�nery Stations
Security & SafetyIncident
Secured WorkEnvironment
EnvironmentImpact
Low Quality of Re�nedOil Products
Taxation
Work-license
Quality of Crude oil Credit Based TradeFinancial ServicesAvailability of Support Services Inputs
Expensive Crude Oil Re�nery Inputs & Machines Limited Experts Transportation StorageRoad InfrastructureCapacity to Produce Home-gas
Map 2. Oil Market System in NWS June-July 2019”

12 Fuel study in North Syria
Oil Market Environment The needs of refined oil products, limited resources of the market actors across the fuel supply chain (extractors, oil refinery process and trading), economic sanctions on the Syrian fuel, major change of the oil management sector (from governmental to non-governmental actors), and low purchasing power of local community members shaped the main oil-market environment aspects. The following sub-sections present the main aspects of economic, legal, and security environments of the oil market system in Syria. In addition, a sub-section explaining the quality control system of the oil market was added.
Economic EnvironmentThe supply of oil products, both crude and refined, have been negatively affected by the crisis impact that include: 1) damage of infrastructure, 2) limited capacity of fuel market actors, 3) deterioration in the security situation, and 4) the state of flux experienced by oil fields in east and northeast Syria since the summer of 2012.
On the other hand, demand of refined-oil products has been affected by 1) high prices of refined oil products, 2) low purchasing power of local households, and 3) security situation across the market environment as well. However, sub-districts of the study area that host high number of IDPs recorded an increase in the demand of refined oil products in line with the increase the population increase.
Likewise, study respondents reported that prices of oil products have been affected by 1) local currency deterioration due to monetary inflation, 2) bribing and/or taxation of oil products transporters on checkpoints coupled with 3) high number of checkpoints across lines of different territories, 4) high value of oil products importing tax, and 5) damage of oil market infrastructure.
Collected data recorded a correlation between the power of traders and type of controlling actors at the assessed: 1) Areas controlled by SDF: oil market is fully controlled and governed by the SDF via Sadcope company. Traders under SDF areas have limited power, which is linked with the type of license they obtain from SDF. The main reported type of license is the sale of refined-oil products at SDF-controlled areas whereas selling crude oil to outside SDF-controlled areas is limited to SDF-affiliated traders. 2) Areas controlled by Turkish Armed Forces and National Army (opposition): oil-markets are competitive where there are no restrictions on the entry of new traders or processors, oil market actors have perfect knowledge of the existing markets, and there was a high number of traders and consumers. 3) Areas controlled by HTS, market actors have limited power, HTS has full control over the prices and quality of the oil products.
However, with that in mind, it is reported that market entry restrictions at HTS controlled areas is much easier in comparison with the market entry barriers at areas under SDF control. It is worth reporting that data showed a monopoly at the importing of domestic crude oil across different territories inside Syria, like-wise for the importing of refined-oil products from Turkey.
Legal and Security EnvironmentThe fragile status of the local governance structure contributed to the increase in the number of private oil refinery stations and traders, compared to the number of oil processors and traders before the crisis. This was mainly due to the fact that oil market entry barriers were reported to be easy and limited to the financial capacity since 2012. The regulation has evolved at areas under SDF and HTS control, such as work license which was brought up to be one of the main market entry barriers as well as the financial capacity. However, illegal smuggling activities of refined oil products (mainly gasoline) from GoS controlled areas to SDF-held territories were reported by local field actors. In cases of dispute, oil market actors reported that they do not prefer to approach the existing judiciary courts. They instead try to solve any dispute through local key oil controlling actors (well-known traders/processors). Study respondents reported a deterioration in the judiciary legal system across the assessed study areas. Furthermore, the collected data indicated that there was no specific judiciary legal court for the oil actors in the assessed areas.

13 Fuel study in North Syria
Unstable and non-legalized tax laws were reported as one of the main challenges among the oil market actors. Interviewed oil market actors reported that they put an effort to push and advocate towards reducing the taxation value and enhancing the tax regulation. For example, in Jarablus, the taxations were reported to be based on the oil production amount of the refining stations which used to reach 75,000 SYP (Syrian Pounds) per month. Advocacy ventures and negotiations with local actors, led by market actors (mainly refinery stations owners), helped reduce the taxation value to a fixed-amount of 25,000 SYP per month.
Key informants reported that local councils enact some rules that aim to organize and enhance operations within the oil-sector to overcome the lack of proper governance structures in place. A’zaz local council in Aleppo governorate was reportedly to be the most active local council in introducing new rules and regulations to the oil-sector. Here are some of the implemented rules by A’zaz local council: 1) Issuing truck passing permission to organize the shipping from A’zaz towards Idleb governorate and Aleppo suburb;2) Organizing an area in A’zaz where oil trucks could stay there till they are supplied with fuel. The waiting fee is 20 USD for each truck;3) Creating a record for each truck in A’zaz; this record saves and document the associated trucks’ information like time spent at Azaz waiting areas; 4) The A’zaz local authority’s work towards organizing the places of oil refining-stations to be far from populated areas.
Similarly, and prior to the GoS takeover of Murek in August 2019, the Murek local council in Hama governorate planned a market place for trading fuel products. Also, at Al Bab sub-district, the local council there dug some wells to obtain the needed water for the oil refining process.
Interviewed key informants reported that the instability of the political and security situation, especially the airstrikes and bombings, forms the main attributes and aspects of the security environment at oil-sector in Syria. Although, the manifestations of Conflict De-escalation had a positive impact on the demand of fuel at the areas that witnessed an improvement in the security situation. In contrast, the offensive escalation in Idleb had a negative impact on the volume of work in A’zaz city. Refinery stations owners and traders reported that there were no security measurements in place that help in avoiding the associated security risk with their work.
Main types of reported security incidents at the oil-sector were: oil infrastructures being targeted (mainly oil refinery stations), burning/explosions at oil refinery stations due to lack of refinery experts, oil truck explosions due to either the low quality of refined oil products or damaged road infrastructure, different reported health incidents, closure of trading routes due to offensive escalation, and theft incidents during the transporting of oil products.
Figure 2. Main Security incidents at Fuel market system
Oil infrastructures being targeted
Health incidents
Closure of trading routes
Oil truck explosions
Burning at oil refinery stations
Theft incidents
14 Fuel study in North Syria
Furthermore, study respondents expressed their thoughts and expectations for the situation as follows:
! The security situation will likely improve at the areas that are controlled by the Turkish Armed Forces and National Army (opposition), which could enable and empower the local governance structures and have positive impact on the work environment of the oil-sector (at both the oil refinery and trading stages). On the other hand, this might make the oil market entry barrier much harder with the potential of a much stricter work license and quality control system and an adherence to new rules and regulations.
! Current controlling actors of the oil market (SDF, TAF&NAO, HTS) put huge efforts towards legalizing and organizing the oil market, which was supported by local market actors. Therefore, the oil market actors expect to witness more regulations on the oil and its products taxation side.
! More political agreements relevant to the oil-sector are expected to take place between different oil market controlling actors (SDF, TAF&NAO, HTS, and GoS).
! The offensive escalation in Idleb, northern Hama and NES will likely not cease soon.
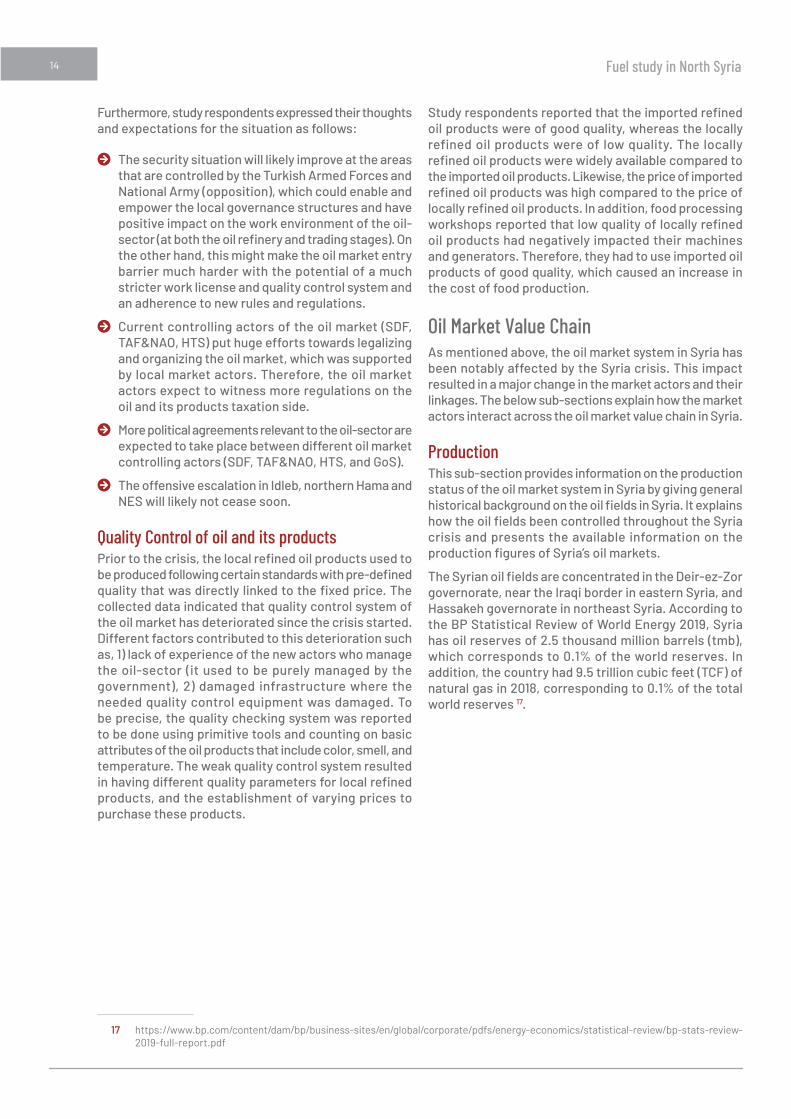
Quality Control of oil and its productsPrior to the crisis, the local refined oil products used to be produced following certain standards with pre-defined quality that was directly linked to the fixed price. The collected data indicated that quality control system of the oil market has deteriorated since the crisis started. Different factors contributed to this deterioration such as, 1) lack of experience of the new actors who manage the oil-sector (it used to be purely managed by the government), 2) damaged infrastructure where the needed quality control equipment was damaged. To be precise, the quality checking system was reported to be done using primitive tools and counting on basic attributes of the oil products that include color, smell, and temperature. The weak quality control system resulted in having different quality parameters for local refined products, and the establishment of varying prices to purchase these products.
17 https://www.bp.com/content/dam/bp/business-sites/en/global/corporate/pdfs/energy-economics/statistical-review/bp-stats-review-2019-full-report.pdf
Study respondents reported that the imported refined oil products were of good quality, whereas the locally refined oil products were of low quality. The locally refined oil products were widely available compared to the imported oil products. Likewise, the price of imported refined oil products was high compared to the price of locally refined oil products. In addition, food processing workshops reported that low quality of locally refined oil products had negatively impacted their machines and generators. Therefore, they had to use imported oil products of good quality, which caused an increase in the cost of food production.
Oil Market Value ChainAs mentioned above, the oil market system in Syria has been notably affected by the Syria crisis. This impact resulted in a major change in the market actors and their linkages. The below sub-sections explain how the market actors interact across the oil market value chain in Syria.
ProductionThis sub-section provides information on the production status of the oil market system in Syria by giving general historical background on the oil fields in Syria. It explains how the oil fields been controlled throughout the Syria crisis and presents the available information on the production figures of Syria’s oil markets.
The Syrian oil fields are concentrated in the Deir-ez-Zor governorate, near the Iraqi border in eastern Syria, and Hassakeh governorate in northeast Syria. According to the BP Statistical Review of World Energy 2019, Syria has oil reserves of 2.5 thousand million barrels (tmb), which corresponds to 0.1% of the world reserves. In addition, the country had 9.5 trillion cubic feet (TCF) of natural gas in 2018, corresponding to 0.1% of the total world reserves 17.

15 Fuel study in North Syria
Historically, the petroleum exploration in Syria began in 1934 in the northeastern part of the country. The first exploration well was drilled in 1939. The first three discoveries of oil fields were in the Hassakeh governorate. The first major discovery, the Karatchok Field, was made in 1956, followed by a second discovery: The Suwaidiyah oil field in 1959, and subsequently in 1962: The Rumailan oil field. However, Syria did not emerge as an oil producer until May 1968, when the first barrel of oil arrived at Tartus port. In 1975, the Syrian government began to award oil production-sharing contracts to foreign operators. In mid-1980s significant discoveries have been made in the in the southeastern part of the country 18. See Figure 3: Historical petroleum exploration in Syria.
Hassakeh governorate, which is dominated by the Kurdish population, is the richest area in Syria in terms of oil resources. The Rumailan, Souedieh, and Karatchuk oil fields in the governorate produce a heavy grade of oil and gas. In addition, there are 1322 oil wells and 25 gas wells across the Hassakeh governorate 19. Furthermore, interviewed workers employed at oil refinery stations
Figure 3. Historical petroleum exploration in Syria.
1934Petroleum exploration in Syria began northeastern Syria
1939First Exploration well has been drilled
1956 The first major discovery, the Karatchok Field
1962A second discovery of the Suwaidiyah Field
1968Syria emerged as an oil producer, when the first barrel of oil arrived at Tartus port
1975 The Syrian government began to award production-sharing contracts to foreign operators
1980In mid1980-s the significant discoveries have been made in the southeastern part of the country
18 Ahmad Aldahik. “Crude Oil Families in the Euphrates Graben Petroleum System.” Ph.D. Thesis, TechnicalUniversityofBerlin,Berlin,Germany,2010.https://d-nb.info/1011892189/34
19 (Hussein Almohamad, and Andreas Dittmann, 2016). https://www.mdpi.com/2076-0760/5/2/20/htm
20 https://www.mdpi.com/2076-0760/5/2/20
21 https://www.reuters.com/article/us-mideast-crisis-syria-oilfield/u-s-backed-militias-seize-key-oil-field-in-east-syria-sdf-idUSKBN1CR07E?feedType=RSS&feedName=topNews&utm_source=feedburner&utm_medium=feed&utm_campaign=Feed%3A+reuters%2FtopNews+%28News+%2F+US+%2F+Top+News%29
22 https://ig.ft.com/sites/2015/isis-oil/
23 https://www.bbc.com/news/50464561
reported that the oil wells in Hassakeh governorate has the best quality as compared with other oil wells. However, the oil wells in Deir-ez-Zor governorate were reported to be of low quality.
Oil fields in east and northeast Syria have been in a state of flux since the summer of 2012. The presence of several military actors had direct impact on the production and processing of oil products. In 2015, Syrian oil and gas fields were controlled by three military forces: ISIS (80%), Kurdish forces (12%), and the government of Syria (limited to 8%)20 .
As reported by Reuters in October 2017, the SDF was able to seize Syria’s largest oil field in the northeast from ISIS21. In addition, the Syrian army and its allies recaptured the “T2” oil pumping station in eastern Syria from ISIS. The station was said to be a launch pad for the army to advance toward Abu Kamal, ISIS’s last major stronghold in Syria. This put most oil and gas recourses in Syria under SDF control, increasing the percentage of oil and gas resources the Government of Syria has control over.
Field-interviewed key informants reported that it was difficult to determine a definitive oil production figure for non-state controlled areas. However, most of oil fields have been negatively impacted by the on-going crisis and the controlled actors (ISIS & SDF) did/does not have the technology or equipment needed to maintain them. The literature review indicated that ISIS used to earn about 1.5 million United States Dollars (USD) a day from selling crude oil during the time ISIS controlled 80% of the oil fields 22. This means that the estimated production of an oil field controlled by non-state groups is around 46,154 bpd (based on the assumption that 32 USD is the price of one barrel of crude oil).
Citing a senior fellow at the Middle East Institute, BBC News 23 reported in an article published in November 2019 that “SDF and allied tribes in eastern Syria are currently in control of approximately 70% of Syria’s national oil resources and a number of valuable gas facilities”. The Government of Syria is in control of most gas resources as of November2019. Map 3, “Controlling actors over oil and gas resources in Syria”, published by BBC News, illustrates the main actors that control the oil and gas resources in Syria as of November2019.

16 Fuel study in North Syria
Map 3. Controlling actors over oil and gas resources in Syria

17 Fuel study in North Syria
Processing This sub-section presents an overview of the oil refinery stages across the oil market system in NWS looking at the evolution of oil refinery station work since the crisis started, the main challenges that were reported by oil refinery stations and some figures relevant to the oil refinery processes such as oil production quantity, the number of actors, and volume of oil sales.
Prior to the Syria crisis, refinery process of crude oil used to be carried out by GoS’s two oil refinery stations: Baniyas and Homs. During the reporting period, study respondents reported that a notable number of oil refinery stations were established in both the northwest and northeast regions of Syria under different territories. Al Bab and Jarablus sub-districts have been reported to host most oil refinery stations in northwest Syria.
The critical needs of refined oil products coupled with the fact that there was no refinery station in the northwest region were reported as main triggers that motivate private investors to launch and establish new oil refinery stations in northwest Syria to meet the needs of the local population. Moreover, high demand, shortage in supply due to low number of oil refinery actors, limited legal entry barriers and high profit margins were quoted by refinery actors as main reasons for their ability to sustain their business in northwest Syria since the Syria crisis began.
Among the seven assessed oil refinery stations across the six sub-districts (Suran-Hama, Dana, Al Bab, Jarablus, A’zaz and Menbij): Al Bab sub district ranked first with the highest number of oil refinery actors/ processors (more than 100 actors), followed by Jarablus sub-district (51-100 actors), then Dana sub-district (11-50 actors). Suran- Hama and A’zaz sub-districts recorded the lowest number of oil refinery actors (1-10 actors). Furthermore, study respondents in Menbij reported that there was not a single private oil refinery station in areas under SDF control. All the crude oil there was being processed through SDF oil refinery stations managed by Sadcope and are located in northeast Syria, primarily at Qamishli.
Figure 4. Refinery Machine in Idleb Governorate
Processors, as study respondents reported, operated oil refinery stations, were small scale at first, using primitive tools, machines and methods. As oil refinery sector were new in northwest Syria, oil refinery stations’ owners reported that they counted on experts formerly employed at government-owned oil refinery stations. In terms of the oil refinery methods used, processors reported that they heat up the crude oil to get the desired refined oil products (mainly diesel and gasoline) until it hits the required temperature. Heating based machines are broadly used across most oil refinery stations in NW Syria, however, there were some oil refinery stations that reported the usage of electric machines for heating purposes.
The initial goal of oil refinery stations was to produce the refined oil products to meet the local needs, however, study respondents reported that refinery stations have evolved over time (since the crisis started), paying more attention to quality. This is in line with the feedback from oil products’ consumers during conducted FGDs, who reported that the quality of locally refined oil products showed an improvement in 2019 compared to 2018. Moreover, interviewed workers at oil refinery stations reported that produced oil-waste across oil refinery stations decreased in 2019 (between 8 % and 25 %) compared to 2018 (between 10 % and 35 %). Despite this encouraging development, only 2 out of the 7 assessed refinery stations reported that they managed to use the oil-waste. The main reported usage of oil-waste was its sale to Asphalt companies.
The main reported challenges by interviewed oil refinery stations owners were: 1) difficulties in having access to crude oil of good quality, 2) high cost of oil processing/refining, 3) lack of needed expertise and infrastructure, 4) dangerous working environment; study respondents reported different types of incidents that include poisoning, burning, explosive and bombing, 5) instability of taxation regulations (oil tax is collected by different actors and has varied in value). See below Figure 5: Challenges of Oil Refinery stations

18 Fuel study in North Syria
Figure 5. Challenges of Oil Refinery stations
High cost of oil refining
Lack of needed expertise and infrastructure
Dangerous working environment
Low quality of crude oil
Instability of taxation regulations
The median of monthly reported refined quantity of crude oil per refinery station across the assessed sub-districts was stable in 2018 and 2019 with 400 barrels (each barrel equals 220 litre). Still the refinery capacity of the assessed refinery stations was different, the reported range of monthly refined quantity of crude oil per refinery station in 2019 was between 150-2000 barrels whereas in 2018 the number was between 200-700 barrels. See “Figure 6 Monthly Refined Quantity Per Refinery Station”.
Figure 6. Monthly Refined Quantity Per Refinery Station.
Monthly Refined Quantityin Barrel 2019
Monthly Refined Quantityin Barrel 2018
Respondant 1
Respondant2
Respondant 3
Respondant 4
Respondant 5
Respondant 6
Respondant 7
Monthly refined quantity of crude oil per processor
2,000
1,200
1,000700
400400
200200
200
200150
300
600
500
The monthly reported volume of sale by the assessed oil refinery stations was stable in 2018 and 2019 with 370 barrels. However, the volume of sale recorded different values at each of the assessed refinery stations. Monthly volume of sale per pro refinery station ranged between 120-1800 barrels in 2019 and between 130-650 barrels in 2018. See” Figure 7 Volume of Sale at Refinery station”.
Figure 7. Volume of Sales at Refinery Stations.
Monthly Refined Quantityin Barrel 2019
Monthly Refined Quantityin Barrel 2018
Respondant 1
Respondant2
Respondant 3
Respondant 4
Respondant 5
Respondant 6
Respondant 7
Volume of Sale at Processor Gate
1,800
1,000
900650
370370
200350
130
170120
130
600
500
19 Fuel study in North Syria
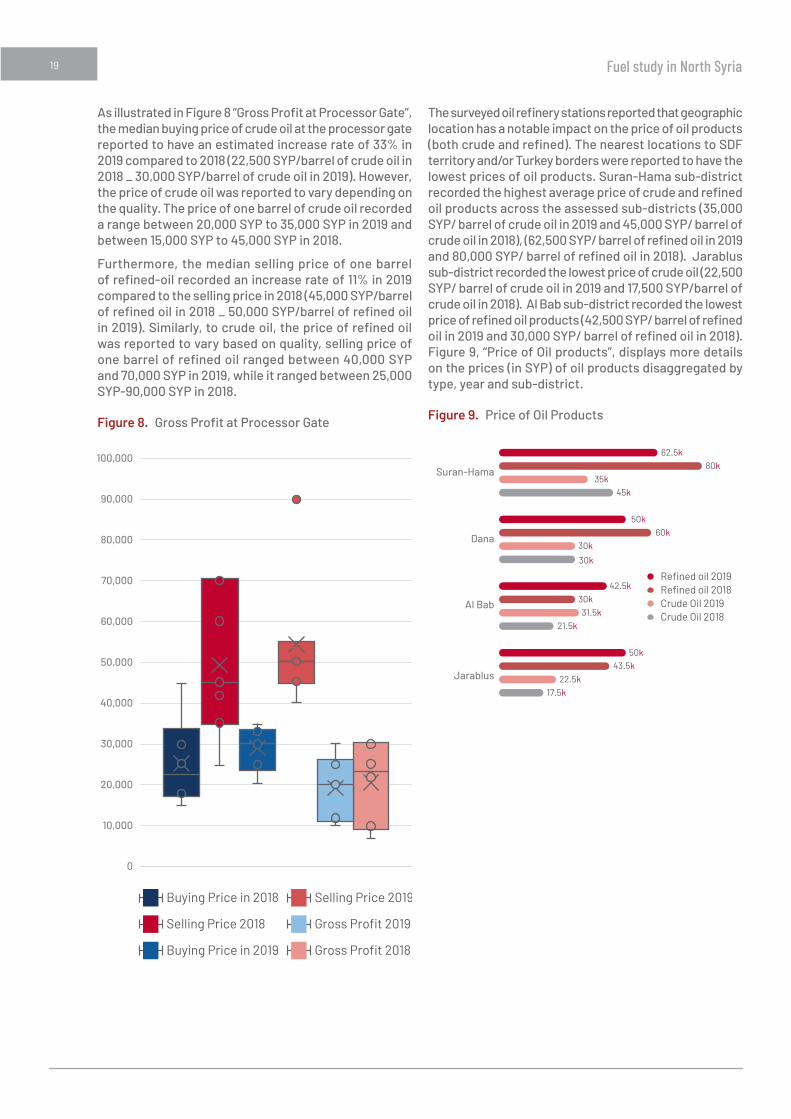
As illustrated in Figure 8 “Gross Profit at Processor Gate”, the median buying price of crude oil at the processor gate reported to have an estimated increase rate of 33% in 2019 compared to 2018 (22,500 SYP/barrel of crude oil in 2018 _ 30,000 SYP/barrel of crude oil in 2019). However, the price of crude oil was reported to vary depending on the quality. The price of one barrel of crude oil recorded a range between 20,000 SYP to 35,000 SYP in 2019 and between 15,000 SYP to 45,000 SYP in 2018.
Furthermore, the median selling price of one barrel of refined-oil recorded an increase rate of 11% in 2019 compared to the selling price in 2018 (45,000 SYP/barrel of refined oil in 2018 _ 50,000 SYP/barrel of refined oil in 2019). Similarly, to crude oil, the price of refined oil was reported to vary based on quality, selling price of one barrel of refined oil ranged between 40,000 SYP and 70,000 SYP in 2019, while it ranged between 25,000 SYP-90,000 SYP in 2018.
Figure 8. Gross Profit at Processor Gate
0
10,000
20,000
30,000
40,000
50,000
60,000
70,000
80,000
90,000
100,000
Buying Price in 2018
Buying Price in 2019
Selling Price 2018
Selling Price 2019
Gross Profit 2019
Gross Profit 2018
Gross Profit of one oil barrel in SYPat Processor Gate
The surveyed oil refinery stations reported that geographic location has a notable impact on the price of oil products (both crude and refined). The nearest locations to SDF territory and/or Turkey borders were reported to have the lowest prices of oil products. Suran-Hama sub-district recorded the highest average price of crude and refined oil products across the assessed sub-districts (35,000 SYP/ barrel of crude oil in 2019 and 45,000 SYP/ barrel of crude oil in 2018), (62,500 SYP/ barrel of refined oil in 2019 and 80,000 SYP/ barrel of refined oil in 2018). Jarablus sub-district recorded the lowest price of crude oil (22,500 SYP/ barrel of crude oil in 2019 and 17,500 SYP/barrel of crude oil in 2018). Al Bab sub-district recorded the lowest price of refined oil products (42,500 SYP/ barrel of refined oil in 2019 and 30,000 SYP/ barrel of refined oil in 2018). Figure 9, “Price of Oil products”, displays more details on the prices (in SYP) of oil products disaggregated by type, year and sub-district.
Figure 9. Price of Oil Products
Refined oil 2018Crude Oil 2019Crude Oil 2018
Refined oil 2019
Suran-Hama
Dana
Al Bab
Jarablus
Price of One Barrel of Oil Prodcuts Disaggregatedby Type, Year and Sub-District
62.5k80k
35k45k
50k60k
30k
30k
42.5k30k31.5k
21.5k
50k43.5k
22.5k17.5k

20 Fuel study in North Syria
Trading Unlike the situation during the oil refinery phase, the trading of refined oil products was reportedly driven by a number of active private traders have before the Syria crisis. More so, the trading of refined oil products used to be strictly governed and monitored by the Government of Syria. Since 2012, the legal market entry barriers to the oil-sector were waned at the opposition held areas due to the instability of the situation there, having different controlling actors in place, and immaturity of the local governance structure. These enabled increase in competitiveness within the oil-sector and opened the door to private traders, who have strong networks with the prevailing oil controlling actors and have the needed financial capacity to enter the oil-sector. However, study respondents reported that regulations of the oil-sector have evolved over time mainly in terms of licenses and taxes.
Twenty-two percent (5 out of 23) of the interviewed traders reported that they were forced to pause their business activities due to human displacement and the deterioration of the security status-quo (mainly because of bombings and airstrikes). This negatively impacted on the number of customers, business networks, and business assets of oil traders. However, some of the traders reported that they managed to restart their oil business.
Opening the international road (Aleppo - Damascus) reportedly increased the demand on oil products in the areas that had received IDPs and an improvement in the security situation enabled and motivated oil traders to resume their business activities.
The following ten challenges were reported by the interviewed oil traders as the main challenges that they face in oil trading activities, hampering them from expanding their work: 1) High cost of taxation on oil business, 2) Difficulties in obtaining the needed work permission, 3) High number of checkpoints, 4) Limited warehousing/storage capacity, 5) Poor road infrastructure, 6) Limited financial capacity, 7) Fragile security situation, 8) Theft incidents, 9) Closure of oil trade routes, and 10) Presence of powerful oil traders who monopolize the transporting of oil products across lines of territories and across borders. Of-note, the interviewed wholesalers of oil products stated that they, grouped with other traders, discuss prices of refined-oil products and communicate with armed groups and local authorities to discuss the associated challenges of doing business in the oil market system. See below figure 10: Traders Challenges at Fuel Market System.
Figure 10. Traders Challenges at Fuel Market System
Limited financial capacity
High number of checkpoints
Limited warehousing/storage capacity
High cost of taxation
Poor road infrastructure
Theft incidentsClosure of oil trade routes
Difficulties in obtaining the work permission
Fragile security situation
Monopolization of the transportation of oil products.

21 Fuel study in North Syria
Trading activities in the oil-sector are reported to be directly affected by the status of oil trade routes, agreements between the oil controlling actors (SDF, HTS, a non-state group, and GoS), changing of controlling actors over the oil fields, quality of both crude and refined oil products, security situation (mainly shelling, bombing, and fighting), exchange rate (USD/SYP), and multi-layer taxation.
The type of oil (crude vs. refined), coupled with different approaches and regulations imposed by local authorities to control the oil market, have significantly contributed to shaping the aspects of oil trading activities as discussed in the following paragraphs:
! SDF-Controlled Areas; the oil trading activities of both crude and refined oil products were reported to be strictly managed by SDF via Sadcope company. Traders reported that SDF controlled-areas have the strictest rules and regulations across the non-state territories where SDF has full control over the oil trading activities. In this regard, SDF established strict regulations to govern the trading activities at oil-sector such as issuing oil trading licenses and specifying a quota per trader and consumers. Furthermore, it has been reported that SDF collects a high penalty fee from unlicensed actors (500 SYP for each litre).
! The refined oil products under SDF territory are traded by licensed traders (both wholesalers and retailers), who obtain their quota of refined oil products from Sadcope, which represents SDF. Data indicated that there are small number of active, unlicensed traders. Those traders reported that they buy the refined oil products illegally from truck drivers, who ship the refined oil products from SDF-oil refinery stations to either local councils or to licensed traders. SDF prohibits the exporting of refined oil products to areas outside of their control. The crude oil is being exported across territory lines through two traders. One trader monopolizes the exporting of crude oil to TAF&NAO-controlled areas, and the second trader monopolizes the exporting of crude oil to GoS-controlled areas. It is worth mentioning that the data indicated an agreement between SDF and GoS in the exchanging of oil products, where SDF would provide crude oil to GoS and in return GoS provides refined oil products to SDF. Moreover, study respondents reported that SDF imports small amounts of refined oil products from Iraq through the Semalkih crossing border.
! HTS-Controlled Areas: oil traders in HTS controlled territory reported that they have more freedom in running their oil trading activities compared to traders in SDF-controlled areas. Their main obligation under HTS-controlled territory is to adhere to the prices of oil products set by HTS. Wholesalers reported that they buy the crude oil directly from SDF-affiliated traders, and buy the domestic refined oil products from oil refinery stations. Trading activities of oil products have been largely controlled by Watad since its establishment in early 2018. Moreover, Watad monopolizes the importing of refined oil products from Turkey. Wholesalers reported that they buy the imported refined oil products from Watad. Retailers reported that they buy the refined oil products from Watad, wholesalers and refinery stations.
! TAF&NAO-Controlled Areas: traders in these areas reportedly enjoy full freedom in terms of working in the oil-sector and that there were no formal rules set by local authorities. Like the HTS territory, wholesalers at TAF&NAO-controlled areas get the crude oil from Sadcope and the imported refined oil products from Watad. Wholesalers reported that their main customer for crude oil is the refinery station and that retailers are their main customer for domestic and imported refined oil products. In addition, a notable percentage of retailers reported that they obtain domestic refined oil products directly from local refinery stations.
Across the assessed sub-district, Al Bab sub-district recorded the highest number of wholesalers (100/2019 and 50/2018). This was followed by A’zaz sub-district (33 in 2019 and 36/2018). Menbij sub-district reported the lowest number of wholesalers (2/2019 and 3/2018). Study respondents in Menbij reported that number of traders was very low due to the needed licenses and inability of traders at SDF areas to adhere to the regulations set by SDF. Figure 11,” Oil-Wholesalers at sub-District Level “, shows the reported number of oil wholesalers per sub district in 2019 and 2018.
Figure 11. Oil-Wholesalers at Sub-District Level
Numbr of Wholesalers 2019
Numbr of Wholesalers 2018
Al Bab
Azaz
Dana
Suran - Hama
Menbij
Oil- Wholesalers at sub District level
100
33
1010
56
23
50
36
22 Fuel study in North Syria
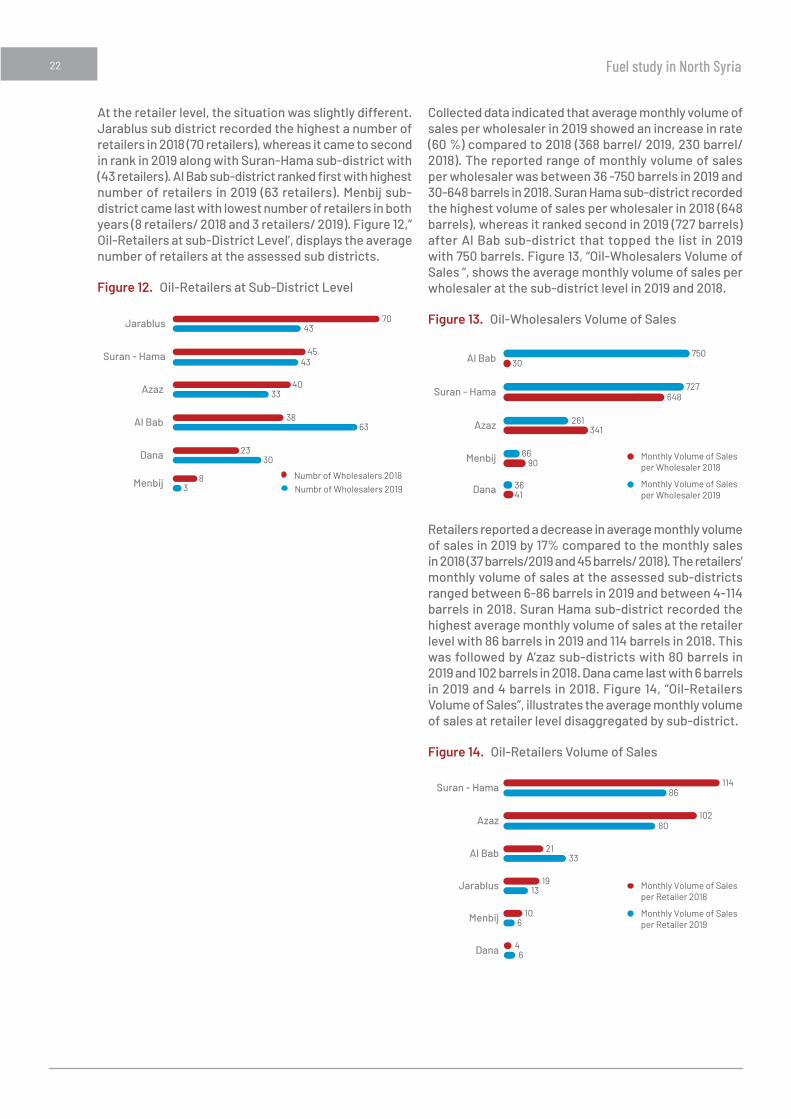
At the retailer level, the situation was slightly different. Jarablus sub district recorded the highest a number of retailers in 2018 (70 retailers), whereas it came to second in rank in 2019 along with Suran-Hama sub-district with (43 retailers). Al Bab sub-district ranked first with highest number of retailers in 2019 (63 retailers). Menbij sub-district came last with lowest number of retailers in both years (8 retailers/ 2018 and 3 retailers/ 2019). Figure 12,” Oil-Retailers at sub-District Level’, displays the average number of retailers at the assessed sub districts.
Figure 12. Oil-Retailers at Sub-District Level
Numbr of Wholesalers 2019Numbr of Wholesalers 2018
Azaz
Jarablus
Al Bab
Suran - Hama
Dana
Oil-Retailers at Sub District Level
7043
43
4033
3023
38
83
63
45
Menbij
Collected data indicated that average monthly volume of sales per wholesaler in 2019 showed an increase in rate (60 %) compared to 2018 (368 barrel/ 2019, 230 barrel/ 2018). The reported range of monthly volume of sales per wholesaler was between 36 -750 barrels in 2019 and 30-648 barrels in 2018. Suran Hama sub-district recorded the highest volume of sales per wholesaler in 2018 (648 barrels), whereas it ranked second in 2019 (727 barrels) after Al Bab sub-district that topped the list in 2019 with 750 barrels. Figure 13, “Oil-Wholesalers Volume of Sales “, shows the average monthly volume of sales per wholesaler at the sub-district level in 2019 and 2018.
Figure 13. Oil-Wholesalers Volume of Sales
Monthly Volume of Salesper Wholesaler 2019
Monthly Volume of Salesper Wholesaler 2018
Average Wholesalers Monthly Volume of Salesin Barrel at Assessed Sub-Districts
4136
750
727648
30
Suran - Hama 4345
Azaz 261341
6690
Al Bab
Dana
Menbij
Retailers reported a decrease in average monthly volume of sales in 2019 by 17% compared to the monthly sales in 2018 (37 barrels/2019 and 45 barrels/ 2018). The retailers’ monthly volume of sales at the assessed sub-districts ranged between 6-86 barrels in 2019 and between 4-114 barrels in 2018. Suran Hama sub-district recorded the highest average monthly volume of sales at the retailer level with 86 barrels in 2019 and 114 barrels in 2018. This was followed by A’zaz sub-districts with 80 barrels in 2019 and 102 barrels in 2018. Dana came last with 6 barrels in 2019 and 4 barrels in 2018. Figure 14, “Oil-Retailers Volume of Sales”, illustrates the average monthly volume of sales at retailer level disaggregated by sub-district.
Figure 14. Oil-Retailers Volume of Sales
Monthly Volume of Salesper Retailer 2019
Monthly Volume of Salesper Retailer 2018
Average Retailers Monthly Volume of Sales in Barrelat Assessed Sub-Districts
106
46
11486
10280
2133
1913
Suran - Hama
Azaz
Al Bab
Jarablus
Menbij
Dana

23 Fuel study in North Syria
Wholesalers across the assessed sub-districts reported that the percentage of imported oil products increased in 2019 as compared to 2018 by 3% (23% in 2018, 26% in 2019) which indicates that the percentage of domestic oil products decreased by 3% (from 77 % in 2018 to 74% in 2019). Wholesalers at Al Bab and Menbij sub-districts reported that 100% of their oil sales were domestic products for both years (2018 and 2019), whereas Suran-Hama sub-district recorded highest percentage of imported oil products with an average of 70% in 2019 and 63% in 2018. Figure 15, “Type of Oil Products at Wholesalers Gate”, displays the percentage of domestic and imported oil sales at sub- district level at wholesalers’ gate.
Figure 15. Type of Oil Products at Wholesalers Gate.
Domistic oil products 2019
Domistic oil products 2018 Imported Oil Products 2019
Imported Oil Products 2018
Percentage of Oil-Products Types at Retailers Gate
Suran - Hama
AzazAl BabJarablusMenbij Dana
100
100
99
90
87 87
95 97
5 4
122
12 10
7030
50 50 50 50
4555
As for the retailers, the reported percentage of imported oil products by retailers increased in 2019 as compared to 2018 by 7% (19% in 2018, 26% in 2019) which indicates that the percentage of domestic oil products decreased by 7% (from 81% in 2018 to 74% in 2019). Retailers at Menbij sub district reported that 100 % of their oil sales are domestic products for both years (2018 and 2019), whereas Dana sub-district recorded highest percentage of imported oil products (Dana 70% in 2019 and 50% in 2018). Figure 16, “type of Oil Products at Retailers Gate”, displays the percentage of domestic and imported oil sales at sub district level at a retailer gate.
Figure 16. Type of Oil Products at Retailers Gate.
Domistric oil products 2019
Domistric oil products 2019 Imported oil products 2019
Imported oil products 2018
Percentage of Oil-Products Types at Wholesalers Gate
Suran - HamaAzazAl Bab Menbij Dana
100
100
100
100
88
65
70
9012 10
62
35
38
30 3070
During the reporting period, data indicated that the median price of one barrel of domestic oil product equals 60% of the median price of one barrel of imported oil product at the wholesaler gate price (45,000 SYP/barrel of domestic oil product, 75,000 SYP/barrel of imported oil product). Different quality types of oil products coupled with transportation cost caused different prices at sub-district level. Across the assessed sub-districts, price of one barrel of domestic oil product ranged between 12,000 SYP and 60,000 SYP, and price of one barrel of imported oil product recorded a range between 58,500 SYP and 80,000 SYP. It is worth mentioning that the lowest reported price, 12,000 SYP, is referred to the subsidized price of one barrel of refined oil products in SDF-controlled areas. Menbij sub-district registered the lowest average price of domestic oil product (26,000 SYP/ one barrel of domestic oil), and A’zaz sub-district registered the lowest average price of imported oil product (58,500 SYP/ barrel of imported oil product) whereas Suran-Hama sub-district had the highest average prices of oil products (57,500 SYP/ barrel of domestic oil product, 80,000 SYP/ one barrel of imported oil product). Figure 17, “Price of Oil-Products at Wholesalers Gate”, illustrates the average price of domestic and imported oil products at wholesaler gate.

24 Fuel study in North Syria
Figure 17. Price of Oil-Products at Wholesalers Gate
Price of one barrel of imported Oil product in SYPPrice of one barrel of Domistic Oil product in SYP
Azaz
Al Bab
Suran - Hama
Dana
Price of Oil Products at wholesaler Gate
58 K80 K
70 K
45 K75 K
11 K26 K
38 K59 K
50 K
Menbij
Furthermore, at a retailer’s gate, the median price of one barrel of domestic oil product equals 67% of median price of one barrel of imported oil product (50,000 SYP/ barrel of domestic oil product, 75,000 SYP/ barrel of domestic oil product). Across the assessed sub-districts, the price of one barrel of domestic oil product at a retailer gate ranged between 37,000 SYP and 55,000 SYP, and price of one barrel of imported oil product recorded a range between 45,000 SYP and 97,000 SYP. Menbij sub-district registered the lowest average price of oil product (37,000 SYP/Barrel of domestic oil product and 45,000/ barrel of imported oil product). The highest average price of domestic oil product was recorded at Suran-Hama sub-district (55,000 SYP/Barrel of domestic oil product), whereas the highest average price of imported oil product was recorded at Jarablus sub-district (97,000/ one barrel of imported oil product). Figure 18 “Price of Oil-Products at Retailers Gate” illustrates the average price of domestic and imported oil products at a retailer gate.
Figure 18. Price of Oil-Products at Retailers Gate
Price of one barrel of imported Oil product in SYPPrice of one barrel of Domistic Oil product in SYP
Azaz
Jarablus
Al Bab
Suran - Hama
Dana
Price of Oil Products at Retailers Gate
55 K70 K
95 K
50 K75 K
45 K40 K
48 K
39 K70 K
78 K
54 K
Menbij
During the reporting period, 2019, the estimated wholesaler gross profit per one barrel of oil product recorded a value of 6,600 SYP (buying price=40,393 SYP, and selling price= 46,993 SYP). The estimated gross profit at a retailer gate was higher by 35%, 8,946 SYP per barrel of oil product (buying price=45,546 SYP and selling price= 54,492 SYP). It is worth mentioning that the lowest gross profit of a wholesaler was reported in Suran-Hama sub district (770 SYP/ barrel), and the lowest gross profit of a retailer was reported at Menbij sub district (2,933 SYP/ barrel). However, Dana sub district recorded the highest gross profit at both levels with (16,750 SYP/ barrel) at wholesaler level and (10,500 SYP/ barrel) at retailer level. Figure 19, “Oi-Traders Gross Profit in 2019”, illustrates the buying and selling price of one barrel of oil products in 2019 along with the gross profit at both the wholesaler and retailer levels.
Figure 19. Oil-Traders Gross Profit in 2019
Wholesaler Buying Price in 2019
Retailer Buying Price in 2019
Wholesaler Selling Price in 2019
Retailer Selling Price 2019
Wholesaler Gross Profit 2019
Retailer Gross Profit 2019
0
100,000
80,000
60,000
40,000
20,000
Pric
e of
one
bar
rel o
f O
il pr
oduc
t
Gross Profit of one oil barrelin SYP at Trader Gate

25 Fuel study in North Syria
Consumption Households reported that, prior to the crisis, they used to buy the refined oil products from licensed retailers (known as fuel stations). Since the crisis started, refined oil products became widely available from different sources, mainly from retailers and community-based shops (mini supermarket in the neighborhood). Others reported that they obtain the refined oil products directly from oil refinery stations. Refined oil products have become a basic commodity along with staples such as rice, sugar and/or tea. Interviewed study respondents reported that for a small amount of refined oil, they procure their needs from community-based shops, while they turn to retailers if they desire a larger ration. Furthermore, farmers reported that they buy the refined oil products either from retailers or directly from local oil refinery-stations.
In addition, households reported that in 2018, the availability of imported refined oil products were very low. However, after the establishment of Watad, the imported refined oil products and home-gas became widely available in Idleb. Likewise, availability of home-gas has been significantly improved in TAF&NAO-controlled areas after the opening of a home-gas factory in A’zaz, which produces approximately between 10,000-15,000 kg of gas daily.
Conducted FGDs indicated that the demand for fuel changes depends on the consumer type. Households consume a high amount of fuel during the winter season for warming purposes, while farmers use a high amount of fuel in the summer for irrigation purposes.
Diesel, Gasoline and Home-Gas are the main types of refined oil products that households use in their daily life activities. The reported individual weekly consumption of diesel decreased in 2019 compared to 2018 by 23% (2.5 Litres/ 2019 and 3.25 Litres/ 2018). In contrast, individual weekly consumption of gasoline increased in 2019 compared to 2018 by 20% (6 Litres/ 2019 and 5 Litres/ 2018). The reported individual weekly consumption of home-gas was stable in 2018 and 2019 at 1.5 Litres. Figure 20, “Individual Weekly Consumption of Oil Products”, illustrates the individual weekly consumption of oil products at the assessed areas.
Figure 20. Individual Weekly Consumption of Oil Products
Diesel 2019
Diesel 2011
Diesel 2018
Gasoline 2019
Gasoline 2011
Gasoline 2018
Home Gas 2019
Home Gas 2011
Home Gas 2018In
divi
dual
Wee
kly
Con
sum
ptio
n in
Lit
re
Types of Refined Oil product
0
10
20
30
40
50
60
In Menbij sub-district households, farmers and food processing factories reported that they have access to subsidized refined oil products (both diesel for warming and Gasoline for automobile). Indeed, their access to subsidized oil products was limited by the identified quota by SDF. The reported value of identified quota in Menbij for one family was 400 litres in a year (subsidized price was 50 SYP per litre). In cases of family needs higher than the identified quota, study respondents reported that they procure from illegal fuel retailers at a price of 175 SYP per litre. Whereas, the quota for a public car was 60 l in a week while it is 40 l in a week for a private car. It is worth mentioning that some IDPs in Menbij reported that they do not have access to subsidized fuel due to their failure to acquire the required subsidized card. Therefore, they procure the fuel with high price.
According to the interviewed households, the purchasing pattern has changed. Prior to the Syria crisis, households used to buy fuel in bulk (needed amount of diesel for winter season at once). However, due to the deterioration of purchasing power at household level and the dramatic increase in the price of fuel products, households now procure the fuel products in very limited amounts.

26 Fuel study in North Syria
Figure 21. Consumer Challenges at Fuel Market System in Syria
Fragile security situation
High prices of refined oil products
Traders monopoly over refined oil products
Low availability of refined oil products
Low purchasing power
Quality, price and safety are the main indicators that orient the preference and fuel-substitution decision of households. It has been reported that although imported refined oil products are better in quality than the domestic refined ones, households prefer the domestic refined oil products because it is less costly than the imported one. Furthermore, Kerosene (known as Kas) and coal were reported to be the main substituted commodity for diesel and home-gas. However, some study respondents reported that they were hesitant to use the coal and kerosene as they believe that coal and Kerosene are not safe and detrimental to a child’s health. FGDs indicated that when it comes to the comparison between the preference among kerosene and coal, kerosene came first as coal was considered too costly (75 SYP/kg).
In contrast, food processing factories reported that they prefer the imported oil products due to its quality, as the low quality of domestic refined oil products reported to have a negative impact on the food processing machines and generators. Of note, consumers reported that the quality of refined oil- products have improved in 2019 compared to 2018 as a result of the evolving work of refinery stations.
According to the interviewed consumers, the following five challenges (in rank) were reported as the main challenges that consumer face in having access to refined oil products: 1) High prices of refined-oil products, 2) Traders monopoly over refined oil products (especially when oil trade routes are closed, specifically during times of active conflict ), 3) Low purchasing power of the consumer, 4) Low availability of refined oil products, and 5) a fragile security situation that limits their safe access to the market. See the figure 21 above “Consumer Challenges at Fuel Market System in Syria”
Furthermore, study respondents reported that both women and men have equal access to refined oil products at neighborhood markets. However, men have better access than women for special cases large quantity purchases, access to larger markets outside the sub-district, and during times of active conflict. This is probably because men work in places where large quantities of products are needed while women may not. So is it not an inability to purchase large amounts (for women), but a lack of their presence within the oil sector components that require purchasing such large quantities.
27 Fuel study in North Syria
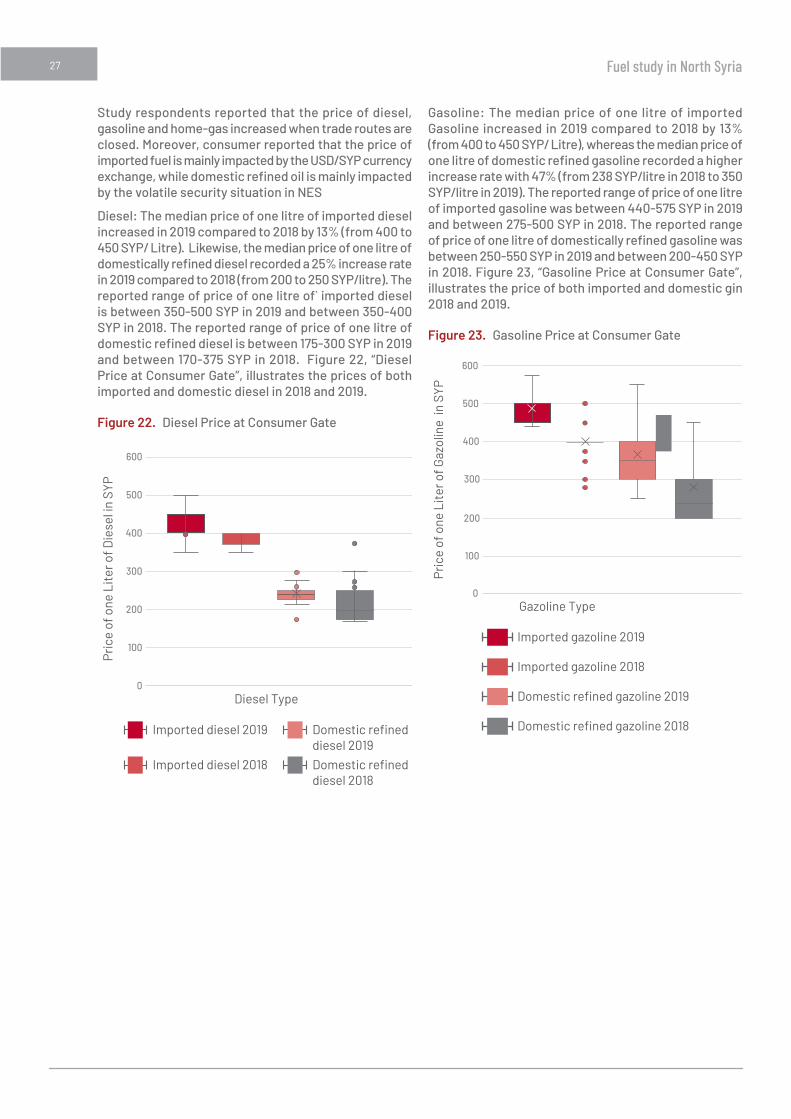
Study respondents reported that the price of diesel, gasoline and home-gas increased when trade routes are closed. Moreover, consumer reported that the price of imported fuel is mainly impacted by the USD/SYP currency exchange, while domestic refined oil is mainly impacted by the volatile security situation in NES
Diesel: The median price of one litre of imported diesel increased in 2019 compared to 2018 by 13% (from 400 to 450 SYP/ Litre). Likewise, the median price of one litre of domestically refined diesel recorded a 25% increase rate in 2019 compared to 2018 (from 200 to 250 SYP/litre). The reported range of price of one litre of` imported diesel is between 350-500 SYP in 2019 and between 350-400 SYP in 2018. The reported range of price of one litre of domestic refined diesel is between 175-300 SYP in 2019 and between 170-375 SYP in 2018. Figure 22, “Diesel Price at Consumer Gate”, illustrates the prices of both imported and domestic diesel in 2018 and 2019.
Figure 22. Diesel Price at Consumer Gate
Imported diesel 2019
Imported diesel 2018
Domestic refineddiesel 2019
Domestic refineddiesel 2018
Pric
e of
one
Lit
er o
f Die
sel i
n SY
P
Diesel Type0
100
200
300
400
500
600
Diesel Price at Consumers' Gate
Gasoline: The median price of one litre of imported Gasoline increased in 2019 compared to 2018 by 13% (from 400 to 450 SYP/ Litre), whereas the median price of one litre of domestic refined gasoline recorded a higher increase rate with 47% (from 238 SYP/litre in 2018 to 350 SYP/litre in 2019). The reported range of price of one litre of imported gasoline was between 440-575 SYP in 2019 and between 275-500 SYP in 2018. The reported range of price of one litre of domestically refined gasoline was between 250-550 SYP in 2019 and between 200-450 SYP in 2018. Figure 23, “Gasoline Price at Consumer Gate”, illustrates the price of both imported and domestic gin 2018 and 2019.
Figure 23. Gasoline Price at Consumer Gate
0
100
200
300
400
500
600
Pric
e of
one
Lit
er o
f Gaz
olin
e in
SYP
Gazoline Type
Imported gazoline 2019
Imported gazoline 2018
Domestic refined gazoline 2019
Domestic refined gazoline 2018

28 Fuel study in North Syria
Home-Gas: The median price of 10 kg of home-gas decreased in 2019 compared to 2018 by 13% (from 6100 to 5300 SYP/ 10kg). The reported range of price of 10 kg of home-gas is between 450-5800 SYP in 2019 and between 3500-15000 SYP in 2018. It is worth to mention that the reported high price in 2018 was likely due to the dramatic shortage of supply in 2018. In contrast, the price improved in 2019 due to the opening of the home-gas factory in A’zaz and the presence of the Watad company within HTS-controlled areas. Moreover, the reported lowest price of 450 SYP/10kg is the subsidized price reported in the SDF-controlled Menbij sub-district. Figure 24, “Home-Gas Price at Consumer Gate”, illustrates the prices of home-gas in 2018 and 2019.
Figure 24. Home-Gas Price at Consumer Gate
16,000
14,000
12,000
10,000
8,000
6,000
4,000
2,000
0
Pric
e of
one
Ute
r of H
ome
Gas
in S
YR
Year
Home-Gaz 2018
Home-Gaz 2019
SeasonAs mentioned above, the demand of fuel changes depends on the consumer type, households consume a high amount of fuel during the winter season for warming purposes, while farmers use a high amount of fuel in the summer for irrigation purpose. Interviewed market actors (Processors and Traders) reported a high profit from October-February. This indicates a high demand and ample supply during this period. The profit was deemed normal in the months of March, April and September. However, profit was reported to be low between May and August. See below figure 25 “ Fuel Seasonal Calender in Syria”
Figure 25. Fuel Seasonal Calender in Syria
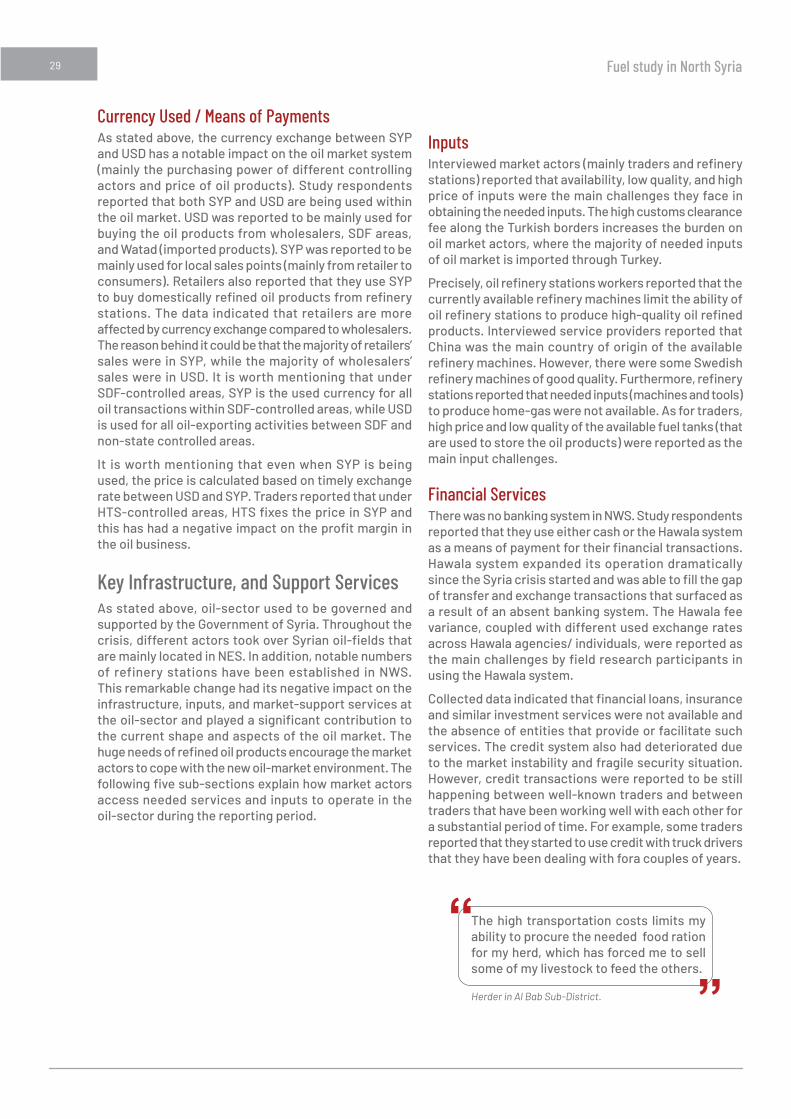
29 Fuel study in North Syria
Currency Used / Means of PaymentsAs stated above, the currency exchange between SYP and USD has a notable impact on the oil market system (mainly the purchasing power of different controlling actors and price of oil products). Study respondents reported that both SYP and USD are being used within the oil market. USD was reported to be mainly used for buying the oil products from wholesalers, SDF areas, and Watad (imported products). SYP was reported to be mainly used for local sales points (mainly from retailer to consumers). Retailers also reported that they use SYP to buy domestically refined oil products from refinery stations. The data indicated that retailers are more affected by currency exchange compared to wholesalers. The reason behind it could be that the majority of retailers’ sales were in SYP, while the majority of wholesalers’ sales were in USD. It is worth mentioning that under SDF-controlled areas, SYP is the used currency for all oil transactions within SDF-controlled areas, while USD is used for all oil-exporting activities between SDF and non-state controlled areas.
It is worth mentioning that even when SYP is being used, the price is calculated based on timely exchange rate between USD and SYP. Traders reported that under HTS-controlled areas, HTS fixes the price in SYP and this has had a negative impact on the profit margin in the oil business.
Key Infrastructure, and Support ServicesAs stated above, oil-sector used to be governed and supported by the Government of Syria. Throughout the crisis, different actors took over Syrian oil-fields that are mainly located in NES. In addition, notable numbers of refinery stations have been established in NWS. This remarkable change had its negative impact on the infrastructure, inputs, and market-support services at the oil-sector and played a significant contribution to the current shape and aspects of the oil market. The huge needs of refined oil products encourage the market actors to cope with the new oil-market environment. The following five sub-sections explain how market actors access needed services and inputs to operate in the oil-sector during the reporting period.
InputsInterviewed market actors (mainly traders and refinery stations) reported that availability, low quality, and high price of inputs were the main challenges they face in obtaining the needed inputs. The high customs clearance fee along the Turkish borders increases the burden on oil market actors, where the majority of needed inputs of oil market is imported through Turkey.
Precisely, oil refinery stations workers reported that the currently available refinery machines limit the ability of oil refinery stations to produce high-quality oil refined products. Interviewed service providers reported that China was the main country of origin of the available refinery machines. However, there were some Swedish refinery machines of good quality. Furthermore, refinery stations reported that needed inputs (machines and tools) to produce home-gas were not available. As for traders, high price and low quality of the available fuel tanks (that are used to store the oil products) were reported as the main input challenges.
Financial Services There was no banking system in NWS. Study respondents reported that they use either cash or the Hawala system as a means of payment for their financial transactions. Hawala system expanded its operation dramatically since the Syria crisis started and was able to fill the gap of transfer and exchange transactions that surfaced as a result of an absent banking system. The Hawala fee variance, coupled with different used exchange rates across Hawala agencies/ individuals, were reported as the main challenges by field research participants in using the Hawala system.
Collected data indicated that financial loans, insurance and similar investment services were not available and the absence of entities that provide or facilitate such services. The credit system also had deteriorated due to the market instability and fragile security situation. However, credit transactions were reported to be still happening between well-known traders and between traders that have been working well with each other for a substantial period of time. For example, some traders reported that they started to use credit with truck drivers that they have been dealing with fora couples of years.

30 Fuel study in North Syria
StorageInterviewed market actors reported that high incidences of explosion possibility of domestic refined products (due to the low quality), coupled with weak/damaged infrastructure of warehouse (due to lack of security and safety system/procedures in place), made the oil market actors more reluctant to keep stock of their oil storages. Forty-eight per cent (11out of 23) of interviewed traders reported that they rent storage, and the remaining five-two per cent (12 out of 23) reported that they own their storage.
The average reported volume of stock per wholesaler was 172 barrels. The average number of restocking per month was 4. Sixty-seven per cent (6 out of 9) of the interviewed wholesalers reported that they have the ability to increase their stock if the demand for oil products increases. The top three restocking challenges reported by wholesalers were: 1) Financial constraints, 2) Increase in prices of oil products, and 3) Transportation. Figure 26,” Wholesalers Restocking Challenges”, illustrated the main reported restocking challenges that wholesalers face.
Figure 26. Wholesalers Restocking ChallengesRestocking challenges among wholesalers
33%Financial constraints
28%Increase in prices ofoil products
17%Transportation
11%Governmentalrestrictions
11%Damagedinfrastructure
The average reported volume of stock per retailer was 22 barrels. The average number of restocking per month was 4. Sixty-four per cent (9 out of 14) of interviewed retailers reported that they have the ability to increase their stock if demand for oil products increases. The top three restocking challenges reported by interviewed retailers are: 1) Increase in prices of oil products, 2) Financial constraints, and 3) Damaged infrastructure. Figure 27,” Retailers Restocking Challenges”, illustrated the main reported restocking challenges that retailers face.
Figure 27. Retailers Restocking ChallengesRestocking challenges among retailers
28%Increase in prices ofoil products
24%Financial constraints
21%Damagedinfrastructure
12%Transportation
12%Governmentalrestrictions
3%Illegal work
Transport Services and Associated Costs Presence of different crossing/checking points, coupled with damaged road infrastructure, made the transport services of oil-products costlier and more difficult compared to the situation pre- crisis. During the reporting period, participants reported that there is a monopoly over transporting crude oil from SDF territory to other territories (GoS or TAF&NAO). Likewise, Watad has a monopoly over importing the refined oil products from Turkey. Large trucks (Up to 70-barrel capacity) are used to transport the crude oil from SDF areas to the refinery stations and wholesalers. Then small trucks (6-8 MT) are used to transport refined oil products from wholesalers and refinery stations to retailers and/or distribution points.
Transport services are reportedly available and can meet customer demand. Drivers either work as employees with traders or have their own trucks and have a contractual relationship with traders. Not all drivers have licenses - it depends on the local rules. For example, under SDF-controlled territory, drivers must have licenses whereas drivers under TAF&NAO territory have not been asked for licenses. Instead, drivers_ under TAF&NAO-controlled territory_, need to coordinate with the military actors there.
The main reported challenges at the transport services phase are: 1) Explosion possibility of oil products (especially at bombing, shelling and offensive escalation incidents), 2) Lack of security and safety procedures in place, 3) Damaged road infrastructure, 4) Instability of trade routes’ status, 5) High value and repetitive aspect of taxations, and 6) Long time needed to transport products across different territory. Interviewed drivers at Dana sub-district reported that sometimes it takes from 50-60 days to get the crude oil from SDF-controlled territory.

31 Fuel study in North Syria
The cost of transporting the oil products reported to be directly linked with the number of crossing points and check points that a truck should pass from its shipping location till its intended destination. The reported range of cost of the transport of one barrel of oil product was between 500-6000 SYP at a wholesalers’ gate and was between 500-5000 SYP at a retailers’ gate. On top of this, the taxation fee is reportedly added. Taxations value also is calculated based on different methods at different crossing/checking points (this includes the lump sum, number of barrels, and type and quantity of the shipped oil products). During the reported period, the range of the reported tax value for one barrel of oil product was between 500-2000 SYP at a wholesalers’ gate and between 500-5000 SYP at a retailers’ gate.
In terms of who pays the transportation cost, participants reported that it is generally based on a mutual agreement between clients, suppliers and the same actor who might use different methods. Precisely, 67 per cent of interviewed wholesalers reported that they pay the transportation cost when they buy from their supplier, while 56 per cent of interviewed wholesalers stated that they pay the transportation cost when they sell the oil products. At retailer level, 43 per cent of interviewed retailers reported that they pay the transportation cost when they buy from supplier while 36 per cent of interviewed retailers stated that they pay the transportation cost when they sell the oil products.
24 http://childrenofsyria.info/wp-content/uploads/2015/07/CHILD-LABOUR.pdf
Labors and Role of WomenData indicated that the role of women at the oil-sector is limited to consumption. Safety, local norms and culture are the main limitations for women to be engaged in the oil-sector. Participants reported that employees/ labor at the oil-sector have no written contracts with their employers. Work relationship is based on a mutual verbal agreement. According to participants, the working environment at the oil-sector is very risky, especially at refinery stations, due to the following reported reasons: used machines are primitive, lack of expertise, low quality of final products that have caused explosions, following very basic and primitive warehousing methods, and a lack of security and safety procedures in place. Furthermore, a report published by UNICEF and Save the Children in 2015 indicated that a notable number of children in north Syria are working in the oil sector 24.
The main reported needed skills at oil-sector are: machine maintenance, refinery experts, knowledge of security and safety procedures, packing the refined oil products from refinery machines, knowledge of operating/ working at different types of refinery machines, and experience in oil-warehousing methods. Interviewed Key informants reported that IDPs (especially who came from Deir-ar-zor governorate) are considered experts in the oil-sector. Refinery stations reported that their laborers have been trained and mentored by the experts who arrived from NES.
The median reported daily wages at refinery stations was stable in 2019 compared to 2018 with 3,000 SYP/daily wage. The recorded range in 2019 is between 2500-7000 SYP, while in 2018 it ranged between 2500 and 10,000 SYP. Participants reported that labor at oil-sector pays well compared to other labor sectors such as the agricultural and food processing sectors. Figure 28, “Daily wage rate at refinery stations”, illustrate how does labor wages at refinery stations change during 2018 and 2019.
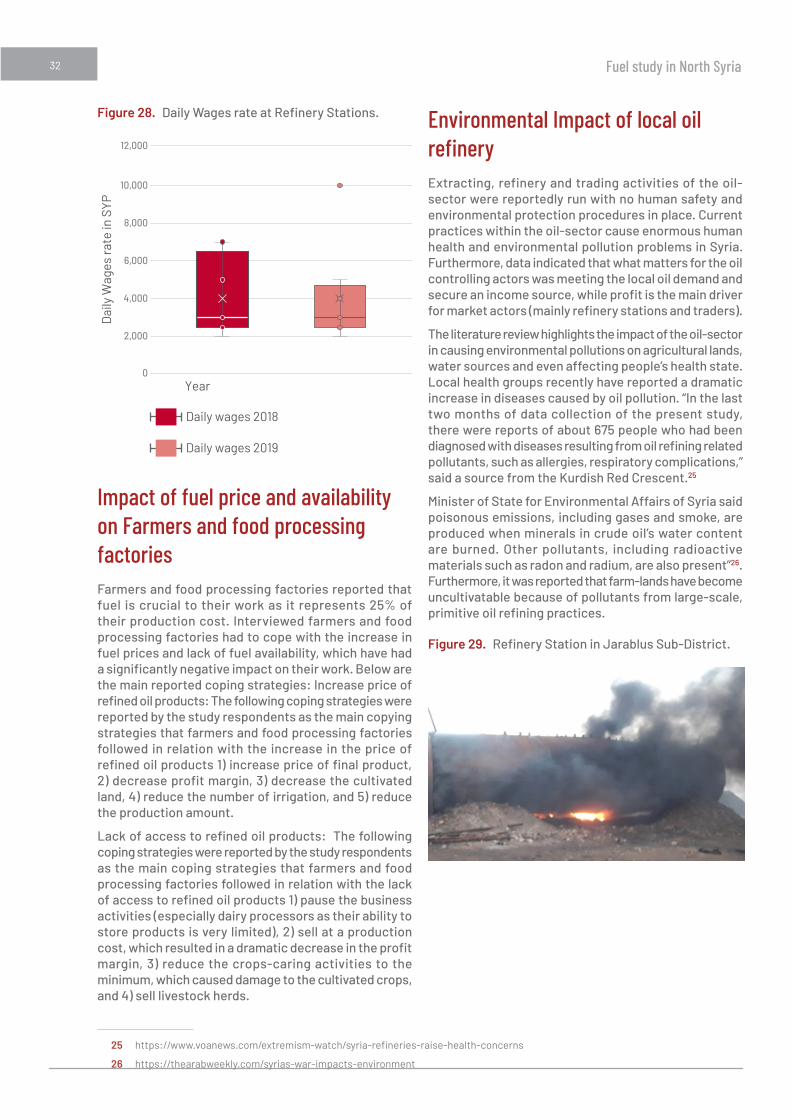
32 Fuel study in North Syria
Figure 28. Daily Wages rate at Refinery Stations.
Year
Daily wages 2018
Daily wages 2019
12,000
10,000
8,000
6,000
4,000
2,000
0
Dai
ly W
ages
rate
in S
YP
Impact of fuel price and availability on Farmers and food processing factoriesFarmers and food processing factories reported that fuel is crucial to their work as it represents 25% of their production cost. Interviewed farmers and food processing factories had to cope with the increase in fuel prices and lack of fuel availability, which have had a significantly negative impact on their work. Below are the main reported coping strategies: Increase price of refined oil products: The following coping strategies were reported by the study respondents as the main copying strategies that farmers and food processing factories followed in relation with the increase in the price of refined oil products 1) increase price of final product, 2) decrease profit margin, 3) decrease the cultivated land, 4) reduce the number of irrigation, and 5) reduce the production amount.
Lack of access to refined oil products: The following coping strategies were reported by the study respondents as the main coping strategies that farmers and food processing factories followed in relation with the lack of access to refined oil products 1) pause the business activities (especially dairy processors as their ability to store products is very limited), 2) sell at a production cost, which resulted in a dramatic decrease in the profit margin, 3) reduce the crops-caring activities to the minimum, which caused damage to the cultivated crops, and 4) sell livestock herds.
25 https://www.voanews.com/extremism-watch/syria-refineries-raise-health-concerns
26 https://thearabweekly.com/syrias-war-impacts-environment
Environmental Impact of local oil refinery Extracting, refinery and trading activities of the oil-sector were reportedly run with no human safety and environmental protection procedures in place. Current practices within the oil-sector cause enormous human health and environmental pollution problems in Syria. Furthermore, data indicated that what matters for the oil controlling actors was meeting the local oil demand and secure an income source, while profit is the main driver for market actors (mainly refinery stations and traders).
The literature review highlights the impact of the oil-sector in causing environmental pollutions on agricultural lands, water sources and even affecting people’s health state. Local health groups recently have reported a dramatic increase in diseases caused by oil pollution. “In the last two months of data collection of the present study, there were reports of about 675 people who had been diagnosed with diseases resulting from oil refining related pollutants, such as allergies, respiratory complications,” said a source from the Kurdish Red Crescent.25
Minister of State for Environmental Affairs of Syria said poisonous emissions, including gases and smoke, are produced when minerals in crude oil’s water content are burned. Other pollutants, including radio active materials such as radon and radium, are also present”26. Furthermore, it was reported that farm-lands have become uncultivatable because of pollutants from large-scale, primitive oil refining practices.
Figure 29. Refinery Station in Jarablus Sub-District.

33 Fuel study in North Syria
Conclusion and Recommendation
Conclusion Oil products are essential to meet household basic needs, they are included in the Survival Minimum Expenditure Basket (SMEB). Furthermore, oil products are considered a crucial input to livelihood activities. The Syria crisis has negatively impacted the oil market system in Syria. This impact changed the main aspects of the oil market environment, supply chain, infrastructure and input services. Oil market system showed resilience, and market actors followed different coping strategies to cope with the new dynamic of the current oil market system.
The following issues were classified as main critical issues in the new oil market environment: USA and Europe-imposed economic sanctions on Syria, change of controlling actors over oil fields, increase in the number of oil refinery stations, security and safety incidents, dangerous work environment, low quality of locally-refined oil products, and high value of oil-taxations. In addition, there was a major disruption of rules and regulations, governmental support, court systems, trade routes, political and security situation, currency exchange rate between SYP and USD, purchasing power of oil consumers, and access to subsidized oil products.
Supply chain of oil products in Syria has dramatically changed since the Syria crisis began. Extraction of crude oil has been limited to the controlling actor in NES. The majority of crude oil has been refined at the new established private refinery stations, which have limited capacity and rely on very basic machines and tools. Trading aspects of oil products were subject to change and were directly affected by the political and security situation. Trading activities of oil products across different territories was reportedly limited to traders, who are perceived by local community as an affiliation party to the controlling actors. In contrast, high number of small traders partook in oil trading activities within the same territory. Households, farmers, and food processing factories procured refined oil products from different actors that include refinery stations, wholesalers, retailers, and small community-based shops.
Oil market actors face critical issues in obtaining the needed inputs for their business activities such as: expensive crude oil, difficult access to refinery inputs and machines, lack of oil experts, high cost of transporting the oil products, and limited storage capacity. Moreover, there was a major disruption in the capacity to produce home-gas, road infrastructure, financial services, quality of crude oil, and credit-based trade.
Although the oil market system showed resilience, current practices within the oil-sector will have a severe and long-term impact on the natural resources, environment and human health in Syria. The perpetuation of these practices is exposing hundreds of vulnerable communities to health risks due to their exposure to toxic and chemical substances that are released during the refining process. This research serves as an alert to the expected harm that could be caused if these practices are continued.
Given the fact that oil products are part of the SMEB and are crucial inputs for livelihood activities, humanitarian actors in Syria should be aware of these risks and need to address these issues carefully at the intervention design phase, especially fuel-based interventions like winterization and fuel support to farmers, to avoid causing any harm at an environmental and human health level.
RecommendationsAddressing the impact of crisis on oil sectors requires huge efforts from all involved actors that includes NGOs, civil communities, local authorities and even military groups. A creative early recovery and post-conflict responses are needed to tackle the environmental and health impacts of the current practices in the oil-sector in Syria.
Further Studies ! Oil refinery stations mapping: To help in identifying
the locations of refinery stations, quantifying current environmental and health impacts of these refinery stations on the nearby communities, and inform project design to devise environmental and early recovery interventions.
! Safety assessment: To help in identifying the main negative practices that are followed by market actors at work (refinery and warehousing workers, traders, oil-truck drivers, and oil consumers), and allow for the design of informed awareness campaigns.
! Fuel Impact study: To help in quantifying the impact of changes in fuel markets on farmers (irrigation, plowing, harvesting, cost of fodder and animal feed, and crops processing), NGOs operations, and access of IDPs and host communities to basic needs like bread.

34 Fuel study in North Syria
Recommendations for Partners ! Provide livelihood support for oil labors: Many oil-
labors reported that work environment at oil sector is dangerous and that a lack of access to income generation opportunities forced those oil-labors to join this dangerous work environment. Providing those oil-labors with livelihood support will help them in meeting their basic needs without exposing themselves to dangerous work.
! Promote environmental recovery programs: It is never too early to think of environmental recovery programs. The generated pollution of current practices in the oil-sector is huge. Humanitarian actors are encouraged to implement environmental recovery interventions focused on protecting agricultural lands.
! Deliver health support in communities near refinery stations: Small-scale refinery stations are set up in unstudied areas. People situated in communities close to these refinery stations are exposed to health risks. Therefore, they need secured access to health support and might require urgent medical help. Health promotion programs are also needed to promote a positive behavior that help these vulnerable people in dealing with these risks.
! Design oil-based interventions carefully: Given the highlighted risks of oil products, implementing partners are recommended to pay more attention to the interventions that include a fuel distribution component. Preventive measures should be in place to avoid exposing staff and/or beneficiaries to the risk of explosions and similar security incidents.
! Conduct awareness programs: Lack of awareness was reported as a reason for explosions and similar security incidents. Awareness interventions should not be limited to households, it should also target transporting and refinery workers to provide them with technical awareness as well.
! Monitor oil-incidents: Identifying the main reasons behind oil-incidents is crucial to address these oil-incidents and develop well-informed responses to prevent these incidents.
! Formulate oil quality control committee: Lack of proper quality checking system in place caused issues among the market actors and led to their designation of different prices for refined oil products. The quality of refined oil products should adhere to minimum quality standards that guarantee the safety usage of these oil products by consumers.