
Improving the performance of the New Zealand Hearing ...
80
Improving the performance of the New Zealand Hearing Screening Test A thesis submitted in partial fulfilment of the requirements for the degree of Master of Audiology at the University of Canterbury By Kent J. Spence University of Canterbury 2020
Transcript of Improving the performance of the New Zealand Hearing ...

Improving the performance of the
New Zealand Hearing Screening Test
A thesis submitted in partial fulfilment of the requirements
for the degree of Master of Audiology
at the University of Canterbury
By Kent J. Spence
University of Canterbury
2020

2
Abstract
Hearing impairment adversely affects many individuals. Within New Zealand the
number of individuals who will struggle with hearing loss is expected to increase
significantly in the coming years due to our ageing population (Exeter, Wu, Lee, &
Searchfield, 2015). Hearing impairment has been shown to have detrimental effects on
psychosocial outcomes, and is related to higher rates of depression (Gopinath et al., 2009), a
reduction in independence (Schneider et al., 2010), poorer employment outcomes (Winn,
2007), and is associated with higher rates of cognitive decline (Lin et al., 2013). Early
identification and intervention is needed to manage this rising healthcare need. Hearing
screening tests have been shown to be efficacious and cost effective in the early identification
of hearing impairment and have been attributed to an increased uptake of hearing aid use
(Liu, Collins, Souza, & Yueh, 2011; Yueh et al., 2010).
The present study looks to improve the performance of the New Zealand Hearing
Screening Test (NZHST) – a publically available hearing screening tool that was initially
developed in 2011. The present study aimed to assess whether there were any advantages in
applying Brand & Kollmeier’s A1 procedure to the digit triplet. This adaptive procedure was
incorporated into the NZHST and administered to 33 participants (18 with normal hearing,
and 15 with hearing impairment) alongside the standard 1-up 1-down procedure currently
used. In the present study data collected also allowed for concurrent estimation of SRT for
three different scoring methods – the current “average of the last 20 SNRs” method, and the
estimation of thresholds by the fitting of psychometric functions to the triplet- and digit-
scoring data.
Analyses of the data showed that overall performance in the present study was poor.
The Brand & Kollmeier A1 procedure gave a test sensitivity of 62% and a specificity of 95%.

3
The 1-up 1-down procedure gave a test sensitivity of 71% and a specificity of 80%. This
result is incongruent with previous studies suggesting that the NZHST has a test sensitivity
and specificity of 94% and 88% respectively (Bowden, 2013). Further investigation will be
required to determine the cause of this discrepancy.

4
Acknowledgements
I wish to thank my fellow classmates whom without I may not have made it to the end
of this programme. Your support and encouragement are greatly appreciated and I will
forever be thankful for having worked alongside such a wonderful group of people.
I would also like to thank the many staff involved in the audiology programme and in
particular Ciara, Jonny, and Nicole. Your expertise and guidance in the clinical aspects of
audiology has been immensely valuable and I expect that the things you have taught me will
serve me well throughout my career. Many thanks to my supervisor, Prof. Greg O’Beirne, for
your support, guidance, expertise, and understanding throughout the undertaking of this
project.
A special thanks to Kim Wise for your support throughout my application process.
Your words of encouragement and the time you took to steer me in the right direction aided
me greatly in preparing myself for joining the MAud programme.
Many thanks to my family for your encouragement and support throughout the year
and in particular my mother Nisha. You have always supported me in the things I wish to do
and it has never gone unnoticed
Finally, I wish to thank my loving partner Isabella. You have continually encouraged
me and supported me through the last two years. I am forever grateful for your support and
truly blessed to have you in my life.

5
Table of Contents Abstract ................................................................................................................................ 2
Acknowledgements ............................................................................................................... 4
List of Figures ....................................................................................................................... 7
List of Tables ........................................................................................................................ 8
Introduction .......................................................................................................................... 9
1.1 The consequences of hearing loss ................................................................................ 9
2 Understanding how we hear ............................................................................................. 12
2.1 The human ear ........................................................................................................... 12
2.2 Sound, its properties, and physiological correlates ..................................................... 13
3 Hearing impairment.......................................................................................................... 15
3.1 Classifications of hearing impairment ........................................................................ 15
3.2 Hearing impairment in adults ..................................................................................... 16
3.2.1 The pathophysiology of presbycusis .................................................................... 17
3.2.2 The physiology of hearing in noise ...................................................................... 18
4 Hearing screening ............................................................................................................ 18
4.1 What is hearing screening .......................................................................................... 18
4.2 The efficacy of hearing screening .............................................................................. 19
4.3Speech in Noise Testing ............................................................................................. 19
4.4 Psychophysical Test Procedures ................................................................................ 20
4.4.1 The Method of Limits .......................................................................................... 21
4.4.2 The Method of Adjustment .................................................................................. 22
4.4.3 The Method of Constant Stimuli .......................................................................... 22
4.4.4 Adaptive procedures: Simple 1-Up 1-Down Procedures ...................................... 23
4.4.5 Adaptive procedures: The Up-Down Transformed Response ............................... 24
4.4.6 Adaptive procedures: Brand and Kollmeier A1 and A2 procedures ...................... 24
4.5 The use of Digits in Hearing Screening ...................................................................... 26
4.6 The Digit Triplet Test ................................................................................................ 26
4.7 Digit versus Triplet scoring in Digit Triplet Tests ...................................................... 28
5 Present issues with the current NZHST ............................................................................ 30
5.1 Aims of the present study .......................................................................................... 31
5.2 Hypothesis................................................................................................................. 31
6 Test development ............................................................................................................. 31

6
6.1 Modifying the adaptive procedure ............................................................................. 31
6.2 Method of Calculating Threshold (i.e. test score) ....................................................... 32
7 Verifying the Modified NZHST ....................................................................................... 33
7.1 Equipment ................................................................................................................. 33
7.2 Participants ................................................................................................................ 34
7.3 Verification of the Modified NZHST ......................................................................... 35
8 Results ............................................................................................................................. 36
8.1 Analysis of the results of the Brand and Kollmeier A1 procedure .............................. 36
8.1.1 Test-retest reliability ............................................................................................ 36
8.1.2 Analyses of slope ................................................................................................ 37
8.1.3 Analyses of Order Effect ..................................................................................... 39
8.1.4 Relationship of the Brand & Kollmeier A1 Procedure and PTA ........................... 41
8.1.5 ROC Analyses ..................................................................................................... 44
8.2 Analyses of the 1-up 1-down Procedure ..................................................................... 48
8.2.1 Analyses of Order Effects .................................................................................... 48
8.2.2 Analyses of Slope ................................................................................................ 51
8.2.3 Relationship of the 1-up 1-down Procedure and PTA .......................................... 52
8.2.4 ROC analyses ...................................................................................................... 54
9 Discussion ........................................................................................................................ 59
9.1 Hearing impairment and hearing screening ................................................................ 59
9.2 Speech in Noise Testing ............................................................................................ 60
9.3 Performance in the Present Study .............................................................................. 61
9.3.1 Measures of Reliability ........................................................................................ 62
9.3.2 Diagnostic Power ................................................................................................ 63
9.4 The Observed Performance Discrepancy ................................................................... 64
9.5 Limitations in the Present Study ................................................................................ 68
10 Conclusion ..................................................................................................................... 68
References .......................................................................................................................... 70
Appendices ......................................................................................................................... 76
Appendix 1: Human Ethics Committee Approval ............................................................ 76
Appendix 2: Participant Information Sheet ...................................................................... 77
Appendix 3: Participant Consent Form ............................................................................ 79
Appendix 4: Authorisation to Sample Clients of UC’s Speech and Hearing Clinic........... 80

7
List of Figures
Figure 1: Brand & Kollmeier’s (2002) adaptive procedure. ................................................ 25
Figure 2 : Example of psychometric functions. Note the difference in slope with triplet
scoring producing a significantly steeper slope than digit scoring. ....................................... 30
Figure 3 : Example adaptive tracks from the Brand & Kollmeier A1 procedure and 1-Up 1-
Down. Note how the A1 procedure has a rapid decline in presentation level in the initial trials
........................................................................................................................................... 33
Figure 4 : Mean thresholds of all participants separated by hearing status ............................ 35
Figure 5 : Slope estimates of Brand & Kollmeier A1 procedure........................................... 38
Figure 6 : Analyses of order effects. Brand & Kollmeier A1 procedure, triplet SRT. Error
bars show the standard error of the mean ............................................................................. 40
Figure 7 : Analyses of order effects. Brand & Kollmeier A1 procedure, Digit SRT. Error bars
show the standard error of the mean .................................................................................... 40
Figure 8 : Scatter plot showing the relationship of triplet SRT to PTA for the Brand &
Kollmeier A1 procedure. Green data points represent participants with normal hearing. Red
data points represent participants with hearing impairment .................................................. 42
Figure 9 : Scatter plot showing the relationship of digit SRT to PTA for the Brand &
Kollmeier A1 procedure. Green data points represent participants with normal hearing. Red
data points represent participants with hearing impairment .................................................. 43
Figure 10 : Plot of ROC curves for the Brand & Kollmeier A1 procedure. .......................... 45
Figure 11 : Optimal ROC curves for the Brand & Kollmeier A1 procedure based on the triplet
and digit scoring methods. The marker on each curve is the point identified by the Youden
index as having optimal test sensitivity and specificity. ....................................................... 45
Figure 12 : Analyses of order effects, 1-Up 1-Down, with triplet scoring............................. 49
Figure 13 : Analyses of order effects, 1-Up 1-Down, with digit scoring. .............................. 49
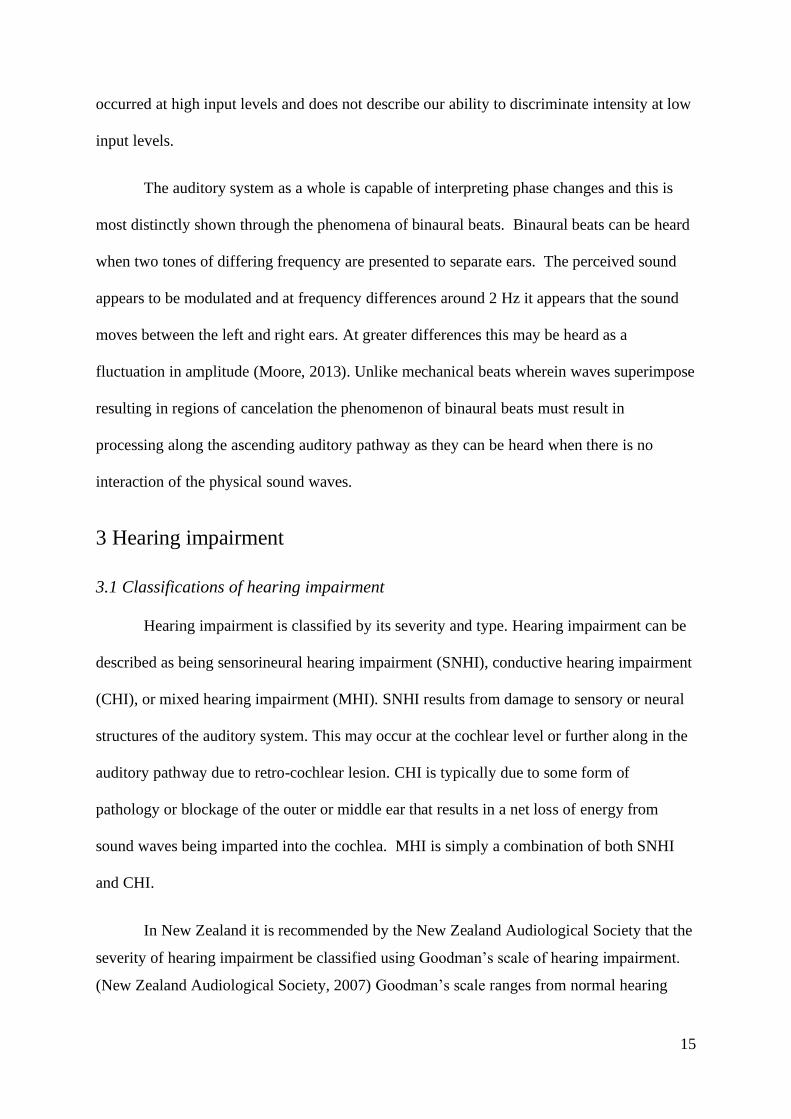
Figure 14 : Analyses of order effects, 1-Up 1-Down, with traditional scoring. ..................... 50
Figure 15 : Analyses of Slope for digit and triplet scoring. 1-Up 1-Down procedure............ 51
Figure 16 : Relationship of PTA to triplet SRT estimates for the 1-Up 1-Down procedure.
Green data points represent participants with normal hearing. Red data points represent
participants with hearing impairment................................................................................... 52
Figure 17 : Relationship of PTA to digit SRT estimates for the 1-Up 1-Down procedure.
Green data points represent participants with normal hearing. Red data points represent
participants with hearing impairment................................................................................... 53
Figure 18 : Relationship of PTA to Traditional SRT estimates for the 1-Up 1-Down
procedure. Green data points represent participants with normal hearing. Red data points
represent participants with hearing impairment ................................................................... 53
Figure 19 : 1-Up 1-Down procedure ROC curves displaying optimal curves achieved for
triplet, digit, and traditional scoring ..................................................................................... 55

8
List of Tables
Table 1 : Goodman (1965), Jerger & Jerger (1980) Scales of Hearing Impairment .............. 16
Table 2 : Test Retest Reliability of Brand & Kollmeier A1 Procedure (Triplet Scoring) ...... 36
Table 3 : Test Retest Reliability of Brand & Kollmeier A1 Procedure (Digit Scoring) ......... 37
Table 4 : ANOVA of Presentation Order and the Estimated Triplet SRT at Trial No 27 ...... 41
Table 5 : ANOVA of Presentation Order and the Estimated Digit SRT at Trial No 27 ......... 41
Table 6 : ROC Analyses of Brand and Kollmeier A1 Procedure with Triplet Scoring .......... 46
Table 7 : ROC Analyses of Brand and Kollmeier A1 Procedure with Digit Scoring ............ 47
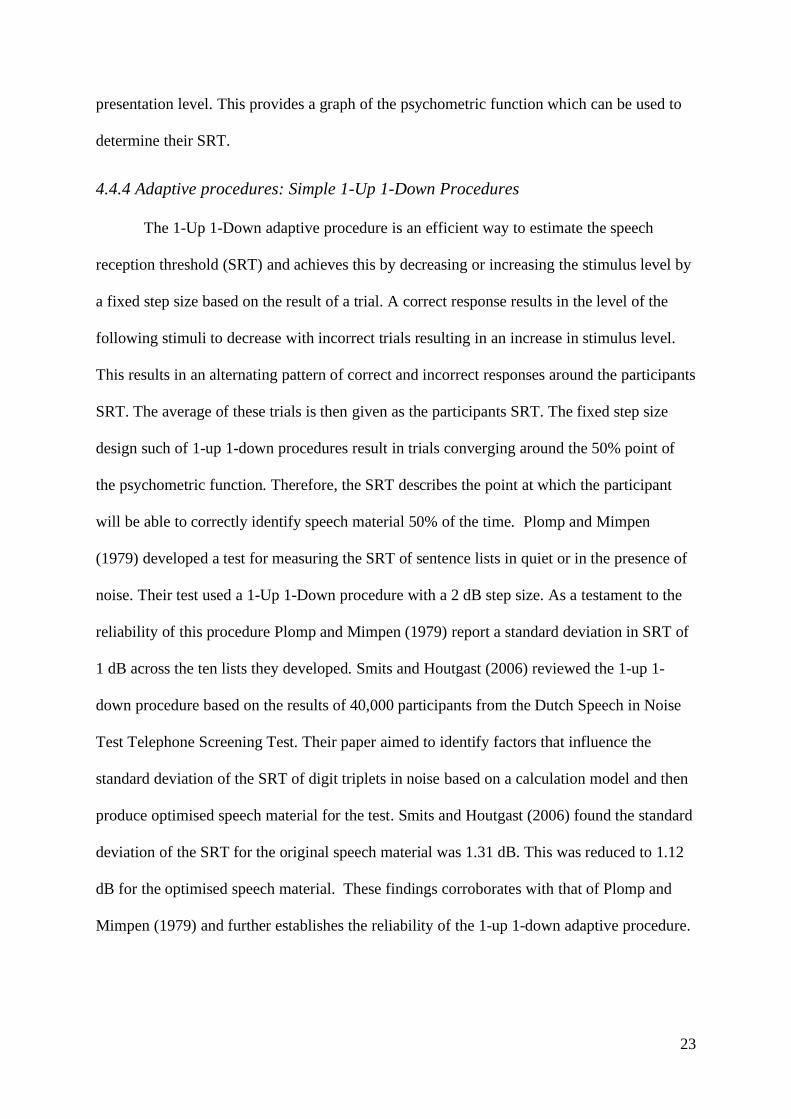
Table 8 : ANOVA of Presentation Order and the Estimated Triplet SRT at Trial No 27 ...... 50
Table 9 : ANOVA of Presentation Order and the Estimated Digit SRT at Trial No 27 ......... 50
Table 10 : ANOVA of Presentation Order and the Estimated Traditional SRT at Trial No 27
........................................................................................................................................... 51
Table 11 : ROC Analyses of 1- Up 1-Down Procedure with Triplet Scoring ........................ 56
Table 12 : ROC Analyses of 1- Up 1-Down Procedure with Digit Scoring .......................... 57
Table 13 : ROC Analyses of 1- Up 1-Down Procedure with Traditional Scoring ................. 58

Introduction
1.1 The consequences of hearing loss
Hearing loss is a significant healthcare concern across New Zealand and the world. It
is estimated that as of 2012 that there are approximately 360 million people worldwide
affected by a disabling permanent hearing loss (World Health Organization, 2012). In New
Zealand the estimated prevalence of hearing loss (as of 2016) was approximately 18.9% of
the population, or 880,350 individuals (The National Foundation for the Deaf, 2016).
Furthermore, due to the ageing population of New Zealand it has been predicted that the
number of individuals with hearing loss will further increase (Exeter et al., 2015). This is
concerning as untreated hearing loss has been shown to have many detrimental effects.
Effective communication is reliant on both auditory and visual information. A loss of
hearing therefore results in breakdowns in communication (Heine & Browning, 2004).
Participants in a 2010 study of the effects of unilateral hearing loss on communication and
social interactions reported having difficulty communicating with others particularly in
background noise (Wie, Pripp, & Tvete, 2010). It was commonly reported that this
breakdown of communication left them feeling excluded from social situations, reduced their
wellbeing in social settings, and made them avoid social gatherings where significant
background noise would be present. It has been shown that individuals with hearing loss are
more likely to become socially isolated (Mick, Kawachi, & Lin, 2014; Strawbridge,
Wallhagen, Shema, & Kaplan, 2000) and that this in turn may put them at increased risk of
developing poorer health outcomes (Cornwell & Waite, 2009). Gopinath et al. (2012) aimed
to establish the longitudinal relationships between measured hearing impairment and self-
reported hearing handicap. Their study was able to compare the audiometric data of
participants against measures of hearing handicap, self-rated health and wellbeing, and

10
cognitive decline. They found that measured hearing impairment correlated with measures of
self-perceived hearing handicap with participants reporting that their hearing loss causes
them to be frustrated, embarrassed, and disrupted their social and personal life. Furthermore,
participants with self-perceived hearing handicap were more likely to have symptoms of
depression, low self-rating of health and, a poorer quality of life. Their study supports
previous findings that hearing impairment results in a poorer quality of life, higher rates of
depression (Gopinath et al., 2009), and, a reduction in independence (Schneider et al., 2010).
These effects have been attributed to the practical and social problems that those with hearing
impairment experience and an increased reliance on social support systems. More recently
hearing loss has been shown to be related to higher rates of cognitive decline. Curhan,
Curhan, Willett, and Grodstein (2019) reported the results of an 8 year longitudinal study
wherein 10,107 men were assessed for changes in subjective cognitive decline using a
questionnaire administered at the start of the study and thereafter in 4 year intervals. The
results from the study found that hearing loss was associated with a higher risk of subjective
cognitive decline. Lin et al. (2013) conducted a longitudinal study with 1984 participants to
determine if hearing loss is associated with cognitive decline in older adults. Over a 6 year
period objective cognitive tests were administered to the participants. Of these participants,
1162 who had a hearing loss experienced significantly greater rates of cognitive decline when
compared to those with normal hearing. They concluded that individuals with a base line
hearing loss (mild hearing loss) had a 24% increased risk of cognitive decline and that the
rate and risk of cognitive decline was positively correlated with the severity of an individual’s
hearing loss. The mechanisms which attribute to this phenomenon are currently unknown but
it has been speculated that hearing aid use may be beneficial in reducing the effect hearing
loss has on cognitive decline (Uchida et al., 2019), with some studies supporting this (Deal et
al., 2017; Mulrow et al., 1990).

11
Hearing loss has implications that extend outside health outcomes. Studies have
shown that individuals with hearing loss have higher rates of unemployment (Hogan,
O'Loughlin, Davis, & Kendig, 2009) and have lower earning potential than their normal
hearing peers (Luft, 2000; Winn, 2007). It has been suggested that this is due to the function
that hearing plays in the work environment. In most workplaces hearing is important in
facilitating effective communication with colleagues and customers. It may also be crucial to
ensure job safety where hearing bells and alarms may be important in maintaining the safety
of one’s self and others around them (Kooser, 2013). The high rates of unemployment among
those with hearing loss may also be explained from the employer’s perspective. Research has
shown that employers express a wide range of concerns with employing those with
disabilities. It is common belief by employers that those with disability may simply not be
able to do the work. Furthermore, employers express concerns about the cost of providing
provisions for disabled employees and that they may be less productive or fail to have the
requisite skills required to be effective workers (Gewurtz, Langan, & Shand, 2016;
Houtenville & Kalargyrou, 2012).
Hearing loss affects all aspects of life and can be highly disruptive. However, many of
those with hearing loss live with the consequences without seeking assistance. It has been
noted that hearing aid uptake remains low (Golub, Lin, Lustig, & Lalwani, 2018; Kim, 2015;
Smits, Kramer, & Houtgast, 2006) and that of those who have hearing aids very few report
regularly using them (Smeeth et al., 2002). It is therefore the responsibility of healthcare
professionals to promote hearing health and help raise awareness of the debilitating effects
untreated hearing loss can have.

12
2 Understanding how we hear
2.1 The human ear
The human ear can be divided into three distinct parts – the outer, middle, and inner
ear. When sound arrives at the outer ear it is collected by the Pinna and directed into the
external auditory canal. The pinna plays a role in the localization of sound by filtering sound
arriving at the ear and providing spectral cues that differ based on the relative position of the
sound source to the listener (Iida, Yairi, & Morimoto, 1998; Suzuki, 2011). Sound then
travels down to external auditory canal where it reaches the middle ear, vibrating the
tympanic membrane and the ossicles connected to it. The middle ear provides an average
increase in acoustic gain of 23.5 dB (Aibara, Welsh, Puria, & Goode, 2001), and serves to
efficiently transfer acoustic energy into the inner ear. A conductive hearing impairment is one
which attenuates the level of sounds reaching the inner ear, usually due to pathologies of the
outer or middle ear. The inner ear contains our peripheral vestibular organs and the cochlea.
The vestibular organs are responsible for helping us maintain our balance and orientation, and
the cochlea transduces the mechanical vibrations transmitted through the middle ear into
electrical nerve impulses our brains interpret as sound. The cochlea is arranged helically like
a snail shell. At the base of the cochlea are the oval and round windows. The ossicles transfer
vibrations into the cochlea fluids through direct contact of the stapes on the oval window. The
cochlea is made up of three fluid filled chambers, scala vestibuli, scala media, and scala
tympani, divided by two membranes. Reissner’s membrane separates the sodium-rich
perilymph in scala vestibuli from the potassium-rich endolymph in scala media, with the
basilar membrane separating scala media from scala tympani. Situated on the basilar
membrane is the organ of Corti housing the inner and outer hair cells. The hair cells are
responsible for the transduction of mechanical motion into electrical nerve impulses
(described in more detail below). On the outside wall of scala media is the stria vascularis

13
pumping epithelium. This epithelium creates the cochlear endolymph and also generates the
+95 mV endocochlear potential that allows the inner and outer hair cells to function.
2.2 Sound, its properties, and physiological correlates
A pure tone can be described by its three basic properties: frequency, amplitude, and
phase. It is therefore unremarkable that physiological functions exist that are directly related
to these properties. Frequency discrimination is essential to auditory perception and is
dictated by the physiology of the cochlea (particularly the mechanics of basilar membrane
vibration) and the neural signal processing that occurs in the ascending auditory pathway.
When vibrations from the stapes enter the cochlea, longitudinal pressure waves are
transmitted in the cochlea fluids inducing transverse ripples in the basilar membrane. Fletcher
(1940) demonstrated frequency selectivity of the cochlea using a masking experiment
wherein he measured the threshold for detecting a signal in the presence of a constant-level
band-pass noise masker centred around the signal’s frequency. Fletcher noted that increasing
the bandwidth of the noise elevated the detection threshold of the signal. However, this effect
only occurred up to given bandwidth (the “critical bandwidth”), above which increases in the
bandwidth of the noise masker did not increase the threshold. Fletcher concluded the auditory
system acts a series of band-pass filters with individual regions of the basilar membrane
correlating to specific bands of frequencies. It is now generally accepted that this is the case,
with high-frequency sounds inducing vibration at the basal end of the cochlea where the
basilar membrane is narrow and stiff, and low-frequency sounds inducing maximal vibration
at the apical end of the cochlea where the basilar membrane is wide and slack (Rossing,
Moore, & Wheeler, 2002). This is further enhanced by outer hair cell motility, wherein phasic
contraction and expansion of the cochlear outer hair cells increase vibration on the basilar
membrane at its characteristic frequency, enhancing frequency selectivity (Dallos & Harris,
1978; Strelioff, Flock, & Minser, 1985). This place-frequency map (or tonotopic

14
organisation) of the basilar membrane is preserved in higher regions of the auditory pathway,
with projections of the auditory nerve innervating distinct regions of the cochlea nucleus
(Clause, Noh, & Kandler, 2009). The mechanical vibrations in the basilar membrane elicit
excitation of the inner hair cells in that region sending electrical impulses along the auditory
nerve. In human cochlea these nerve impulses are phase locked to the stimulus at frequencies
below 5 kHz, and occur at regular intervals related to the frequency of the stimulus (Johnson
& Johnson, 1980; Rose, Brugge, Anderson, & Hind, 1967), playing a role in pitch perception
(Moore, 2008).
The amplitude of sound is first represented on the basilar membrane. Increases in
sound pressure increase the maximal vibration on the basilar membrane. However, this
response is not linear, with cochlear outer hair cells providing maximal amplification at lower
sound pressures and contributing minimally at high sound pressures (Martin & Hudspeth,
2001; Robles & Ruggero, 2001). Increases in the amplitude of sound have been shown to
correlate with an increase in the number of action potentials firing in auditory nerve fibres
(Howes, 1974). This has been considered to be the predominate physiological correlate to
perceived loudness, but it has been suggested that this does not account for it in its entirety
(Relkin & Doucet, 1997). It has been shown that intensity discrimination at high levels is also
aided by the spread of excitation on the basilar membrane. As mentioned prior, outer hair
cells behave passively at high sound pressure levels, which results in a wider band of
excitation on the basilar membrane around the characteristic frequency. Moore and Raab
(1974) demonstrated this in an experiment to test intensity discrimination in the presence of
masking noise. They found that intensity discrimination of a 1 kHz test signal presented in
the presence of band-stop noise was impaired at high levels. They concluded that information
at regions around the characteristic frequency affect intensity discrimination. This effect only
15
occurred at high input levels and does not describe our ability to discriminate intensity at low
input levels.
The auditory system as a whole is capable of interpreting phase changes and this is
most distinctly shown through the phenomena of binaural beats. Binaural beats can be heard
when two tones of differing frequency are presented to separate ears. The perceived sound
appears to be modulated and at frequency differences around 2 Hz it appears that the sound
moves between the left and right ears. At greater differences this may be heard as a
fluctuation in amplitude (Moore, 2013). Unlike mechanical beats wherein waves superimpose
resulting in regions of cancelation the phenomenon of binaural beats must result in
processing along the ascending auditory pathway as they can be heard when there is no
interaction of the physical sound waves.
3 Hearing impairment
3.1 Classifications of hearing impairment
Hearing impairment is classified by its severity and type. Hearing impairment can be
described as being sensorineural hearing impairment (SNHI), conductive hearing impairment
(CHI), or mixed hearing impairment (MHI). SNHI results from damage to sensory or neural
structures of the auditory system. This may occur at the cochlear level or further along in the
auditory pathway due to retro-cochlear lesion. CHI is typically due to some form of
pathology or blockage of the outer or middle ear that results in a net loss of energy from
sound waves being imparted into the cochlea. MHI is simply a combination of both SNHI
and CHI.
In New Zealand it is recommended by the New Zealand Audiological Society that the
severity of hearing impairment be classified using Goodman’s scale of hearing impairment.
(New Zealand Audiological Society, 2007) Goodman’s scale ranges from normal hearing

16
with a pure tone average (PTA) of <26 dB HL to profound with a PTA >90 dB HL. Other
classifications include Jerger & Jerger (1980) (Schlauch & Nelson, 2015) (see Table 1).
Table 1
Goodman (1965), Jerger & Jerger (1980) Scales of Hearing Impairment
Goodman Jerger & Jerger
Degree of Hearing
Impairment
Pure Tone Average (dB HL) Pure Tone Average (dB HL)
Normal <26 <21
Mild 26 - 40 21-40
Moderate 41 - 55 41-60
Moderately Severe 56 - 70
Severe 71 - 90 61-80
Profound >90 >80
Scales of Hearing Impairment adapted from (Schlauch & Nelson, 2015)
3.2 Hearing impairment in adults
Hearing impairment results due to damage of the central or peripheral auditory
systems. This may be due to the degenerative process of ageing on the auditory system,
exposure to noise, genetic mutation, or exposure to ototoxic chemicals and drugs
(Cunningham & Tucci, 2017). In the US at least half of the adult population between the ages
of 60 and 69 will have a hearing impairment (Agrawal, Platz, & Niparko, 2008). Lin, Thorpe,
Gordon-Salant, and Ferrucci (2011) reported that hearing impairment was prevalent in two
thirds of the US population aged 70 years and over. Unsurprisingly, their study found that the
odds of having hearing impairment were significantly correlated with increasing age. Age-
related hearing impairment, known as presbycusis, has been recognised as the leading cause
of adult onset hearing impairment (Cunningham & Tucci, 2017). Presbycusis is considered a
multifaceted disorder that for most is caused by a combination of environmental factors,
auditory trauma, disease, and genetically controlled ageing (Gates & Mills, 2005). Studies of

17
experimental animals raised without confounding environmental effects have been used to
better understand the effect ageing has on the auditory system. Mills, Schmiedt, and Kulish
(1990) raised gerbils in an environment with ambient noise levels less than 40 dB A in order
to investigate the age-related changes in auditory potentials. Mills et al. (1990) measured the
auditory brainstem response on anesthetized gerbils and estimated their hearing thresholds
aged 6-8 months, 22-24 months, and 36 months. Mills et al. (1990) estimated that between 6-
8 months and 22-24 months, the mean thresholds for hearing increased on average by 10 dB
SPL, and by 36 months they had increased by about 30 – 35 dB SPL for 8 & 16 kHz, 25 dB
for 4 & 2 kHz and 19 dB at 1 kHz. Although the human lifespan is much longer, these data
would suggest that degeneration of the auditory system with age is the primary mechanism of
presbycusis.
3.2.1 The pathophysiology of presbycusis
Histopathological studies have shown that presbycusis results due to degeneration of
the sensory, neural, and strial structures of the auditory system (Schuknecht & Gacek, 1993).
Gratton and Schulte (1995) studied the effects of ageing on hearing system of gerbils raised
in quiet. Their results showed that stria vascularis atrophied with age. This was preceded by
changes in the microvascular structure of stria vascularis, beginning in the apical regions of
the cochlea and spreading basally towards the middle turn of the cochlea with increasing age.
As mentioned above, stria vascularis is responsible for creating the endolymph in scala media
and the endocochlear potential allowing the sensory cells to function. Atrophy of stria
vacularis results in a reduction in the endocochlear potential, which is accompanied by a loss
of Na⁺/K⁺-ATPase pump (Schulte & Schmiedt, 1992).
The Na⁺/K⁺-ATPase pump is largely responsible for the transport of ions against a
concentration gradient and is found in abundance in stria vascularis, where it is a vital
contributor to the ion transport involved in the generation of the endocochlear potential

18
(Hibino & Kurachi, 2006; Patuzzi, 2011). The endocochlear potential normally sits around
+90 mV and with ageing this is observed to reduce. If it falls to values of 20 mV or less the
OHCs are considered to be ‘voltage starved’ resulting in a maximum reduction in gain (Gates
& Mills, 2005). Further age-related degeneration is observed in the auditory nerve as a
reduction in the compound action potential (CAP). In ageing animals the CAP is found to be
reduced in amplitude and this can be detected in shifts of auditory thresholds of as little as 5-
10 dB HL. It has been suggested that this may be due to asynchronous neural activity in the
auditory nerve or changes in the threshold quantity of spiral ganglion cells (Hellstrom &
Schmiedt, 1990).
3.2.2 The physiology of hearing in noise
The degradation of sensory and neural structures in individuals with SNHI results in a
reduction in the ability to discriminate changes in frequency in the region affected (Moore,
2007). This loss of frequency discrimination is described by the widening of auditory filters
that occurs with OHC loss. When we attempt to detect signals in the presence of background
noise we make use of auditory filters that are closest to the signal of interest’s frequency. In
normal hearing ears with narrow auditory filters this would provide the greatest signal-to-
noise ratio as narrow bands around the signal frequency can be disrupted without affecting
the signal. In hearing impaired ears where the auditory filters are wider, more noise is
allowed through the filters around the signal frequency. This results in a reduction in the
signal to noise ratio making it more difficult to detect the signal (Moore, 2013).
4 Hearing screening
4.1 What is hearing screening
Hearing screening tests differ from traditional diagnostic hearing testing which aims
to identify an individual’s hearing thresholds across a range of frequencies. Screening tests

19
are designed to identify people likely to have a hearing impairment from those who probably
do not. Hearing screening tests such as the NZHST compare the score achieved on the test to
a range of scores obtained during the development of the test for hearing impaired and
normal hearing participants. A sensitive test can clearly delineate between these populations.
If the score obtained sits in the range of those with hearing impairment rather than those who
do not, it is can be concluded that the individual tested is likely to have a hearing loss. A
diagnostic test is then required to confirm this.
4.2 The efficacy of hearing screening
Typically, hearing assessments are conducted with specialised audiometric equipment
by an audiologist. These assessments take approximately 45 – 60 minutes and are therefore
expensive in addition to being time consuming. Hearing impairment tends to have a gradual
onset and a lack of visible symptoms which cause it to go unrecognized (Liu et al., 2011;
Yueh et al., 2010). It is therefore essential that reliable and cost-effective hearing screening is
available. A variety of hearing screening tools are available to identify those with hearing
impairment and typically don’t require specialised equipment or little to any training in order
to administer them. Due to this, hearing screening tests have been shown to be cost effective
in identifying individuals with hearing impairment and contribute to an increased uptake of
hearing aids (Liu et al., 2011; Yueh et al., 2010).
4.3Speech in Noise Testing
Speech in noise tests function on the principal that individuals with SNHL have an
impaired ability to detect signals in the presence of noise. It is a common complaint of those
with hearing difficulties that background noise further impairs their ability to hear. Studies of
speech perception in the presence of noise have shown that those with hearing impairment
perform worse in these types of tasks than those with normal hearing (Phatak, Brungart, Zion,
& Grant, 2019; Zekveld, Kramer, & Festen, 2011). It is suggested that the increased spread of

20
excitation on the basilar membrane (due to the decrease in frequency selectivity) combined
with the decreased temporal resolution both contribute to the decline in speech perception in
noise (Moore, 2007, 2013). Furthermore, background noise masks the low level transient
consonants, with the louder and longer duration vowel phonemes remaining audible.
(Smaldino, Kreisman, John, & Bondurant, 2015). A reduction in the audibility of consonant
information has a significant impact on speech perception as approximately 80% to 90% of
speech important information is derived from consonants (French & Steinberg, 1947). For
those with age-related hearing impairment this effect can be quite pronounced. Age-related
hearing impairment typically manifests as a loss of high frequency hearing giving rise to
sloping hearing impairment configurations (Allen & Eddins, 2010; Weinstein, 2015). This
further impairs the ability of an individual to access and use consonant information due to the
reduction in audibility of the high frequency contents of speech.
4.4 Psychophysical Test Procedures
To understand the effect hearing impairment has on individuals we need to understand
how we perceive sound. This has rendered a need to develop methods which can quantify our
psychological response to physical stimulus. As discussed prior, there are physiological
correlates to the properties of sound. If these properties were directly related to our
psychological response, we could make accurate inferences about an individual’s perception
of sound however, this is not the case. The field of psychoacoustics is interested in the
relationship between physical auditory stimulus and psychological response. Psychoacoustic
investigation makes use of a variety of testing methods that allow researchers to derive the
participant’s psychometric function. The psychometric function describes the relationship of
the participant’s sensitivity to changes in the stimulus (Dai & Micheyl, 2011). There are three
distinct classical methods used in psychoacoustics to quantify the relationship between
physical stimulus and psychological response, namely the methods of limits, adjustment, and

21
constant stimuli (Gelfand, 2009). In addition to this, there are a variety of adaptive test
procedures which change a physical property of the stimulus on a trial by trial basis based on
the user’s response to the stimulus. These methods are described below.
4.4.1 The Method of Limits
In the method of limits the participant makes responses to the changes in the stimulus
made by the researcher. For example, if we wished to determine the participant’s threshold of
hearing to a test signal, we could present this signal at varying intensity levels and use their
responses to determine their threshold. In this case the researcher may present the signal at an
intensity well above the participant’s threshold of hearing and reduce the intensity by a fixed
amount every time the participant responds to having heard the signal. The trial is terminated
when the participant fails to respond and the threshold for that trial is taken as the midpoint
between the last two trials. This procedure is repeated in reverse with the trial starting well
below the participant’s threshold. In this case the intensity level is increased by a fixed size
until the participant responds to hearing the signal. Again, the threshold for this trail is
recorded as the midpoint between the last two trials. This procedure is repeated multiple
times and the threshold of hearing the signal is calculated as the average of the threshold
found for each trial. Gelfand (2009) notes that the method of limits is subject to response bias
as the participant may exhibit anticipatory behaviour, changing their response before they
reach threshold. This results in better thresholds during ascending runs and poorer thresholds
in descending runs. Furthermore, participants may habituate to the test and respond after
reaching threshold. This increases the error in threshold measurements but can be mitigated
through the randomization of trial starting levels and direction. The method of limits is also
prone to inefficient placement of the stimulus resulting in longer test durations. This can be
mitigated by increasing step size. However, this compromises the estimate of threshold as it
increases the error in the measurement.

22
4.4.2 The Method of Adjustment
The method of adjustment is unique in that the participant controls the stimulus and
that changes to stimulus parameters do not occur in discrete steps but are varied continuously
(Gelfand, 2009). Like the method of limits if we wished to determine threshold the stimulus
could be presented at an intensity above threshold and continuously decreased until it just
inaudible. The reverse of this could be done, increasing intensity until the stimulus is just
audible. Threshold is then determined as the mean of the just audible and just inaudible
values. The method of adjustment is vulnerable to bias and precautions must be taken to
ensure accurate results. Gelfand (2009) suggests that the dial used by the participant must be
unlabelled and have no indents that provide a tactile response. This is designed to remove
positional cues on the dial that may have an anchoring effect on the participant. Furthermore,
a second control may be used by the researcher to vary the initial presentation level. The
method of adjustment may also be biased through persistence of stimulus effects. Persistence
of stimulus results in lower thresholds during descending runs as the participant continues to
respond as if the stimulus is still audible below their threshold. The opposite occurs during
ascending runs.
4.4.3 The Method of Constant Stimuli
The method of constant stimuli presents the stimulus at a variety of levels in a random
order. This procedure is non-sequential as none of the trials are placed in an ascending or
descending fashion (Gelfand, 2009). To determine the participant’s threshold to the stimulus
a variety of presentation levels will be selected that encompass the participant’s threshold.
These are based on a fixed step size and an equal number of presentations will be given at
each level. The participant responds to each trial determining whether they have perceived
the stimulus. These results can be plotted as the percentage of responses against the
23
presentation level. This provides a graph of the psychometric function which can be used to
determine their SRT.
4.4.4 Adaptive procedures: Simple 1-Up 1-Down Procedures
The 1-Up 1-Down adaptive procedure is an efficient way to estimate the speech
reception threshold (SRT) and achieves this by decreasing or increasing the stimulus level by
a fixed step size based on the result of a trial. A correct response results in the level of the
following stimuli to decrease with incorrect trials resulting in an increase in stimulus level.
This results in an alternating pattern of correct and incorrect responses around the participants
SRT. The average of these trials is then given as the participants SRT. The fixed step size
design such of 1-up 1-down procedures result in trials converging around the 50% point of
the psychometric function. Therefore, the SRT describes the point at which the participant
will be able to correctly identify speech material 50% of the time. Plomp and Mimpen
(1979) developed a test for measuring the SRT of sentence lists in quiet or in the presence of
noise. Their test used a 1-Up 1-Down procedure with a 2 dB step size. As a testament to the
reliability of this procedure Plomp and Mimpen (1979) report a standard deviation in SRT of
1 dB across the ten lists they developed. Smits and Houtgast (2006) reviewed the 1-up 1-
down procedure based on the results of 40,000 participants from the Dutch Speech in Noise
Test Telephone Screening Test. Their paper aimed to identify factors that influence the
standard deviation of the SRT of digit triplets in noise based on a calculation model and then
produce optimised speech material for the test. Smits and Houtgast (2006) found the standard
deviation of the SRT for the original speech material was 1.31 dB. This was reduced to 1.12
dB for the optimised speech material. These findings corroborates with that of Plomp and
Mimpen (1979) and further establishes the reliability of the 1-up 1-down adaptive procedure.

24
4.4.5 Adaptive procedures: The Up-Down Transformed Response
Unlike the 1-up 1-down procedure, the Up-Down Transformed response method
(UDTR; Levitt, 1971) is capable of homing in on SRT values other than 50%. The UDTR
achieves this by modifying how stimulus level changes occur. Unlike the 1 up and 1 down
procedure which changes the stimulus level trial by trial the UDTR procedure changes the
stimulus level after a certain sequences of events has occurred (Gelfand, 2009; Levitt, 1971).
Sequences of responses can be categorised as being either an up group response, initiating an
increase in stimulus level or a down group response, initiating a decrease in stimulus.
Varying the types of response sequences that are used in each group is what allows the
procedure to target SRT values other than the 50% point increase. This is determined by the
probability of obtaining a positive response at the target SRT level given the sequence rules
available in each response group. As an example a procedure that wishes to target the 50%
point will consists of 2 sequences. These being, in the event the response is correct the
stimulus level will decrease, and in the event the response is incorrect the stimulus level will.
At intensity levels well above the participants 50% SRT the majority of responses will be
correct and vice versa. It is not until we reach the intensity that corresponds to the
participants 50% SRT that the probability of their being a positive response is 50%, as at this
point it is equally likely that either one of the two response sequences can occur. (Gelfand,
2009). UDTR procedures have been shown to be robust, efficient, simple, and relatively free
of influence from other factors (Levitt, 1971), thus making them ideal for use in automated
hearing screening tests.
4.4.6 Adaptive procedures: Brand and Kollmeier A1 and A2 procedures
Brand and Kollmeier (2002) developed an efficient psychophysical procedure that
determines the speech reception threshold and the slope of the psychometric function
concurrently. Their A1 method targets a single point (the “sweetpoint”) on the psychometric

25
function at the expense of a sub-optimal estimation of the slope of the function. Their A2
method provides accurate estimates of both SRT and slope by using two adaptive tracks that
converge at separate points of the psychometric function. These points referred to as the
“sweetpair” converge at the 8% and the 92% points of the psychometric function. As these
points lie at the extreme ends of the psychometric function, in practice their dual-track
algorithm uses the “pair of compromise”, with corresponds to 19% and 81%. The region
between these points is considered to be linear and these values can then be used to derive the
slope of the psychometric function as well as the speech reception threshold. The procedure
aims to place trials as close to the target level as possible using a unique adaptive procedure
(see Figure 1).
𝛥𝐿 = −𝑓(𝑖). (𝑝𝑟𝑒𝑣 − 𝑡𝑎𝑟)
𝑠𝑙𝑜𝑝𝑒
Figure 1: Brand & Kollmeier’s (2002) adaptive procedure.
Their procedure determines the following presentation level by using the previous trials
discrimination level denoted as prev as an input. The parameter tar is then set to the target
discrimination level desired for procedure. For example, if one wished to determine the SRT
the tar value would be set to 0.5; or in the dual track procedure, 0.2 & 0.8. (Brand &
Kollmeier, 2002). The slope parameter is set to a fixed value. Brand and Kollmeier (2002) set
the slope parameter to 0.15 dB-1 which they found to be appropriate given the test material
used. The f(i) parameter controls the step size and thus the rate at which the tests converges
on the target level. The i parameter denotes the number of reversals. At the start of the
procedure f(i) will be value that is greater than 1. This allows for larger step sizes in the

26
beginning and a higher rate of convergence. As the number of reversals increase f(i)
decreases to stabilise around the target discrimination level (Brand & Kollmeier, 2002).
4.5 The use of Digits in Hearing Screening
Digits have been used extensively in measures of speech perception both clinically
and for research purposes. Digits have been used in speech audiometry (Ramkissoon, Estis, &
Flagge, 2014), tests to diagnose central auditory processing disorder (Fischer et al., 2016;
Tillery, 2015), as well as in studies to identify the effect of contextual cues on speech
intelligibility (Miller, Heise, & Lichten, 1951). Digits have been used to identify the
differences in intelligibility between native and non-native speakers of English (Schmidt‐
Nielsen, 1989). Furthermore digits are extensively used in hearing screening tests (Dillon,
Beach, Seymour, Carter, & Golding, 2016; Elberling, Ludvigsen, & Lyregaard, 1989; Jansen,
Luts, Wagener, Frachet, & Wouters, 2010; King, 2011; Ozimek, Kutzner, Sęk, & Wicher,
2009; Smits, Merkus, & Houtgast, 2006). Digits are appropriate for hearing screening as they
are familiar to most users. Leech, Rayson, and Wilson (2001) noted that digits are some of
the most frequently used words in the English language. Furthermore digits are easy to score
and integrate into automated hearing screening tests. Digits have been shown to be equivalent
in performance to speech materials when used to determine the SRT. Ramkissoon, Proctor,
Lansing, and Bilger (2002) tested the equivalency of digit pairs in comparison to the Central
Institute of the Deaf words (CID) for measuring the SRT among native and non-native
English speakers. Findings from their study indicated that the digit pairs were equivalent to
the CID words and in non-native English speakers the digit pairs were more sensitive to
measuring the participants SRT and matched the participants PTA with increased accuracy.
4.6 The Digit Triplet Test
The Digit Triplet Test (DTT) first developed by Elberling et al. (1989) is a hearing
screening test that has now been developed for distribution over the phone and internet

27
(Smits, Merkus, et al., 2006). Furthermore, versions of the digit triplet test are available in a
wide variety of languages including Finnish, Dutch, French, Danish, Polish, and English
(Dillon et al., 2016; Elberling et al., 1989; Jansen et al., 2010; King, 2011; Ozimek et al.,
2009; Smits, Merkus, et al., 2006). The New Zealand English version of the digit triplet test
the New Zealand Hearing Screening Test (NZHST) initially developed by King (2011) in
conjunction with Prof Greg O’Beirne presents digit triplets (groups of three digits recorded
with a typical New Zealand accent) against noise presented at a fixed level. As with most
digit triplet tests, the NZHST uses a 1-up 1-down adaptive procedure wherein the response
given determines the presentation level of the next triplet. This results in a decline in the
presentation level which is followed by an up and down pattern that converges around the
users mean SRT. The users SRT is then compared to that of the normal hearing population to
determine whether they have a hearing impairment. The initial development began with
creating recorded speech material that was representative of a typical New Zealand English
speaker. King (2011) selected a 26 year old female whose voice was found to be
representative of the New Zealand English accent, confirmed through formant analyses. It is
important to note that the digits 7 (“seven”) and 0 (“zero”) are disyllabic and were removed
in order to preserve the homogeneity of the test material. These digits were then subject to
normalisation procedures that identified which digits produced the steepest psychometric
functions which could then be combined into triplet stimuli garnering a test with greater
sensitivity. These triplets were then combined into 10 triplet lists that were used in the final
test. The noise used was synthesised from the recordings made of the speaker’s voice by
superimposing them upon each other 10,000 times. The resulting noise is spectrally identical
to the stimuli, thus any filtering to the test signal that occurs should not affect the SNR. Upon
verification King (2011) found that the binaurally presented digit triplet test had a test
sensitivity of 100% and specificity of 85%. The binaural results were also found to have a

28
significant correlation to the better ear PTA (r = 0.668, p<0.001). In 2012, development of a
Te Reo Māori version of the NZHST was begun, but has not yet been released, due to the
difficult in finding sufficient numbers of hearing-impaired participants fluent in Te Reo
Māori (Murray, 2012). Further development of the New Zealand English version of the
NZHST was conducted in 2013. Bowden (2013) worked on the development and verification
of an internet and telephone administered versions of the NZHST. Alongside this Bowden
(2013) investigated the effects continuous and spectral temporal gap noise (STG) had on the
performance of the NZHST. Furthermore, modifications were made to the NZHST list
content to ensure an equal distribution of the digits in each position across the triplets used in
the test material. This resulting modification reduced the 10 test lists to the 8 which are
presently used in the NZHST. Bowden (2013) found that performance of the binaurally
presented digit triplet test was comparable to the findings of King (2011), achieving a test
sensitivity and specificity of 94% and 88%. Bowden (2013), found that normal hearing
listeners found it easier to detect the individual digits in the presence of STG noise than in
continuous noise. The mean slope of the psychometric function was found to be shallower
with STG noise (14.1% / dB) than continuous noise (17.9% / dB). This suggests that the use
of STG noise may impair the NZHST test sensitivity due to a reduction in reliability. It is for
this reason that continuous noise is used in the current NZHST.
4.7 Digit versus Triplet scoring in Digit Triplet Tests
There a two ways to score each individual trial in a DTT. Digit scoring takes each
individual element of the triplet and compares it to the response given. When scoring by
digits a response can be proportionally correct based on the number of individual elements
that are identified correctly for their position in the triplet (i.e. 0, 0.33, 0.67, 1) Individual
trials can also be scored by the triplet. This means that the answer given must be identical to
the stimulus presented, resulting in the triplet being scored as either correct or incorrect (i.e.

29
either 0 or 1). Scoring by triplet’s increases sensitivity of the test as it produces steeper
psychometric functions (see Figure 2). This is important as the standard deviation of an SRT
estimate has been shown to be inversely proportional to the slope of the psychometric
function (Brand & Kollmeier, 2002). By enhancing the slope of the psychometric function we
improve the ability of the DTT to provide an accurate and consistent estimation of the SRT
which is essential for the development of a sensitive DTT. During the development of the
Finnish DTT Willberg et al. (2016) compared the procedures using triplet scoring and digit
scoring. Willberg et al. (2016) reported a mean slope of the psychometric function for triplet
testing of 23.4% / dB and 20.2% / dB for digit scoring. Zokoll, Wagener, Brand,
Buschermöhle, and Kollmeier (2012) reported similar findings with the German DTT. In
headphones triplet scoring produced a mean slope of 19.6% / dB and 14.5% / dB for digit
scoring. Given the effect triplet scoring has on the reliability of SRT estimates this method
has been adopted by many DTTs (Bowden, 2013; King, 2011; Ozimek et al., 2009; Zokoll et
al., 2012)

30
Figure 2 : Example of psychometric functions. Note the difference in slope with triplet scoring producing a
significantly steeper slope than digit scoring.
5 Present issues with the current NZHST
Currently the NZHST performs well in a research setting however on its deployment
it has encountered significant issues as a public hearing screening tool. It appears that the
NZHST incorrectly discriminates between individuals with normal hearing and hearing
impairment at a higher rate than expected given that the NZHST achieves a test sensitivity
and specificity of 100 and 85 percent (King, 2011). This has been attributed to several
factors. Firstly the test duration may simply be too long, resulting in participants fatiguing,
giving erroneous answers, and subsequently failing the test. Secondly the test environments
the NZHST is typically deployed in (pharmacies, public outdoor events) have significant
levels of background noise which may interfere with the SNR of presented stimuli,
particularly if the transducers do not sufficiently occlude background noise. This gives test
results that do not truly reflect the participants hearing status.
0
0.2
0.4
0.6
0.8
1
-30 -20 -10 0
Trip
let
Inte
lligi
bili
ty
SNR (dB SNR)
Typical Psychometric Functions Obtained with Triplet and Digit
Scoring
DigitScoring
TripletScoring

31
5.1 Aims of the present study
This studies aims to address the first issue through a novel adaptive procedure that seeks
to shorten the number of stimuli required to obtain an accurate measure of the participants
SRT.
5.2 Hypothesis
It is expected that the novel adaptive procedure will reduce the time taken to complete
the NZHST by reducing the total number of trials required to achieve an accurate estimate of
the participants SRT without, having a detrimental effect on the performance of the test.
6 Test development
6.1 Modifying the adaptive procedure
The current NZHST tests each subject for a total number of 27 trials. This results in
test durations that may reduce the effectiveness of the NZHST as a hearing screening tool. In
order to reduce the overall test duration a different adaptive procedure has been adapted for
use with this test.
The simple 1-Up 1-Down procedure used in most DTTs is computationally-simple to
implement for delivery, as the 2 dB step size means that trials are limited to a finite number
of SNRs. Adaptive procedures that allow placement of trials at any SNR (e.g. by using a
varying non-integer step size) require on-the-fly synthesis of triplets, which has made them
unsuitable for some mass-screening implementations (e.g. those that use the telephone for
delivery). As we are no longer bound by this constraint, it was decided to trial the use of an
adaptive procedure which may provide a better estimate of the SRT in a shorter time. The
procedure chosen for the current study was the Brand & Kollmeier A1 procedure, and its
results are compared here with those using the traditional 1-Up 1-Down method.

32
6.2 Method of Calculating Threshold (i.e. test score)
The scoring method used in the traditional 27-trial DTT involves disregarding first
seven trials, which take the participant down (or up) to the SNR region where their threshold
lies, and then calculating the final score as average of the last 20 SNRs. The first five or six
trials are usually characterised (in normal-hearing participants at least) by a lack of reversals,
as the SNR values range from the starting level of +2 dB SNR down to -6 or -8 dB SNR. In
this thesis, this threshold calculation method will be referred to as the “traditional” method.
In the revised method used in this study, we estimated the score directly from the
psychometric function fitted to the test data. Because the Brand & Kollmeier A1 method
features relatively large step-sizes at the beginning of the test (approx. 5.25 dB prior to the
first reversal), this means that there are fewer trials “wasted” in approaching the SRT region.
Estimates of the psychometric function are therefore able to begin after the 5th-7th trial (see
Figure 3).
After experimenting with simulations, the approach adopted here was to use the
Brand and Kollmeier A1 procedure in “digit scoring” mode during the test itself, so as to
make use of three scorable items in each trial (i.e. the individual digits in each position of the
triplet) and determine the placement of subsequent trials. In this thesis, this threshold
calculation method will be referred to as the “digit” method. Because triplet scoring has been
shown to increase the sensitivity of the test, we examined the effect of converting those
scores (i.e. either 0.00, 0.33, 0.67, 1.00) to their triplet equivalents (i.e. 0.00, 0.00, 0.00, 1.00
respectively), and fitting a psychometric function to that data for the purposes of calculating
the SRT only. In this thesis, this threshold calculation method will be referred to as the
“triplet” method. It is important to note that the conversion to triplet scores was only done at
the end of the test, and did not influence the placement of trials during the adaptive procedure
itself.

33
To enable various test endpoints to be compared, these “digit score” and “triplet
score” estimates of SRT were calculated from the psychometric function after every trial
(after at least one reversal).
7 Verifying the Modified NZHST
7.1 Equipment
Pure tone audiometry was conducted with a GSI 61 audiometer and presented through
3M E-A-RTONE 3A insert earphones or Telephonics TDH 39 supra-aural headphones. The
New Zealand Hearing Screening Test is administered on a windows laptop with the audio
routed through a Sound Blaster SBX and presented to participants through Sennheiser HD
280 headphones. Pure tone audiometry was conducted in a single walled IAC soundproof
booth (Industrial Acoustics Company Ltd), with the NZHST administered in the adjacent
double walled booth.
-20
-15
-10
-5
0
5
1 2 3 4 5 6 7 8 9 10 11 12 13 14 15 16 17 18 19 20 21 22 23 24 25 26 27
Pre
sen
tati
on
Le
vel
Trial No.
Adaptive Tracks of Brand & Kollmeier A1 and 1-Up 1-Down
1-Up 1-Down
Brand & Kollmeier A1
Figure 3 : Example adaptive tracks from the Brand & Kollmeier A1 procedure and 1-Up 1-Down. Note how the A1
procedure has a rapid decline in presentation level in the initial trials

34
7.2 Participants
All participants were required to have given consent to participate prior to
commencement of testing and underwent a diagnostic hearing test (see Appendix 3).
Participants had both of their ears inspected with an otoscope (specialised ear torch) to
inspect their outer and middle ear to ensure it was clear of debris or other pathology that may
affect the results of the hearing test. Following this the participant undertook pure tone
audiometry in an IAC single walled sound booth suitable for clinical testing. This was done
to confirm their hearing status across the frequency range of 250 Hz – 8000 Hz. Participants
with hearing thresholds across this range that were < 21 dB HL were classified with normal
hearing, those with hearing thresholds > 20 dB HL were considered hearing-impaired. In
cases where a conductive component to the hearing impairment was detected, tympanometry
was performed in order to assess the function of the middle ear. A total of 18 normal hearing
participants and 15 hearing impaired participants were recruited for the study. All hearing
impaired participants had a SNHI. The average PTA for normal hearing participants was 2.5
dB HL, SD ± 3.9 dB HL. The average PTA for hearing impaired participants was 34. 8 dB
HL, SD ± 11.8 dB HL. Displayed below is the average threshold level for the frequencies
ranging from 250 Hz – 8000 Hz for the hearing impaired and normal hearing groups. As can
be seen there is a significant difference between the groups. This difference is at its greatest
at high frequencies, reflecting the tendency of those with hearing impairment to have sloping
hearing impairment configurations (see Figure 4).

35
Figure 4 : Mean thresholds of all participants separated by hearing status
7.3 Verification of the Modified NZHST
Following the hearing screening, participants completed the current version of the
NZHST and modified versions of the NZHST concurrently. Participants were instructed that
they would hear a woman’s voice in the presence of noise. They were then to enter the three
digits they heard on the keypad provided. Participants were told that if they were unsure of
what they heard that they should guess as the test will not progress to the next trial without a
three-digit answer. The test lists used were assigned to each participant to ensure that all lists
were equally sampled across both conditions and that identical wordlists weren’t used
consecutively. Participants were assigned one list to be used with the current version of the
NZHST and two lists to be used with the modified version. This order was randomised across
participants.
-10
0
10
20
30
40
50
60
70
80
90
100
110
120
0.25 0.5 1 2 4 8
Itn
en
sity
(dB
HL)
Frequency (kHz)
Mean Thresholds of Hearing (Binaural Average) for Hearing
Impaired and Normal Hearing Participants
Normal Hearing Hearing Impaired Mean Difference

36
8 Results
8.1 Analysis of the results of the Brand and Kollmeier A1 procedure
8.1.1 Test-retest reliability
Of the 33 participants, 1 participant (No. 16) was omitted from measures of test-retest
reliability due to an error that resulted in only one list being administered to them with the
Brand & Kollmeier A1 procedure. Test-retest measures of the Brand & Kollmeier A1
procedure were found by calculating the Pearson’s product moment correlation coefficient of
the SRT estimates of the two Brand & Kollmeier A1 lists administered to each participant.
This was done at Trials 27, 20, 15, and 10, and for both methods of estimating SRT: triplet
scoring and digit scoring. The “traditional” method is not appropriate for the Brand and
Kollmeier procedures, as they were not designed with this scoring method in mind. For triplet
scoring at 10 trials there was a significant correlation of r = 0.47 (p < .05). With an increase
in trial numbers there was an increase in test-retest reliability and by 27 trials there was a
significant correlation of r = 0.77 (p < .05), (see Table 2).
For digit scoring, at 10 trials there was a significant correlation of r = 0.48 (p < .05). Like
triplet scoring there was an observed increase in test retest reliability and by 27 trials there
was a significant correlation of r = 0.71 (p < .05) (see Table 3).
Table 2
Test Retest Reliability of Brand & Kollmeier A1 Procedure (Triplet
Scoring)
Trial No. Correlation (r) Significant (p < .05)
10 0.47 Yes
15 0.61 Yes
20 0.71 Yes
27 0.77 Yes

37
Table 3
Test Retest Reliability of Brand & Kollmeier A1 Procedure (Digit
Scoring)
Trial No. Correlation (r) Significant (p < .05)
10 0.48 Yes
15 0.64 Yes
20 0.70 Yes
27 0.71 Yes
8.1.2 Analyses of slope
The testing procedure allowed for concurrent estimates of the slope to be made for
triplet and digit scoring. Analyses of the triplet slope for the Brand & Kollmeier A1
procedure revealed significant outliers. 5 of the 66 data points (7.8% of points) were trimmed
from the data. This gave a mean estimate of slope for triplet scoring of 16.3% / dB, (SD ±
12.2% / dB) (see Table 4) with a median slope value of 13% / dB (see Figure 5). Untrimmed
data for triplet scoring was essentially meaningless, giving a mean estimate of slope of
509.31% / dB, (SD ± 3627.39 % / dB). The mean estimate of slope for digit scoring was 11.6
% / dB (SD ± 6.4% / dB) (see Table 4) with a median slope value of 10% / dB (see Figure 5).

38
Figure 5 : Slope estimates of Brand & Kollmeier A1 procedure
Table 4
Mean Estimates of Slope for Digit and Triplet Scoring Across Procedures
Brand & Kollmeier A1 1-Up 1-Down
Triplet Scoring 16.3% / dB, SD ± 12.2% 21.5 % / dB, SD ± 10.6%
Digit Scoring 10.0% / dB, SD ± 6.5% 12.5% / dB. SD ± 8.3%

39
8.1.3 Analyses of Order Effect
Each participant was assigned three lists out of the eight available. One of these lists
was assigned to the 1-up 1-down procedure and two of the lists were assigned to the Brand &
Kollmeier A1 procedure. Every participant completed each list-procedure combination in the
order they were assigned. These assignments were made using a Latin Square to
counterbalance any order effects that may occur and to distribute each list-procedure
combination evenly across the three test presentation positions. The digit triplet lists used in
the present study are identical to that of Bowden (2013). Each digit triplet list of has been
shown to be equivalent to one another. Therefore, if order effects are detected they are
unlikely to be due to the composition of the lists. The following analyses will focus on the
effect, if any that the position of presentation had on the test retest reliability for the Brand &
Kollmeier A1 procedure. The Brand and Kollmeier A1 procedure was distributed
approximately evenly across all three test positions with it presented 21 times as the first test
in the sequence (position 1), 23 presentations as the second test (position 2), and 21
presentations as the third test (position 3). This discrepancy is due to the error made in
administering the test to participant No. 16. Analyses of order effects was conducted for the
three methods of scoring.
For triplet scoring, the mean estimate of SRT at trial No. 27 for position 1 is -9.46 dB SD ±
3.01, position 2 is -9.50 dB SD ± 3.00, and position 3 is -10.15 dB SD ± 3.26 (see Figure 6).
A one way analysis of variance (ANOVA) was conducted to investigate the differences
between each test position showed that there was no significant difference (F (2,62) = 0.87,
ns) (see Table 5).
For digit scoring, the mean estimate of SRT at trial No. 27 for position 1 is -12.86 dB SD ±
3.67, position 2 is -13.39 dB SD ± 3.63, and position 3 is -13.71 dB SD ± 3.64 (see Figure 7).

40
ANOVA analysis found no significant difference between each position (F (2,62) = 0.99, ns)
(see Table 6).
Figure 6 : Analyses of order effects. Brand & Kollmeier A1 procedure, triplet SRT. Error bars show the
standard error of the mean
Figure 7 : Analyses of order effects. Brand & Kollmeier A1 procedure, Digit SRT. Error bars show the standard
error of the mean
-15
-14
-13
-12
-11
-10
-9
-8
-7
-6
-5
-4
-3
-2
-1
0
SRT
(dB
)
Mean estimated Triplet SRT at 27 Trials, Brand & Kollmeier
A1 Procedure
Position 1 Position 2 Position 3
-15
-14
-13
-12
-11
-10
-9
-8
-7
-6
-5
-4
-3
-2
-1
0
SRT
(dB
)
Mean estimated Digit SRT at 27 Trials, Brand & Kollmeier A1
Procedure
Position 1 Position 2 Position 3

41
Table 5
ANOVA of Presentation Order and the Estimated Triplet SRT at Trial No 27
Source of Variation SS df MS F P-value F crit
Between Groups 6.50 2 3.25 0.87 0.42 3.15
Within Groups 230.21 62 3.71
Total 236.71 64
Table 6
ANOVA of Presentation Order and the Estimated Digit SRT at Trial No 27
Source of Variation SS df MS F P-value F crit
Between Groups 7.60 2 3.80 0.99 0.38 3.15
Within Groups 237.77 62 3.84
Total 245.38 64
8.1.4 Relationship of the Brand & Kollmeier A1 Procedure and PTA
The relationship of the Brand & Kollmeier A1 procedure to the better ear PTA across
all frequencies was investigated for triplet, digit, and traditional method estimates of SRT. A
Pearson’s product moment correlation coefficient of triplet SRT estimates and better ear PTA
from 250 Hz – 8000 Hz shows a significant correlation for the first presentation of the Brand
and Kollmeier A1 procedure (r =0.72, p < .05). This is also found when correlating the better
ear PTA to the second presentation of the Brand and Kollmeier A1 procedure (r = 0.70, p <
.05) (see Figure 8). For digit scoring there was a significant correlation in the first

42
presentation (r = 0.73, p < .05), as well as in the second presentation (r = 0.63, p < .05) (see
Figure 9).
R² = 0.5156
-14
-12
-10
-8
-6
-4
-2
0
-10 0 10 20 30 40 50 60
SRT
(dB
SN
R)
Average PTA (dB HL)
Linear Regression of PTA (0.25-8 kHz) and estimated
Triplet SRT at 27 trials (1st Presentation)
R² = 0.4926
-14
-12
-10
-8
-6
-4
-2
0
-10 0 10 20 30 40 50 60
SRT
(dB
SN
R)
Average PTA (dB HL)
Linear Regression of PTA (0.25-8 kHz) and estimated
Triplet SRT at 27 trials (2nd Presentation)
Figure 8 : Scatter plot showing the relationship of triplet SRT to PTA for the Brand & Kollmeier A1 procedure. Green data points represent participants with normal
hearing. Red data points represent participants with hearing impairment

43
R² = 0.5266
-18
-16
-14
-12
-10
-8
-6
-4
-2
0
-10 0 10 20 30 40 50 60
SRT
(dB
SN
R)
Average PTA (dB HL)
Linear Regression of PTA (0.25-8 kHz) and estimated Digit
SRT at 27 trials (1st Presentation)
R² = 0.4024
-18
-16
-14
-12
-10
-8
-6
-4
-2
0
-10 0 10 20 30 40 50 60
SRT
(dB
SN
R)
Average PTA (dB HL)
Linear Regression of PTA (0.25-8 kHz) and estimated Digit
SRT at 27 trials (2nd Presentation)
Figure 9 : Scatter plot showing the relationship of digit SRT to PTA for the Brand &
Kollmeier A1 procedure. Green data points represent participants with normal hearing. Red
data points represent participants with hearing impairment

44
8.1.5 ROC Analyses
Analyses of the receiver operating characteristic curve (ROC) is used to determine the
optimum SRT cut off value that would produce the most sensitive and specific test. In the
present study optimising test sensitivity and specificity is important as it maximises the
ability of the test to accurately detect and identify the presence of a hearing impairment. The
ROC curve plots the true positive rate (sensitivity) against the false positive rate (1 –
specificity). The area underneath the ROC curve (AUC) can also be used to evaluate the
diagnostic power of a test (Unal, 2017). In the present study ROC analyses were done for
triplet, digit, and traditional estimates of SRT. ROC curves were also generated for trials 27
through to 15. For the Brand and Kollmeier A1 procedure each participant was administered
the test twice resulting in 66 trials at each trial level with which to create the ROC curves
with. Overall performance in the Brand & Kollmeier A1 procedure was poor. Poor
morphology of the ROC curves makes it difficult to identify which trial level produces is
optimal (see Figure 10) Due to this the AUC was used to identify the curve which indicated
optimal performance.
For triplet scoring AUC values range between 0.82 and 0.76 (see Table 7). The optimal ROC
curve based on the AUC was achieved by 18 trials for triplet SRT estimation. Test sensitivity
and specificity as determined by the Youden index at this point is 62% and 95% with a cut-
off SRT of -8.9 (see Figure 11).
For digit scoring AUC values range between 0.74 and 0.65 (see Table 8). The optimal ROC
curve for digit scoring was obtained by 18 trials with a test sensitivity and specificity of 77%
and 72% (see Figure 11).

45
Figure 10 : Plot of ROC curves for the Brand & Kollmeier A1 procedure.
Figure 11 : Optimal ROC curves for the Brand & Kollmeier A1 procedure based on the triplet and digit scoring
methods. The marker on each curve is the point identified by the Youden index as having optimal test sensitivity
and specificity.
0.000
0.100
0.200
0.300
0.400
0.500
0.600
0.700
0.800
0.900
1.000
0.000 0.200 0.400 0.600 0.800 1.000
Sen
siit
vity
1 - Specifcity
Optimal ROC Curves for Brand & Kollmeier A1 Procedure
Triplet Digit
0.000
0.100
0.200
0.300
0.400
0.500
0.600
0.700
0.800
0.900
1.000
0.000 0.100 0.200 0.300 0.400 0.500 0.600 0.700 0.800 0.900 1.000
Sen
stiv
ity
1 - Specificity
ROC Analyses of Brand & Kollmeier A1 Procedure with Triplet
Scoring
Trial 27 Trial 26 Trial 25 Trial 24 Trial 23 Trial 22 Trial 21Trial 20 Trial 19 Trial 18 Trial 17 Trial 16 Trial 15

46
Table 7
ROC Analyses of Brand and Kollmeier A1 Procedure with Triplet Scoring
Trial No. AUC Sensitivity Specificity Cut-off SRT (dB)
27 0.764 58% 95% -9.1
26 0.767 57% 95% -8.9
25 0.756 57% 95% -9.0
24 0.760 58% 95% -9.1
23 0.771 62% 95% -9.1
22 0.763 62% 95% -9.2
21 0.768 62% 95% -8.9
20 0.784 62% 95% -8.8
19 0.791 62% 95% -8.9
18* 0.819 62% 95% -8.9
17 0.807 62% 95% -8.9
16 0.805 62% 92% -8.9
15 0.788 62% 92% -8.9
Sensitivity, Specificity, and Cut-off SRT are determined by the Youden Index. The * denotes the trial level which produced optimal performance as based on the AUC

47
Table 8
ROC Analyses of Brand and Kollmeier A1 Procedure with Digit Scoring
Trial No. AUC Sensitivity Specificity Cut-off SRT (dB)
27 0.649 46% 92% -12.5
26 0.651 42% 92% -12.4
25 0.645 35% 97% -11.2
24 0.661 58% 77% -13.4
23 0.671 58% 77% -13.0
22 0.687 58% 77% -13.5
21 0.713 65% 69% -13.5
20 0.727 73% 67% -13.9
19 0.739 69% 72% -13.3
18* 0.740 77% 69% -13.4
17 0.725 77% 69% -13.4
16 0.718 77% 69% -13.5
15 0.701 77% 64% -13.6
Sensitivity, Specificity, and Cut-off SRT are determined by the Youden Index. The * denotes the trial level which produced optimal performance as based on the AUC

48
8.2 Analyses of the 1-up 1-down Procedure
8.2.1 Analyses of Order Effects
Each participant was assigned 1 list from the 1-up 1-down procedure, aside from
participant No. 16 who had two lists administered to them. This resulted in a total of 34 lists
being administered across the 3 test positions. These were assigned using a Latin square and
were distributed approximately equally across each test position, with 12 presentations
delivered as the first test in the sequence (position 1), 10 presentations as the second test
(position 2), and 12 presentations as the third test (position 3). Statistical analyses were
carried out to ensure that the test order did not affect performance.
The mean estimate of Triplet SRT for 27 trials was found to be -10.1 dB, SD ± 1.9 in test
presentation position 1, -10.4 dB, SD ± 1.7 in position 2, and -9.5 dB, SD ± 1.4 (see Figure
12). A one way ANOVA was use to investigate the differences between estimated triplet SRT
in each test position and showed that there were no significant differences between the groups
(F (2,31) = 0.94, ns) (see Table 9).
The mean estimate of the digit SRT for 27 trials was found to be -12.7 dB, SD ± 2.1 in test
presentation position 1, -13.4 dB, SD ± 2.1 in position 2, and -13.3 dB, SD ± 2.7 in position 3
(see Figure 13). An ANOVA revealed no significant differences between digit SRT estimates
for each test presentation position (F (2,31) = 0.28, ns) (see Table 10).
The mean estimate of traditional SRT was found to be -10.0 dB, SD ± 2.0 in position 1, -10.2
dB, SD ± 1.5 in position 2, and -9.3 dB, SD ± 1.5 (see Figure 14). An ANOVA revealed no
significant differences between traditional SRT estimates for each test position (F (2,31) =
0.85, ns) (see Table 11).

49
Figure 12 : Analyses of order effects, 1-Up 1-Down, with triplet scoring.
Figure 13 : Analyses of order effects, 1-Up 1-Down, with digit scoring.
-15
-14
-13
-12
-11
-10
-9
-8
-7
-6
-5
-4
-3
-2
-1
0
SRT
(dB
SN
R)
Mean estimated Triplet SRT at 27 Trials, 1-up 1-down
Procedure
Position 1 Position 2 Position 3
-15
-14
-13
-12
-11
-10
-9
-8
-7
-6
-5
-4
-3
-2
-1
0
SRT
(dB
SN
R)
Mean estimated Digit SRT at 27 Trials, 1-up 1-down Procedure
Position 1 Position 2 Position 3
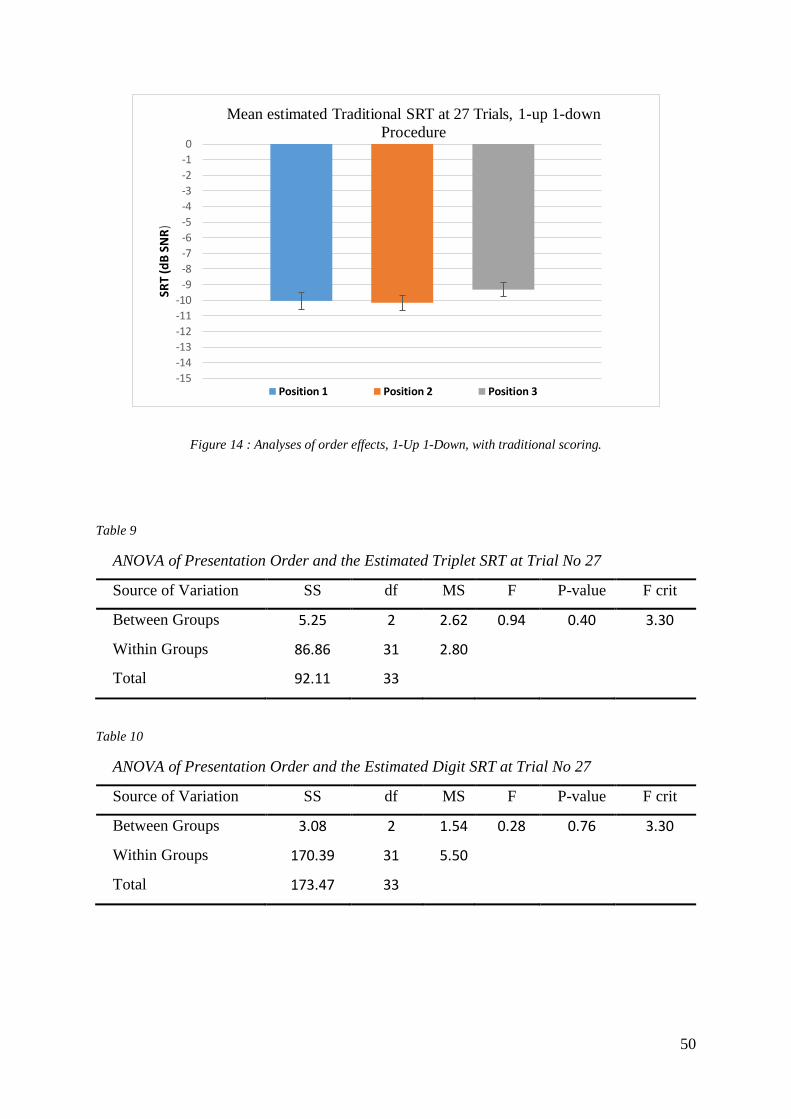
50
Figure 14 : Analyses of order effects, 1-Up 1-Down, with traditional scoring.
Table 9
ANOVA of Presentation Order and the Estimated Triplet SRT at Trial No 27
Source of Variation SS df MS F P-value F crit
Between Groups 5.25 2 2.62 0.94 0.40 3.30
Within Groups 86.86 31 2.80
Total 92.11 33
Table 10
ANOVA of Presentation Order and the Estimated Digit SRT at Trial No 27
Source of Variation SS df MS F P-value F crit
Between Groups 3.08 2 1.54 0.28 0.76 3.30
Within Groups 170.39 31 5.50
Total 173.47 33
-15
-14
-13
-12
-11
-10
-9
-8
-7
-6
-5
-4
-3
-2
-1
0
SRT
(dB
SN
R)
Mean estimated Traditional SRT at 27 Trials, 1-up 1-down
Procedure
Position 1 Position 2 Position 3
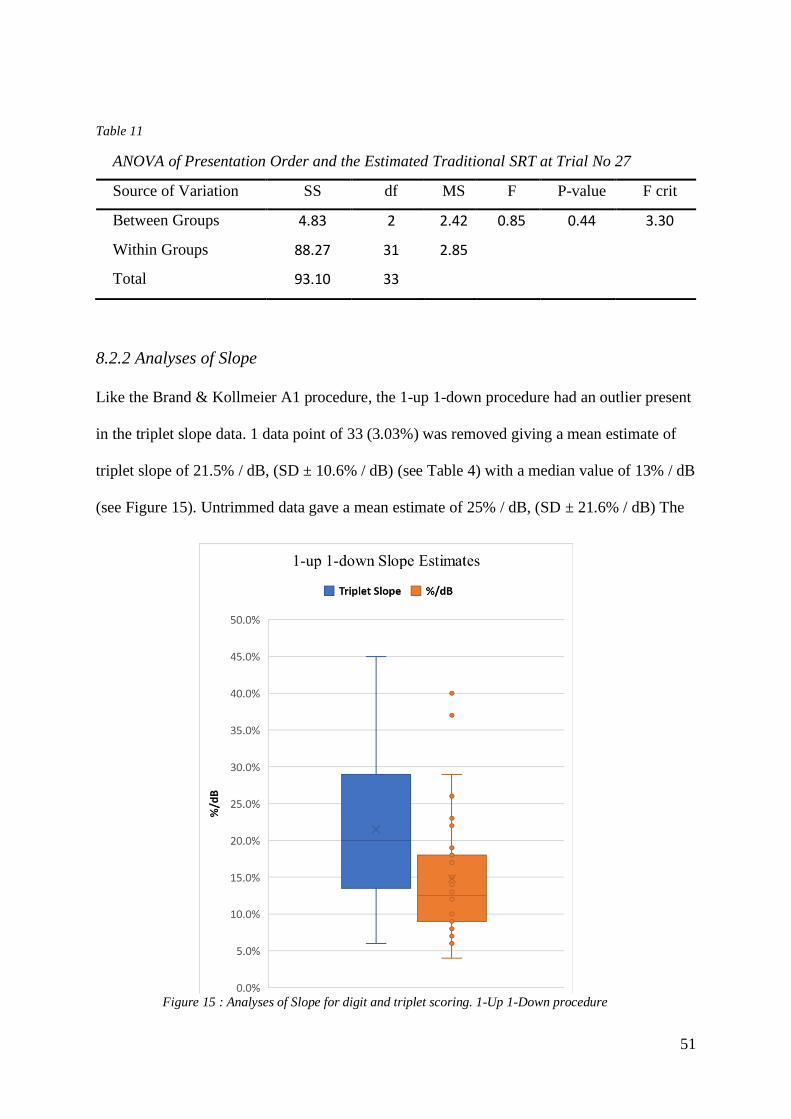
51
Table 11
ANOVA of Presentation Order and the Estimated Traditional SRT at Trial No 27
Source of Variation SS df MS F P-value F crit
Between Groups 4.83 2 2.42 0.85 0.44 3.30
Within Groups 88.27 31 2.85
Total 93.10 33
8.2.2 Analyses of Slope
Like the Brand & Kollmeier A1 procedure, the 1-up 1-down procedure had an outlier present
in the triplet slope data. 1 data point of 33 (3.03%) was removed giving a mean estimate of
triplet slope of 21.5% / dB, (SD ± 10.6% / dB) (see Table 4) with a median value of 13% / dB
(see Figure 15). Untrimmed data gave a mean estimate of 25% / dB, (SD ± 21.6% / dB) The
Figure 15 : Analyses of Slope for digit and triplet scoring. 1-Up 1-Down procedure

52
mean estimate of digit slope was found to be 14.8% / dB, (SD ± 8.3% / dB) (see Table 4)
with a median value of 12.5% / dB (see Figure 15).
8.2.3 Relationship of the 1-up 1-down Procedure and PTA
A Pearson’s product moment correlation coefficient between the pure tone average of
the better ear at frequencies from 250-8000 Hz and estimates of SRT based on triplet scoring
showed a significant correlation of r = 0.66, (p < .05) (see Figure 16). For digit scoring there
was a significant correlation of r = 0.63, (p < .05) (see Figure 17). For traditional scoring
there was a significant correlation of r = 0.69, (p < .05) (see Figure 18).
Figure 16 : Relationship of PTA to triplet SRT estimates for the 1-Up 1-Down procedure. Green data points
represent participants with normal hearing. Red data points represent participants with hearing impairment
R² = 0.4388
-16
-14
-12
-10
-8
-6
-4
-2
0
-10 0 10 20 30 40 50 60
SRT
(dB
SN
R)
Average PTA (dB HL)
Linear Regression of PTA (0.25-8 kHz) and Estimates Triplet SRT at
27 Trials (1-Up 1-Down)

53
Figure 17 : Relationship of PTA to digit SRT estimates for the 1-Up 1-Down procedure. Green data points
represent participants with normal hearing. Red data points represent participants with hearing impairment
Figure 18 : Relationship of PTA to Traditional SRT estimates for the 1-Up 1-Down procedure. Green data
points represent participants with normal hearing. Red data points represent participants with hearing
impairment
R² = 0.3946
-20
-18
-16
-14
-12
-10
-8
-6
-4
-2
0
-10 0 10 20 30 40 50 60
SRT
(dB
SN
R)
Average PTA (dB HL)
Linear Regression of PTA (0.25-8 kHz) and Estimates Digit SRT at 27
Trials (1-Up 1-Down)
R² = 0.4766
-14
-12
-10
-8
-6
-4
-2
0
-10 0 10 20 30 40 50 60
SRT
(dB
SN
R)
Average PTA (dB HL)
Linear Regression of PTA (0.25-8 kHz) and Estimates Traditional SRT
at 27 Trials (1-Up 1-Down)

54
8.2.4 ROC analyses
Based on 34 trials, ROC analyses of the 1-up 1-down procedure was undertaken for
triplet, digit, and traditional scoring methods. This was done for trials 19 through to 27. Like
the Brand & Kollemeier A1 procedure, morphology of the ROC curves made it difficult to
visually identify which trial level produced optimal performance, and so again the AUC was
used to make this determination.
For triplet scoring AUC values ranged between 0.76 and 0.70 (see Table 12).
Analyses of the ROC curves revealed that optimum performance for triplet SRT estimates
was achieved at trial No. 27, giving a test sensitivity and specificity of 64% and 80% (see
Figure 19).
For digit scoring AUC values ranged between 0.65 and 0.56 (see Table 13). Analyses
of the ROC curves values showed that optimum performance was achieved at trial 27, giving
a test sensitivity and specificity of 43% and 100% (see Figure 19).
For traditional scoring AUC values range between 0.77 and 0.71 (see Table 14).
Analyses of the ROC curves shows that optimal performance was achieved by trial No. 27,
achieving a test sensitivity and specificity of 71% and 80% (see Figure 19).
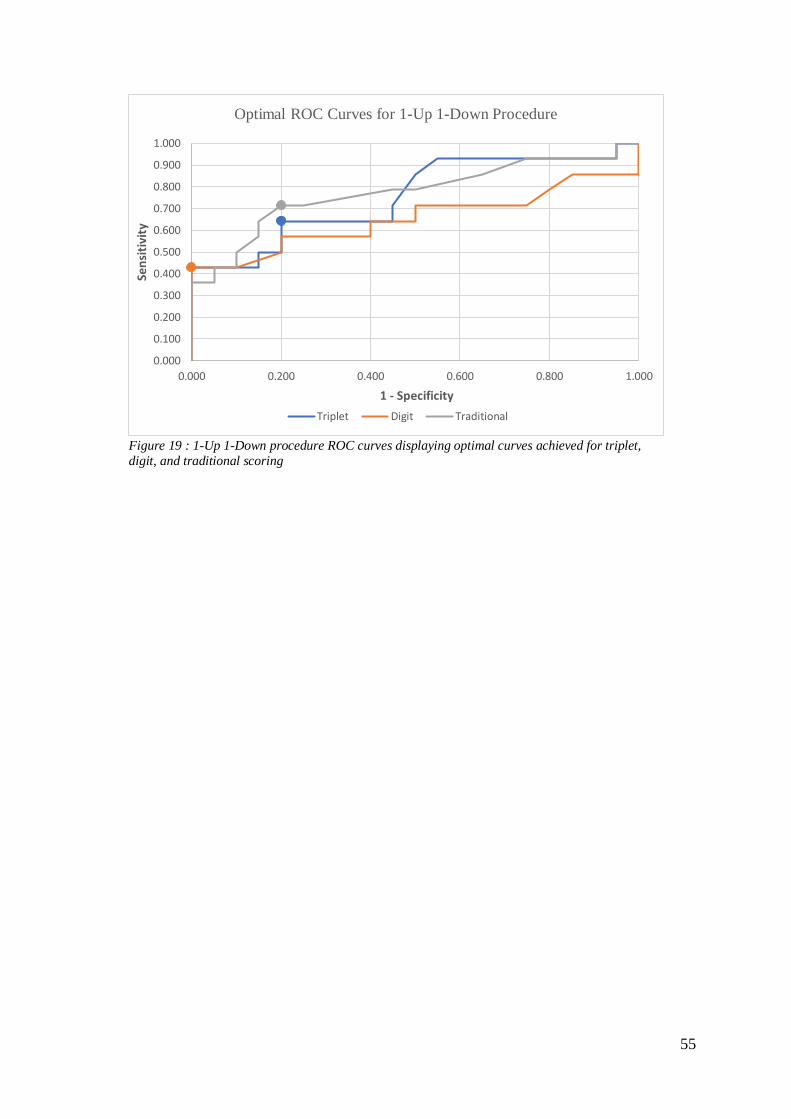
55
0.000
0.100
0.200
0.300
0.400
0.500
0.600
0.700
0.800
0.900
1.000
0.000 0.200 0.400 0.600 0.800 1.000
Sen
siti
vity
1 - Specificity
Optimal ROC Curves for 1-Up 1-Down Procedure
Triplet Digit Traditional
Figure 19 : 1-Up 1-Down procedure ROC curves displaying optimal curves achieved for triplet,
digit, and traditional scoring

56
Table 12
ROC Analyses of 1- Up 1-Down Procedure with Triplet Scoring
Trial No. AUC Sensitivity Specificity Cut-off SRT (dB)
27* 0.755 64% 80% -9.6
26 0.730 43% 95% -9.1
25 0.739 57% 85% -9.7
24 0.696 50% 95% -8.9
23 0.716 50% 90% -9.1
22 0.721 50% 95% -9.1
21 0.727 57% 90% -9.5
20 0.721 50% 100% -8.8
19 0.714 57% 90% -9.2
Sensitivity, Specificity, and Cut-off SRT are determined by the Youden Index. The * denotes the trial
level which produced optimal performance as based on the AUC

57
Table 13
ROC Analyses of 1- Up 1-Down Procedure with Digit Scoring
Trial No. AUC Sensitivity Specificity Cut-off SRT (dB)
27* 0.654 43% 100% -11.2
26 0.639 43% 100% -10.9
25 0.634 43% 100% -10.9
24 0.629 43% 100% -11.2
23 0.593 43% 100% -11.2
22 0.577 43% 100% -11.2
21 0.568 43% 100% -11.2
20 0.579 43% 100% -11.0
19 0.564 43% 95% -11.1
Sensitivity, Specificity, and Cut-off SRT are determined by the Youden Index. The * denotes the trial
level which produced optimal performance as based on the AUC

58
Table 14
ROC Analyses of 1- Up 1-Down Procedure with Traditional Scoring
Trial No. AUC Sensitivity Specificity Cut-off SRT (dB)
27* 0.773 71% 80% -9.9
26 0.766 71% 80% -9.9
25 0.759 50% 95% -8.9
24 0.764 57% 90% -9.1
23 0.763 57% 90% -9.1
22 0.770 57% 90% -9.1
21 0.760 64% 80% -9.4
20 0.746 64% 85% -9.1
19 0.716 64% 80 -9.3
Sensitivity, Specificity, and Cut-off SRT are determined by the Youden Index. The * denotes the trial level which produced optimal performance as based on the AUC
In summary, across all scoring methods, the Brand and Kollmeier A1 procedure reached their
maximum AUC (mean 0.78 ± 0.06) at 18 trials, whereas the 1-up 1-down procedures
required all 27 trials to reach their maximum AUC (mean 0.73 ± 0.06). This provides partial
confirmation of our hypothesis that the novel adaptive procedure would reduce the time taken
to complete the NZHST without having a detrimental effect on the test. The qualifier is given
because the 1-up 1-down method demonstrated a steeper slope of the resulting psychometric
function than did the B&K method with both digit and triplet scoring methods.

59
9 Discussion
9.1 Hearing impairment and hearing screening
Hearing impairment adversely effects many individuals. Within New Zealand the
number of individuals who will struggle with hearing impairment is expected to increase
significantly due to our ageing population (Exeter et al., 2015). Hearing impairment has been
shown to have detrimental effects on psychosocial outcomes, and is related to higher rates of
depression (Gopinath et al., 2009), a reduction in independence (Schneider et al., 2010),
poorer employment outcomes (Winn, 2007), and is associated with higher rates of cognitive
decline (Lin et al., 2013). Age-related hearing impairment is particularly concerning because,
due to the degenerative processes involved and a lack of visible symptoms, the gradual
change in hearing that occurs often goes undetected for extended periods of time (Liu et al.,
2011).
Traditionally, hearing testing is conducted with qualified personnel using specialised
equipment and can take upwards of an hour to complete. This makes it time consuming and
expensive, both of which are significant barriers to accessing healthcare. The use of hearing
screening measures to reduce the cost and time involved have been shown to be efficacious in
the early identification of hearing impairment (Liu et al., 2011; Yueh et al., 2010). Hearing
screening tests are now available that are self-administered and require no specialised
equipment. These tests have been administered via the phone and internet (Smits, Merkus, et
al., 2006), and are therefore easily accessible by the general public. Hearing screening tests
have been shown to increase the uptake of hearing aids (Liu et al., 2011; Yueh et al., 2010),
which is remarkably low among those with hearing impairment (Golub et al., 2018; Kim,
2015; Smits, Kramer, et al., 2006). Hearing screening tests serve an important function for
public health outcomes and are essential in the early identification of hearing impairment and
the subsequent undertaking of remedial action.

60
9.2 Speech in Noise Testing
A common complaint of those with hearing impairment is an inability to hear well in
the presence of background noise. Studies of speech perception in noise have shown that
individuals with hearing impairment perform significantly worse than individuals with
normal hearing (Phatak et al., 2019; Zekveld et al., 2011). This has been attributed to
masking effects reducing the audibility of low level transient information in speech
(Smaldino et al., 2015) and a further reduction in access to phonemic content (French &
Steinberg, 1947). It is this principal that allows speech and noise tests to delineate between
normal hearing and hearing impaired individuals. Speech in noise tests measure an
individual’s ability to detect a signal in the presence of noise, quantified as a threshold signal-
to-noise ratio in dB SNR. Those with hearing impairment will require larger signal to noise
ratios to detect the signal of interest than those with normal hearing.
The present study concerns the Digit Triplet Test (DTT), which uses digit triplets
(sequences of three digits) presented in the presence of background noise to determine the
users SRT. The SRT estimate is typically found using an adaptive procedure that adjusts the
presentation level of the next trail based on the participant’s response. Their SRT is then
compared to that of a normal hearing population to determine whether or not they may have a
hearing impairment. Many DTTs have been created for a variety of languages and have been
successfully implemented throughout the world (Dillon et al., 2016; Elberling et al., 1989;
Jansen et al., 2010; King, 2011; Ozimek et al., 2009; Smits, Merkus, et al., 2006). Initial
development of the New Zealand English DTT the NZHST began in 2011. King (2011)
recorded and normalised speech material for the NZHST. On verification, the NZHST when
binaurally presented was found to perform well, achieving a test sensitivity and specificity of
100% and 85%. Further refinement was made to the English version of the NZHST in 2013.
Bowden (2013) made further refinements to the NZHST which resulted in 8 new lists of

61
speech material being developed from the recordings made by King (2011). These changes
were made to ensure the distribution of digits was equal among the test lists. Bowden (2013)
upon verification found that the NZHST with binaural presentation achieved a test sensitivity
and specificity of 94% and 88%. It is this version of the test that was released to the public
and was successfully rolled out nationwide.
9.3 Performance in the Present Study
The present study compared the performance of the 1-up 1-down procedure used by
King (2011) & Bowden (2013) with a new novel procedure that makes use of the Brand &
Kollmeier A1 adaptive procedure. The Brand & Kollmeier A1 procedure places trials based
on the results of scoring each triplet with digit scoring. Concurrently, a running estimate of
the SRT based on triplet scoring is made trial by trial to determine if the participant has a
hearing impairment or not. Triplet scoring is used as it has been shown to be a more reliable
method of estimating the SRT and increases test sensitivity (Brand & Kollmeier, 2002). The
measures of performance used in the present study are test sensitivity and specificity as
determined by an ROC curve, the area under the curve, and the slope of the psychometric
function. Analyses of overall test performance was also completed for SRT estimates made
with triplet, digit, and traditional scoring methods. Triplet scoring requires that each digit is
identified correctly resulting in binary scoring of the triplet (ie; 0 or 1), digit scoring allows
for a proportionally correct answer on the number of digits identified correctly in the triplet
(ie; 0, 0.33, 0.67, 1), traditional scoring disregards the scores of the first seven trials and takes
the average of the last 20 to determine the participants SRT. In the present study both
procedures produced ROC curves with poor morphology making it difficult to identify which
trial level and scoring type produced optimal performance. We have therefore used the area
under the curve to determine which condition produced optimal performance.

62
9.3.1 Measures of Reliability
Measures of reliability for each procedure were determined in the present study by
analysing the slope of the psychometric functions for digit and triplet scoring. In addition to
this, the Brand & Kollmeier A1 procedure was administered twice so a direct measure of test
retest reliability could be made. Analyses of the slope data shows that triplet scoring produces
steeper slopes than digit scoring for both procedures. This aligns with what was reported by
Brand & Kollmeier (2002). When comparing procedures it can be seen that the 1-Up 1-Down
procedure produces steeper slope values for both digit and triplet scoring (12.5 % & 12.5 % /
dB) than the Brand & Kollmeier A1 (10.0% & 16.3% / dB) (see Table 4). In applications
where accuracy of individual measurements is important (such as in within subject designs) it
may be preferable to administer the NZHST in a configuration that produces the steepest
psychometric function at the expense of diagnostic power. Analyses of test retest reliability
for the Brand & Kollmeier A1 procedure by correlating the results from the first and second
presentation of the procedure show an increase in test retest reliability with increasing
numbers of trials (see Table 2 & Table 3). Traditional scoring produced the largest
statistically significant correlation of r = 0.86 whereas digit produced the lowest of r = 0.71.
When comparing the average slope values in the present study to that of King (2011) and
Bowden (2013) it is important to note that the equivalent procedure in the present study is the
1-Up 1-Down with triplet scored SRT estimation and the slope values reported by King and
Bowden are calculated not measured like in the present study. King (2011) reported a mean
slope of 17.3% / dB, SD ± 3.9 %, and Bowden (2013) reported a mean slope of 15.8% / dB,
SD ± 2.3%. In the present study for the equivalent procedure the mean slope value of 21.5 %
/ dB, SD ± 10.6% was measured. The greater variability observed in the present study is
likely due to the inter-individual differences in performance of participants. Though a direct
comparison can’t be made to previous studies. The test material used in the present study is

63
identical to Bowden (2013) therefore we can conclude that on average the reliability of triplet
scored SRT estimates that are measured is greater than what is predicted by the calculated
slope estimate of Bowden (2013).
9.3.2 Diagnostic Power
For the Brand & Kollmeier A1 procedure optimal performance was found when using
the triplet scoring method. This occurred at trial No. 18 giving an AUC of 0.819 and a test
sensitivity and specificity of 62% and 95%. For the 1-Up 1-Down procedure optimal
performance was found using the traditional scoring method. This occurred at trial No. 27
with an AUC of 0.773, giving a test sensitivity and specificity of 71% and 80%. This would
suggest that the Brand & Kollmeier A1 procedure is better in terms of diagnostic power.
Furthermore, the Brand & Kollmeier A1 procedure arrives at this result in significantly fewer
trials. This is also observed when looking at the different scoring methods with digit soring
producing optimal performance by the 18th trial and traditional scoring producing optimal
performance by the 23rd trial. For all scoring methods in the 1-Up 1-Down optimal
performance was achieved by 27th trial. The observation is easily explained by the reduction
in error that occurs when averaging due to an increase in sample size, this translates to an
increase in the AUC with increasing numbers of trials. This effect however is not observed in
the Brand & Kollmeier A1 procedure. The procedure is designed to rapidly descend to the
participants SRT and allows the test to begin making an accurate estimate of the SRT sooner.
However performance appear to reach optimal performance by the 18th trial (for digit and
triplet scoring) and then began to decline with increasing numbers of trials. For triplet scoring
the AUC had dropped from 0.819 to 0.764 by the 27th trial. This may be due to the
characteristic of the Brand & Kollmeier A1 procedure (and found in numerous other adaptive
procedures) whereby the step size decreases with increasing numbers of reversals. To make
an accurate estimate of SRT there needs to be trials placed above and below the participants’

64
true threshold. What may be occurring in the later trials of the test is that a decrease in step
size results in the majority of trials being placed above or below the participant’s threshold
affecting the accuracy of the running estimate of SRT. This could occur when a large step
size is made that results in a reversal. Following this the decrease in step size results in
multiple trials being placed above or below the participant’s threshold. This in turn effects the
accuracy of the running SRT measurement until another reversal is achieved giving the test
values that are presumably below the participant’s threshold to make an estimate of the SRT
with. This phenomena is somewhat observable in Figure 3 where it can be seen that reversals
in the adaptive track occur less frequently when compared to the adaptive track of the 1-Up
1-Down procedure. Presumably this effect would diminish with increasing numbers of trials
and reversals as the step size cannot fall below a minimum value for the Brand & Kollmeier
A1 procedure essentially rendering it to be identical to the 1-Up 1-Down procedure.
Overall both procedures in the present study performed poorly and would not be fit
for purpose as diagnostic screening tools. The Brand & Kollmeier A1 procedure had a test
sensitivity and specificity of 62% and 95%. The 1-Up 1-Down procedure had a test
sensitivity and specificity of 71% & 80%. These values are far from what was reported by
Bowden (2013) (94% & 88%) and King (2011) (100% & 85%). This result and the
implications it has will be discussed in further detail below.
9.4 The Observed Performance Discrepancy
More interesting is the discrepancy in performance found in the 1-Up 1-Down
procedure in the present study when compared to the performance of the same procedure in
King (2011) and Bowden (2013). It is reasonable to expect that the performance of the
procedure would be similar to that of the previous studies and in particular to that of Bowden
(2013) whose test material is identical to that of the present study. This discrepancy may be
due to one or more of the following:
65
• A systematic error may have occurred during the administration of the test
• The test populations were not a good representation of normal hearing and
hearing impaired people
• The procedures used across the present study, King (2011), and Bowden
(2013), were not comparable to each other and produced different results
• Results from current study were a true representation of the performance of
the NZHST
• Some effect has been observed that impairs the diagnostic power of the
NZHST in the present study
A review was made of the procedure used to verify the NZHST in the present study in
order to determine whether an error had occurred that would adversely affect the performance
of the test. One query that was made due to an observation by the researcher was that very
few subjects opted to adjust the intensity that the test was presented at. On a case by case
basis there were numerous participants with significant hearing impairments that did not
require the test to be set louder than their normal hearing peers. However this does not
describe the discrepancy in performance observed as the NZHST should be unaffected by
changes in the overall presentation level as long as it is sufficiently audible. Furthermore the
test environment was suitable for the purpose of audiological research with minimal levels of
background noise present. We are therefore unable to identify any errors that may have
occurred during the verification of the NZHST that may have affected the outcome in the
present study.
The present study found 18 normal hearing participants and 15 hearing impaired
participants for the verification portion of the study. All participants were found to be suitable
for the study (ie; SNHI for hearing impaired participants and no evidence of middle ear
pathology). Ideally, all hearing participants recruited would have had a PTA in the lower end

66
of the mild range (21-40 dB HL). This would ensure that if the test performed well it was due
to the diagnostic power of the test. Due to difficulty in recruiting hearing impaired
participants in this range there is a wider spread of PTA value for the better hearing ear. For
hearing impaired participants the average PTA in the better ear was 34.8 dB HL, SD ± 11.8
dB HL. The average PTA for normal hearing participants was 2.5 dB HL, SD ± 3.9 dB HL.
The separation in PTA between the groups is large and in the present study the poor
performance observed cannot be attributed to insufficient statistical power. If anything this
has provided the means for the test to perform to its greatest extent which shows definitively
that the test performed poorly.
The procedure used in the present study is similar to that of how the current NZHST
is administered in the real world wherein the overall presentation level is adjustable to how
the participant desires. This differs from the previous studies where the presentation level was
fixed at a calibrated level for all participants. Both Bowden (2013) and King (2011) used a
fixed level of 65 dB A for their presentation level. As mentioned prior this should not have
contributed to the discrepancy in performance observed between previous studies and the
present. In the present study the NZHST was presented through headphones. King (2011)
also presented the NZHST with headphones. Bowden (2013) on the other hand presented the
NZHST through speakers in the sound field for binaural presentation. Across all three studies
a similar experimental approach was taken with participants having their hearing assessed
before completing the NZHST. Participants were also instructed in a similar fashion, being
told what to expect, and how to respond if they were unsure of what they heard. For all
intents and purposes the procedural design appears to have been comparable to the previous
studies. Though results obtained in the present study cannot be directly compared to King
(2011) and Bowden (2013) due to the use of a non-calibrated presentation level and in the
case Bowden (2013) the use of headphones vs free field speakers.

67
As has been noted the performance of the NZHST has been identified as being poorer
than what is expected on its deployment. This has been attributed to participant fatigue due to
the long duration of the test and significant levels of background noise in the locations the
test is deployed in. In the present study an analyses was done to determine if order effects
were present. Test conditions were assigned to each participant using a latin square in order
to evenly distribute each test condition across each test presentation position. This means that
if any order effect was observed it would likely be due to participant fatigue. This was an
inherent risk in the study design. However, the analyses shows there is no statistically
significant difference for the mean SRT of tests presented in the first, second, and third test
presentation positions for all three types of SRT estimation. Bowden (2013) also reported
this. This suggests that there was no significant effect of fatigue in the present study. It is
worth noting that the NZHST that has been deployed for use by the public requires
participants to fill in a questionnaire as well as submit their personal information. The
NZHST is presented monaurally, once to the left ear, and once to the right effectively
doubling the duration of the test compared to the present study. However it would be safe to
assume that completing a full audiogram followed by completing the NZHST three times
would be at least if not more fatiguing than what members of the public have had to do. This
begs the following question: is there is a possibility that the performance of the NZHST in the
present study is a true representation of how the NZHST performs? Further investigation will
be required in order to determine if this is the case.
A further possibility is that in the present study some effect has been observed that
impairs the diagnostic power of the NZHST. Further investigation would be required to
identify if this is due to an effect of a test parameter or if it is an external factor such as the
participants sampled or a physical fault in the equipment (i.e. audiometers, soundcard,
headphones etc…) One of the major differences in procedure of the present study is the use

68
of a non-calibrated presentation level that can be adjusted by the participant if they wish. The
previous studies used a calibrated level of 65 dB A. If performance in the NZHST is affected
by the presentation level this may describe the discrepancy in performance observed with
previous studies. This could also offer an explanation as to why the NZHST that is available
to the public does not appear to be performing according to its specifications. Like the present
study, it uses a non-calibrated presentation level that is set by the participant. Further
investigation will be required to identify if some effect has impaired the performance of the
NZHST in the present study.
9.5 Limitations in the Present Study
A known limitation of the present study is the lack of hearing impaired participants in
the lower end of the mild to moderate range. In the present study overall performance is poor
and for the 1-Up 1-Down procedure it is significantly worse than what is expected based on
the performance of the NZHST in King (2011), and Bowden (2013). The inability of the
present study to replicate the results of King (2011) and Bowden (2013) leaves an air of
uncertainty about the results obtained in the study. Due to this, results from the present study
should be interpreted with care as until further investigation is conducted we cannot be
certain that the results are reliable.
10 Conclusion
The present study aimed to improve the performance of the NZHST by reducing the
time taken to complete it without having a detrimental effect on the overall sensitivity and
specificity of the test. Overall performance in the present study was poor. However, the
Brand & Kollmeier A1 procedure implemented in the present study did perform better than
the 1-Up 1-Down procedure used by King (2011) and Bowden (2013). It achieved greater
diagnostic power than its counterpart and did so using fewer trials. With the need for hearing

69
healthcare services expected to grow in New Zealand (Exeter et al., 2015) it is important that
accurate and reliable hearing screening tools such as the NZHST are available to the public.
Age-related hearing impairment is particularly insidious, and the gradual change in hearing
that occurs with it often goes unnoticed. Hearing screening tools such as the NZHST have the
ability to aid in the early detection of hearing impairment and allow for individuals to engage
in early intervention. This is crucial step to staving off the negative psychosocial outcomes
associated with hearing impairment (Gopinath et al., 2009). The present study has raised to
question of the efficacy of the NZHST as a hearing screening tool. It therefore imperative that
further investigations are undertaken to determine the cause of the discrepancy in
performance that has been observed between the present study and the studies undertaken
before it.

70
References
Agrawal, Y., Platz, E. A., & Niparko, J. K. (2008). Prevalence of hearing loss and differences
by demographic characteristics among US adults: data from the National Health and
Nutrition Examination Survey, 1999-2004. Archives of internal medicine, 168(14),
1522.
Aibara, R., Welsh, J. T., Puria, S., & Goode, R. L. (2001). Human middle-ear sound transfer
function and cochlear input impedance. Hearing Research, 152(1), 100-109.
doi:10.1016/S0378-5955(00)00240-9
Allen, P. D., & Eddins, D. A. (2010). Presbycusis phenotypes form a heterogeneous
continuum when ordered by degree and configuration of hearing loss. Hearing
Research, 264(1), 10-20. doi:10.1016/j.heares.2010.02.001
Bowden, A. (2013). Normalisation, evaluation and verification of the New Zealand Hearing
Screening Test. (Dissertation/Thesis), Retrieved from
http://hdl.handle.net/10092/8084
Brand, T., & Kollmeier, B. (2002). Efficient adaptive procedures for threshold and concurrent
slope estimates for psychophysics and speech intelligibility tests. Journal of the
Acoustical Society of America, 111(6), 2801-2810. doi:10.1121/1.1479152
Clause, A., Noh, J., & Kandler, K. (2009). Tonotopic reorganization of developing auditory
brainstem circuits. Nature Neuroscience, 12(6), 711-717. doi:10.1038/nn.2332
Cornwell, E. Y., & Waite, L. J. (2009). Social Disconnectedness, Perceived Isolation, and
Health among Older Adults. Journal of Health and Social Behavior, 50(1), 31-48.
doi:10.1177/002214650905000103
Cunningham, L. L., & Tucci, D. L. (2017). Hearing Loss in Adults. The New England
Journal of Medicine, 377(25), 2465-2473. doi:10.1056/NEJMra1616601
Curhan, G. C., Curhan, S. G., Willett, W. C., & Grodstein, F. (2019). Longitudinal study of
hearing loss and subjective cognitive function decline in men. Alzheimer's &
Dementia: The Journal of the Alzheimer's Association, 15(4), 525-533.
doi:10.1016/j.jalz.2018.11.004
Dai, H., & Micheyl, C. (2011). Psychometric functions for pure-tone frequency
discrimination. Journal of the Acoustical Society of America, 130(1), 263-272.
doi:10.1121/1.3598448
Dallos, P., & Harris, D. (1978). Properties of auditory nerve responses in absence of outer
hair cells. Journal of Neurophysiology, 41(2), 365-383. doi:10.1152/jn.1978.41.2.365
Deal, J. A., Albert, M. S., Arnold, M., Bangdiwala, S. I., Chisolm, T., Davis, S., . . . Lin, F.
R. (2017). A randomized feasibility pilot trial of hearing treatment for reducing
cognitive decline: Results from the Aging and Cognitive Health Evaluation in Elders
Pilot Study. Alzheimer's & Dementia: Translational Research & Clinical
Interventions, 3(3), 410-415. doi:10.1016/j.trci.2017.06.003
Dillon, H., Beach, E. F., Seymour, J., Carter, L., & Golding, M. (2016). Development of
Telscreen: a telephone-based speech-in-noise hearing screening test with a novel
masking noise and scoring procedure. International Journal of Audiology, 55(8), 463-
471. doi:10.3109/14992027.2016.1172268
Elberling, C., Ludvigsen, C., & Lyregaard, P. E. (1989). Dantale: A New Danish Speech
Material. Scandinavian Audiology, 18(3), 169-175. doi:10.3109/01050398909070742

71
Exeter, D. J., Wu, B., Lee, A. C., & Searchfield, G. D. (2015). The projected burden of
hearing loss in New Zealand (2011-2061) ad the implications for the hearing health
workforce. The New Zealand Medical Journal, 128(1419), 12-21.
Fischer, M. E., Cruickshanks, K. J., Nondahl, D. M., Klein, B. E. K., Klein, R., Pankow, J. S.,
. . . Paulsen, A. J. (2016). Dichotic Digits Test Performance Across the Ages: Results
From Two Large Epidemiologic Cohort Studies. Ear and Hearing, 38(3), 314-320.
doi:10.1097/AUD.0000000000000386
Fletcher, H. (1940). Auditory Patterns. Reviews of Modern Physics, 12(1), 47-65.
French, N. R., & Steinberg, J. C. (1947). Factors Governing the Intelligibility of Speech
Sounds. Journal of the Acoustical Society of America, 19(1), 90-119.
doi:10.1121/1.1916407
Gates, G. A., & Mills, J. H. (2005). Presbycusis. The Lancet, 366(9491), 1111-1120.
doi:10.1016/S0140-6736(05)67423-5
Gelfand, S. A. (2009). Hearing : An Introduction to Psychological and Physiological
Acoustics. New York, UNITED KINGDOM: Taylor & Francis Group.
Gewurtz, R. E., Langan, S., & Shand, D. (2016). Hiring people with disabilities: A scoping
review. Work, 54(1), 135-148. doi:10.3233/WOR-162265
Golub, J. S., Lin, F. R., Lustig, L. R., & Lalwani, A. K. (2018). Prevalence of adult unilateral
hearing loss and hearing aid use in the United States: Prevalence of Adult Unilateral
Hearing Loss. The Laryngoscope, 128(7), 1681-1686. doi:10.1002/lary.27017
Gopinath, B., Hickson, L., Schneider, J., McMahon, C. M., Burlutsky, G., Leeder, S. R., &
Mitchell, P. (2012). Hearing-impaired adults are at increased risk of experiencing
emotional distress and social engagement restrictions five years later. Age and
Ageing, 41(5), 618-623. doi:10.1093/ageing/afs058
Gopinath, B., Wang, J. J., Schneider, J., Burlutsky, G., Snowdon, J., McMahon, C. M., . . .
Mitchell, P. (2009). Depressive Symptoms in Older Adults with Hearing
Impairments: The Blue Mountains Study. 57(7), 1306-1308. doi:10.1111/j.1532-
5415.2009.02317.x
Gratton, M. A., & Schulte, B. A. (1995). Alterations in microvasculature are associated with
atrophy of the stria vascularis in quiet-aged gerbils. Hearing Research, 82(1), 44-52.
doi:10.1016/0378-5955(94)00161-I
Heine, C., & Browning, C. J. (2004). The communication and psychosocial perceptions of
older adults with sensory loss: a qualitative study. Ageing and Society, 24(1), 113-
130. doi:10.1017/S0144686X03001491
Hellstrom, L. I., & Schmiedt, R. A. (1990). Compound action potential input/output functions
in young and quiet-aged gerbils. Hearing Research, 50(1), 163-174.
doi:10.1016/0378-5955(90)90042-N
Hibino, H., & Kurachi, Y. (2006). Molecular and Physiological Bases of the K+ Circulation
in the Mammalian Inner Ear. Physiology, 21(5), 336-345.
doi:10.1152/physiol.00023.2006
Hogan, A., O'Loughlin, K., Davis, A., & Kendig, H. (2009). Hearing loss and paid
employment: Australian population survey findings. International Journal of
Audiology, 48(3), 117-122. doi:10.1080/14992020802449008
Houtenville, A., & Kalargyrou, V. (2012). People with Disabilities: Employers’ Perspectives
on Recruitment Practices, Strategies, and Challenges in Leisure and Hospitality.
Cornell Hospitality Quarterly, 53(1), 40-52. doi:10.1177/1938965511424151
Howes, W. L. (1974). Loudness Function Derived From Data on Electrical Discharge Rates
in Auditory Nerve Fibers. Acustica, 30(5), 247-259.

72
Iida, K., Yairi, M., & Morimoto, M. (1998). Role of pinna cavities in median plane
localization. The Journal of the Acoustical Society of America, 103(5), 2844-2844.
doi:10.1121/1.421507
Jansen, S., Luts, H., Wagener, K. C., Frachet, B., & Wouters, J. (2010). The French digit
triplet test: A hearing screening tool for speech intelligibility in noise. International
Journal of Audiology, 49(5), 378-387. doi:10.3109/14992020903431272
Johnson, D. H., & Johnson, D. H. (1980). The relationship between spike rate and synchrony
in responses of auditory-nerve fibers to single tones. Journal of the Acoustical Society
of America, 68(4), 1115-1122. doi:10.1121/1.384982
Kim, J.-S. (2015). Prevalence and factors associated with hearing loss and hearing aid use in
korean elders. Iranian Journal of Public Health, 44(3), 308-317.
King, S. M. (2011). Development and evaluation of a New Zealand Digit Triplet Test for
auditory screening. University of Canterbury. , Retrieved from
http://hdl.handle.net/10092/5679 (Dissertation/Thesis)
Kooser, C. (2013). Hearing loss and employment in the United States. Work, 46(2), 181-186.
doi:10.3233/WOR-131746
Leech, G., Rayson, P., & Wilson, A. (2001). Word Frequencies in Written and Spoken
English based on the British National Corpus. London Longman.
Levitt, H. (1971). Transformed Up-Down Methods in Psychoacoustics. Journal of the
Acoustical Society of America, 49(2B;2;), 467-477. doi:10.1121/1.1912375
Lin, F. R., Thorpe, R., Gordon-Salant, S., & Ferrucci, L. (2011). Hearing loss prevalence and
risk factors among older adults in the United States. The journals of gerontology.
Series A, Biological sciences and medical sciences, 66(5), 582-590.
doi:10.1093/gerona/glr002
Lin, F. R., Yaffe, K., Xia, J., Xue, Q.-L., Harris, T. B., Purchase-Helzner, E., . . . Health, A.
B. C. S. G. (2013). Hearing loss and cognitive decline in older adults. JAMA Internal
Medicine, 173(4), 293-299. doi:10.1001/jamainternmed.2013.1868
Liu, C.-F., Collins, M. P., Souza, P. E., & Yueh, B. (2011). Long-term cost-effectiveness of
screening strategies for hearing loss. Journal of Rehabilitation Research and
Development, 48(3), 235-243. doi:10.1682/JRRD.2010.03.0041
Luft, P. (2000). Communication barriers for deaf employees: Needs assessment and problem-
solving strategies. Work, 14(1), 51-59.
Martin, P., & Hudspeth, A. J. (2001). Compressive Nonlinearity in the Hair Bundle's Active
Response to Mechanical Stimulation. Proceedings of the National Academy of
Sciences of the United States of America, 98(25), 14386-14391.
doi:10.1073/pnas.251530498
Mick, P., Kawachi, I., & Lin, F. R. (2014). The Association between Hearing Loss and Social
Isolation in Older Adults. Otolaryngology–Head and Neck Surgery, 150(3), 378-384.
doi:10.1177/0194599813518021
Miller, G. A., Heise, G. A., & Lichten, W. (1951). The intelligibility of speech as a function
of the context of the test materials. Journal of Experimental Psychology, 41(5), 329-
335. doi:10.1037/h0062491
Mills, J. H., Schmiedt, R. A., & Kulish, L. F. (1990). Age-related changes in auditory
potentials of mongolian gerbil. Hearing Research, 46(3), 201-210. doi:10.1016/0378-
5955(90)90002-7
Moore, B. C. J. (2007). Cochlear hearing loss: physiological, psychological and technical
issues, 2nd edition (2nd ed.): Wiley.
Moore, B. C. J. (2008). The Role of Temporal Fine Structure Processing in Pitch Perception,
Masking, and Speech Perception for Normal-Hearing and Hearing-Impaired People.

73
Journal of the Association for Research in Otolaryngology, 9(4), 399-406.
doi:10.1007/s10162-008-0143-x
Moore, B. C. J. (2013). Pyschology of Hearing (6th ed.). Leiden, NV: Brill.
Moore, B. C. J., & Raab, D. H. (1974). Pure-tone intensity discrimination: some experiments
relating to the "near-miss" to Weber's law. The Journal of the Acoustical Society of
America, 55(5), 1049-1054.
Mulrow, C. D., Mulrow, C. D., Aguilar, C., Aguilar, C., Endicott, J. E., Endicott, J. E., . . .
DeNino, L. A. (1990). Quality-of-life changes and hearing impairment: A randomized
trial. Annals of Internal Medicine, 113(3), 188-194. doi:10.7326/0003-4819-113-3-
188
Murray, C. J. (2012). Development of a Māori Language Version of the New Zealand
Hearing Screening Test. (Dissertation/Thesis), University of Canterbury, Retrieved
from http://hdl.handle.net/10092/7132
New Zealand Audiological Society. (2007). New Zealand Audiological Society Best Practice
Guidelines Adult Pure Tone Audiometry Retrieved from
https://www.audiology.org.nz/UserFiles/file/_private/adult%203.pdf
Ozimek, E., Kutzner, D., Sęk, A., & Wicher, A. (2009). Development and evaluation of
Polish digit triplet test for auditory screening. Speech Communication, 51(4), 307-
316. doi:10.1016/j.specom.2008.09.007
Patuzzi, R. (2011). Ion flow in cochlear hair cells and the regulation of hearing sensitivity.
Hearing Research, 280(1-2), 3-20. doi:10.1016/j.heares.2011.04.006
Phatak, S. A., Brungart, D. S., Zion, D. J., & Grant, K. W. (2019). Clinical Assessment of
Functional Hearing Deficits: Speech-in-Noise Performance. Ear and Hearing, 40(2),
426-436. doi:10.1097/AUD.0000000000000635
Plomp, R., & Mimpen, A. M. (1979). Improving the Reliability of Testing the Speech
Reception Threshold for Sentences. Audiology, 18(1), 43-52.
doi:10.3109/00206097909072618
Ramkissoon, I., Estis, J. M., & Flagge, A. G. (2014). Digit speech recognition threshold
(SRT) in children with normal hearing ages 5-8 years. American Journal of
Audiology, 23(2), 182-189. doi:10.1044/2014_AJA-13-0039
Ramkissoon, I., Proctor, A., Lansing, C. R., & Bilger, R. C. (2002). Digit Speech
Recognition Thresholds (SRT) for Non-Native Speakers of English. American
Journal of Audiology, 11(1), 23-28. doi:10.1044/1059-0889(2002/005)
Relkin, E. M., & Doucet, J. R. (1997). Is loudness simply proportional to the auditory nerve
spike count? Journal of the Acoustical Society of America, 101(5 I), 2735-2740.
doi:10.1121/1.418561
Robles, L., & Ruggero, M. A. (2001). Mechanics of the Mammalian Cochlea. Physiological
Reviews, 81(3), 1305-1352. doi:10.1152/physrev.2001.81.3.1305
Rose, J. E., Brugge, J. F., Anderson, D. J., & Hind, J. E. (1967). Phase-locked response to
low-frequency tones in single auditory nerve fibers of the squirrel monkey. Journal of
Neurophysiology, 30(4), 769-793. doi:10.1152/jn.1967.30.4.769
Rossing, T. D., Moore, F. R., & Wheeler, P. A. (2002). The Science of Sound (3rd ed.). San
Francisco: Addison Wesley.
Schlauch, R. S., & Nelson, P. (2015). Puretone Evaluation. In J. Katz, M. Chasin, K. English,
L. J. Hood, & K. L. Tillery (Eds.), Handbook of Clinical Audiology (7th ed.).
Philadelphia, PA: Wolters Kluwer Health.
Schmidt‐Nielsen, A. (1989). The intelligibility of native and non‐native speakers of American
English using spelling alphabet test materials. The Journal of the Acoustical Society of
America, 86(S1), S76-S77. doi:10.1121/1.2027645

74
Schneider, J., Gopinath, B., Karpa, M. J., McMahon, C. M., Rochtchina, E., Leeder, S. R., &
Mitchell, P. (2010). Hearing loss impacts on the use of community and informal
supports. Age and Ageing, 39(4), 458-464. doi:10.1093/ageing/afq051 %J Age and
Ageing
Schuknecht, H. F., & Gacek, M. R. (1993). Cochlear pathology in presbycusis. Annals of
Otology, Rhinology and Laryngology, 102(1), 1-16.
Schulte, B. A., & Schmiedt, R. A. (1992). Lateral wall Na, K-ATPase and endocochlear
potentials decline with age in quiet-reared gerbils. Hearing Research, 61(1), 35-46.
doi:10.1016/0378-5955(92)90034-K
Smaldino, J., Kreisman, B., John, A., & Bondurant, L. (2015). Room Acoustics and Auditory
Rehabilitation Technology. In M. Chasin, K. English, L. J. Hood, & K. L. Tillery
(Eds.), Handbook of Clinical Audiology (7th ed.). Philadelphia, PA: Wolters Kluwer
Health.
Smeeth, L., Fletcher, A. E., Siu-Woon Ng, E., Stirling, S., Nunes, M., Breeze, E., . . .
Tulloch, A. (2002). Reduced hearing, ownership, and use of hearing aids in elderly
people in the UK–the MRC Trial of the Assessment and Management of Older People
in the Community: a cross-sectional survey. The Lancet, 359(9316), 1466-1470.
doi:10.1016/S0140-6736(02)08433-7
Smits, C., & Houtgast, T. (2006). Measurements and calculations on the simple up-down
adaptive procedure for speech-in-noise tests. Journal of the Acoustical Society of
America, 120(3), 1608-1621. doi:10.1121/1.2221405
Smits, C., Kramer, S. E., & Houtgast, T. (2006). Speech Reception Thresholds in Noise and
Self-Reported Hearing Disability in a General Adult Population. Ear and Hearing,
27(5), 538-549. doi:10.1097/01.aud.0000233917.72551.cf
Smits, C., Merkus, P., & Houtgast, T. (2006). How we do it: The Dutch functional hearing–
screening tests by telephone and internet. Clinical Otolaryngology, 31(5), 436-440.
doi:10.1111/j.1749-4486.2006.01195.x
Strawbridge, W. J., Wallhagen, M. I., Shema, S. J., & Kaplan, G. A. (2000). Negative
consequences of hearing impairment in old age: A longitudinal analysis.
Gerontologist, 40(3), 320-326. doi:10.1093/geront/40.3.320
Strelioff, D., Flock, Å., & Minser, K. E. (1985). Role of inner and outer hair cells in
mechanical frequency selectivity of the cochlea. Hearing Research, 18(2), 169-175.
doi:10.1016/0378-5955(85)90009-7
Suzuki, Y. i. (2011). Principles and applications of spatial hearing. New Jersey: World
Scientific.
The National Foundation for the Deaf. (2016). Social and economic costs of hearing loss in
New Zealand. Retrieved from
http://www.hearing.org.nz/wpcontent/uploads/2017/06/NZ-Hearing-Loss-Final-
Report-2016.pdf
Tillery, K. L. (2015). Central Auditory Processing Evaluation: A Test Battery Approach. In J.
Katz, M. Chasin, K. English, L. J. Hood, & K. L. Tillery (Eds.), Handbook of Clinical
Audiology (7th ed.). Philadelphia, PA: Wolters Kluwer Health.
Uchida, Y., Sugiura, S., Nishita, Y., Saji, N., Sone, M., & Ueda, H. (2019). Age-related
hearing loss and cognitive decline — The potential mechanisms linking the two. Auris
Nasus Larynx, 46(1), 1-9. doi:10.1016/j.anl.2018.08.010
Unal, I. (2017). Defining an optimal cut-point value in ROC analysis: An alternative
approach. Computational and Mathematical Methods in Medicine, 2017, 3762651-
3762614. doi:10.1155/2017/3762651

75
Weinstein, E. B. (2015). Hearing Loss in the Elderly: A New Look at an Old Problem. In J.
Katz, M. Chasin, K. English, L. J. Hood, & K. L. Tillery (Eds.), Handbook of Clinical
Audiology (7th ed.). Philadelphia, PA: Wolters Kluwer Health.
Wie, O. B., Pripp, A. H., & Tvete, O. (2010). Unilateral deafness in adults: Effects on
communication and social interaction. Annals of Otology, Rhinology and
Laryngology, 119(11), 772-781.
Willberg, T., Buschermöhle, M., Sivonen, V., Aarnisalo, A. A., Löppönen, H., Kollmeier, B.,
& Dietz, A. (2016). The development and evaluation of the Finnish digit triplet test.
Acta Oto-Laryngologica, 136(10), 1035-1040. doi:10.1080/00016489.2016.1175662
Winn, S. (2007). Employment outcomes for people in Australia who are congenitally deaf:
Has anything changed? American Annals of the Deaf, 152(4), 382-390.
World Health Organization. (2012). WHO global estimates on the prevalence of hearing
loss. Retrieved from https://www.who.int/pbd/deafness/WHO_GE_HL.pdf
Yueh, B., Collins, M. P., Souza, P. E., Boyko, E. J., Loovis, C. F., Heagerty, P. J., . . .
Hedrick, S. C. (2010). Long-term effectiveness of screening for hearing loss: The
screening for auditory impairment - Which hearing assessment test (SAI-WHAT)
randomized trial. Journal of the American Geriatrics Society, 58(3), 427-434.
doi:10.1111/j.1532-5415.2010.02738.x
Zekveld, A. A., Kramer, S. E., & Festen, J. M. (2011). Cognitive Load During Speech
Perception in Noise: The Influence of Age, Hearing Loss, and Cognition on the Pupil
Response. Ear and Hearing, 32(4), 498-510. doi:10.1097/AUD.0b013e31820512bb
Zokoll, M. A., Wagener, K. C., Brand, T., Buschermöhle, M., & Kollmeier, B. (2012).
Internationally comparable screening tests for listening in noise in several European
languages: The German digit triplet test as an optimization prototype. International
Journal of Audiology, 51(9), 697-707. doi:10.3109/14992027.2012.690078

76
Appendices
Appendix 1: Human Ethics Committee Approval
77
Appendix 2: Participant Information Sheet
School of Psychology, Speech, and Hearing
Email: [email protected] Phone: 64 33694333
19/08/2019
HEC Ref: HEC 2019/126
Improving the Performance of the New Zealand Hearing Screening Test
Information Sheet for Participants
Hello, my name is Kent Spence and I am a Master of Audiology student conducting research to improve the performance of the New Zealand Hearing Screening Test (NZHST). The NZHST is a
hearing screening test used to identify individuals who may have hearing loss. We aim to improve
it and need your help to verify if the changes we make indeed increase the performance of the test. Your contribution to the research will be greatly appreciated.
You have been approached to take part in this study because you have either volunteered to
participate, or you are a client of the University of Canterbury’s Speech and Hearing Clinic. I have
located your contact details through what you have provided either to me or through the clinic database.
If you choose to take part in this study, your involvement in this project will be to complete a diagnostic hearing assessment. This will include examination of your ears using an otoscope
(specialized ear torch), a hearing assessment where we will present a range of tones through
headphones at different pitches and levels to find the quietest sounds you can hear, and a pressure
test of the ear drum to verify that it moves correctly. Following this you will complete the original and modified versions of the NZHST. The total duration of the testing will be approximately 1
hour. The one-hour test period will include 45 minutes allocated to the hearing assessment and 15
minutes to complete the NZHST.
Following the completion of the testing you will be given the results of the hearing assessment
and a $20 petrol voucher to acknowledge your participation in the study. If an undiagnosed
hearing loss has been identified appropriate audiological follow up will be made available to you through the University of Canterbury’s Speech and Hearing Clinic if you so wish.
Participation is voluntary and you have the right to withdraw at any stage without penalty. You may ask for your data to be returned to you or destroyed at any point. If you withdraw, I will
remove information relating to you. However, once analysis of raw data starts on the 15th of
October 2019, it will become increasingly difficult to remove the influence of your data on the
results.
The results of the project may be published, but you can be assured of the complete confidentiality
of data gathered in this investigation: your identity will not be made public. To ensure confidentiality, all data collected during research will be de-identified through the assignment of
participant identification codes. Only members of the research team will have access to your data
and individual results reported in the thesis will remain de-identified to ensure confidentiality. A

78
thesis is a public document and will be available through the UC Library Database.
Please indicate to the researcher on the consent form if you would like to receive a copy of the
summary of results of the project.
The project is being carried out for the fulfillment of the Master in Audiology program by Kent
Spence under the supervision of Professor Greg O’Beirne, who can be contacted at
[email protected]. He will be pleased to discuss any concerns you may have about participation in the project.
This project has been reviewed and approved by the University of Canterbury Human Ethics
Committee, and participants should address any complaints to The Chair, Human Ethics
Committee, University of Canterbury, Private Bag 4800, Christchurch ([email protected]).
If you agree to participate in the study, you are required to complete this consent form and return it to Kent Spence at the start of the hearing assessment

79
Appendix 3: Participant Consent Form
Consent Form
Department of Communication Disorders Email:
Improving the Performance of the New Zealand Hearing Screening Test
Consent Form for Participants
□ I have been given a full explanation of this project and have had the opportunity to ask
questions.
□ I understand what is required of me if I agree to take part in the research.
□ I understand that participation is voluntary, and I may withdraw at any time without penalty. Withdrawal of participation will also include the withdrawal of any information I have provided should this remain practically achievable.
□ I understand that any information or opinions I provide will be kept confidential to the researcher and research team and that any published or reported results will not identify the participants in any form.. I understand that a thesis is a public document and will be available through the UC Library.
□ I understand that all data collected for the study will be kept in locked and secure facilities and/or in password protected electronic form and will be destroyed after five years.
□ I understand that I can contact the researcher Kent Spence at [email protected] or supervisor Prof Greg O’Beirne at
[email protected] for further information. If I have any complaints, I can contact the Chair of the University of Canterbury Human Ethics Committee, Private Bag 4800, Christchurch ([email protected])
□ I would like a summary of the results of the project.
□ By signing below, I agree to participate in this research project.
Name: Signed: Date:
Email address (for report of findings, if applicable):
80
Appendix 4: Authorisation to Sample Clients of UC’s Speech and Hearing Clinic


