IMPROVING THE FUNCTIONALITY AND BIOACTIVITY OF WHEAT …
143
IMPROVING THE FUNCTIONALITY AND BIOACTIVITY OF WHEAT BRAN A DISSERTATION SUBMITTED TO THE FACULTY OF THE GRADUATE SCHOOL OF THE UNIVERSITY OF MINNESOTA BY KEITH ERIC PETROFSKY IN PARTIAL FULFILLMENT OF THE REQUIREMENTS FOR THE DEGREE OF DOCTOR OF PHILOSOPHY DR. LEN MARQUART AND DR. ROGER RUAN CO-ADVISORS April, 2012
Transcript of IMPROVING THE FUNCTIONALITY AND BIOACTIVITY OF WHEAT …

IMPROVING THE FUNCTIONALITY AND BIOACTIVITY OF WHEAT BRAN
A DISSERTATION
SUBMITTED TO THE FACULTY OF THE GRADUATE SCHOOL
OF THE UNIVERSITY OF MINNESOTA
BY
KEITH ERIC PETROFSKY
IN PARTIAL FULFILLMENT OF THE REQUIREMENTS
FOR THE DEGREE OF
DOCTOR OF PHILOSOPHY
DR. LEN MARQUART AND DR. ROGER RUAN CO-ADVISORS
April, 2012

© Keith Petrofsky 2012

i
Acknowledgements
This project was supported by grants from USDA and gifts from ConAgra Foods
(Omaha, Nebraska) and Kellogg's (Battle Creek, Michigan). Wheat bran was obtained
from Archer Daniels Midland (Decatur, Illinois) and King Milling Company (Lowell,
Michigan).
Principal Investigator: Dr. Roger Ruan (Professor, Bioproducts and Biosystems
Engineering and Department of Food Science and Nutrition, University of Minnesota)
Co Investigators: Dr. Len Marquart (Associate Professor, Food Science and Nutrition,
University of Minnesota), Dr. Dan Gallaher (Professor, Food Science and Nutrition,
University of Minnesota), Dr. Mirko Bunzel (Associate Professor, Food Science and
Nutrition, University of Minnesota), Dr. RuiHai Liu (Professor, Food Science, Cornell
University), Dr. Jon Faubion (Professor, Grain Science and Industry, Kansas State
University), Dr. Paul Chen (Associate Research Professor, Bioproducts and Biosystems
Engineering, University of Minnesota), Dr. Gary Fulcher (Professor and Head, Food
Science, University of Manitoba)
Ph.D. Committee Members: Dr. Len Marquart (Co-Advisor), Dr. Roger Ruan (Co-
Advisor), Dr. Dan Gallaher, Dr. Mirko Bunzel, Dr. Dave Smith (Professor, Food Science
and Nutrition, University of Minnesota), Dr. Jun Zhu (Professor and Extension Engineer,
Bioproducts and Biosystems Engineering, University of Minnesota)
Graduate Students: Iris Zhang, Moonyeon Youn, Allison Hohn
Laboratory Support: Diana Gniechwitz (HPLC), Dr. Xueli Cao (HPLC), Jian Zhang
(HPH)

ii
Dedication
This dissertation is dedicated to my two sons, Joshua Carter (J.C.) Petrofsky and
Mason Alexander Petrofsky. Boys, as you have noticed, I have been working toward
earning my Ph.D. for your entire lives. It has been much longer in fact. You may have
wondered why I continued to work on this year after year. That’s because earning my
Ph.D. has always been my dream and long ago as a young man, I decided that I would
never give up on my dreams.
Go confidently in the direction of your dreams. Live the life you've imagined.
- Henry David Thoreau
Don’t let the fear of the time it will take to accomplish something stand in the way of
your doing it. The time will pass anyway; we might just as well put that passing time to
the best possible use.
- Earl Nightingale
Let me tell you the secret that has led me to my goal. My strength lies solely in my
tenacity.
- Louis Pasteur
Now, J.C. and Mason, let’s dream some new dreams together.

iii
Abstract
Wheat bran, including the aleurone layer, contains the vast majority of phenolic
antioxidants found in the wheat kernel. Unfortunately, about 80% of phenolic acids in
wheat bran are structurally bound and insoluble. These bound phenolics are neither
bioactive nor bioavailable during digestion. Additionally, wheat bran contains 43% total
dietary fiber, but only 3% soluble dietary fiber. Insoluble fiber is less functional than
soluble fiber which has been shown to lower cholesterol and regulate blood sugar.
We hypothesized that processing could improve the functionality of wheat bran and
bioavailability of phytochemicals in the bran. Specifically, we aimed to maximize the
physical properties of viscosity and water hydration capacity in wheat bran, while also
maximizing the release of bound phenolic antioxidants from the bran.
Wheat bran processing included physical treatments of dry grinding, high shear
mixing, high pressure homogenization (HPH), and alkali chemical treatments with
different concentration, time, and temperature. Sample analysis included particle size,
viscosity, water hydration capacity (WHC), water extractable material (Wa-Ex), free
phenolics, and visual imaging by scanning electron microscopy (SEM).
Prescreening results showed that while HPH helped reduce particle size of bran
regardless of treatment, only alkali chemical treatments released the vast majority of
bound phenolics. Alkali treatments also contributed to viscosity increase, with
interaction of variables of alkali concentration, treatment time, and temperature.
Variables for optimization studies included bran grind, alkali concentration, reaction

iv
time, and reaction temperature, while process treatments that remained constant were
high shear mixing after chemical pretreatment and HPH conditions.
Two factorial designs were conducted to optimize viscosity and WHC of bran while
maximizing release of bound phenolics. The second factorial design was an
augmentation to the first and data was combined for statistical analysis. Viscosity
maximum was reached using 0.5mm screen size in bran dry grinding and chemical
treatment conditions of 60°C soak temp, 24 hour soak time, 0.1N NaOH concentration.
WHC maximum was reached using 0.5mm screen size in bran dry grinding and chemical
treatment conditions of 48°C soak temp, 20 hour soak time, 0.7N NaOH concentration.
Overall, process optimization was successful and produced wheat bran with a 500%
increase in viscosity, 200% increase in WHC, 500% increase in soluble fiber, and a 300
fold increase in free and soluble bound phenolic antioxidants. Visual confirmation by
SEM validated analysis results and showed the optimized bran had a very open and
porous structure due to the chemical weakening of the alkali treatment and high shear
pulverization of the HPH treatment.
The optimized viscosity process was scaled up to produce a large quantity of samples
for further research in this collaborative study. Work to separate or concentrate the
soluble fraction of processed bran utilized centrifugation to produce additional samples of
more soluble and more insoluble processed bran fractions.

v
Table of Contents List of Tables ..................................................................................................................... vi List of Figures ................................................................................................................... vii
Background ..........................................................................................................................1 Whole Grains and Health ...............................................................................................1 Phytonutrient Bioavailability .........................................................................................2 Wheat Kernel Morphology ............................................................................................4
Bran Layer Identification .............................................................................4
Wheat Phenolics and Measurement ...............................................................................7
Extraction of Free, Esterified, and Insoluble Bound Phenolics in Bran ......8 Processing Technologies ..............................................................................................12
Physical Processing ....................................................................................12 Chemical Processing ..................................................................................13 Thermal Processing ....................................................................................15
Biological Processing.................................................................................17 Combined Processes ..................................................................................19
Relationship of Phenolics and Flavor in Whole Grain Wheat Products ......................21
Measurement of Aroma and Taste Compounds in Grain and Wheat
Ingredients .................................................................................................22
Measurement of Aroma and Taste Compounds in Grain and Wheat ........24
Products .....................................................................................................24
Modifying Flavor and Taste Profiles through Processing .........................27 Program Objectives:...........................................................................................................30
Specific Aims: ..............................................................................................................30 Expected Outcome and Anticipated Use of the Results ..............................................31 Project 1: Screening of Preprocess and High Pressure Processing Variables ............32
Hypothesis..................................................................................................32 Objectives ..................................................................................................32
Materials and Methods ...............................................................................33 Results and Discussion ..............................................................................40
Conclusions ................................................................................................59 Project 2: Combined Preprocess and High Pressure Homogenization Optimization .60
Hypothesis..................................................................................................60 Objectives ..................................................................................................60 Materials and Methods ...............................................................................61
Results and Discussion ..............................................................................70 Conclusions ..............................................................................................115
Project 3: Large Scale Sample Preparation of Optimized Process Bran ..................116 Large Samples Needed for Collaborative Research ................................116 Objectives ................................................................................................116
Materials and Methods .............................................................................117
Results and Discussion ............................................................................120
Conclusions ..............................................................................................125 References ........................................................................................................................126
vi
List of Tables
Table 1. Free, Esterified, and Bound Phenolics Contents ( g FAE/g Defatted Material)
of Whole Grains, Flour, and Bran of Hard and Soft Wheata .............................................. 9
Table 2. Typical Fraction Sizes for Experimental Milling and Sifting ............................ 40
Table 3. Commercial Milling Fractionation of 90% HRS, 10% HRW Wheat Blend ..... 41
Table 4. Particle Size Distribution of Hard Wheat Blend Fractions ................................ 41
Table 5. Particle Size Distribution of Ground Bran and Red Dog Samples .................... 42
Table 6. Chemical Pretreatment Screening Design ......................................................... 48
Table 7. Particle Size Results of Pretreatment Screening Design ................................... 49
Table 8. Effect of Wheat Bran Processing Variables of Bran Grind, NaOH
Concentration, and HPH on RVA Viscosity..................................................................... 52
Table 9. Factorial Experimental Design to Optimize HPH Preprocess Conditions ........ 68
Table 10. Experimental Design Results for Viscosity and WHC ..................................... 71
Table 11. Analysis of Variance for Viscosity, Using Adjusted SS for Tests ................... 72
Table 12. Analysis of Variance for WHC, Using Adjusted SS for Tests ......................... 75
Table 13. Augmentation Factorial Design to Complete Optimization of Wheat Bran HPH
Processing and Also Test Other Grain Materials .............................................................. 79
Table 14. Factorial Augmentation Design for Wheat Bran. ............................................ 80
Table 15. Factorial Augmentation Design for Barley Sustigrain. ................................... 80
Table 16. Factorial Augmentation Design for Ultrafiber. ................................................ 80
Table 17. Combined Factorial Design and Augmentation Design for Wheat Bran. ....... 86
Table 18. Response Surface Regression: Ave. Viscosity vs. Soak Temp, Bran Grind,
NaOH Conc., and Soak Time. .......................................................................................... 87
Table 19. Analysis of Variance for Ave. Viscosity ......................................................... 88
Table 20. Optimum Settings for Maximizing Viscosity within the Combined Factorial
and Augmentation Designs. .............................................................................................. 91
Table 21. Response Surface Regression: WHC vs. Soak Temp, Bran Grind, NaOH
Conc., and Soak Time. ...................................................................................................... 91
Table 22. Analysis of Variance for WHC. ....................................................................... 92
Table 23. Optimum Settings for Maximizing Water Hydration Capacity within the
Combined Factorial and Augmentation Designs. ............................................................. 96
Table 24. Optimum Settings for Maximizing Viscosity and Water Hydration Capacity
Combined. ......................................................................................................................... 98

vii
List of Figures
Figure 1. Wheat Kernel Dissection .................................................................................... 5
Figure 2. Cell Layers Inside a Grain .................................................................................. 5
Figure 3. Bran Layer Separation Micrograph .................................................................... 6
Figure 4. Total Solubilization of Ferulic Acid from Maize Bran by a Combined Action of
Flash-Explosion and Novozyme 342 ................................................................................ 20
Figure 5. Bran Processing Flowchart ............................................................................... 35
Figure 6. HPH Particle Size Reduction of Bran and Red Dog Samples .......................... 45
Figure 7. SEM of Unprocessed and High Pressure Homogenized Bran ......................... 46
Figure 8. Particle size distribution of processed bran without HPH is dependent on
starting particle size and NaOH treatment ........................................................................ 51
Figure 9. Particle size distribution of processed bran with HPH is not dependent on
starting particle size and NaOH treatment ........................................................................ 51
Figure 10. Free Ferulic Acid Content of Processed Wheat Bran ..................................... 53
Figure 11. T2* of Processed Wheat Bran ........................................................................ 55
Figure 12. T1 of Processed Wheat Bran .......................................................................... 56
Figure 13. T21 of Processed Wheat Bran ........................................................................ 57
Figure 14. T22 of Processed Wheat Bran ........................................................................ 58
Figure 15. Bran Processing Flowchart ............................................................................. 63
Figure 16. Main Effects Plots for Average Viscosity in the Experimental Design ......... 73
Figure 17. Experimental Design Results Showing a Surface Plot of Viscosity vs. NaOH
Concentration and Soak Time ........................................................................................... 74
Figure 18. Main Effects Plots for WHC in the Experimental Design ............................. 76
Figure 19. Experimental Design Results Showing a Surface Plot of WHC vs. NaOH
Concentration and Soak Time ........................................................................................... 77
Figure 20. Effect of Temperature and Alkali on Particle Size of High Shear Mixed
Wheat Bran Prior to HPH Processing. .............................................................................. 82
Figure 21. Effect of Temperature and Alkali on Particle Size of HPH Wheat Bran. ...... 82
Figure 22. Effect of Temperature and Alkali on Viscosity of High Shear Mixed Wheat
Bran Prior to HPH Processing. ......................................................................................... 83
Figure 23. Effect of Temperature and Alkali on Viscosity of HPH Wheat Bran. ........... 83
Figure 24. Effect of Temperature and Alkali on WHC of HPH Wheat Bran. ................. 84
Figure 25. Effect of Temperature and Alkali on Wa-Ex Material of HPH Wheat Bran. 84
Figure 26. Main Effects Plots of Average Viscosity in the Combined Design. .............. 88
Figure 27. Contour Plots of Two Way Interactions for Average Viscosity in the
Combined Design.............................................................................................................. 89

viii
Figure 28. Optimum Settings for Maximizing Viscosity within the Combined Factorial
and Augmentation Designs. .............................................................................................. 90
Figure 29. Main Effects Plots of Water Hydration Capacity in the Combined Design. ... 93
Figure 30. Contour Plots of Two Way Interactions for Water Hydration Capacity in the
Combined Design.............................................................................................................. 94
Figure 31. Optimum Settings for Maximizing Water Hydration Capacity within the
Combined Factorial and Augmentation Designs. ............................................................. 95
Figure 32. Optimum Settings for Maximizing Viscosity and Water Hydration Capacity
Simultaneously. ................................................................................................................. 97
Figure 33. Free ferulic acid content of processed wheat bran. ........................................ 99
Figure 34. Averaged free and soluble bound ferulic acid content of processed wheat bran
from Optimization and Augmentation designs. .............................................................. 100
Figure 35. Averaged free and soluble bound ferulic acid content of processed wheat bran
from Optimization and Augmentation designs. .............................................................. 102
Figure 36. Bran Processing Flowchart for Sample 3a-3d SEM Micrographs. .............. 103
Figure 37. SEM of Processed Wheat Bran: Sample 3a, 0N, Mix Only, x250. .............. 104
Figure 38. SEM of Processed Wheat Bran: Sample 3a, 0N, Mix Only, x500. .............. 105
Figure 39. SEM of Processed Wheat Bran: Sample 3a, 0N, Mix Only, x1.8k. ............. 106
Figure 40. SEM of Processed Wheat Bran: Sample 3a, 0N, Mix Only, x10k. .............. 107
Figure 41. SEM of Processed Wheat Bran: Sample 3a, 0N, Mix Only, x20k. .............. 107
Figure 42. SEM of Processed Wheat Bran: Sample 3b, 0N, Mix+HPH, x10k. ............ 108
Figure 43. SEM of Processed Wheat Bran: Sample 3b, 0N, Mix+HPH, x10k. ............ 109
Figure 44. SEM of Processed Wheat Bran: Sample 3b, 0N, Mix+HPH, x20k. ............ 109
Figure 45. SEM of Processed Wheat Bran: Sample 3c, 0.1N, Mix Only, x10k. ........... 110
Figure 46. SEM of Processed Wheat Bran: Sample 3c, 0.1N, Mix Only, x20k. ........... 110
Figure 47. SEM of Processed Wheat Bran: Sample 3d, 0.1N, Mix+HPH, x10k. ......... 111
Figure 48. SEM of Processed Wheat Bran: Sample 3d, 0.1N, Mix+HPH, x10k. ......... 112
Figure 49. SEM of Processed Wheat Bran: Sample 3d, 0.1N, Mix+HPH, x20k. ......... 113
Figure 50. SEM of Processed Wheat Bran: Sample 3d, 0.1N, Mix+HPH, x20k. ......... 113
Figure 51. SEM of Processed Wheat Bran: Sample 3d, 0.1N, Mix+HPH, x50k. ......... 114
Figure 52. SEM of Processed Wheat Bran: Sample 3d, 0.1N, Mix+HPH, x50k. ......... 114
Figure 53. Processing Flowchart for Large Scale Sample Preparation of Optimized
Processed Bran and Fractionated Bran. .......................................................................... 121

1
Background
Whole Grains and Health
Although 6 to 11 servings of grain products are recommended daily with a
minimum of three of those servings as whole grain (Welsh et al., 1994), less than 10% of
Americans are consuming 3 servings of whole grain foods per day. In fact, the average
intake is less than 1 serving of whole grains per day (Marquart et al., 2007). Low
consumption of whole grains is surprising when their health benefits are considered.
Although consumers have more choices of whole grain foods lately, they often choose
refined grain products due to appearance, taste, texture, preferences (Marquart et al.,
2007).
Consumption of whole grain foods has been linked to reduced risk of chronic
diseases (Marquart et al., 2007) including coronary heart disease (Steffen et al., 2003),
cancer (Jacobs et al., 1998), diabetes (Fung et al., 2002), and obesity (Koh-Banerjee et
al., 2004). Based on epidemiological and clinical data, the US Food and Drug
Administration also allows several label claims for whole grain foods and grains
containing fiber that reduce the risk of coronary heart disease and some cancers (United
States Food and Drug Administration, 2008).
Whole grains or foods made from them contain all the essential parts and naturally-
occurring nutrients of the entire grain seed (Whole Grains Council, 2004). The
approximate composition of whole wheat is 80% endosperm, 15% bran, and 5% germ.
The vast majority of phytonutrients are contained in the bran and germ, not the starchy
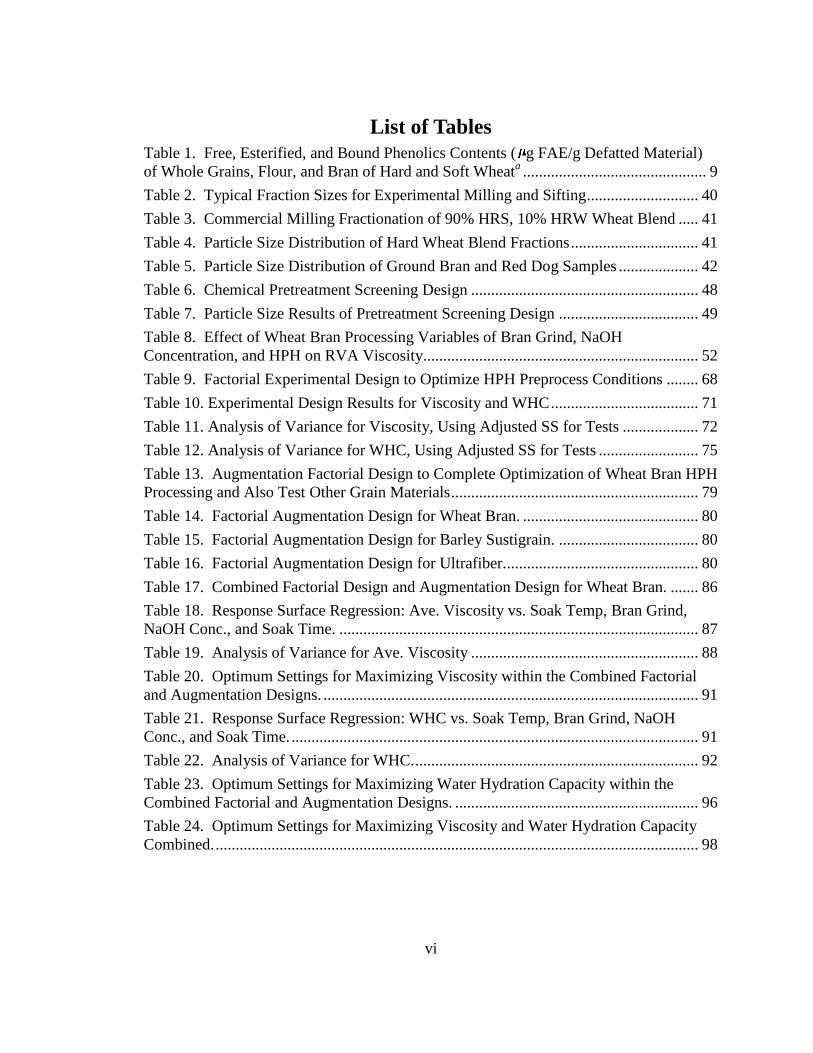
2
endosperm. Phytonutrients (also called phytochemicals) are defined as biologically
active compounds of plant origin that when ingested provide certain functional benefits
beyond basic nutrition. Grains contain many thousands of unique phytonutrient
structures, but the most important groups can be classified as phenolics, carotenoids,
vitamin E compounds, lignans, β-glucan, and inulin (Liu, 2007).
While increasing consumption of whole grains is one important approach to
improve health, another is to increase the health benefits of grains by improving
phytonutrient bioavailability. Bioavailability can be defined as the degree and rate at
which a substance (such as a phytonutrient) is absorbed into a living system or is made
available at the site of physiological activity (Merriam-Webster Online Dictionary, 2008).
Another commonly used term, bioaccessibility, is the amount of an ingested nutrient that
is available for absorption in the gut after digestion (Hedrén et al., 2002). So not only is
it important to free the phytonutrient from the food and ingredient matrix to make it
bioaccessible for absorption, but also for it to be absorbed and available to react at the
site of action.
Phytonutrient Bioavailability
Although some grains such as popcorn, brown rice, or puffed wheat cereal are eaten
whole, most are processed to some degree by grinding or milling. Liyana et al. (2006)
demonstrated that sequential removal of the bran layers by abrasion reduced the
antioxidant capacity of the remaining grain. The bran and aleurone layers of wheat
contain high concentrations of phenolics that act as antioxidants by free radical

3
scavenging and/or metal chelation (Liyana-Pathirana et al., 2006; Liyana-Pathirana and
Shahidi 2006). Because the majority of phenolic antioxidants in bran are insoluble and
bound to cell wall material (Adom and Liu, 2002), their content has been underestimated
in the literature. Additionally, the vast proportion of hydroxycinnamic acids present in
the diet is ester-linked to cell wall polymers and cannot be absorbed through the
gastrointestinal tract wall in this form (Andreasen et al., 2001). Although release of
insoluble bound phenolic antioxidants from bran occurs in the intestine through microbial
fermentation and enzymatic reactions of xylanases and esterases, primarily only the free
and some of the soluble conjugate phenolics are absorbed into the blood through the
intestinal lumen to become bioavailable (Kroon et al., 1997).
Many factors affect food nutrient ―availability‖ for absorption in the gut including
processing conditions, the chemical state of the nutrient, release from the food matrix,
possible interactions with other food components, presence of suppressors or cofactors,
formation of stable compounds that are slowly metabolized, and the food or ingredient
microstructure (Parada and Aguilera, 2007). When administered to rats by perfusion at
different concentrations (10-50μmol/L), free ferulic acid absorption was directly
proportional to the perfused concentration suggesting passive diffusion or facilitated
transport not at saturation. About 6% of the ferulic acid was absorbed into the
bloodstream and 50% was distributed to peripheral tissues as conjugated derivatives
(Adam et al., 2002). When fed to rats as wheat bran instead of free form, plasma
concentration of ferulic acid was only 83.5% lower. More than 38% of the ingested

4
ferulic acid from bran was excreted in the fecal matter (Adam et al., 2002) indicating the
bran microstructure greatly affected the bioavailability of the ferulic acid in bran.
Wheat Kernel Morphology
Also called the wheat berry, the kernel contains three distinct parts that are
separated during the milling process to produce flour: Bran, endosperm, and germ
(Montana Wheat & Barley Committee, 2006). The bran comprises about 14.5% of the
kernels weight and contains many layers that protect the grain from harm (insects,
bacteria, molds, and severe weather). Bran is included in whole wheat flour or often sold
separately (mostly for animal feed). The endosperm, about 83% of the kernels weight,
contains primarily starch and storage protein and provides food for the growing seed. It
is the source of refined white flour. The germ, about 2.5% of the kernels weight, contains
the plant embryo or seed and is often separated from flour in milling because the fat
content limits flour’s shelf-life (North Dakota Wheat Commission, 2007). Figure 1
depicts the three components with added detail to show the different layers of the bran.
Bran Layer Identification
Some additional background information on bran layers is necessary prior to
reviewing data of phenolic content in specific bran layers. Figure 2 shows the evolution
of bran layers progressing from anthesis to the mature kernel (Wheat: The Big Picture
2007).

5
Figure 1. Wheat Kernel Dissection (The New Zealand Institute for Crop & Food
Research Limited, 2002)
Pericarp (outside) 1A - cuticle of Outer Epidermis
1 - Outer Epidermis
2 - Hypodermis
3 - Parenchyma (thin-walled)
4 - Intermediate cells
5 - Cross cells
6 becomes 7 - Inner Epidermis/Tube
cells
Closer to the Embryo sac (inside) 8A and 8B - Outer Integument
9A and 9B -Inner Integument
10 - Nucellar epidermis
11 - Nucellus
12 - Aleurone
13 - Starchy endosperm
Figure 2. Cell Layers Inside a Grain (Wheat: The Big Picture, 2007)

6
Bran layers (including aleurone) in mature kernels have been grouped during tissue
dissection along natural demarcations by Parker et al (2005) into four groups: Beeswing
bran, or BWB, consists of the outer pericarp layers including brush hairs (Layers 1-44);
Cross cells (Layer 5); Testa +NE consisting of the pigmented testa and the nucellar
epidermis (NE, hyaline layer) (Layer 7-10); and the single layer of aleurone cells (Layer
12). Another view of layer separation is shown in Figure 3 (Parker et al., 2005).
Figure 3. Bran Layer Separation Micrograph (Parker et al., 2005)

7
Wheat Phenolics and Measurement
Whole grains contain a host of phytonutrients—plant components that offer health
benefits—phytates, phytoestrogens, lignans, phenols, antioxidants (Slavin et al., 1999).
The bran and germ supply the majority of biologically active components found in the
grain (Fulcher and Rooney-Duke, 2002). They contain amino acids—protein building
blocks, higher levels of B vitamins (thiamin, riboflavin, niacin, pantothenic acid) and
certain minerals (calcium, magnesium, phosphorus, potassium, sodium and iron) while
the endosperm is mainly starch. Wheat bran and germ also contribute a more
concentrated source of antioxidants to whole grain products than refined breads and
cereals and many common fruits and vegetables (Miller et al., 2002).
Wheat bran is composed mainly of polysaccharides, including arabinoxylans,
xyloglucans and cellulose, but also contains significant amounts of phenolic acids, lignin
and some proteins. Phenolic acids present in the cell wall are thought to play an important
part in the cross-linking of polysaccharides with other cell-wall components, including
lignin through ester and ether bonds, and also in the cross-linking of polysaccharide
chains (Parker et al., 2005).
Phenolic acids such as ferulic acid are found mainly in wheat aleurone and bran
layers (the aleurone layer is actually the protective outer layer of cells in the endosperm,
but it adheres to the bran and is removed with the bran during milling). Although the
antioxidant activity of phenolic acids is well known, their health benefits are less clear.
Wattenberg (1985) suggested an anti-carcinogenic mechanism of phenolic compounds
suggesting caffeic and ferulic acids prevented the
formation of carcinogens from

8
precursor compounds and blocked the reaction of carcinogens with critical cellular
macromolecules.
Extraction of Free, Esterified, and Insoluble Bound Phenolics in Bran
Fruits & vegetables are often cited as excellent sources of antioxidants whereas,
grains tend not to be mentioned due to relatively low levels of antioxidant activity
reported in the literature. However this is because most studies have reported the
phenolic levels of grains using various aqueous solutions of methanol, ethanol and
acetone to extract soluble phenolics (Liyana-Pathirana et al., 2006; Zhou and Yu, 2004).
Recent work has shown that grains have vastly greater levels of phenolics than previously
thought due to methodology improvement that measures phenolic acids in all their forms:
free, esterified, and insoluble-bound. Adom and Liu (2002) have shown that the major
portion of phytochemicals in the grains is present in the bound form (85% in corn, 75%
in oats and wheat, and 62% in rice).
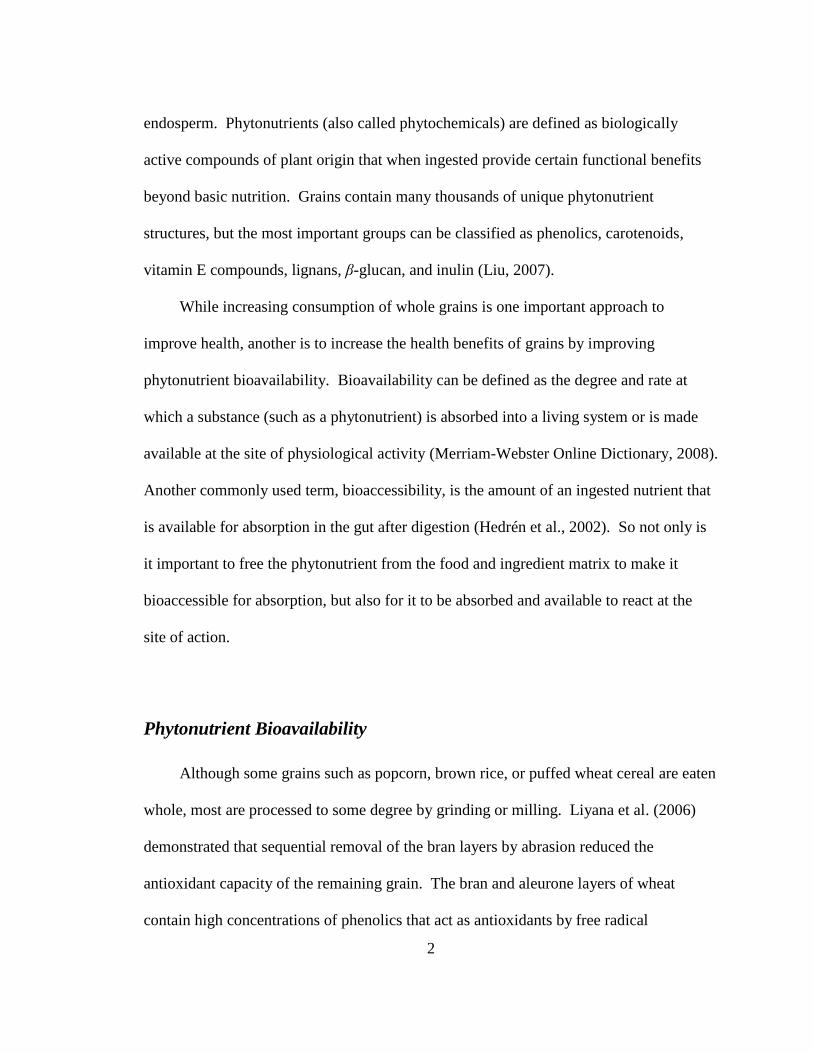
Soluski et al. ( 1982), Naczk and Shahidi (1989), and Liyana-Pathirana and Shahidi
(2006) evaluated free, esterified, and bound phenolics in commercially available soft and
hard wheats that were fractionated into whole wheat, refined flour, and bran. Their
results shown in Table 1 expressed as ferulic acid equivalents indicate that the bran
fraction not only contains the vast majority of phenolic compounds, but the majority
(>80%) are in bound form. Ferulic is the major phenolic acid in wheat bran and
constitutes around 85% of the total phenolics in all its forms (Kim et al., 2006). The
significant differences in phenolic content between hard and soft varieties are not
9
unusual. Differences in phenolic content and distribution have been reported to be
influenced by genetic, environmental, and preparation differences (Klepacka and Fornal,
2006).
Table 1. Free, Esterified, and Bound Phenolics Contents ( g FAE/g Defatted
Material) of Whole Grains, Flour, and Bran of Hard and Soft Wheata
Milling fraction Free Esterified Bound Total
HWF 137 ± 4 a 234 ± 13 a 328 ± 14 a 699
SWF 161 ± 6 b 278 ± 12 b 464 ± 16 b 903
HWW 353 ± 16 a 954 ± 34 a 2149 ± 43 a 3456
SWW 478 ± 12 b 1196 ± 59 b 2144 ± 52 b 3818
HWB 846 ± 31 a 1365 ± 63 a 11303 ± 126 a 13514
SWB 981 ± 47 b 1432 ± 42 b 12186 ± 149 b 14599
a Values are means of three determinations ± standard deviations. Abbreviations: HWF,
hard wheat flour; SWF, soft wheat flour; HWW, hard whole wheat; SWW, soft whole
wheat; HWB, hard wheat bran; and SWB, soft wheat bran. In each column, pairs carrying
different superscripts are significantly (p < -0.05) different from one another (Liyana-
Pathirana and Shahidi, 2006).

10
Liyana-Pathirana and Shahidi’s (2006) extraction methodology is based on
extracting with methanol-acetone-water multiple times, then extracting free phenolics
with diethyl ether. This was different from Adom and Liu (2005) who used 80% ethanol
and Kim et al. (2006) who used methanol. There were also differences in the grinding,
particle size, and whether the samples were defatted prior to extraction. Even so, results
within a laboratory should strive to be consistent and allow comparisons to be across
samples. Direct quantitative comparison of different methodologies carried out by
different laboratories is only possible if the same (exact) sample was used by all.
However, qualitative comparisons do show similar trends in the extracted phenolics.
The sample extract used to obtain free phenolics is then treated with acid or base to
break the ester bonds attaching mainly ferulic acid (up to 95% of esterified phenolics) to
sugars. Researchers have used 2M NaOH (Kim et al., 2006; Adom et al., 2005), 4M
NaOH (Liyana-Pathirana and Shahidi, 2006), or multiple sequential levels from 0.1M to
4M NaOH (Parker et al., 2005) for different lengths of time, followed by neutralization or
acidification with HCl. Acidic and alkaline hydrolyses are used to cleave the ester bond
in separation and characterization of specific phenolic compounds. The hydrolysis
conditions, acid or alkaline only, or in different sequence, can significantly affect the total
yield and profile of phenolic acids (Kim et al., 2006). Kim et al. (2006) also found
degradation of cinnamic acid derivatives, p-coumaric, caffeic and ferulic acids when heat
was used during acid hydrolysis.
Insoluble bound phenolics in grains are freed using similar alkaline and acid
hydrolysis except this time the extractions are done on the previously extracted material.

11
The goal is mainly to break ester bonds between ferulic acid and sugar structures (mainly
arabinoxylan) and ether bonds between ferulic acid and lignin to free the phenolics for
extraction. Because ferulic acid forms both of these types of bonds (Liyana-Pathirana
and Shahidi, 2006) it may link xylan and lignin structures (Klepacka and Fornal, 2006)
making it more difficult to extract. Conditions for hydrolysis were similar to the
esterified hydrolysis for all three methods reviewed (Liyana-Pathirana and Shahidi, 2006;
Adom and Liu, 2002; Kim et al., 2006). Results all agree that the vast majority of
phenolic acids are in insoluble bound form concentrated in the bran material. In this
case, particle size of starting material may have an increased impact on final hydrolysis
results. Because ferulic acid is a structural part of insoluble cell wall material, a
reduction of cell walls to smaller pieces would act to improve the extent of hydrolysis.
Although it seems a simple test to evaluate the extent of the extraction of phenolics, the
author is unaware of researchers evaluating the digested grain matter for residual
phenolic material either by auto fluorescence under a microscope or by any other method.
Because of the complexity of digestion, it is difficult to quantify the bioavailability
and health benefits of bound phenolics in whole grains and bran. It has been shown that
bound phenolics have physiological activity, but this activity is often measured once
freed from their matrix. While free phenolics and some soluble bound phenolics are
absorbed in the small intestine, Hemery et al. (2010) demonstrated that reducing bran
particle size by grinding correlated to an increase in in-vitro phenolic acid
bioaccessibility from once bound phenolics. Although Yuan et al. (2005) reacted
insoluble dietary fiber to extract soluble feruloylated oligosaccharides and administered

12
them to rat erythrocytes in-vitro, it would be impossible to conclude the bound phenolics
would have the same effect in-vivo. In the large intestine, some bound phenolics are
undoubtedly freed and may have beneficial antioxidant properties. For example, bacteria
in the colon may release bound phytochemicals through fermentation to provide site-
specific health benefits. This may partially explain a potential mechanism associated with
grain consumption in the prevention of colon and other digestive cancers, along with
breast and prostate cancer, as supported by epidemiological studies.
Processing Technologies
Physical Processing
Physical processing can be as simple as grinding and may include dry methods such
as ball milling or wet methods such as high pressure homogenization. Separation of
wheat bran into its layer components has been tested. Harris (2005) fed wheat bran,
pericarp, or aleurone fractions to rats and examined the recovered material from the feces
by multiple microscopy techniques. Most of the bran material passed through digestion
intact with only the aleurone cells showing some degradation, primarily by bacterial
enzymes. Smaller particles of bran are hypothesized to allow freer access to enzyme
target sites (Ferguson and Harris, 1997). Carole et al. (Antoine et al., 2004) demonstrated
an increase in water extractable p-coumaric acid from wheat bran (4.3 times) and
aleurone (3.4 times) samples after increasing ball milling times to achieve progressively
smaller particle size, however even the increased free p-coumaric acid released after ball

13
milling for 16 minutes was only 6 percent of the total. Chau et al. (2006) tested the
effects of ball milling, jet milling, and high pressure homogenization (HPH) on insoluble
star fruit fiber. Although all reduced particle size dramatically, only HPH processing
produced dramatic increases in water holding capacity, swelling capacity, oil-holding
capacity, and fiber solubility compared to the other methods.
The bioavailability of bran nutrients varies greatly depending on bran particle size
and technological treatments (Caprez and Fairweather-Tait, 1982; Yu and Kies, 1993).
Yu and Kies (1993) processed maize bran to different sized particles including finely
ground, wet-milled maize bran; coarsely ground, wet-milled maize bran; finely ground,
dry-milled maize bran; or coarsely ground, dry-milled maize bran, and fed nine human
subjects controlled diets containing unsupplemented bread or bread supplemented with
milled bran of different particle sizes. They found that in general, better apparent
bioavailability was achieved with the finely ground, dry-milled maize bran than with the
other test bran. The increased bioavailability may be attributed to damaged cells and
increased surface area in the finely milled samples. However, there is still a substantial
amount of nutrients within even the finely milled particles, which could be released if the
matrix structure can be further opened up or expanded to a highly porous medium.
Chemical Processing
Treatment of bran with acid or alkali can effectively break covalent bonds including
ester linkages between phenolic acids and arabinoxylan chains. Kim et al. (2006)
investigated the effect of hydrolysis and extraction conditions on the yield and profile of

14
phenolic acids. After extraction with 80% methanol to remove free and soluble conjugate
phenolics, the insoluble material was hydrolyzed by acid then alkali or alkali then acid.
Alkali hydrolysable phenolic acids comprised more than 96% of the total freed by
hydrolysis. Ferulic acid comprised approximately 90% of the total phenolic acids
liberated by alkaline hydrolysis but was not freed by acid hydrolysis. It appears likely
that their hot acid hydrolysis degraded the ferulic acid such that very little was recovered
when followed by alkaline hydrolysis.
Although the free and soluble conjugate phenolic fractions demonstrate strong
antioxidant activity, the bound fraction represents a greater potential if released. Liyana-
Pathirana and Shahidi (2006) utilized alkaline hydrolysis to liberate bound phenolics
from wheat bran and several tests for antioxidant activity were performed indicating
significantly greater contribution by the hydrolyzed bound fraction than free or esterified
fractions. Total Antioxidant capacity (TAC) of the bound fraction was 89.6% and 88.6%
of the total for hard and soft wheat bran respectively.
When free and soluble conjugate phenolics are released through chemical
treatments, their bioavailability and antioxidant activity increases. Ohta et al. (1997)
showed differences in antioxidant activity of free ferulic acid (FA), feruloyl arabinose
(FAA), and feruloyl arabinoxylane (FAXn) in a LDL oxidation system. Antioxidant
activity was FAA > FAXn > FA and the LDL oxidation inhibiting activity of FAA was
also dose dependent. FAA administered orally to rats was found to exist as the
conjugated form of FAA (25%) and FA (75%) in the circulation system. So in addition

15
to free ferulic acid, some soluble conjugated phenolics are also absorbed and
bioavailable.
Thermal Processing
Thermal processing of grains can take the form of a final processing step such as
retort cooking (canning), baking or extrusion cooking/puffing or as an intermediate step
to prepare an ingredient for further processing including steam explosion or extrusion
cooking.
Dewanto et al. (2002) utilized a retort canning process to cook sweet corn at
different temperatures and times. When compared to an unheated control, free and
soluble conjugate ferulic acid content increased significantly in heat treated samples
(100°C, 115°C, 121°C (p<0.01), while bound ferulic acid decreased significantly
(p<0.05). A similar increase in free and soluble conjugate ferulic acid (p<0.01) and
decrease in bound ferulic acid (p<0.05) was seen for corn retorted at 115°C for 10, 25, or
50 minutes vs. the unheated control. Antioxidant activities also increased significantly
(p<0.01). Interestingly, the amount of liberated free phenolics was very low compared to
the soluble conjugate fraction indicating the increased antioxidant activity was due
mostly to conjugated glycosides with ferulic acid esterified to neutral sugar chains
(Dewanto et al., 2002).
Hydrothermal processing, sometimes called steam explosion or flash explosion is
accomplished by heating material with high pressure steam or heating a pressurized
chamber containing the hydrated sample. When pressure is instantly released, moisture

16
flashes to steam and causes physical disruption of the fibers. This process has been used
for years in the paper industry and more recently in preparation of fibers for conversion
to ethanol. Schooneveld-Bergmans et al. (1998) explored the effects of dwell (5, 10, 15
min.) and temperature (180°C, 190°C, 200°C) of steam exploded destarched wheat bran
on water extractable carbohydrate and ferulic acid content. They liberated 19% to 28%
of the glucurono-arabinoxylans present in the parental bran. Ferulic acid remained bound
to the arabinoxylans that were released but was extracted at up to 6 times the quantity of
untreated bran.
In addition to modifying the phenolic content, extrusion processing also has
important effects on soluble and insoluble dietary fiber which are important in increasing
bile acid binding leading to lower cholesterol. Kahlon and Woodruff (2003) examined
the effects on in vitro bile acid binding due to various cereal grains and concluded that
only the high viscosity beta glucan soluble fibers in oats and barley contributed to
increased bile acid binding whereas other soluble cereal dietary fibers did not
proportionally increase binding. Additionally, insoluble dietary fiber was related to bile
acid binding for rice bran, oat bran, and beta glucan enriched barley. Although other
protein anionic, cationic, physical and chemical structure, composition, metabolites, or
their interaction with active binding sites may contribute to bile acid binding effects as
well. When testing extruded oat bran, Drzikova et al. (2005) noticed similar increased in
vitro bile acid binding with increasing beta glucan content in digested oat based
extrudates (p<0.001).

17
Testing bile acid binding in vitro has limitations and results must be confirmed in
animal or human studies to demonstrate validity. For example, Kahlon et al. (2006a) did
not show a strong correlation between dietary fiber solubility (or insolubility) of extruded
wheat bran samples and in vitro bile acid binding though extrusion conditions
significantly increased total and insoluble dietary fiber in the processed wheat bran. In
another study, they fed similar extruded wheat bran products to hamsters in diets
containing 10% total dietary fiber from the bran and measured significant in vivo
reductions in total liver lipid and total liver cholesterol (23–35% and 28–31%
respectively) (Kahlon et al., 2006b). Neutral sterol excretion was also significantly
higher for the most highly processed bran samples vs. the unprocessed control.
Biological Processing
Because phenolics are bound to arabinoxylan in wheat bran, reaction with xylanase
enzymes produces two effects. First, the increase in extractable arabinoxylans modifies
the physical characteristics of bran (Trogh et al., 2004). Second, the release of bound
phenolics increases the bioavailability and antioxidant activity of the bran (Napolitano et
al., 2006).
Yuan et al. (2006) optimized conditions for production of feruloylated
oligosaccharides from wheat bran from wheat bran insoluble dietary fiber. They used
4.8g/L of a xylanase from Bacillus subtillus to react with bran (120g/L) in pH 5.2 acetate
buffer at 42°C for 35 hours yielding 1.55 mM feruloyl oligosaccharides. Some free
ferulic acid was also produced during the reaction possibly by feruloyl esterase in the

18
xylanase enzyme. The feruloyl oligosaccharides were shown to efficiently protect
normal rat erythrocytes against hemolysis induced by free radicals under in vitro
conditions showing their antioxidant potential (Yuan et al., 2005a)and strong free radical
scavenging activity (Yuan et al. 2005b).
Benoit et al. (2006) tested the effectiveness of two feruloyl esterases from
Aspergillus niger to release phenolics from agro-industrial by-products including
autoclaved maize bran. Their FAEA enzyme released 40% of the ferulic acid indicating
strong enzyme specific results versus only 8% release with the FAEB enzyme. In maize
and wheat bran, arabinofuranose is esterified at O-5 by ferulic acid and the FAEA
enzyme was mainly active on O-5 ester linkages.
Napolitano et al. (2006) tested various strains of Trichoderma species in their
capacity to produce hydrolytic enzymes that solubilized insoluble dietary fiber in durum
wheat fiber and barley spent grain. They found that their optimized conditions increased
soluble dietary fiber in bran from 3.7% to 8.7%, increased free and soluble conjugate
phenolic compounds from 0.9% to 3.4%, and water soluble antioxidant activity from
1.1% to 2.3%. A4-fold increase in the free and soluble conjugate ferulic acid content
represented 40% of the total ferulic acid in the bran. It is expected that the increased free
phenolics due to the enzyme treatments will result in increased phenolic compound
bioavailability.
Along with the importance of improved bioavailability of phytonutrients, ingredient
functionality with respect to product quality is also a critical consideration. Trogh et al.
(2004) utilized xylanase enzyme during bread making to convert water-unextractable
19
arabinoxylan (AX) to soluble AX and bread made with the xylanase enzymes had
increased loaf volume. The results show that increasing levels of xylanase solubilized
increasing amounts of arabinoxylan while also decreasing its average molecular weight.
This was important because solubilization of AX increased viscosity in bread doughs at
lower levels of enzyme while higher levels reduced viscosity due to reduction in AX
molecular weight.
Enzymatic activity during sprouting of grains occurs both from endogenous grain
enzymes as well as hydrolytic enzymes produced by indigenous microorganisms present
in the outer layers of the kernel (Katina et al., 2007). When Katina et al. (2007)
fermented germinated rye meal with S. cerevisiae yeast, free phenolic acid levels
increased 10 fold vs. an increase of <25% for germination alone.
Combined Processes
While enzyme treated maize bran released up to 30% of the total ferulic acid, steam
explosion pretreatment (heat-up, holding at 190°C for 1 minute) followed by enzyme
treatment (3% w/w protein/bran at 40°C for 24 h) increased the level of solubilized
ferulic acid to 80% with about 2/3 as free ferulic acid (Saulnier et al., 2001). Figure 4
shows the results of various combinations of steam explosion pretreatment and enzyme
treatment. The steam explosion pretreatment needed to exceed 170°C to show
effectiveness, however heating time was an important factor in their results as heat-up
time in the reactor was 15 to 25 minutes to reach the target temperature. Steam explosion

20
pretreatment at pH = 4 was important for feruloylated oligosaccharide release as
arabinose chains are sensitive to hydrolysis at low pH. Extending the steam explosion
treatment to 160°C for 1 h also achieved 80% solubilization of ferulic acid as feruloylated
oligosaccharides. Subsequent treatment with feruloyl esterases was then necessary to get
ferulic acid in its free form (Saulnier et al., 2001).
Figure 4. Total Solubilization of Ferulic Acid from Maize Bran by a Combined
Action of Flash-Explosion and Novozyme 342 (Saulnier et al., 2001).
Combining chemical and physical processes, Lundberg et al. (2003) developed a
patented process to create highly refined cellulose (HRC) with high water holding
capacity. The process utilized alkali pretreatment of cellulose followed by neutralization.
The cellulose was then refined to break lignin and reduce fiber size. High pressure
homogenization was then employed to produce the HRC. HRC had a water holding

21
capacity of 25 to 56g H2O per gram dry HRC. While creating HRC did not retain any
solubilized parts of the cellulose, the process has many similarities to the process utilized
to treat wheat bran in this research program including the pretreatment with alkali and
subsequent high pressure homogenization treatment.
Relationship of Phenolics and Flavor in Whole Grain Wheat Products
What are the reasons for low consumption of whole grains despite their known
health benefits? Although more whole grain foods are becoming available to consumers,
they often choose refined grain products due to appearance, taste, and texture preferences
(Marquart et al., 2007). Lang and Walker (1990) found that untrained panelists could
discriminate between the appearances of whole red vs. whole white wheat hamburger
buns when tested under red light. When red or white wheat hamburger buns were tasted
under fluorescent light, panelists scored them significantly different aligned with their
preexisting preferences, but there was no significant winner overall. Bakke et al. (2007)
had similar results in that preference of whole wheat vs. refined wheat flour breads noted
on a preliminary questionnaire related to increased scoring for the preferred bread during
taste tests. Appearance preference for 100% whole wheat bread over refined (either
white or darkened with caramel color) was shown. Panelists also showed increased
liking for whole wheat bread when it was made sweeter with honey; possibly overcoming
negative flavors in the whole wheat products.

22
In both of these studies, flavor and taste preferences were not due to dislike of
darker whole wheat color. Texture was not a factor and flavor preference was strongly
linked to pre-recorded liking of whole wheat vs. refined breads, so liking of whole wheat
flavors may be linked to learned behavior. Therefore the anecdotal evidence of people
liking whole wheat products less than refined wheat may only be true for population
subgroups. Undeniably though, there are flavor differences between whole wheat and
refined wheat products, and possibly also across different varieties of wheat such as red
vs. white wheat. It is worthwhile to explore these differences.
Measurement of Aroma and Taste Compounds in Grain and Wheat
Ingredients
Both volatile and nonvolatile compounds found in wheat contribute to the aroma
and taste of grain ingredients and products they make. Flavor particularly influences
acceptance by consumers, and volatile aroma components generally are regarded as the
most important parameters of food flavor quality (Heath and Reineccius, 1986). As far
back as the 1970’s, Maga summarized 24 volatiles associated with wheat including
alcohols, aldehydes, and ketones (Maga, 1978). Negative aroma volatiles were identified
by Seitz and Ram (Seitz and Ram, 2000) who measured methoxybenzene compounds,
including 1,2-Dimethoxybenzene and 1,4-Dimethoxybenzene, causing musty, sour and
insect odors in grain samples.
Other objectionable and bitter flavors in whole wheat ingredients and products,
besides oxidation of lipids, may result from derivatives of nonvolatile phenolic

23
compounds. Phenolic compounds are the major secondary metabolites of plants and are
formed from phenylalanine and tyrosine precursors. They occur in free as well as bound
forms. Klepacka and Fornal summarized the classifications of diverse phenolic structures
including anthocyanins and tannins contributing to sensory properties of foods (Klepacka
and Fornal, 2006). Because flavor activity is strongest in soluble and free phenolic
compounds, the bitter flavored tannins (water soluble polyphenols) and free phenolics
would have a larger impact on sensory properties when compared to bound phenolic
compounds.
Phenolic compounds found in wheat include ferulic, vanillic, gentisic, caffeic,
salicylic, syringic, p-coumaric, and sinapic acids. Ferulic acid, the primary phenolic acid
in the grain accounting for up to 90% of total phenolic acids, is found predominantly in
the aleurone cell walls of the kernel (Naczk and Shahidi, 2006). While Siliani et al.
showed that a positive correlation does exist between the amount of phenolic compounds
and bitter intensity in olive oil (Siliani et al., 2006), individual phenolic compounds in
wheat have not been shown to have the same bitter intensity. Heinio et al. profiled the
flavor of rye milling fractions by sensory descriptive analysis. The inner endosperm was
found to be mildest in flavor and the outer bran layers the most intense in flavor (Heinio
et al., 2003). Free phenolic acids were found to be the most flavor active in rye grain.
The lignan pinoresinol along with syringic acid produced bitterness whereas ferulic and
sinapic acids caused germ-like flavors (Heinio et al., 2008). Syringic acid is not typically
found above the taste threshold level in wheat bran (Maga and Lorenz, 1973).

24
Although hard white winter wheat is agronomically the same as the hard red winter
wheat, anecdotal claims that red wheat is more bitter than white wheat have been stated
for some time. For example, Perrin and Anthony (2001) claimed: ―White varieties of
hard wheat have less of the red, bitter-tasting, tannin in the seed coat. They offer slightly
higher yields of flour that tastes sweeter than flour from red varieties.‖ Wheat bran
bitterness may be more variety dependent than color dependent. Chang and Chambers
(1992) reported flavor differences in loaf breads made from HRW (Hard Red Winter) or
HWW (Hard White Winter) wheat. Both HRW and HWW crust were similar in aroma
and flavor characteristics including burnt, toasted, brown, and grain-like aromas and
flavors with additional bitter flavor notes. Traditional fermentation of wheat bran has
been shown to significantly decrease levels of tannin and phytic acid in coarse, medium,
or fine particle size fractions (Hassan et al., 2008).
Measurement of Aroma and Taste Compounds in Grain and Wheat
Products
More than 540 compounds have been described in the complex aromatic fraction of
bread (Chang et al., 1995). Volatile and nonvolatile compounds contribute to the flavor
of bread including acids, alcohols, aldehydes, esters, ethers, ketones, furans,
hydrocarbons, lactones, pyrazines, pyrroles, and sulfur compounds (Quilez et al., 2006).
Early work by Lorenz and Maga attributed reduction in aldehydes and increase in ketones
to reduced flavor and taste acceptability during bread staling (Lorenz and Maga, 1972).
25
They noted the ratio of aldehydes to ketones was reduced from 72.9:27.1 to 15.1:84.9
after 5 days of storage and concluded the decrease in aldehyde content contributed to the
decreased flavor and taste acceptability of stale bread. More recently, Quilez et al.
(2006) reported contradictory results. They found a positive sensory correlation between
flavor scores in commercial baguettes and salt, pH (higher), alcohols (ethanol, 2-
phenylethanol) and ketones (diacetyl, acetoin). A negative correlation was found with
high titratable acidity (acetic, butyric), and aldehydes (hexanal, benzaldehyde, 2.4
decadienal) (Quilez et al., 2006).
When studying volatiles in bread, more compounds are found when organic solvent
extraction or steam distillation methods are used for isolation than when headspace
methods are used. Chang et al. (1995) measured volatile flavor components of breads
made from different wheats, with and without bran. They found that 15 compounds were
significantly higher in relative quantities in whole wheat bread than in white pan bread,
including fruity odors (ethyl acetate, isoamyl acetate, 1-pentanol, and ethyl octanoate),
green and grassy flavors (dimethyldisulfide, 2-octanone, and 1-hexanol), and increased
levels of fermented and sour flavors (3-methylbutanal, 1-butanol, heptanal, and 1-octen-
3-ol). Maeda et al. (2009) evaluated flavor compounds in straight dough and sourdough
breads made from refined flour (70%) and polished bran fraction (30%) of outermost,
middlemost, and innermost fractions of the same wheat. Both sourdough and straight
dough crumb and crust made with the outermost bran fraction (C-1) had a very large
increase in methoxybenzenes. As mentioned earlier, methoxybenzene compounds caused
musty, sour and insect odors (Seitz et al., 2000).

26
Chang and Chambers (1992) reported flavor differences in loaf breads made from
HRW or HWW wheat. They suggested that a phenolic-like flavor and aroma found in
HWW crumb may have been due to phenolic acids present in the wheat bran; however
they did not find a similar flavor in HRW crumb. Lang and Walker (1990) compared
hamburger buns made with HRW and HWW wheat. In triangle tests, panelists were able
to distinguish between red wheat and white wheat hamburger buns when different forms
of wheat were used including cracked wheat, flaked wheat, wheat bran, and whole wheat,
however panelists did not have a significant preference for either wheat color when used
in hamburger buns. Stanyon and Costello (1990) noted biscuits with added wheat bran
were stronger in wheat flavor than refined wheat biscuits resulting in increased bitter,
metallic, or salty aftertastes. Not all bran fractions are alike in flavor. Heinio et al.
(2003) demonstrated in rye bread that the outermost rye bran fractions significantly
increased bitterness in crumb and caused an intense aftertaste and flavor in the crust. The
inner shorts fraction resulted in a cereal-like flavor in bread, but without obvious
bitterness or intense flavor.
While predisposition of the taster for whole wheat vs. refined wheat products
influences liking for flavors associated with wheat bran, bitter compound tasting ability
may also be a factor. Bakke and Vickers (2007) measured sensitivity to bitterness of
sensory panelists by having them rate the intensity of 6-n-propylthiouracil (PROP). The
study participants also rated liking of refined and whole wheat breads. PROP
supertasters were more sensitive to bitter tastes and liked laboratory made whole wheat
breads less than PROP medium and nontasters.

27
Modifying Flavor and Taste Profiles through Processing
There are many processing methods that can modify phenolics in wheat that may
have flavor impacts including chemical, thermal, enzymatic, microbial, and combinations
of these processes. Monsalve-Gonzales and Prakash (2003) treated bran with an acid to
reach pH 4-6 forming acidified bran, then treating the acidified bran with low levels of
ozone to oxidize ferulic acid, preferably to vanillin to try to improve bran flavor. While
the small amount of free ferulic acid in wheat bran would be available for oxidation
reactions, the vast majority of bound ferulic acid would not, as ferulic acid is generally
bound with ester linkages. Acid treatment breaks glycosidic bonds and solubilizes sugars
while leaving ester bonds generally intact, while alkali treatment breaks the ester bond
linking phenolic acids to the cell wall (Mathew and Abraham, 2004). Chemical
treatments alone require high concentrations of acid or base and can lead to modifications
of other components and bring about unwanted chemical changes in plant cell walls.
Combining pH and thermal treatments, Bredie et al. (2002) extruded wheat flour at
different temperatures from 120 °C to 150°C and pHs (adjusted from 6.8 to 8.8 with
sodium hydroxide) to investigate complex flavor generation in direct extrusion cooking
of cereals. They measured volatiles by GC and assessed odors of the extruded products
by trained assessors. Raising the pH increased the sulfur-containing volatiles formed in
the Maillard reaction (Bredie et al., 2002). High pH produced strong burnt, sulfury
odors, intermediate pH produced wheat-like and puffed wheat odors, and low pH
extrudates (samples without sodium hydroxide addition) had cooked milk notes.
Temperature also had an effect. Lower temperature extrudates had increased levels of

28
lipid-derived furans and aldehydes. Those compounds may have reacted at higher
temperatures with other compounds formed during extrusion. Higher temperature
extrudates showed increased levels of thiophenes, thiophenones, thiazolines, thiapyrans,
polythiacycloalkanes, and sulfur-containing furans (Bredie et al., 2002).
A gentler and more specific method for modifying phenolic compounds than pH
and thermal treatments is to use enzymes. Cinnamoyl or feruloyl esterases or cinnamic
acid hydrolases hydrolyze the ester bond between hydroxyl cinnamic acids like ferulic
acid and hemicellulose in plant cell walls (Mathew and Abraham, 2004). Feruloyl
esterases isolated from different source organisms show substrate selectivity depending
on xylan substitution and the presence of other hemicellulases. Catalytic efficiency of
ferulic acid esterases is determined by the distance between the phenolic ring and the
ester bond and the number and position of methoxy and hydroxyl substitutions on the
benzene ring (Mathew and Abraham, 2004). Releasing ferulic acid from lignin in cereal
bran has been accomplished using various enzymes singly and in combination including
feruloyl esterases, cinnamoyl esterases, xylanases, arabinases, and arabinofuranosidases
(Mathew and Abraham, 2006). Once freed, ferulic acid has many uses including use as a
precursor for making vanillin, 4-vinyl guaiacol (an undesirable constituent in beer and
soy sauce flavors), caffeic acid (Mathew and Abraham, 2006),or as a feed stock for
making polymers, epoxides, alkylbenzenes, guaiacol and catechol (Mathew and
Abraham, 2004).
Tannins are naturally occurring polyphenolic compounds that form strong
complexes with protein and other macromolecules such as starch, cellulose, and minerals.

29
Not only do tannins contribute astringent or bitter flavors resulting in reduced feed intake,
but they can bind macromolecules reducing digestibility and nutrient absorption (Aguilar
et al., 2007). Modifying tannin properties with enzymes to improve flavor is performed
commercially. Tannase enzymes hydrolyze the ester bonds of tannic acid and are used in
the food industry to reduce haze and bitterness in juice. Industrially, hydrolysis of
tannins by tannases produces gallic acid and propylgalate antioxidants for use in foods,
cosmetics, hair products, adhesives, and the lubricant industry (Aguilar et al., 2007).
Just as there are multiple reasons consumers choose not to eat whole grain
products, there are many different ways to modify whole grain products to make them
more appealing in appearance, more palatable, and more healthful. Whole wheat in
particular has the greatest potential for consumption increase since so many refined wheat
products are currently available in whole wheat versions including bread, pasta, cereal,
crackers, extruded snacks, cookies, and more. Wheat bran also has the potential of
becoming a functional ingredient instead of an inert one if processed properly. Bound
phytochemicals may also be made bioavailable through processing as well. The goal for
this research program is to explore physical and chemical processing of wheat bran to
improve its functionality and bioactivity.
30
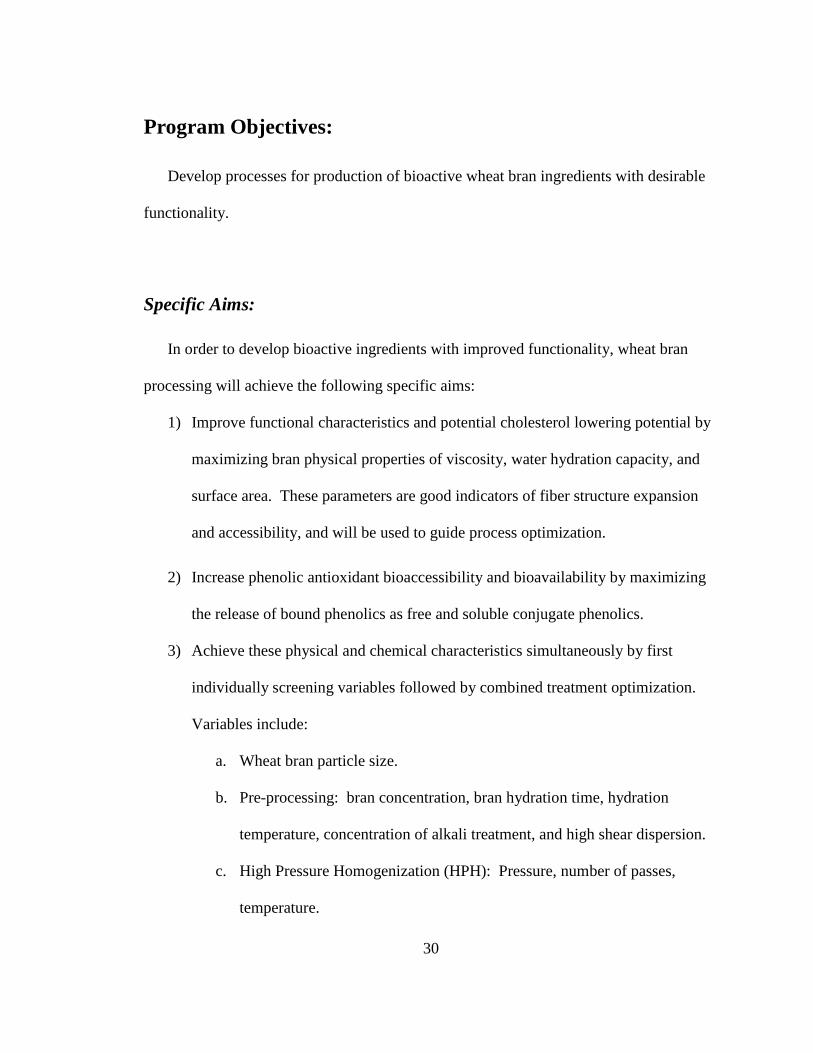
Program Objectives:
Develop processes for production of bioactive wheat bran ingredients with desirable
functionality.
Specific Aims:
In order to develop bioactive ingredients with improved functionality, wheat bran
processing will achieve the following specific aims:
1) Improve functional characteristics and potential cholesterol lowering potential by
maximizing bran physical properties of viscosity, water hydration capacity, and
surface area. These parameters are good indicators of fiber structure expansion
and accessibility, and will be used to guide process optimization.
2) Increase phenolic antioxidant bioaccessibility and bioavailability by maximizing
the release of bound phenolics as free and soluble conjugate phenolics.
3) Achieve these physical and chemical characteristics simultaneously by first
individually screening variables followed by combined treatment optimization.
Variables include:
a. Wheat bran particle size.
b. Pre-processing: bran concentration, bran hydration time, hydration
temperature, concentration of alkali treatment, and high shear dispersion.
c. High Pressure Homogenization (HPH): Pressure, number of passes,
temperature.

31
Expected Outcome and Anticipated Use of the Results
We anticipate that activities under this objective will result in: (1) an understanding
of the effects of chemical and mechanical treatments on the physical properties and
bioaccessibility profiles of phytochemicals in processed wheat bran; (2) optimized
processes for enhanced bioavailability of phytochemicals in processed wheat bran.

32
Project 1: Screening of Preprocess and High Pressure Processing
Variables
In order to modify functionality of wheat bran while improving bioavailability of
phenolic antioxidants, the first step is to understand the effects of each individual process
variable on the physical and chemical properties of the bran.
Hypothesis
Individual variable prescreening will result in identification of variables important
for modifying physical and chemical characteristics of wheat bran and their appropriate
ranges for further combined optimization testing.
Objectives
1) Test bran fractions including bran, red dog, bran + red dog combinations to
determine the response of fractions and intact bran to processing conditions.
2) Test HPH variables including sample temperature, homogenization pressure, and
number of passes to determine the effect on particle size reduction, viscosity,
water hydration capacity, increase in free phenolics, and matrix water interactions
(NMR).
3) Test preprocess conditions of dry grinding, prehydration, chemical pretreatment,
and high shear mixing on bran properties to determine the effect on particle size

33
reduction, viscosity, water hydration capacity, increase in free phenolics, and
matrix-water interactions (NMR).
4) Determine physical and chemical treatment conditions important for further
optimization experimentation that will modify functionality of wheat bran while
improving bioavailability of phenolic antioxidants.
Materials and Methods
Wheat Bran: For preliminary screening of dry and wet particle size reduction and
HPH testing, a 90% HRS, 10% HRW wheat blend from Archer Daniels Midland was
milled in a commercial facility (ADM Milling Co., Minneapolis, MN). Bran, shorts, red
dog, and flour fractions were all obtained and held at -40°C until use. For chemical
treatment testing and process optimization, Soft White Wheat (SWW) bran was obtained
from King Milling Company (Lowell, MI).
Dry Particle Size Reduction utilized rotor beater milling technology (Retsch
GmbH, Model SR 300, Haan, Germany). Multiple passes through several screen sizes
were utilized to prevent significant temperature rise in the bran during grinding. Bran
was passed sequentially through screens of 0.75mm, 0.5mm, 0.25mm, and some of the
samples through 0.12mm.
Alkali Pretreatment: 5% bran solutions were prepared (using 10g bran sample on
dry basis, add solution to 200g) with appropriate alkali concentration and agitated in an
Innova 4300 incubated shaker (New Brunswick Scientific, Edison, NJ) for the specified
time and temperature. Solutions were then neutralized to pH 7 with 1N HCl.

34
High Shear Mixing: Samples were diluted to 2% bran in solution totaling 500ml
and then mixed with high shear using a T25 Basic SI homogenizer with S25N-25F
dispersing element (IKA Works, Wilmington NC). High shear mixing was performed
prior to all high pressure homogenization (HPH) processing to reduce particle size and
prevent clogging of HPH disruption chambers. The 0.5 to 1.0L samples were mixed for 5
minutes at 24,000 rpm. Viscosity and particle size distribution were typically measured
at this time and samples frozen for further analysis. Remaining samples were high
pressure homogenized. Additional wet grinding and milling was attempted on other high
shear rotor stator type homogenizers (Carter model XMUC752BF; T25 Basic SI
Homogenizer, IKA Works Inc., Wilmington, NC; or Greerco, Homogenizer model 1L,
Colloid Mill W200V, North Andover, MA).
High Pressure Homogenization (HPH) was carried out on an M-110Y Laboratory
Microfluidizer® Processor (Newton, MA). Homogenization pressure was controlled by
adjusting compressed air pressure. Pressures from 10,000 psi to 23,000 psi were utilized
Disruption chambers used to achieve homogenization included a 200 micron chamber
followed by a 100 micron dispersion chamber in series. The 200 micron chamber
reduced particle size enough to prevent plugging of the 100 micron chamber. Another
configuration tested was a 75 micron emulsification chamber followed by a 200 micron
chamber providing back pressure. Heat was generated during processing so chilled water
cooled the processed solutions. Solution concentrations from 1% to 5% solids were
utilized successfully, with 2% utilized most often. Single and multiple passes through the
HPH were tested. Two passes through the HPH were standard. Particle size and
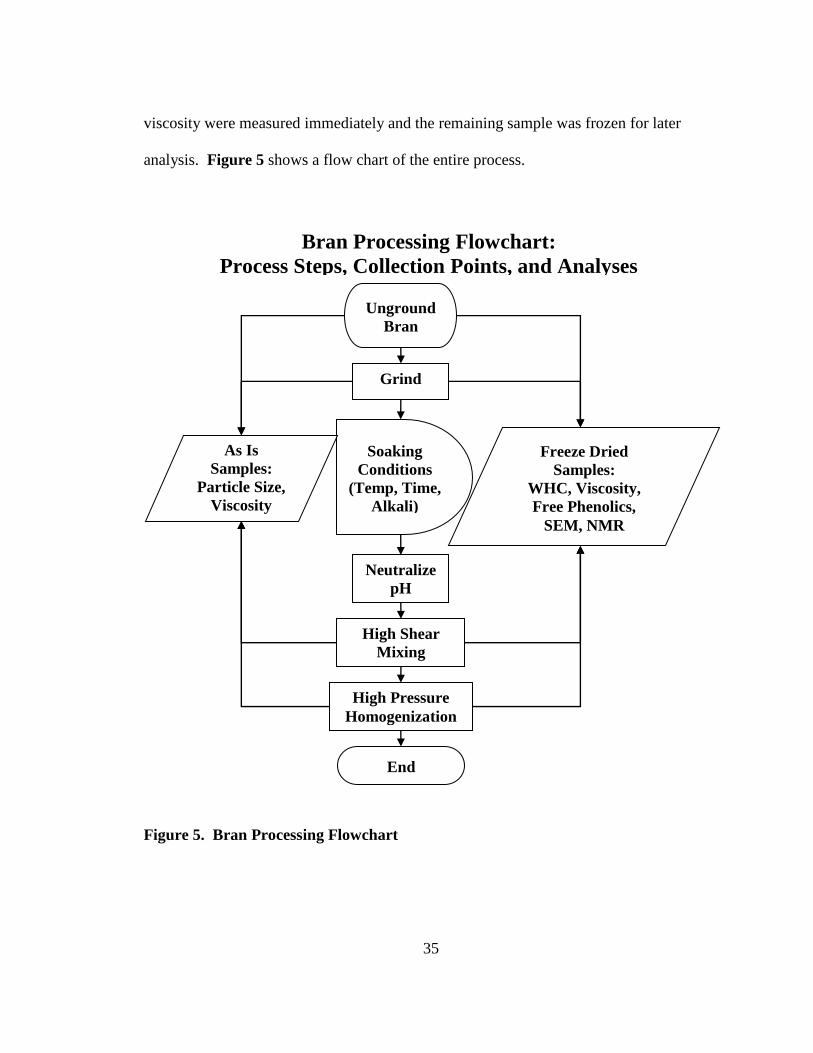
35
viscosity were measured immediately and the remaining sample was frozen for later
analysis. Figure 5 shows a flow chart of the entire process.
Figure 5. Bran Processing Flowchart
Unground
Bran
End
Grind
Freeze Dried
Samples:
WHC, Viscosity,
Free Phenolics,
SEM, NMR
High Shear
Mixing
Soaking
Conditions
(Temp, Time,
Alkali)
Neutralize
pH
High Pressure
Homogenization
As Is
Samples:
Particle Size,
Viscosity
Bran Processing Flowchart:
Process Steps, Collection Points, and Analyses

36
Moisture Content of duplicate samples was measured by AACC Moisture method
44-15A. Briefly, 2g of sample was weighed into an aluminum dish with cover. Sample
was heated in a gravity oven at 130°F for 60 minutes. Dishes were removed from the
oven, covered, and placed in a desiccator to cool. Moisture was calculated as loss in
weight divided by original sample weight. Replicates must be within 0.2% moisture.
Particle Size Distribution was measured by two methods: AACC Method 66-20
using a Ro-tap sieve shaker (model RX 29), or laser diffraction particle size analyzer
(LS-13-320, Beckman Coulter Inc., Brea, CA) using the Universal Liquid Module. For
Ro-tap sieve analysis, 100g of bran or flour were sifted with tapping for 10 minutes.
Viscosity was measured on a Rapid Visco Analyzer (RVA, Newport Scientific).
As-is samples from intermediate processing steps at 2% dry matter were stirred at
160rpm at 37°C until viscosity stabilized (usually after 2-3 minutes) and a 3 minute
average viscosity was taken. Dried samples were used at 6% dry matter suspensions,
stirred at 160 rpm 37°C, and a three minute average viscosity was taken in the stable area
from minutes 5 to 8.
Freeze Drying was performed on a Virtis Freezemobile freeze dryer. Models used
include 12EL and 25EL (SP Industries, Gardiner, NY).
Water Hydration Capacity (WHC) was difficult to perform due to the limited
sample size available and the extremely high WHC of processed samples making them
difficult to hydrate without excess water. Therefore a modified micro-version of AACC
method 56-30 was developed. Briefly, 0.1g of sample (A) of known moisture content (B)
was combined with 1.0 ml distilled water (C) in weighed 2.0 ml microfuge tubes (D).
37
The sample was vortexed 3 times over 30 minutes to disperse and completely wet the
sample. Tubes were centrifuged at 2000g for 10 minutes. The supernatant (E) (which
included water extractable material) was decanted to a separate tube (F). The remaining
hydrated pellet and tube was weighed (G). WHC was calculated as the water remaining
in the sample divided by the sample dry matter weight (G-A-D) / (A*(1-B%)). Duplicate
samples were run in each test and the result was the average. Less than 5% relative
standard deviation is targeted, though most samples had less than 2% relative standard
deviation among duplicate samples. Freeze dried samples were assumed to have 1%
moisture content for calculation purposes.
Scanning Electron Microscopy (SEM) was utilized to provide a visual
confirmation of bran modification. A Hitachi S3500N variable pressure scanning
electron microscope (SEM) was utilized for selected process samples. Samples were
critical point dried to remove all water. This was accomplished by dispersing in water in
1.5 ml microfuge tubes, mixing on a Roto Torque Tumbler 5 minutes at speed setting 5,
then gradually replacing water with increasing concentrations of ethanol solution: 25%,
50%, 75%, 95%, and three times at 100%. After each tumbling, the samples were
centrifuged and then re-dispersed in the next solution. Samples were placed on stubs and
coated with gold in a Fullam Sputter-coater.
The Hitachi S3500N Variable Pressure Scanning Electron Microscope (SEM) had
Quartz PCI digital imaging, photo CRT recording camera, stage with motor driven X &
Y axes, standard Secondary Electron Detector (SED), Emitech K-1150 Cryogenic System
with cryo-prep unit, and airlock interface to SEM. The electron beam was set at 5KV.

38
Free Phenolic Extractions from bran samples were performed according to
established methods (Adom and Liu, 2002). Briefly, 1.0g defatted bran samples were
extracted with 20 ml 80% ethanol for 1 hour with shaking each time. Samples were
centrifuged and supernatant removed. Three extractions were performed and the pooled
extracts were concentrated to about 5 ml by rotary evaporation under vacuum at 45°C.
The sample was acidified with HCL (pH <2) and transferred to a centrifuge tube with
water. Phenolic acids were extracted 3 times with 10 ml diethyl ether and vortexed. The
ether fractions were removed, pooled, and evaporated. The extract was re-dissolved in
methanol and samples were diluted for HPLC analysis.
HPLC Measurements of phenolic acids in sample extracts were performed using a
RP-HPLC procedure on a Varian Pro Star HPLC with Polaris solvent delivery modules
(Palo Alto, CA), employing a Phenomenex Luna phenyl-hexyl column (Torrance, CA),
250 mm x 4.6 mm, 5 m. Elution was carried out using a binary gradient consisting of 1
mM TFA (A) and MeOH (B): Following a rinsing and equilibration step, initially
concentration of 5% MeOH was ramped to 30% over 25 minutes, then from 30% to 50%
MeOH from 25 to 35 minutes, then from 50% to 100% MeOH from 35 to 45 minutes,
then held isocratically for 10 minutes at 100% MeOH, then ramped down to 5% over 5
minutes and held isocratically for 5 minutes. Pre flush volume was 30 L. The injection
volume was 10 L, the column temperature 75°C, and the flow rate was maintained at 1
mL min-1
. Detection was carried out using a Varian ProStar 325 UV Vis detector (Palo
Alto, CA) at 280nm.

39
Matrix-Water Interactions, which are closely related to the structure-function
relationships in foods, were characterized using nuclear magnetic resonance (NMR)
relaxometry. Water mobility is a function of the physical and chemical environments in
which the water molecules are embedded. NMR technique lends itself best to the study of
physiochemical properties of water inside samples. Untreated and processed bran
samples were freeze dried and hydrated to specific moisture contents from 0.01% g
H2O/g d.m. to 5.0 g H2O/g d.m. Samples were equilibrated for 24 hours and measured.
Three sequences FID, CPMG and INVREC were applied to measure relaxation times
T2*, T22, T21, and T1.
Experimental Design and Analysis utilized Minitab statistical software version 16
(Minitab Inc., State College, PA). The factorial design was analyzed by General Linear
Model to determine main effects and interactions.

40
Results and Discussion
Flour and Bran Fraction Particle Size
Table 2. depicts typical fraction sizes for an experimental milling and sifting setup.
Milling Fraction From Break Rolls From Reduction Rolls
Bran > 864 μ
Shorts (plus germ) < Bran and > 375 μ > 240μ
Red Dog < Shorts and > 136μ < Shorts and > 136μ
Straight Grade Flour < 136μ < 136μ
Mill Feed: Combined Bran, Shorts (plus germ) and Red Dog
Table 2. Typical Fraction Sizes for Experimental Milling and Sifting
The measured quantity of each common milling fraction from the HRW blend is
displayed in Table 3. The shorts fraction contained the germ which is about 3% of a
wheat kernel. This means that the shorts fraction was really composed of about 25%
germ. Shorts contain mostly medium sized bran pieces with some flour adhering to the
bran. The particle size distribution results for the hard wheat blend are displayed in
Table 4. It is interesting to note that large sized bran and shorts are detrimental to
processing whole grain baked goods. Bran for whole grain products is often further
ground to produce a fine grind bran or flour where the mill feed is ground to the same
relative particle size as the flour fraction. The red dog fraction contains a large
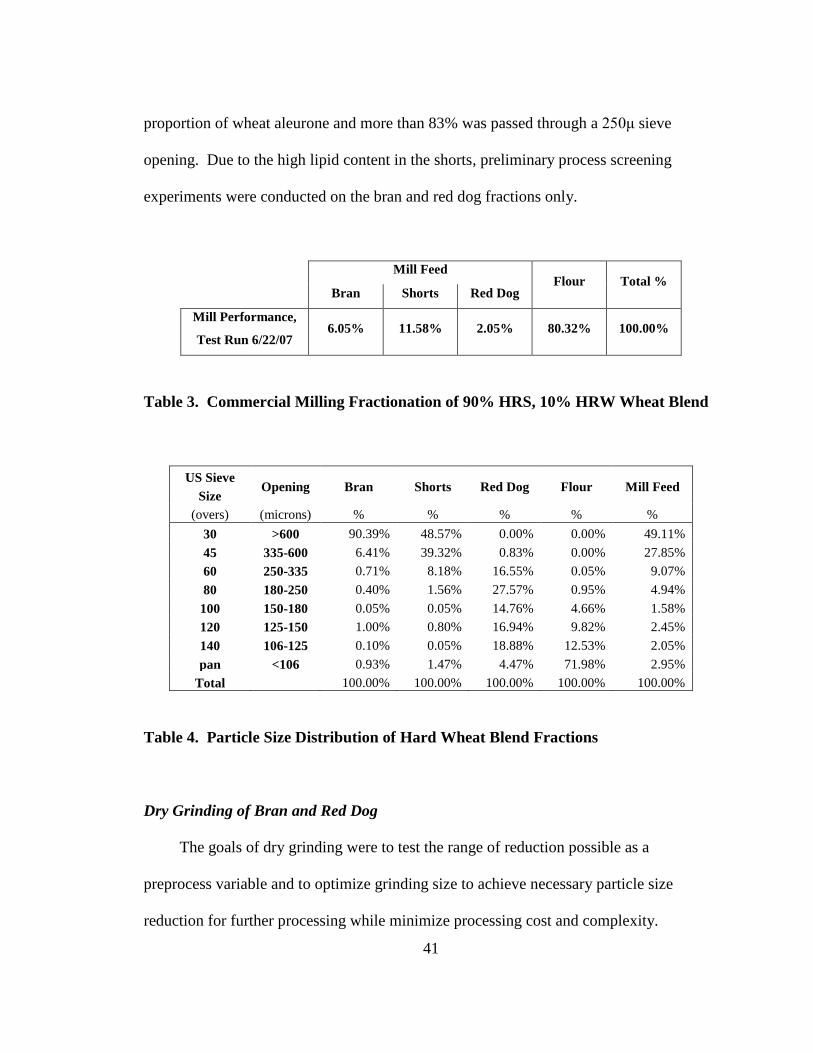
41
proportion of wheat aleurone and more than 83% was passed through a 250μ sieve
opening. Due to the high lipid content in the shorts, preliminary process screening
experiments were conducted on the bran and red dog fractions only.
Mill Feed Flour Total %
Bran Shorts Red Dog
Mill Performance,
Test Run 6/22/07 6.05% 11.58% 2.05% 80.32% 100.00%
Table 3. Commercial Milling Fractionation of 90% HRS, 10% HRW Wheat Blend
US Sieve
Size Opening Bran Shorts Red Dog Flour Mill Feed
(overs) (microns) % % % % %
30 >600 90.39% 48.57% 0.00% 0.00% 49.11%
45 335-600 6.41% 39.32% 0.83% 0.00% 27.85%
60 250-335 0.71% 8.18% 16.55% 0.05% 9.07%
80 180-250 0.40% 1.56% 27.57% 0.95% 4.94%
100 150-180 0.05% 0.05% 14.76% 4.66% 1.58%
120 125-150 1.00% 0.80% 16.94% 9.82% 2.45%
140 106-125 0.10% 0.05% 18.88% 12.53% 2.05%
pan <106 0.93% 1.47% 4.47% 71.98% 2.95%
Total 100.00% 100.00% 100.00% 100.00% 100.00%
Table 4. Particle Size Distribution of Hard Wheat Blend Fractions
Dry Grinding of Bran and Red Dog
The goals of dry grinding were to test the range of reduction possible as a
preprocess variable and to optimize grinding size to achieve necessary particle size
reduction for further processing while minimize processing cost and complexity.

42
Multiple dry and wet milling processes were tested including pin milling, hammer
milling, rotor-beater type milling, and colloid milling. Reaction chamber limitations on
the laboratory HPH require particle size reduction of bran to less than about 400 microns
in order not to plug the 200 and 100 micron interaction chambers. The rotor-beater mill
(Retsch, SR300) may utilize a range of screen sizes including 2.0, 1.0, 0.75, 0.5, 0.25,
0.20, and 0.12mm. Although a screen opening may be a circular diameter, particles are
accelerated to high speeds in the rotor beater mill and produce a range of particle sizes.
The 0.12mm screen produced an average bran particle size of 106μ, but it was nearly
impossible to grind bran or red dog through the 0.12mm screen without frequent
plugging. Grinding through the 0.2mm screen was very slow with significant loss to dust
through the air collector. When grinding bran through the 0.25mm screen, a first pass
through the 1.0mm (or 0.75mm) screen was necessary; whereas 0.5mm could be done in
a single pass.
Fraction Opening Bran,
0.75mm
Bran,
0.5mm
Red dog,
0.5mm
Particle
Size
(overs) (microns) % % %
30 >600 5.89% 0.07% 0.04% Large
45 335-600 35.63% 11.27% 0.04%
60 250-335 18.65% 26.24% 4.82%
Coarse 80 180-250 11.56% 26.42% 20.52%
100 150-180 3.72% 10.32% 29.05%
120 125-150 9.75% 19.16% 44.18%
Fine 140 106-125 3.77% 2.21% 0.52%
pan <106 11.03% 4.31% 0.83%
Total 100.00% 100.00% 100.00%
Table 5. Particle Size Distribution of Ground Bran and Red Dog Samples

43
Table 5 shows bran samples ground on a Retsch mill through 0.75mm screen,
followed by sifting, then ground through a 0.5mm screen then sifted again. Red dog
samples needed only one pass through the 0.5mm screen due to their smaller starting
particle size.
During HPH processing, bran particles are forced through a 100μ opening and
although only dilute solutions were tested under very high pressure, Large particle size
bran > 400 microns sometimes clogged the chambers resulting in a shutdown of the
equipment. Based on these observations, the Large bran particle size range was not
acceptable and bran fractions were then minimally processed through a 0.5mm screen
size. Because particle size was shown to be important for release of phenolics (Caprez
and Fairweather-Tait 1982; Yu and Kies 1993) and physical properties (Chau et al.
2006), bran grinding through 0.25mm (fine) and 0.5mm (coarse) were chosen for further
optimization.
Initial HPH Experiments with Bran and Red Dog
Hard Wheat Bran and Red Dog samples were ground through a 120μ screen in the
rotor beater mill to minimize risk of plugging during initial HPH testing. Bran and red
dog were suspended in water at 3% concentration and prehydrated using a high shear
mixer at 50% power for 5 minutes and constantly stirred during HPH to prevent particle
settling. The HPH was operated at 13,000 psi and had a throughput of approximately 500
ml/min. Sample temperature increases during processing so chilled water was used to
bring the processed sample back to 25°C within a few seconds and prior to the sample
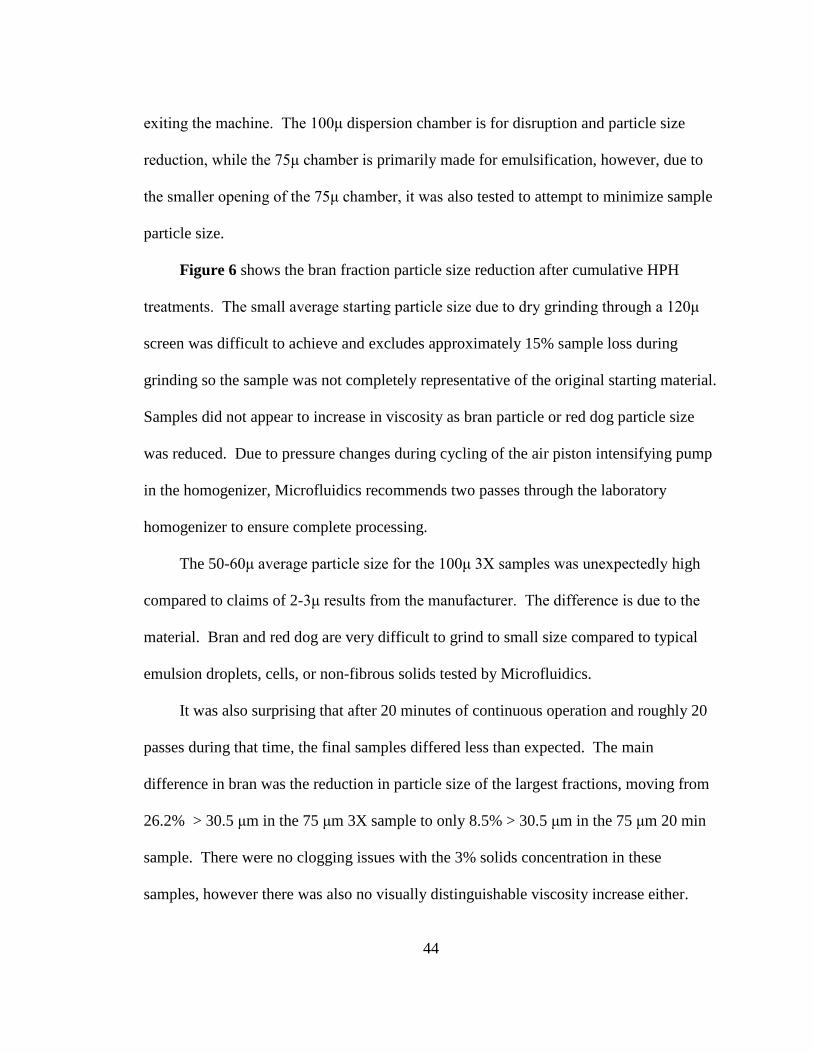
44
exiting the machine. The 100μ dispersion chamber is for disruption and particle size
reduction, while the 75μ chamber is primarily made for emulsification, however, due to
the smaller opening of the 75μ chamber, it was also tested to attempt to minimize sample
particle size.
Figure 6 shows the bran fraction particle size reduction after cumulative HPH
treatments. The small average starting particle size due to dry grinding through a 120μ
screen was difficult to achieve and excludes approximately 15% sample loss during
grinding so the sample was not completely representative of the original starting material.
Samples did not appear to increase in viscosity as bran particle or red dog particle size
was reduced. Due to pressure changes during cycling of the air piston intensifying pump
in the homogenizer, Microfluidics recommends two passes through the laboratory
homogenizer to ensure complete processing.
The 50-60μ average particle size for the 100μ 3X samples was unexpectedly high
compared to claims of 2-3μ results from the manufacturer. The difference is due to the
material. Bran and red dog are very difficult to grind to small size compared to typical
emulsion droplets, cells, or non-fibrous solids tested by Microfluidics.
It was also surprising that after 20 minutes of continuous operation and roughly 20
passes during that time, the final samples differed less than expected. The main
difference in bran was the reduction in particle size of the largest fractions, moving from
26.2% > 30.5 μm in the 75 μm 3X sample to only 8.5% > 30.5 μm in the 75 μm 20 min
sample. There were no clogging issues with the 3% solids concentration in these
samples, however there was also no visually distinguishable viscosity increase either.

45
Figure 6. HPH Particle Size Reduction of Bran and Red Dog Samples
Visual examination of the bran and red dog samples by SEM indicated very
different appearances. Figure 7 shows SEM images of unprocessed and HPH bran.
Native bran surface shown in A and B, both inside and outside, is mostly smooth,
continuous, and solid in appearance. With such a large particle size and continuous
surface it is difficult for enzymes to penetrate. Further processing to reduce particle size
and increase surface available for reaction is necessary. In unprocessed bran, WHC
averaged 1.95 ml/g. HPH bran from the 75μ 20 min sample in C and D shows torn and
broken surfaces with holes and pores. Individual fibers are seen giving the surface a

46
fuzzy or furry appearance. This is due to the extremely high shear during HPH
separating fibers and opening the bran structure. WHC doubled to 3.94 ml/g. Although
the process was successful in showing some degradation of fiber structures, the lack of
increase in viscosity compared to 10 ml/g WHC of other commercially available highly
expanded fibers processed by HPH indicates the need for additional preprocessing to
improve the effect of the final HPH treatment.
SEM of Unprocessed and High Pressure Homogenized Bran
Figure 7. SEM of Unprocessed and High Pressure Homogenized Bran
A and B show unmodified bran outer and inner surfaces (20,000X).
C and D show pre-ground, high pressure homogenized bran (20,000X).

47
Testing at multiple temperatures (25°C, 50°C, and 75°C) did not significantly
change the extent of particle size reduction or increase the sample viscosity.
Additionally, the high temperature HPH operation caused problems with o-ring failure in
the pump. Continued testing at 25°C process temperature decided. Processing
continuously for 20 minutes is also impractical on a commercial basis. After consulting
with Microfluidics, maximizing processing pressure was determined to be the most
important factor to improve results in the minimum number of passes. In order to
increase the operating pressure from 13,000 psi to the recommended maximum 23,000
psi, a new air compressor capable of supplying 120 psi at 57cfm continuously was
purchased. Based on the preliminary test results of temperature, pressure, and number of
passes, the HPH conditions moving forward were set at two passes at 25°C and 23,000
psi in the 100μ chamber.
Chemical Pretreatment of Bran: Experimental Screening Design
Table 6 shows the process variable conditions for the factorial screening design.
Pretreatment of wheat bran with dilute Sodium Hydroxide (NaOH) to break ester bonds
between phenolic acids and bran polysaccharides was examined along with hydration
time and temperature conditions. Three bran particle sizes were also tested. Following
treatment, the bran solutions were neutralized with HCl and mixed 5 minutes at 24,000

48
rpm with a high shear mixer. Particle size was measured before and after HPH
processing.
Factors Levels: 1 2 3
Bran Grind Unground thru 0.5mm thru 0.2mm
Concentration of NaOH 0.0N 0.1N 0.2N
Time (hours) 6 12 24
Temperature during soaking 60C
Homogenization Conditions: 2% bran solution, 2 passes, 23,000 psi, 25°C
Table 6. Chemical Pretreatment Screening Design
Test results proved the inability to utilize the laboratory HPH on large particle
samples. None of the unground wheat bran samples treated with 0.0N NaOH were able
to pass through the interaction chamber without clogging. The high shear mixer was
operated at 24,000rpm for 5 minutes and considerably reduced the average particle size
of the samples treated with NaOH at higher levels. Particle size results are shown in
Table 7. Interestingly, the highest concentration of NaOH did not produce the lowest
particle size after HPH treatment. This may have been due to increased swelling of bran
particles due to disruption of their fiber structure.

49
Pretreatment Screening Design Ave Part Size (μ)
Bran
Grind
NaOH
Conc
Soak
Time
Soak
Temp
5 min
Mix
2 Pass
HPH
none 0.0N 6 60C 749.1 X
none 0.0N 12 60C 739.3 X
none 0.0N 24 60C 677.9 X
none 0.1N 6 60C 300.8 X
none 0.1N 12 60C 295.0 X
none 0.1N 24 60C 195.6 X
none 0.2N 6 60C 354.0 X
none 0.2N 12 60C 328.8 X
none 0.2N 24 60C 299.0 X
0.5mm 0.0N 6 60C 559.2 X
0.5mm 0.0N 12 60C 555.2 X
0.5mm 0.0N 24 60C 567.6 X
0.5mm 0.1N 6 60C 306.2 X
0.5mm 0.1N 12 60C 230.7 X
0.5mm 0.1N 24 60C 216.0 50.76
0.5mm 0.2N 6 60C 265.8 X
0.5mm 0.2N 12 60C 259.0 X
0.5mm 0.2N 24 60C 248.1 51.88
0.2mm 0.0N 6 60C 130.6 35.12
0.2mm 0.0N 12 60C 188.0 33.75
0.2mm 0.0N 24 60C 141.9 35.34
0.2mm 0.1N 6 60C 110.1 41.47
0.2mm 0.1N 12 60C 101.9 45.23
0.2mm 0.1N 24 60C 91.7 49.08
0.2mm 0.2N 6 60C 108.2 46.68
0.2mm 0.2N 12 60C 102.5 48.88
0.2mm 0.2N 24 60C 100.8 47.25
Table 7. Particle Size Results of Pretreatment Screening Design

50
Effects of Bran Grinding, Chemical Pretreatment, and HPH Processing on Bran
Particle Size and Viscosity
Figures 8 and 9 show the effects of HPH processing on particle size distribution.
Samples that received high shear mixing only (Figure 8) had differences in size
distribution when the larger coarse bran particle size was used but not the smaller fine
bran particle size. The high shear mixing had improved particle size reduction in the
coarse bran after treatment with sodium hydroxide. The sodium hydroxide is breaking
bonds within the bran structure and improving the effectiveness of the high shear mixer,
though only to some extent as indicated by the finer particle size bran showing no
difference in particle size due to sodium hydroxide treatment. This is most likely due to
the high shear mixers rotor-stator gap limiting the further reduction in particle size.
High pressure homogenization, in contrast, reduced all samples to nearly equivalent
particle size distributions regardless of pretreatment (Figure 9). This is important
because on a commercial production basis, it is possible to use HPH to vastly reduce
particle size without any chemical pretreatment. It is important to also note, however,
that HPH alone did not achieve the increased viscosity (Table 8), water hydration
capacity, or free phenolic targets compared to combined alkali + HPH treatments as
shown in the next report sections.

51
Figure 8. Particle size distribution of processed bran without HPH is dependent on
starting particle size and NaOH treatment
Figure 9. Particle size distribution of processed bran with HPH is not dependent on
starting particle size and NaOH treatment
0%
10%
20%
30%
40%
50%
60%
70%
80%
90%
100%
0.5mm,
0.0N, Mix
0.5mm,
0.05N, Mix
0.5mm,
0.1N, Mix
0.2mm,
0.0N, Mix
0.2mm,
0.05N, Mix
0.2mm,
0.1N, Mix
% Particle Size Distribution of Processed Wheat Bran:
High Shear Mixing Only
>500 µ
200-500 µ
100-200 µ
50-100 µ
20-50 µ
10-20 µ
<10 µ
0%
10%
20%
30%
40%
50%
60%
70%
80%
90%
100%
0.5mm,
0.0N,
Mix+HPH
0.5mm,
0.05N,
Mix+HPH
0.5mm,
0.1N,
Mix+HPH
0.2mm,
0.0N,
Mix+HPH
0.2mm,
0.05N,
Mix+HPH
0.2mm,
0.1N,
Mix+HPH
% Particle Size Distribution of Processed Wheat Bran:
High Shear Mixing + High Pressure Homogenization
>500 µ
200-500 µ
100-200 µ
50-100 µ
20-50 µ
10-20 µ
<10 µ

52
Viscosity increase was principally due to NaOH treatment,
but starting bran size was also significant Bran Grind (through
Retsch Mill screen) 0.5mm 0.5mm 0.5mm 0.2mm 0.2mm 0.2mm
NaOH Concentration
(24 hour shaking at
60°C) 0.0N 0.05N 0.1N 0.0N 0.05N 0.1N
High Shear Mixing (24K rpm, 5 min)
Mix Mix Mix Mix Mix Mix
% Viscosity Increase (vs. Control 2% soln.)
Control 122% 212% 27% 71% 114%
High Pressure
Homogenization (2 passes, 23K psi)
Mix+HPH Mix+HPH Mix+HPH Mix+HPH Mix+HPH Mix+HPH
% Viscosity Increase (vs. Control, 2% soln.)
75% 169% 187% -1% 59% 158%
Table 8. Effect of Wheat Bran Processing Variables of Bran Grind, NaOH
Concentration, and HPH on RVA Viscosity
Effects of Bran Grinding, Chemical Pretreatment, and HPH Processing on the Release
of Bound Phenolics
Phenolic Analysis was measured by HPLC and is represented in Figure 10 by the
measured level of ferulic acid as the primary indicator of free phenolic levels. The chart
clearly shows the dramatic increase in free ferulic acid due to the NaOH pretreatment.
Pretreatment without NaOH showed minimal free ferulic acid. All samples shown
underwent high pressure homogenization except the two unprocessed bran controls; CI
and CII. Although not shown in Figure 10, samples prior collected to high pressure
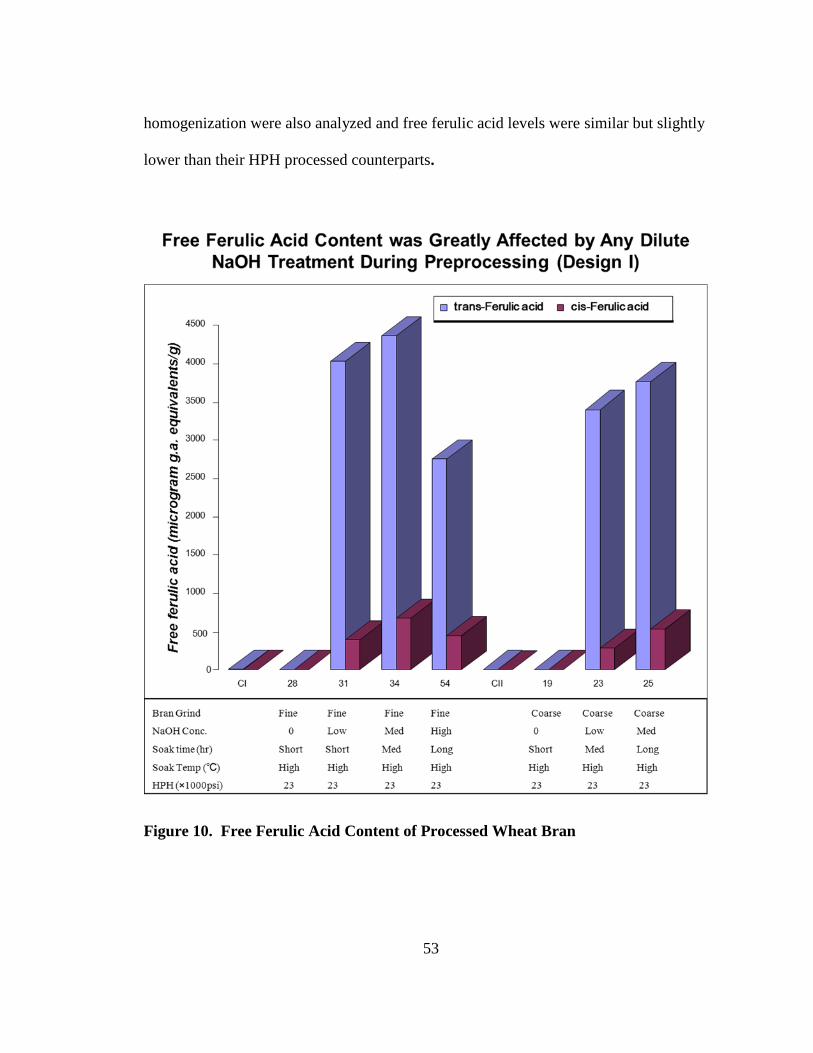
53
homogenization were also analyzed and free ferulic acid levels were similar but slightly
lower than their HPH processed counterparts.
Figure 10. Free Ferulic Acid Content of Processed Wheat Bran

54
Free ferulic acid content of the most extremely processed sample (#54) was
compared to a sample without NaOH treatment (#28) and a control intact bran sample
(C1). HPLC analysis showed little to no free ferulic acid content in the C1 or #28
samples, whereas the #54 sample contained approximately 2700μg gallic acid
equivalents/gram bran. HPH alone clearly was not releasing free phenolics whereas
dilute alkali liberated acted by breaking ester bonds between phenolic acids and
arabinose.
The untreated and HPH treated samples also did not develop high viscosity in
solution, but the alkali treated HPH samples were much more viscous (Table 8).
Preliminary WHC method development indicated a slight reduction in WHC in finely
ground bran compared to coarse bran. Lundberg et al (2003) found a strong correlation
between microsurface area and water retention capacity (WRC) of highly refined
cellulose (HRC) samples. Their HRC process incorporated a similar dilute alkali soaking
followed by HPH processing as the wheat bran samples of this research. The surface area
maximum in their experiments corresponded to the WRC maximum for the same
concentration of alkali and the curves were similar. Therefore WHC and viscosity will
be good indicators of increased surface area of processed bran.
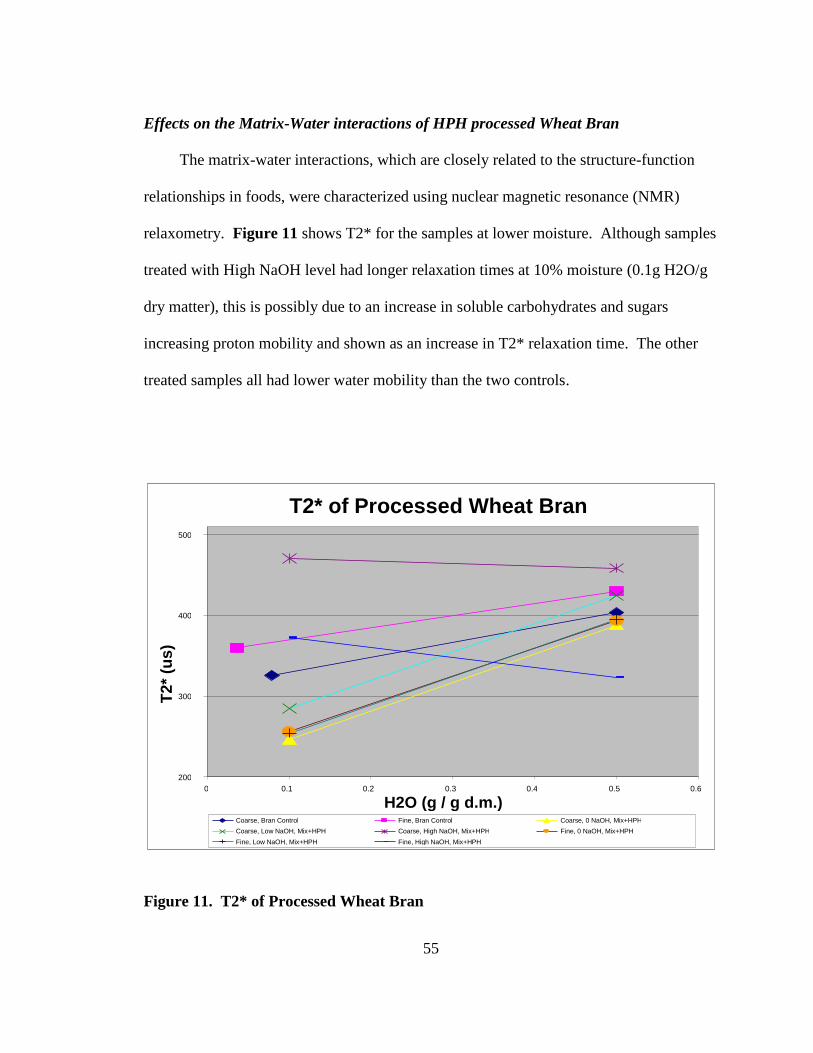
55
Effects on the Matrix-Water interactions of HPH processed Wheat Bran
The matrix-water interactions, which are closely related to the structure-function
relationships in foods, were characterized using nuclear magnetic resonance (NMR)
relaxometry. Figure 11 shows T2* for the samples at lower moisture. Although samples
treated with High NaOH level had longer relaxation times at 10% moisture (0.1g H2O/g
dry matter), this is possibly due to an increase in soluble carbohydrates and sugars
increasing proton mobility and shown as an increase in T2* relaxation time. The other
treated samples all had lower water mobility than the two controls.
Figure 11. T2* of Processed Wheat Bran
T2* of Processed Wheat Bran
200
300
400
500
0 0.1 0.2 0.3 0.4 0.5 0.6 H2O (g / g d.m.)
T2*
(us)
Coarse, Bran Control Fine, Bran Control Coarse, 0 NaOH, Mix+HPH Coarse, Low NaOH, Mix+HPH Coarse, High NaOH, Mix+HPH Fine, 0 NaOH, Mix+HPH Fine, Low NaOH, Mix+HPH Fine, High NaOH, Mix+HPH

56
The T1 relaxation (Figure 12) depends on the state of the sample. The low point in
the ―U‖ shaped curve is the transition between the glassy state (left of the low T1 point
and rubbery state (right of the low T1 point) of the sample. The shortest relaxation times
were for processed samples with no NaOH. Longest relaxation times were for the control
samples. Increased bound or reduced free water in the processed samples was also seen
physically as a harder more structured sample.
Figure 12. T1 of Processed Wheat Bran
T1 of Processed Wheat Bran
0
50
100
150
200
250
0.0 1.0 2.0 3.0 4.0 5.0 H2O (g / g d.m.)
T1
(m
s)
Coarse, Bran Control Fine, Bran Control Coarse, 0 NaOH, Mix+HPH Coarse, Low NaOH, Mix+HPH Coarse, High NaOH, Mix+HPH Fine, 0 NaOH, Mix+HPH Fine, Low NaOH, Mix+HPH Fine, High NaOH, Mix+HPH

57
T21 and T22 (Figures 13 and 14) have relevance at higher water content.
Generally, lower relaxation times indicate more tightly bound water. The controls
generally had longer relaxation times indicating more free water, but the results of
processed samples varied depending on moisture content. One explanation is that the
degree of processing affected the particle size (due primarily to HPH), soluble
polysaccharide/sugar content, ability of the sample to gel, water hydration capacity and
viscosity. Due to the complexity of the sample responses additional testing is needed to
further elucidate effects of treatments.
Figure 13. T21 of Processed Wheat Bran
T21 of Processed Wheat Bran
0
5000
10000
15000
20000
25000
30000
0.0 1.0 2.0 3.0 4.0 5.0
H2O (g / g d.m.)
T21
(us
)
Coarse, Bran Control Fine, Bran Control Coarse, 0 NaOH,
Coarse, Low NaOH, Mix+HPH Coarse, High NaOH, Mix+HPH Fine, 0 NaOH,
Fine, Low NaOH, Mix+HPH Fine, High NaOH, Mix+HPH

58
Figure 14. T22 of Processed Wheat Bran
T22 of Processed Wheat Bran
0
40000
80000
120000
160000
0.0 1.0 2.0 3.0 4.0 5.0
H2O (g / g d.m.)
T22
(u
s)
Coarse, Bran Control Fine, Bran Control Coarse, 0 NaOH, Mix+HPH Coarse, Low NaOH, Mix+HPH Coarse, High NaOH, Mix+HPH Fine, 0 NaOH, Mix+HPH Fine, Low NaOH, Mix+HPH Fine, High NaOH, Mix+HPH

59
Conclusions
Bran Fraction Material and particle size: Unground bran could not be homogenized
and pre-grinding was necessary. The large bran fraction from milling represents the most
difficult to process and will be used for optimization. Bran grinding will be from 0.5mm
to 0.2mm. Wheat bran without germ will be processed in future experiments.
High Pressure Homogenization: Higher Pressure of 23,000 psi and 2 passes will
maximize bran modification while minimizing cost. Using a 2% bran solution will
provide adequate sample size without clogging the homogenizer, but increased
concentrations should be explored once optimized procedure was determined to increase
process efficiency. Ambient temperature of 25°C will allow ease of handling and permit
consistent process control.
Pretreatment conditions must all be optimized together for best results. NaOH
concentration from 0.0N to 0.1N, reaction time from 6 to 24 hours, and reaction
temperature from 30°C to 60°C will be optimized in a factorial design. Samples will be
taken both before and after HPH processing to determine impact of pretreatment alone as
well as the combined pretreatment plus HPH effect.
Viscosity and WHC results should have good correlation to surface area changes, so
both Viscosity and WHC will be measured. Free ferulic acid will be measured as an
indicator of free phenolics. Optimized samples will undergo additional characterization
including SEM, soluble conjugate phenolics, and water extractable material (Wa-Ex).
Successful optimization will have the effects of maximizing viscosity, WHC, and
release of bound phenolics in processed wheat bran.

60
Project 2: Combined Preprocess and High Pressure Homogenization
Optimization
Hypothesis
Historical research cited and preliminary work on this program have shown the
effectiveness in releasing free phenolics with a chemical (dilute alkali) pretreatment and
the ability to increase viscosity and water hydration capacity (WHC) by combining alkali
pretreatment with high pressure homogenization (HPH). We hypothesize that it is
possible to optimize the combination of pretreatment and HPH conditions to achieve
improved functionality wheat bran with increased bioavailability of phenolic
antioxidants. Improved functionality in this case is defined as a large increase in
viscosity and WHC in solution.
Objectives
Utilizing variable ranges determined in Project 1, create statistical designs to
evaluate preprocessing conditions (bran grind, NaOH concentration, temperature, time)
combined with HPH to maximize viscosity, WHC, and free phenolics in processed bran
samples. Additionally characterize selected samples for particle size, water extractable
material, soluble bound phenolics, soluble fiber, and visual confirmation of modification
by scanning electron microscopy (SEM).
61
Materials and Methods
Raw Materials: Soft White Wheat (SWW) bran was obtained from King Milling
Company (Lowell, MI), Sustigrain Barley and Ultrafiber stabilized wheat bran were
obtained from ConAgra (Omaha, NE). All samples were stored at -20°C until use.
Dry Particle Size Reduction utilized rotor beater milling technology (Retsch
GmbH, Model SR 300, Haan, Germany). Bran was ground in a single pass through the
0.5mm screen to obtain coarse bran samples. Fine bran samples were ground through the
0.5mm screen and then the 0.2mm screen.
Alkali Pretreatment: 5% bran solutions were prepared (using 10g bran sample on
dry basis, add solution to 200g) with appropriate alkali concentration and agitated in an
Innova 4300 incubated shaker (New Brunswick Scientific, Edison, NJ) for the specified
time and temperature. Solutions were then neutralized to pH 7 with 1N HCl.
High Shear Mixing: Samples were diluted to 2% bran in solution totaling 500ml
and then mixed with high shear using a T25 Basic SI homogenizer with S25N-25F
dispersing element (IKA Works, Wilmington NC). High shear mixing was performed
prior to all high pressure homogenization (HPH) processing to reduce particle size and
prevent clogging of HPH disruption chambers. 0.5 to 1.0L samples were mixed for 5
minutes at 24,000 rpm. Viscosity and particle size distribution were typically measured
at this time and samples frozen for further analysis. Remaining samples were high
pressure homogenized.
High Pressure Homogenization: (HPH) was carried out on an M-110Y
Laboratory Microfluidizer® Processor (Newton, MA). Homogenization pressure was

62
controlled by adjusting compressed air pressure. Air pressure and flow was targeted to
achieve 23,000 psi during processing. Disruption chambers used to achieve
homogenization included a 200 micron chamber followed by a 100 micron dispersion
chamber in series. The 200 micron chamber reduced particle size enough to prevent
plugging of the 100 micron chamber. Heat was generated during processing so chilled
water cooled the processed solutions. Solution concentrations of 2% were targeted. Two
passes through the HPH were standard. Particle size and viscosity were measured
immediately and the remaining sample was frozen for later analysis. Figure 15 shows a
flow chart of the entire process.
Moisture Content of duplicate samples was measured by AACC Moisture method
44-15A. Briefly, 2g of sample was weighed into an aluminum dish with cover. Sample
was heated in a gravity oven at 130°F for 60 minutes. Dishes were removed from the
oven, covered, and placed in a desiccator to cool. Moisture was calculated as loss in
weight divided by original sample weight. Replicates must be within 0.2% moisture.
Particle Size Distribution was measured by laser diffraction particle size analyzer
(LS-13-320, Beckman Coulter Inc., Brea, CA) using the Universal Liquid Module.

63
Figure 15. Bran Processing Flowchart
Viscosity was measured on a Rapid Visco Analyzer (RVA, Newport Scientific).
As-is samples from intermediate processing steps at 2% dry matter were stirred at
160rpm at 37°C until viscosity stabilized (usually after 2-3 minutes) and a 3 minute
average viscosity was taken. Dried samples were used at 6% dry matter suspensions,
Unground
Bran
End
Grind
Freeze Dried
Samples:
WHC, Viscosity,
Free Phenolics,
SEM, Wa-Ex
Material
High Shear
Mixing
Soaking
Conditions
(Temp, Time,
Alkali)
Neutralize
pH
High Pressure
Homogenization
As Is
Samples:
Particle Size,
Viscosity
Bran Processing Flowchart:
Process Steps, Collection Points, and Analyses

64
stirred at 160 rpm 37°C, and a three minute average viscosity was taken in the stable area
from minutes 5 to 8.
Freeze Drying was performed on a Virtis Freezemobile freeze dryer. Models used
include 12EL and 25EL (SP Industries, Gardiner, NY).
Water Hydration Capacity (WHC) was difficult to perform due to the limited
sample size available and the extremely high WHC of processed samples making them
difficult to hydrate without excess water. Therefore a modified micro-version of AACC
method 56-30 was developed. Briefly, 0.1g of sample (A) of known moisture content (B)
was combined with 1.0 ml distilled water (C) in weighed 2.0 ml microfuge tubes (D).
The sample was vortexed 3 times over 30 minutes to disperse and completely wet the
sample. Tubes were centrifuged at 2000g for 10 minutes. The supernatant (E) (which
included water extractable material) was decanted to a separate tube (F). The remaining
hydrated pellet and tube was weighed (G). WHC was calculated as the water remaining
in the sample divided by the sample dry matter weight (G-A-D) / (A*(1-B%)). Duplicate
samples were run in each test and the result was the average. Less than 5% relative
standard deviation is targeted, though most samples had less than 2% relative standard
deviation among duplicate samples. Freeze dried samples were assumed to have 1%
moisture content for calculation purposes.
Water Extractable Content (Wa-Ex) and Water Unextractable Content (Wa-
Ux) of the samples were determined from the WHC test. Tubes with the hydrated
samples were freeze dried and weighed (H). The percent Wa-Ux was calculated by
subtracting the weight of the tube and dividing by the starting material weight (H-

65
D)/A*100. The percent Wa-Ex was simply 100-(Wa-Ux). While not completely
accurate because a small amount of insoluble material was decanted with the supernatant,
this quick method gave a reasonable result for comparing different samples.
Phenolic Extractions of samples were conducted as follows:
Free Phenolics were extracted from bran samples with 80% ethanol as follows:
Approximately 0.100g of freeze dried bran samples were weighed on an analytical
balance. Each sample was extracted three successive times with 1.5ml 80% ethanol
under constant agitation for 30 minutes at 40°C. Samples were centrifuged at 10,000g
for 10 minutes and supernatants of the three successive extractions were pooled.
Extraction volume of the three sample extractions was adjusted to 5.00ml using 80%
ethanol. 1.5ml of extract was centrifuged at 15,000g for 10 minutes to remove any
insoluble suspended particles and 1.00ml was filtered, transferred to an HPLC vial, and
frozen at -80°C until analysis. A further extract dilution of 2:5 achieved a concentration
of 0.0080 g bran dry matter per ml extract, similar to soluble bound sample extractions.
Soluble Bound Phenolics were extracted in a two part procedure: First, 2.00ml of
the Free Phenolic extract above was saponified with 1.00ml 6M NaOH (2M soln.) for 3
hours under constant agitation at 25°C. The solution was acidified with 1.00ml 6M HCL.
0.20ml of internal standard containing trans-2-Hydroxycinnamic acid and 3,4,5-
trimethoxycinnamic acid was added. The 0.20ml delivered approximately 100ug of each
standard in 80% ethanol. An additional 0.68ml ethanol was added to bring the volume to
4.88ml at 50% ethanol, and then adjusted to 5.00ml total volume with 50% ethanol.
1.5ml of extract was centrifuged at 15,000g for 10 minutes to remove any insoluble

66
suspended particles and 1.00ml was filtered, transferred to an HPLC vial, and frozen at -
80°C until analysis. The procedure achieved a concentration of 0.0080 g bran dry matter
per ml extract, similar to the free phenolic sample. This sample should theoretically
contain measureable ferulic acid that was derived from both free and soluble bound
sources, with the soluble bound phenolics liberated during the saponification process.
The second part of the procedure involved the re-extraction of the bran pellet with
water to extract any remaining soluble bound phenolics that were not extracted in the first
procedure with 80% ethanol. Each sample was extracted three successive times with
1.5ml HPLC grade water under constant agitation for 30 minutes at 40°C. Samples were
centrifuged at 10,000g for 10 minutes and supernatants of the three successive extractions
were pooled. Extraction volume was adjusted to 5.00ml using water. 2.00ml of the
extract above was saponified with 1.00ml 6M NaOH (2M soln.) for 3 hours under
constant agitation at 25°C. The solution was acidified with 1.00ml 6M HCL. 0.20ml of
internal standard containing trans-2-Hydroxycinnamic acid (o-coumaric acid) and 3,4,5-
trimethoxycinnamic acid (TMCA) was added. The 0.20ml delivered approximately
100ug of each standard in 80% ethanol. The total volume was then adjusted to 5.00ml
with water. 1.5ml of extract was centrifuged at 15,000g for 10 minutes to remove any
insoluble suspended particles and 1.00ml was filtered, transferred to an HPLC vial, and
frozen at -80°C until analysis. The procedure achieved a concentration of 0.0080 g bran
dry matter per ml extract, similar to the other samples.
Although bound phenolics were not tested at the time, the remaining pellet was
preserved for future analysis of insoluble bound phenolics.

67
HPLC Measurement of phenolic acids in sample extracts was performed on a
Shimadzu LC-6AD system equipped with an SIL-10AF autosampler and an SPD-M20A
photodiode array detector according to the a procedure developed by Dobberstein and
Bunzel (2010). This procedure utilized an RP-HPLC procedure employing a Luna
phenyl hexyl column (250 mm × 4.6 mm i.d., 5 μm particle size, plus 3 mm × 4.6 mm i.d.
guard column). Elution was carried out using a ternary gradient system made up of 1
mM aqueous TFA, ACN, and MeOH at a flow rate of 1.0 mL/min. The injection volume
was 20 μL, and the separation was performed at 45 °C. Chromatograms were monitored
at 280 nm. The following gradients were used eluent A, 1 mM aqueous TFA; eluent B,
ACN/1 mM aqueous TFA [90/10 (v/v)]; and eluent C, MeOH/1 mM aqueous TFA [90/10
(v/v)]. Separation of phenolic monomers: initially 87% A, 13% B, and 0% C held for 10
min, linear over 10 min to 77% A, 20% B, and 3% C, linear over 5 min to 70% A, 25%
B, and 5% C, linear over 5 min to 25% A, 50% B, and 25% C, following a 10 min
equilibration step.
Scanning Electron Microscopy (SEM) was utilized to provide a visual
confirmation of bran modification. A Hitachi S3500N variable pressure scanning
electron microscope (SEM) was utilized for selected process samples. Freeze dried
samples were used for analysis. Samples were placed on stubs and coated with gold in a
Fullam Sputter-coater.
The Hitachi S3500N Variable Pressure Scanning Electron Microscope (SEM) had
Quartz PCI digital imaging, photo CRT recording camera, stage with motor driven X &

68
Y axes, standard Secondary Electron Detector (SED), Emitech K-1150 Cryogenic System
with cryo-prep unit, and airlock interface to SEM. The electron beam was set at 5KV.
Factorial Experimental Designs were generated with variable settings determined
by screening during Project 1. The variables and settings for the first design are listed in
Table 9. This design required 36 runs blocking by Soaking Temperature.
Factors Levels: Low Med High
Bran Grind thru 0.5mm thru 0.2mm
Concentration of NaOH 0.0N 0.05N 0.1N
Soaking Time (hours) 6 15 24
Soaking Temperature 30°C 60°C
Wet Particle Size Reduction Mix Only Mix + HPH
Table 9. Factorial Experimental Design to Optimize HPH Preprocess Conditions
A second Augmentation Factorial Design was conducted to augment the first
factorial design, add replication, and better optimize the results. In this design, bran grind
was fixed at 0.5mm and the NaOH concentration range was tightened (0.05N, 0.075N,
0.1N). Soaking time was also fixed at 24 hours, but Soaking temperature was increased
to three levels (30°C, 45°C, 60°C) Although this design had only 9 bran cells plus a
control, Sustigrain barley flour and Ultrafiber stabilized wheat bran and germ products
(ConAgra Mills) were also tested for a total of 30 cells.

69
Experimental Design and Analysis utilized Minitab statistical software version 16
(Minitab Inc., State College, PA). Factorial designs were analyzed by General Linear
Model to determine main effects and interactions, or by Response Surface Regression to
optimize factors for maximizing viscosity or WHC.

70
Results and Discussion
Maximizing Viscosity of HPH Processed Wheat Bran through Experimental Design
Testing
Maximizing processed bran viscosity to achieve similar cholesterol lowering
characteristics of oat and barley cereals is a goal of the project. Following the
experimental design outlined in the Materials and Methods section, viscosity was
measured immediately following processing, while WHC was measured on freeze dried
samples. Viscosity and WHC results for the 36 samples are shown in Table 10.
Processed samples generated a wide range for both viscosity and WHC. At first
look, increases in viscosity seemed correlated with increases in WHC. Main effects and
interactions in the experimental design were analyzed to accurately define the
relationships between the design variables and responses
Table 11 shows the analysis of variance (ANOVA) of the factorial design
indicating significant main effects of NaOH concentration (p<.001) and Soak Time
(p<.001) on bran viscosity. Main effects are also illustrated in Figure 16. Soak
temperature did not show up as significant probably due to the fact that the NaOH was
effective at the lower temperature. The 60C did have a darker color and require less HCl
to neutralize, indicating an increased level of reaction, but while viscosity will increase as
more fiber becomes partially degraded, continued breakdown will eventually reduce
viscosity. Additional testing at the midpoint of 45C was later added in the augmentation
design to test this hypothesis. Bran grind was also not shown to be significant, but it is

71
preferable to begin with a larger particle size due to the increased cost of fine grinding
bran.
StdOrder Soak
Temp (C)
Grind (mm)
NaOH Conc (N)
Soak Time (hrs)
Sample No.
Visc HPH (mPa*s)
WHC (g/g dm)
1 30 0.5 0 6 1 14.34 3.781
2 30 0.5 0 15 2 17.59 3.659
3 30 0.5 0 24 3 14.39 3.880
4 30 0.5 0.05 6 4 24.58 4.268
5 30 0.5 0.05 15 5 27.46 4.818
6 30 0.5 0.05 24 6 37.37 4.846
7 30 0.5 0.1 6 7 25.51 4.581
8 30 0.5 0.1 15 8 32.00 4.898
9 30 0.5 0.1 24 9 92.17 4.964
10 30 0.2 0 6 10 14.39 3.529
11 30 0.2 0 15 11 23.67 3.669
12 30 0.2 0 24 12 16.28 3.608
13 30 0.2 0.05 6 13 17.32 4.275
14 30 0.2 0.05 15 14 29.03 5.102
15 30 0.2 0.05 24 15 27.50 5.007
16 30 0.2 0.1 6 16 24.31 4.637
17 30 0.2 0.1 15 17 30.37 5.011
18 30 0.2 0.1 24 18 83.00 5.104
19 60 0.5 0 6 19 15.74 4.016
20 60 0.5 0 15 20 19.53 4.074
21 60 0.5 0 24 21 15.33 4.032
22 60 0.5 0.05 6 22 30.37 5.032
23 60 0.5 0.05 15 23 34.96 5.511
24 60 0.5 0.05 24 24 35.73 5.409
25 60 0.5 0.1 6 25 41.28 5.107
26 60 0.5 0.1 15 26 41.21 4.700
27 60 0.5 0.1 24 27 74.01 4.719
28 60 0.2 0 6 28 14.41 3.909
29 60 0.2 0 15 29 17.74 3.711
30 60 0.2 0 24 30 14.27 3.702
31 60 0.2 0.05 6 31 30.04 5.162
32 60 0.2 0.05 15 32 47.38 4.926
33 60 0.2 0.05 24 33 36.39 5.431
34 60 0.2 0.1 6 34 41.68 4.951
35 60 0.2 0.1 15 35 37.44 5.296
36 60 0.2 0.1 24 36 44.66 4.992
Table 10. Experimental Design Results for Viscosity and WHC
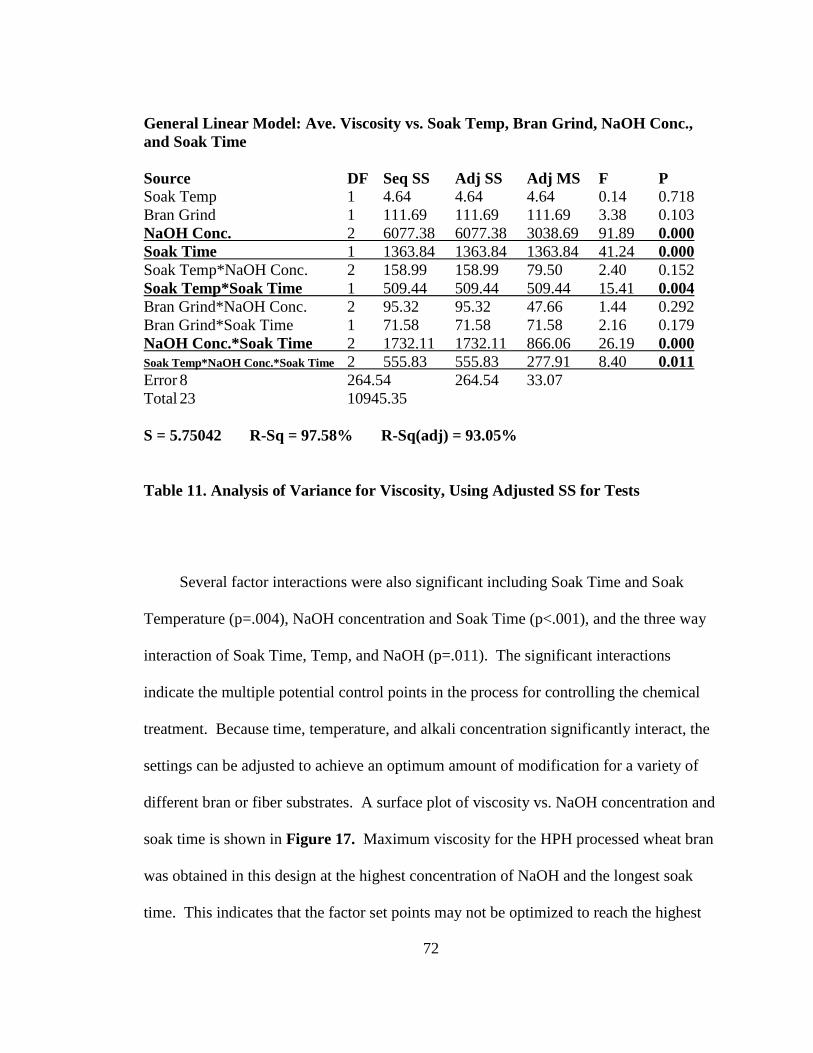
72
General Linear Model: Ave. Viscosity vs. Soak Temp, Bran Grind, NaOH Conc.,
and Soak Time
Source DF Seq SS Adj SS Adj MS F P
Soak Temp 1 4.64 4.64 4.64 0.14 0.718
Bran Grind 1 111.69 111.69 111.69 3.38 0.103
NaOH Conc. 2 6077.38 6077.38 3038.69 91.89 0.000
Soak Time 1 1363.84 1363.84 1363.84 41.24 0.000
Soak Temp*NaOH Conc. 2 158.99 158.99 79.50 2.40 0.152
Soak Temp*Soak Time 1 509.44 509.44 509.44 15.41 0.004
Bran Grind*NaOH Conc. 2 95.32 95.32 47.66 1.44 0.292
Bran Grind*Soak Time 1 71.58 71.58 71.58 2.16 0.179
NaOH Conc.*Soak Time 2 1732.11 1732.11 866.06 26.19 0.000
Soak Temp*NaOH Conc.*Soak Time 2 555.83 555.83 277.91 8.40 0.011
Error 8 264.54 264.54 33.07
Total 23 10945.35
S = 5.75042 R-Sq = 97.58% R-Sq(adj) = 93.05%
Table 11. Analysis of Variance for Viscosity, Using Adjusted SS for Tests
Several factor interactions were also significant including Soak Time and Soak
Temperature (p=.004), NaOH concentration and Soak Time (p<.001), and the three way
interaction of Soak Time, Temp, and NaOH (p=.011). The significant interactions
indicate the multiple potential control points in the process for controlling the chemical
treatment. Because time, temperature, and alkali concentration significantly interact, the
settings can be adjusted to achieve an optimum amount of modification for a variety of
different bran or fiber substrates. A surface plot of viscosity vs. NaOH concentration and
soak time is shown in Figure 17. Maximum viscosity for the HPH processed wheat bran
was obtained in this design at the highest concentration of NaOH and the longest soak
time. This indicates that the factor set points may not be optimized to reach the highest

73
viscosity and increasing the NaOH concentration or soak time could result in an
increased processed bran viscosity. Additional testing of NaOH concentration and
temperature at the 24 hour soak time was done to augment the design. Results are
presented in a later section.
Figure 16. Main Effects Plots for Average Viscosity in the Experimental Design
6030
60
50
40
30
20
0.50.2
0.100.050.00
60
50
40
30
20
246
Soak Temp
Me
an
Bran Grind
NaOH Conc. Soak Time
Main Effects Plot for RVA Ave. Visc.Data Means

74
Figure 17. Experimental Design Results Showing a Surface Plot of Viscosity vs.
NaOH Concentration and Soak Time
Maximizing WHC of HPH Processed Wheat Bran through Experimental Design
Testing
Maximizing processed bran water hydration capacity may have similar function to
viscosity for cholesterol lowering characteristics in that increased water hydration
capacity (WHC) should contribute to increased viscosity. In addition, increased WHC is
an important indication of structural modification during HPH treatment as well.
0.05
0.1030
60
6
90
12 0.001824
Ave. Visc. (mP*s)
NaOH Conc. (N)
Soak Time (hrs)
Surface Plot of Visc. vs NaOH Conc., Soak Time

75
General Linear Model: WHC vs. Soak Temp, Bran Grind, NaOH Conc., and Soak
Time
Source DF Seq SS Adj SS Adj MS F P
Soak Temp 1 0.66050 0.66050 0.66050 79.21 0.000
Bran Grind 1 0.00449 0.00449 0.00449 0.54 0.484
NaOH Conc. 2 6.44075 6.44075 3.22037 386.23 0.000
Soak Time 1 0.24945 0.24945 0.24945 29.92 0.001
Soak Temp*NaOH Conc. 2 0.33131 0.33131 0.16565 19.87 0.001
Soak Temp*Soak Time 1 0.20673 0.20673 0.20673 24.79 0.001
Bran Grind*NaOH Conc. 2 0.13593 0.13593 0.06796 8.15 0.012
Bran Grind*Soak Time 1 0.00415 0.00415 0.00415 0.50 0.501
NaOH Conc.*Soak Time 2 0.26023 0.26023 0.13011 15.60 0.002
Soak Temp*NaOH Conc.*Soak Time 2 0.04407 0.04407 0.02203 2.64 0.132
Error 8 0.06670 0.06670 0.00834
Total 23 8.40429
S = 0.0913129 R-Sq = 99.21% R-Sq(adj) = 97.72%
Table 12. Analysis of Variance for WHC, Using Adjusted SS for Tests
Table 12 shows the analysis of variance (ANOVA) of the factorial design
(previously displayed in Table 10) indicating significant main effects of Soak
Temperature (p<.001), NaOH Concentration (p<.001) and Soak Time (p=.001) on WHC.
Main effects are also illustrated in Figure 18. Unlike viscosity, Soak Temperature was
significant and increasing Soak Temperature increased WHC. Viscosity may be affected
more by soluble bran material whereas larger insoluble bran fragments that don’t
contribute as much to viscosity may still have a large impact on WHC. Additional testing
at the midpoint of 45C was later added in the augmentation design to expand
understanding of the effect of Soak Temperature. Bran grind was again not shown to be
significant and will be fixed at the larger size moving forward.

76
Figure 18. Main Effects Plots for WHC in the Experimental Design
Increasing alkali concentration and Soak Time also increased WHC, but the effect
does not appear to be linear. This may be due to the fact that some soluble material is
lost during supernatant removal after centrifugation and this material is more
predominant when the chemical treatment is more severe, either through longer soak time
or more concentrated alkali. This effect may be seen more easily by viewing the surface
plot of WHC vs. NaOH concentration and Soak Time shown in Figure 19. As the NaOH
concentration was increased, more bran material became solubilized and was seen in the
supernatant during the WHC procedure. This removal contributed to the plateauing of
the curve at high NaOH concentration.
6030
5.0
4.5
4.0
0.50.2
0.100.050.00
5.0
4.5
4.0
24156
Soak Temp
Me
an
Bran Grind
NaOH Conc. Soak Time
Main Effects Plot for WHCData Means

77
Figure 19. Experimental Design Results Showing a Surface Plot of WHC vs. NaOH
Concentration and Soak Time
Several factor interactions were also significant including Soak Time and NaOH
Concentration (p=.001), Soak Temperature and Soak time (p=.001), Bran Grind and
NaOH concentration (p=.012), and NaOH Concentration and Soak Time (p=.002). As
with viscosity, the significant interactions indicate the multiple potential control points in
the process for controlling the extent of the pretreatment for optimizing WHC with the
chosen bran material. A Maximum WHC for the HPH processed wheat bran appeared to
be found within the factor ranges tested. Additional tests to augment the results and
optimize process conditions were scheduled. Results are presented in the next section.
0.10
0.05
4.0
4.8
6
5.6
12 0.001824
WHC (g H2O/g dm)
NaOH Conc. (N)
Soak Time (hrs)
Surface Plot of WHC vs NaOH Conc., Soak Time

78
It is expected that a single optimized setting will not be able to maximize viscosity
and WHC simultaneously. Therefore, viscosity and WHC will be analyzed separately to
determine optimized processing parameters for each individually and, if reasonably
similar, a single set of conditions will be chosen for further large sample production for
additional physical, chemical, biological, and functional testing.
Maximizing Viscosity and WHC of HPH processed Wheat Bran with an Additional
Augmentation Design
A second experimental design was created to augment the first and further optimize
the variable settings for maximizing viscosity and water hydration capacity of processed
wheat bran. Experimental design conditions are shown in Table 13. For these
experiments, bran size was ground through only the 0.5mm screen size based on the
insignificance of bran size in the previous experimental design. Soak Time was also
fixed at 24 hours to allow other variables to be screened. Soak Temperatures were
expanded to three levels by adding a 45C midpoint. NaOH concentration was also tested
at three levels, but only between the range of 0.05N and 0.1N. 0.0N controls were also
tested. The other difference with this augmentation design is that two additional
materials were tested including Barley Sustigrain; a whole grain barley variety with low
endosperm content and high beta glucan level, and Ultrafiber; a heat treated stabilized
wheat bran and germ. Barley Sustigrain and Ultrafiber results are presented separately
from the wheat bran results.

79
Augmentation Factorial Design to Optimize Pre-Processing Conditions (prior to HPH)
Factors Levels: 1 2 3
Ingredient Type (S,U,B) 3 Wheat Bran,
.5mm (fixed)
Barley
Sustigrain Ultrafiber
Concentration of NaOH 3 0.05N 0.075N 0.1N
Time (hours) 1 24 (fixed)
Soaking Temperature 3 30C 45C 60C
Homogenization variables:
Number of Passes 1 Maintained at 2 Minimized to reduce cost
Concentration of bran 1 Held at 2% To minimize plugging
Pressure 1 Max 22,000 psi Maximum effectiveness
Table 13. Augmentation Factorial Design to Complete Optimization of Wheat Bran
HPH Processing and Also Test Other Grain Materials
Table 14 shows particle size, viscosity, WHC, WaUx, and WaEx results from the
Augmentation Factorial Design for wheat bran. Tables 15 and 16 show particle size,
viscosity, and WHC results for Barley Sustigrain and Ultrafiber respectively.

80
Std Order
Run Order
Soak Temp (C)
NaOH Conc (N)
Part Size (Mix)
Part Size (HPH)
Visc Mix (mPa*s)
Visc HPH (mPa*s)
WHC (g/g dm)
%Un-Ex
%Ex
7 1 60 0.05 248.70 48.09 19.57 44.84 4.462 75.32 24.68
8 2 60 0.075 228.80 50.97 22.33 59.91 4.435 72.73 27.27
9 3 60 0.1 208.50 55.98 23.90 61.03 5.130 73.76 26.24
1 4 30 0.05 378.40 51.04 22.73 26.72 4.578 81.15 18.85
2 5 30 0.075 349.90 51.25 19.20 30.81 4.569 78.67 21.33
3 6 30 0.1 326.70 50.76 22.41 38.00 4.458 76.99 23.01
4 7 45 0.05 330.20 50.54 17.22 37.84 5.125 80.70 19.30
5 8 45 0.075 279.00 51.28 26.82 45.82 4.686 76.73 23.27
6 9 45 0.1 260.30 52.18 25.22 51.33 4.673 75.42 24.58
Table 14. Factorial Augmentation Design for Wheat Bran.
Std Order
Run Order
Soak Temp (C)
NaOH Conc (N)
Part Size (Mix)
Part Size (HPH)
Visc Mix (mPa*s)
Visc HPH (mP*s)
7 1 60 0.05 99.37 12.08 21.04 34.42
8 2 60 0.075 61.66 10.64 25.00 34.03
9 3 60 0.1 55.91 20.64 29.54 33.53
1 4 30 0.05 378.40 51.04 22.73 26.72
2 5 30 0.075 349.90 51.25 19.20 30.81
3 6 30 0.1 326.70 50.76 22.41 38.00
4 7 45 0.05 152.40 39.85 20.61 25.13
5 8 45 0.075 141.40 40.28 25.43 25.43
6 9 45 0.1 132.90 39.98 25.94 27.44
Table 15. Factorial Augmentation Design for Barley Sustigrain.
Std Order
Run Order
Soak Temp (C)
NaOH Conc (N)
Part Size (Mix)
Part Size (HPH)
Visc Mix (mPa*s)
Visc HPH (mP*s)
7 1 60 0.05 178.70 38.44 24.42 30.72
8 2 60 0.075 123.50 38.63 24.68 40.70
9 3 60 0.1 113.90 45.51 24.67 44.56
1 4 30 0.05 152.40 39.85 20.61 25.13
2 5 30 0.075 141.40 40.28 25.43 25.43
3 6 30 0.1 132.90 39.98 25.94 27.44
4 7 45 0.05 141.40 43.32 20.09 24.22
5 8 45 0.075 131.80 40.71 21.76 29.48
6 9 45 0.1 112.60 51.71 26.86 25.16
Table 16. Factorial Augmentation Design for Ultrafiber.

81
Figures 20-25 depict the trends from the wheat bran processing in the
Augmentation Design. Figure 20 shows the effect of soaking temperature and alkali
concentration vs. particle size. As seen in previous experiments, increasing either
variable separately or both variables together resulted in a decrease in high shear mixed
wheat bran particle size, but HPH treatment has a much larger particle size reduction
effect as shown in Figure 21. The effects of soaking temperature and alkali
concentration on solution viscosity prior to HPH treatment were somewhat inconsistent,
but all viscosities were higher than the control that was soaked in water only (Figure 22).
Once treated with HPH (Figure 23) the viscosities of all the samples increased and both
soaking temperature and alkali concentration were effective singly and in combination at
increasing viscosity of HPH processed wheat bran.
WHC results (Figure 24) may have been affected by error associated with
transferring viscous supernatant from microfuge tubes that still contained suspended
material. Compared to the Control, all alkali treated samples showed an increase in
WHC. Figure 25 shows the amount of Wa-Ex material that was removed in the
supernatant, calculated from the amount of dried starting bran minus the dried pellet
remaining after the WHC test. The optimized process sample contained approximately
twice the water extractable material at 26% compared to the control processed sample
with no alkali treatment at 13%. The Wa-Ex bran was composed of both soluble and
insoluble suspended material in the supernatant. Increased supernatant viscosity
suspended more insoluble bran particles and increased the Wa-Ex result slightly. In this
way, both Wa-Ex and WHC results were both influenced by supernatant viscosity.

82
Figure 20. Effect of Temperature and Alkali on Particle Size of High Shear Mixed
Wheat Bran Prior to HPH Processing.
Figure 21. Effect of Temperature and Alkali on Particle Size of HPH Wheat Bran.
30C45C
60C0
100
200
300
400
0N .05N .075N .1N
Tem
p. B
ran
Par
ticl
e S
ize
(µ
)
NaOH Concentration
Effect of Temp. and Alkali on Particle Size of High Shear Mixed Wheat Bran
30C45C
60C0
100
200
300
400
0N .05N .075N .1N
Tem
p. B
ran
Par
ticl
e S
ize
(µ
)
NaOH Concentration
Effect of Temp. and Alkali on Particle Size of HPH Wheat Bran

83
Figure 22. Effect of Temperature and Alkali on Viscosity of High Shear Mixed
Wheat Bran Prior to HPH Processing.
Figure 23. Effect of Temperature and Alkali on Viscosity of HPH Wheat Bran.
30C45C
60C10
20
30
40
50
60
0N .05N .075N .1N
Tem
p.
RV
A V
isco
sity
(m
Pa.
s)
NaOH Concentration
Effect of Temp. and Alkali on Viscosity of High Shear Mixed Wheat Bran
30C45C
60C10
20
30
40
50
60
0N .05N .075N .1N
Tem
p.
RV
A V
isco
sity
(m
Pa.
s)
NaOH Concentration
Effect of Temp. and Alkali on Viscosity of High Pressure Homogenized Wheat Bran

84
Figure 24. Effect of Temperature and Alkali on WHC of HPH Wheat Bran.
Figure 25. Effect of Temperature and Alkali on Wa-Ex Material of HPH Wheat
Bran.
30C45C
60C3.0
3.5
4.0
4.5
5.0
5.5
0N .05N .075N .1N
Tem
p.
WH
C (
g H
2O
/g b
ran
dm
)
NaOH Concentration
Effect of Temp. and Alkali on WHC of HPH Wheat Bran
30C45C
60C10
15
20
25
30
0N .05N .075N .1N
Tem
p.
% E
xtra
ctab
le M
ate
rial
NaOH Concentration
Effect of Temp. and Alkali on Extractable Material of HPH Wheat Bran

85
Predicting Maximum Viscosity and WHC of HPH processed Wheat Bran through
combined analysis of both Factorial and Augmentation Designs
Combining the data from the first and second designs gave a more complete picture
of the viscosity and WHC response to the processing conditions. Different optimum
processing variable conditions exist to maximize viscosity or WHC. Table 17 shows the
process conditions, viscosity, and WHC results for wheat bran in combined Factorial
experimental design and Augmentation design.
Table 18 shows estimated regression coefficients for average viscosity in the
combined optimization design. Soak temperature, NaOH concentration, and soak time
were all significant main effects. Bran grind was not significant. Main effect plots for
these variables are shown in Figure 26. Significant interactions of soak temperature vs.
soak time and NaOH concentration vs. soak time were also seen. Analysis of variance
for viscosity shown in Table 19 shows the p values of the significant linear and
interaction effects.

86
Std Order
Blocks Soak Temp (C)
Grind (mm)
NaOH Conc (N)
Soak Time (hrs)
Sample No.
Visc HPH (mPa*s)
WHC (g/g dm)
1 1 30 0.5 0 6 1 14.34 3.781
2 1 30 0.5 0 15 2 17.59 3.659
3 1 30 0.5 0 24 3 14.39 3.880
4 1 30 0.5 0.05 6 4 24.58 4.268
5 1 30 0.5 0.05 15 5 27.46 4.818
6 1 30 0.5 0.05 24 6 37.37 4.846
7 1 30 0.5 0.1 6 7 25.51 4.581
8 1 30 0.5 0.1 15 8 32.00 4.898
9 1 30 0.5 0.1 24 9 92.17 4.964
10 1 30 0.2 0 6 10 14.39 3.529
11 1 30 0.2 0 15 11 23.67 3.669
12 1 30 0.2 0 24 12 16.28 3.608
13 1 30 0.2 0.05 6 13 17.32 4.275
14 1 30 0.2 0.05 15 14 29.03 5.102
15 1 30 0.2 0.05 24 15 27.50 5.007
16 1 30 0.2 0.1 6 16 24.31 4.637
17 1 30 0.2 0.1 15 17 30.37 5.011
18 1 30 0.2 0.1 24 18 83.00 5.104
19 1 60 0.5 0 6 19 15.74 4.016
20 1 60 0.5 0 15 20 19.53 4.074
21 1 60 0.5 0 24 21 15.33 4.032
22 1 60 0.5 0.05 6 22 30.37 5.032
23 1 60 0.5 0.05 15 23 34.96 5.511
24 1 60 0.5 0.05 24 24 35.73 5.409
25 1 60 0.5 0.1 6 25 41.28 5.107
26 1 60 0.5 0.1 15 26 41.21 4.700
27 1 60 0.5 0.1 24 27 74.01 4.719
28 1 60 0.2 0 6 28 14.41 3.909
29 1 60 0.2 0 15 29 17.74 3.711
30 1 60 0.2 0 24 30 14.27 3.702
31 1 60 0.2 0.05 6 31 30.04 5.162
32 1 60 0.2 0.05 15 32 47.38 4.926
33 1 60 0.2 0.05 24 33 36.39 5.431
34 1 60 0.2 0.1 6 34 41.68 4.951
35 1 60 0.2 0.1 15 35 37.44 5.296
36 1 60 0.2 0.1 24 36 44.66 4.992
37 2 60 0.5 0.05 24 37 44.84 4.462
38 2 60 0.5 0.075 24 38 59.91 4.435
39 2 60 0.5 0.1 24 39 61.03 5.130
40 2 30 0.5 0.05 24 40 26.72 4.578
41 2 30 0.5 0.075 24 41 30.81 4.569
42 2 30 0.5 0.1 24 42 38.00 4.458
43 2 45 0.5 0.05 24 43 37.84 5.125
44 2 45 0.5 0.075 24 44 45.82 4.686
45 2 45 0.5 0.1 24 45 51.33 4.673
46 2 30 0.5 0 24 46 17.59 3.841
Table 17. Combined Factorial Design and Augmentation Design for Wheat Bran.
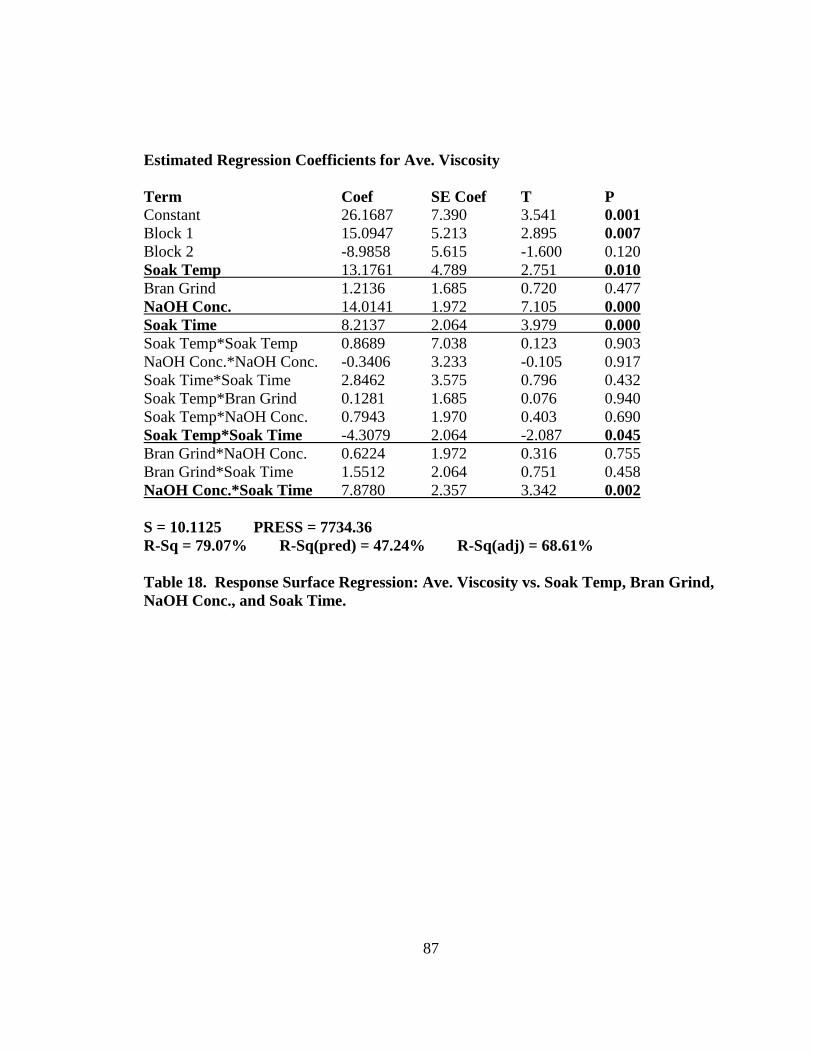
87
Estimated Regression Coefficients for Ave. Viscosity
Term Coef SE Coef T P
Constant 26.1687 7.390 3.541 0.001
Block 1 15.0947 5.213 2.895 0.007
Block 2 -8.9858 5.615 -1.600 0.120
Soak Temp 13.1761 4.789 2.751 0.010
Bran Grind 1.2136 1.685 0.720 0.477
NaOH Conc. 14.0141 1.972 7.105 0.000
Soak Time 8.2137 2.064 3.979 0.000
Soak Temp*Soak Temp 0.8689 7.038 0.123 0.903
NaOH Conc.*NaOH Conc. -0.3406 3.233 -0.105 0.917
Soak Time*Soak Time 2.8462 3.575 0.796 0.432
Soak Temp*Bran Grind 0.1281 1.685 0.076 0.940
Soak Temp*NaOH Conc. 0.7943 1.970 0.403 0.690
Soak Temp*Soak Time -4.3079 2.064 -2.087 0.045
Bran Grind*NaOH Conc. 0.6224 1.972 0.316 0.755
Bran Grind*Soak Time 1.5512 2.064 0.751 0.458
NaOH Conc.*Soak Time 7.8780 2.357 3.342 0.002
S = 10.1125 PRESS = 7734.36
R-Sq = 79.07% R-Sq(pred) = 47.24% R-Sq(adj) = 68.61%
Table 18. Response Surface Regression: Ave. Viscosity vs. Soak Temp, Bran Grind,
NaOH Conc., and Soak Time.

88
Figure 26. Main Effects Plots of Average Viscosity in the Combined Design.
Analysis of Variance for Ave. Viscosity
Source DF Seq SS Adj SS Adj MS F P
Blocks 2 772.0 942.51 471.26 4.61 0.018
Regression 13 10820.4 10820.39 832.34 8.14 0.000
Linear 4 9052.8 7906.16 1976.54 19.33 0.000
Square 3 66.5 67.40 22.47 0.22 0.882
Interaction 6 1701.2 1701.18 283.53 2.77 0.029
Residual Error 30 3067.9 3067.90 102.26
Total 45 14660.3
Table 19. Analysis of Variance for Ave. Viscosity
604530
50
40
30
20
0.50.2
0.1000.0750.0500.000
50
40
30
20
24156
Soak Temp
Mea
n
Bran Grind
NaOH Conc. Soak Time
Main Effects Plot for Ave. Visc.Data Means

89
Figure 27 depicts viscosity contour plots for all two way variable interactions from
the experimental design. Relationships are fairly linear such that increasing the variable
levels of sodium hydroxide concentration or soak time, would continue to increase
viscosity. In order optimize process settings to maximize viscosity and water holding
capacity, optimization plots were also created.
Figure 27. Contour Plots of Two Way Interactions for Average Viscosity in the
Combined Design.
Figure 28 shows an optimization plot of the experimental design response surface
regression results. The red vertical lines correspond with the bracketed red numbers for
each variable setting and can be moved left or right to determine the results for different
Bran Grind*Soak Temp
604530
0.5
0.4
0.3
0.2
NaOH Conc.*Soak Temp
604530
0.100
0.075
0.050
0.025
0.000
Soak Time*Soak Temp
604530
24
20
16
12
8
NaOH Conc.*Bran Grind
0.480.360.24
0.100
0.075
0.050
0.025
0.000
Soak Time*Bran Grind
0.480.360.24
24
20
16
12
8
Soak Time*NaOH Conc.
0.100.050.00
24
20
16
12
8
Soak Temp 60
Bran Grind 0.5
NaO H C onc. 0.1
Soak Time 24
Hold V alues
>
–
–
–
–
–
–
< 10
10 20
20 30
30 40
40 50
50 60
60 70
70
V isc.
RV A A v e.
Contour Plots of Average Viscosity

90
variable scenarios within the design. For maximizing viscosity, it is clear from the figure
the maximum viscosity was achieved at the highest level setting of each variable within
the design. By increasing the NaOH concentration and Soak Time, it is expected that
viscosity would continue to increase. As insoluble fiber structures are broken down by
the chemical treatment, the physical homogenization treatment will be more effective at
converting insoluble fiber to soluble and further increasing solution viscosity. Table 20
lists the specific variable set points for maximizing viscosity within the design.
Figure 28. Optimum Settings for Maximizing Viscosity within the Combined
Factorial and Augmentation Designs. Red bracketed numbers indicate current settings
for each variable shown by the red vertical line. The blue dashed line is the viscosity
resulting from the combination of variable settings.
CurHigh
Low0.38190D
Optimal
d = 0.38190
Maximum
RVA Ave.
y = 72.8268
0.38190
Desirability
Composite
6.0
24.0
0.0
0.10
0.20
0.50
30.0
60.0Bran Gri NaOH Con Soak TimSoak Tem
[60.0] [0.50] [0.10] [24.0]

91
Soak Temperature Bran Grind NaOH Concentration Soak Time
60.0°C 0.50 mm 0.10 N 24.0 hours
Table 20. Optimum Settings for Maximizing Viscosity within the Combined
Factorial and Augmentation Designs.
Estimated Regression Coefficients for WHC
Term Coef SE Coef T P
Constant 5.05087 0.18381 27.478 0.000
Block 1 0.08049 0.12967 0.621 0.539
Block 2 0.16150 0.13967 1.156 0.257
Soak Temp 0.09962 0.11912 0.836 0.410
Bran Grind 0.00758 0.04192 0.181 0.858
NaOH Conc. 0.55039 0.04906 11.218 0.000
Soak Time 0.10195 0.05135 1.986 0.056
Soak Temp*Soak Temp -0.18082 0.17505 -1.033 0.310
NaOH Conc.*NaOH Conc. -0.56450 0.08041 -7.020 0.000
Soak Time*Soak Time -0.07544 0.08893 -0.848 0.403
Soak Temp*Bran Grind 0.02124 0.04192 0.507 0.616
Soak Temp*NaOH Conc. 0.00093 0.04901 0.019 0.985
Soak Temp*Soak Time -0.09281 0.05135 -1.808 0.081
Bran Grind*NaOH Conc. -0.10484 0.04906 -2.137 0.041
Bran Grind*Soak Time -0.01314 0.05135 -0.256 0.800
NaOH Conc.*Soak Time 0.02107 0.05864 0.359 0.722
S = 0.251541 PRESS = 4.44230
R-Sq = 86.89% R-Sq(pred) = 69.31% R-Sq(adj) = 80.33%
Table 21. Response Surface Regression: WHC vs. Soak Temp, Bran Grind, NaOH
Conc., and Soak Time.

92
In determining the optimum settings to maximize WHC, the data was analyzed in a
similar manner as the Viscosity results. Table 21 shows the response surface regression
results for WHC from the combined Factorial and Augmentation designs. NaOH
concentration was a significant main effect and interaction effect. Analysis of variance
for WHC in Table 22 shows the p values of the significant linear and interaction effects.
Main effect plots for these variables are shown in Figure 29.
Analysis of Variance for WHC
Source DF Seq SS Adj SS Adj MS F P
Blocks 2 0.7145 0.41827 0.20913 3.31 0.050
Regression 13 11.8612 11.86122 0.91240 14.42 0.000
Linear 4 7.9950 8.37532 2.09383 33.09 0.000
Square 3 3.3486 3.27145 1.09048 17.23 0.000
Interaction 6 0.5176 0.51760 0.08627 1.36 0.261
Residual Error 30 1.8982 1.89819 0.06327
Total 45 14.4739
Table 22. Analysis of Variance for WHC.
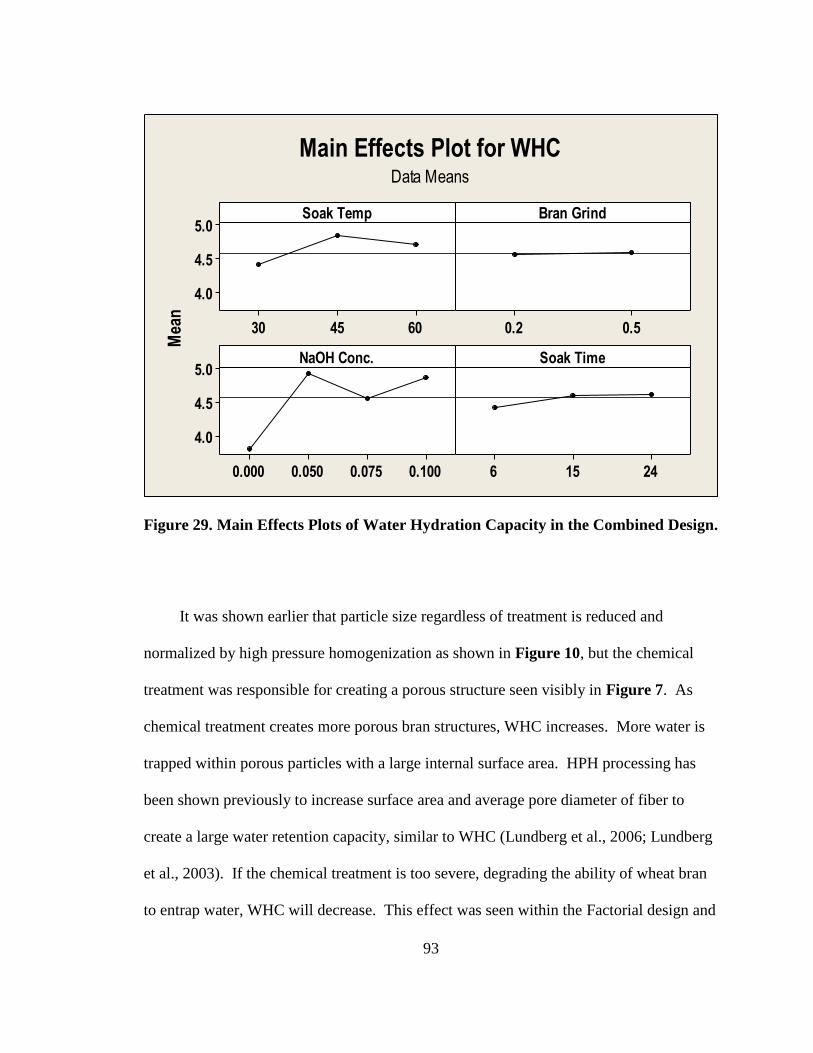
93
Figure 29. Main Effects Plots of Water Hydration Capacity in the Combined Design.
It was shown earlier that particle size regardless of treatment is reduced and
normalized by high pressure homogenization as shown in Figure 10, but the chemical
treatment was responsible for creating a porous structure seen visibly in Figure 7. As
chemical treatment creates more porous bran structures, WHC increases. More water is
trapped within porous particles with a large internal surface area. HPH processing has
been shown previously to increase surface area and average pore diameter of fiber to
create a large water retention capacity, similar to WHC (Lundberg et al., 2006; Lundberg
et al., 2003). If the chemical treatment is too severe, degrading the ability of wheat bran
to entrap water, WHC will decrease. This effect was seen within the Factorial design and
604530
5.0
4.5
4.0
0.50.2
0.1000.0750.0500.000
5.0
4.5
4.0
24156
Soak Temp
Mea
n
Bran Grind
NaOH Conc. Soak Time
Main Effects Plot for WHCData Means

94
the Augmentation design was added to help show more detail in the critical region for
maximizing WHC.
Figure 30. Contour Plots of Two Way Interactions for Water Hydration Capacity
in the Combined Design.
The contour plots of all two way variable interactions for WHC are depicted in
Figure 30. Curved contour lines show the nonlinearity of the interaction results with
dark green spaces indicating the highest WHC. The conditions to maximize WHC are
contained within the design variable ranges. Within the experimental design, the
combination of chemical and physical treatments resulted in a nonlinear response where
Bran Grind*Soak Temp
604530
0.5
0.4
0.3
0.2
NaOH Conc.*Soak Temp
604530
0.100
0.075
0.050
0.025
0.000
Soak Time*Soak Temp
604530
24
20
16
12
8
NaOH Conc.*Bran Grind
0.480.360.24
0.100
0.075
0.050
0.025
0.000
Soak Time*Bran Grind
0.480.360.24
24
20
16
12
8
Soak Time*NaOH Conc.
0.100.050.00
24
20
16
12
8
Soak Temp 48
Bran Grind 0.5
NaO H C onc. 0.07
Soak Time 19.9
Hold V alues
>
–
–
–
–
–
–
< 4.0
4.0 4.2
4.2 4.4
4.4 4.6
4.6 4.8
4.8 5.0
5.0 5.2
5.2
WHC
Contour Plots of WHC

95
WHC increased to a maximum and then began to decrease as the intensity of chemical
treatment increased.
Figure 31. Optimum Settings for Maximizing Water Hydration Capacity within the
Combined Factorial and Augmentation Designs. Red bracketed numbers indicate
current settings for each variable shown by the red vertical line. The blue dashed line is
the viscosity resulting from the combination of variable settings.
Figure 31 shows an optimization plot of the experimental design response surface
regression results. The red vertical lines correspond with the bracketed red numbers for
each variable setting and can be moved left or right to determine the results for different
variable scenarios within the design. When maximizing WHC, because of the
nonlinearity of the results, the optimum settings fall within the variable ranges. While
CurHigh
Low0.38569D
New
d = 0.38569
Maximum
WHC
y = 5.1837
0.38569
Desirability
Composite
6.0
24.0
0.0
0.10
0.20
0.50
30.0
60.0Bran Gri NaOH Con Soak TimSoak Tem
[48.0055] [0.50] [0.0700] [20.0820]

96
bran particle size was not significant and was also later fixed at the 0.5 mm grind size for
reducing processing costs, Table 23 shows optimized settings for maximizing WHC at
both bran particle sizes.
Soak Temperature Bran Grind NaOH Concentration Soak Time
45.0°C 0.20 mm 0.08 N 22.6 hours
48.0°C 0.50 mm 0.07 N 20.0 hours
Table 23. Optimum Settings for Maximizing Water Hydration Capacity within the
Combined Factorial and Augmentation Designs.
Two different sets of conditions have now been determined that maximize viscosity
and WHC separately, but neither will result in an optimum set of conditions to
simultaneously maximize both. The process conditions for further bran modification can
be chosen from either set or a combination that attempts to achieve the highest values for
both relative to the importance of each. For example, Figure 32 uses an equal weighting
for the importance of viscosity and WHC to generate optimum settings for the combined
result. The optimum settings for maximizing viscosity and WHC combined are shown in
Table 24. The assumption that WHC and viscosity are equally important for the
processed wheat bran is changeable within the analysis.

97
Figure 32. Optimum Settings for Maximizing Viscosity and Water Hydration
Capacity Simultaneously. Red bracketed numbers indicate current settings for each
variable shown by the red vertical line. The blue dashed lines show the resulting
viscosity and WHC for the optimized settings chosen.
Figure 32 shows that as the chemical pretreatment increased toward a maximum
within the design, WHC increased to a peak and then lowered while viscosity continued
to increase. Higher combined chemical pretreatment variable settings increased the
breaking of covalent bonds including ester linkages between phenolic acids and
arabinoxylan chains (Kim et al., 2006) allowing the high pressure processing to break
apart the bran structures with solubilization of fiber that was once engaged in holding
water. While the increase in soluble fiber continued to contribute to increasing solution
viscosity, WHC was reduced.
CurHigh
Low0.20032D
New
d = 0.10542
Maximum
RVA Ave.
y = 47.2395
d = 0.38064
Maximum
WHC
y = 5.1742
0.20032
Desirability
Composite
6.0
24.0
0.0
0.10
0.20
0.50
30.0
60.0Bran Gri NaOH Con Soak TimSoak Tem
[49.9180] [0.50] [0.0755] [20.0820]

98
Soak Temperature Bran Grind NaOH Concentration Soak Time
49.92°C 0.50 mm 0.0755 N 20.08 hours
Table 24. Optimum Settings for Maximizing Viscosity and Water Hydration
Capacity Combined.
Bound Phenolic Release from Wheat Bran using Optimized Process Setponts for
Maximizing Viscosity
Based on the preliminary screenings and experimental design results, wheat bran
preprocessing and processing conditions have been determined that maximize the
physical properties of viscosity and water hydration capacity while enabling the release
of bound phenolics from the bran structures. Wheat bran processed in both the
Optimization design and Augmentation design was analyzed for free phenolics and
soluble bound phenolics. Process variable settings included the optimized settings to
maximize bran solution viscosity shown in Table 20 as well as controls to show the
effect of chemical treatment or HPH treatment alone on the release of bound phenolics.

99
Figure 33. Free ferulic acid content of processed wheat bran.
Measurement of the free ferulic content of the Optimization design and
Augmentation design bran samples (Figure 33) showed consistent results from both
designs. The NaOH treatment was the key factor in releasing bound phenolics in these
similarly treated samples from the two designs. Levels were very similar even though
months separated the processing of the experimental designs.
OptimizationDesign
AugmentationDesign
0
500
1000
1500
2000
2500
3000
3500
0.0 NMix_Only 0.0 N
Mix+HPH 0.1 NMix_Only 0.1 N
Mix+HPH
Fre
e F
eru
lic
Ac
id
(ug
/g b
ran
)
Treatment
Free Ferulic Acid Released by Mild Alkali Treatment (60°C, 24hr)

100
Figure 34. Averaged free and soluble bound ferulic acid content of processed wheat
bran from Optimization and Augmentation designs.
Figure 34 shows the averaged free and soluble bound ferulic acid from different
samples with similar treatments in both the Optimization and Augmentation designs.
There was difficulty in accurately determining the soluble bound ferulic acid in one of the
samples. The amount was determined by subtracting free ferulic acid extracted with 80%
ethanol from a saponified extract sample. The saponified sample contained both free and
soluble bound phenolics and the total should have been higher than the free ferulic acid
alone. However, in the case of one of the Pretreated + Homogenized samples, the total
amount was less than the free amount leaving a negative value. This is likely due to
sample handling error or loss of measurable ferulic acid due to precipitation during. The

101
extracted pellet was re-extracted with water and saponified to yield another soluble bound
portion and added to the first to achieve a total soluble bound fraction. The soluble
bound amount was only a minor portion of the total ferulic acid released by alkali
treatment during processing, or around 10% of the total, but represented the majority of
the soluble phenolics in the samples not reacted with alkali.
Soluble Fiber Content of Alkali Treated HPH Processed Wheat Bran
Increased soluble fiber content in processed wheat bran was expected based on the
results of increased viscosity and WHC. Figure 35 shows the changes in soluble and
insoluble fiber content of unprocessed bran, alkali treated high shear mixed bran, and
alkali treated bran from the optimized processing profile that received HPH treatment
(Iris Zhang, personal communication, August, 2009). Alkali treatment helped increase
the soluble fiber while the insoluble fiber decreased. Additional HPH treatment further
increased the soluble fiber. The total fiber content (soluble + insoluble fiber) was
different across the measured samples, but the increase of viscosity producing soluble
fiber in the alkali treated HPH samples is important and could lead to increased health
benefits when utilized in food products similar to viscosity producing soluble barley beta
glucan or soluble oat fiber.

102
Figure 35. Averaged free and soluble bound ferulic acid content of processed wheat
bran from Optimization and Augmentation designs.
Visualization of Bran modifications using Scanning Electron Microscopy
The flowchart shown in Figure 36 indicates sample collection points 3a-3d during
bran processing for use in Scanning Electron Microscopy. Sample 3a was a control bran
sample that received hydration with no alkali treatment (0N) or high pressure
homogenization (Mix only). Sample 3b shows the effects of high pressure
homogenization without chemical pretreatment (0N, Mix+HPH). Sample 3c shows the
effect of chemical pretreatment without high pressure homogenization (.1N, Mix only).
Sample 3d shows the combined effect of chemical pretreatment followed by high
pressure homogenization (.1N, Mix+HPH).

103
Figure 36. Bran Processing Flowchart for Sample 3a-3d SEM Micrographs.
Unground Bran
Sample 3a
Grind through
0.5mm screen
High Shear
Mixing
High Pressure
Homogenization
Chemical
Pretreatment:
60°C,
24 Hour Soak,
0.0N NaOH
Bran Processing Flowchart:
Process Steps and Collection Points
For Sample 3a-3d SEM Micrographs
Chemical
Pretreatment:
60°C,
24 Hour Soak,
1.0N NaOH
Neutralize
pH
High Shear
Mixing
Neutralize
pH
Sample 3c
High Pressure
Homogenization
Sample 3b
Sample 3d

104
Figure 37. SEM of Processed Wheat Bran: Sample 3a, 0N, Mix Only, x250.
Starting with the lowest magnification of bran fragments seen in Figure 37, large
pieces of bran with multiple layers including cross cells are seen in the center of the
micrograph. The whole and partial structures in Sample 3a indicate the limited nature of
the pretreatment to degrade the bran. Physical high shear mixing without chemical
treatment or HPH reduced the particle size but did not extensively degrade the structures.
The average particle size was greater than 200 microns. Near the bottom of the
micrograph, aleurone cells are visible and magnified in Figure 38.
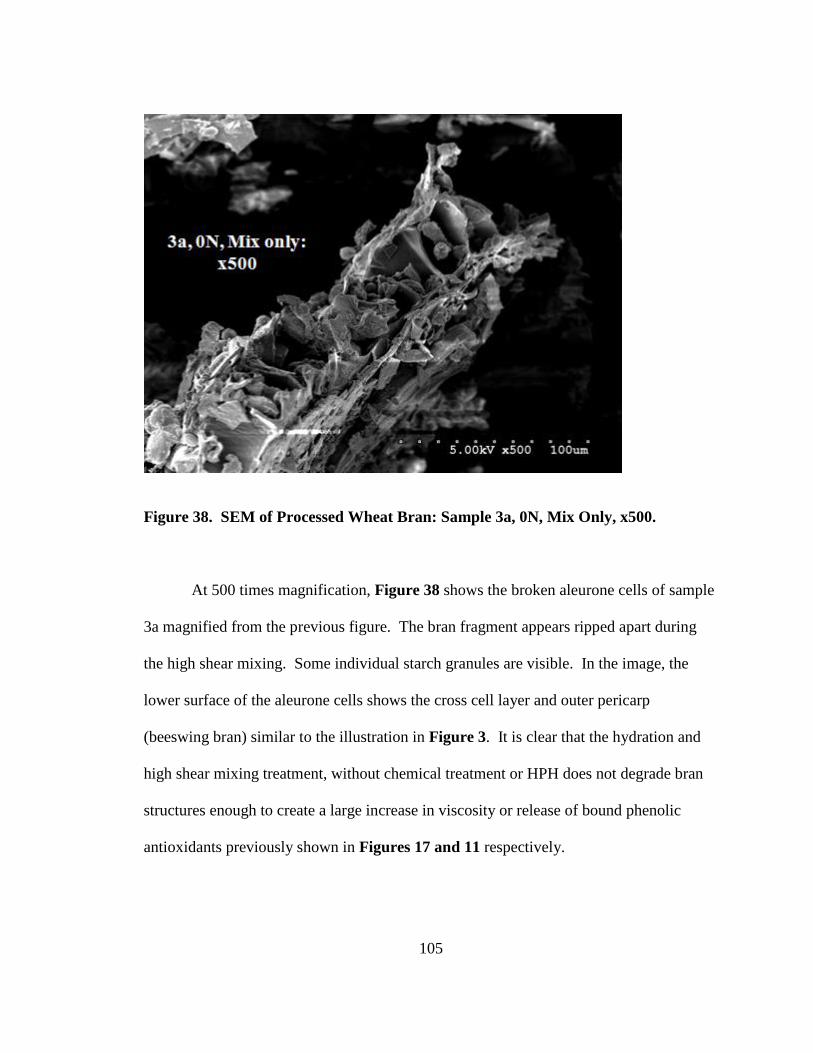
105
Figure 38. SEM of Processed Wheat Bran: Sample 3a, 0N, Mix Only, x500.
At 500 times magnification, Figure 38 shows the broken aleurone cells of sample
3a magnified from the previous figure. The bran fragment appears ripped apart during
the high shear mixing. Some individual starch granules are visible. In the image, the
lower surface of the aleurone cells shows the cross cell layer and outer pericarp
(beeswing bran) similar to the illustration in Figure 3. It is clear that the hydration and
high shear mixing treatment, without chemical treatment or HPH does not degrade bran
structures enough to create a large increase in viscosity or release of bound phenolic
antioxidants previously shown in Figures 17 and 11 respectively.
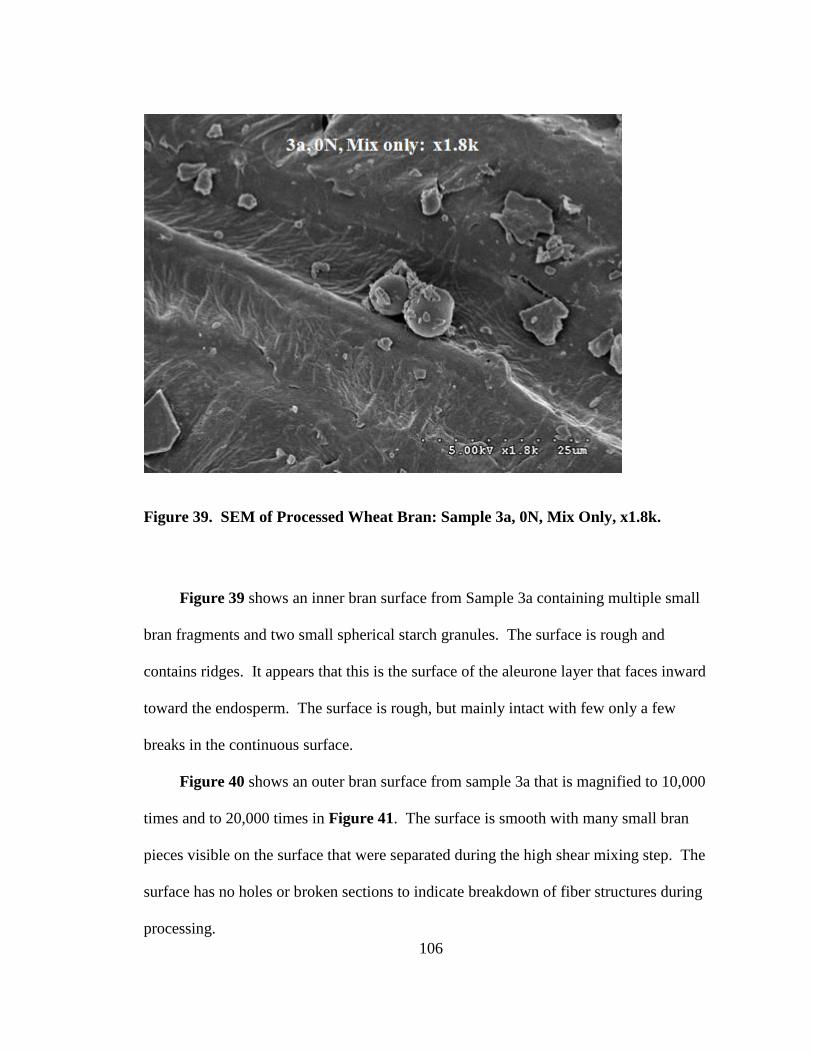
106
Figure 39. SEM of Processed Wheat Bran: Sample 3a, 0N, Mix Only, x1.8k.
Figure 39 shows an inner bran surface from Sample 3a containing multiple small
bran fragments and two small spherical starch granules. The surface is rough and
contains ridges. It appears that this is the surface of the aleurone layer that faces inward
toward the endosperm. The surface is rough, but mainly intact with few only a few
breaks in the continuous surface.
Figure 40 shows an outer bran surface from sample 3a that is magnified to 10,000
times and to 20,000 times in Figure 41. The surface is smooth with many small bran
pieces visible on the surface that were separated during the high shear mixing step. The
surface has no holes or broken sections to indicate breakdown of fiber structures during
processing.
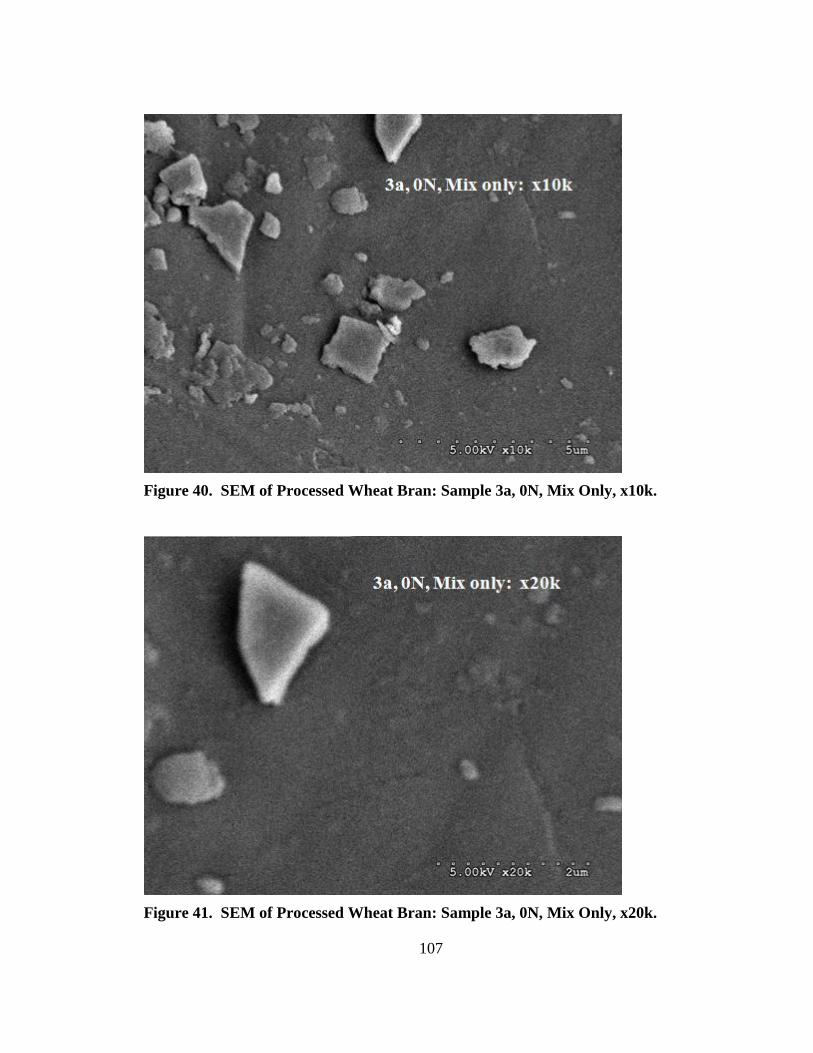
107
Figure 40. SEM of Processed Wheat Bran: Sample 3a, 0N, Mix Only, x10k.
Figure 41. SEM of Processed Wheat Bran: Sample 3a, 0N, Mix Only, x20k.

108
Figure 42. SEM of Processed Wheat Bran: Sample 3b, 0N, Mix+HPH, x10k.
Figures 42, 43, and 44 show the effect of HPH treatment without chemical
pretreatment on wheat bran Sample 3b. The difference between 3a and 3b is easily seen
as holes and pores appear on the surface of the bran. Intense pressure and shear during
HPH processing increase disruption of bran structures. Particle size was greatly reduced
and the previously smooth and continuous bran surface is pitted and cratered. Though
particle size was greatly reduced by HPH, solution viscosity and bran WHC was only
moderately increased. Physical disruption alone through HPH did not release bound
phenolics as previously shown.

109
Figure 43. SEM of Processed Wheat Bran: Sample 3b, 0N, Mix+HPH, x10k.
Figure 44. SEM of Processed Wheat Bran: Sample 3b, 0N, Mix+HPH, x20k.
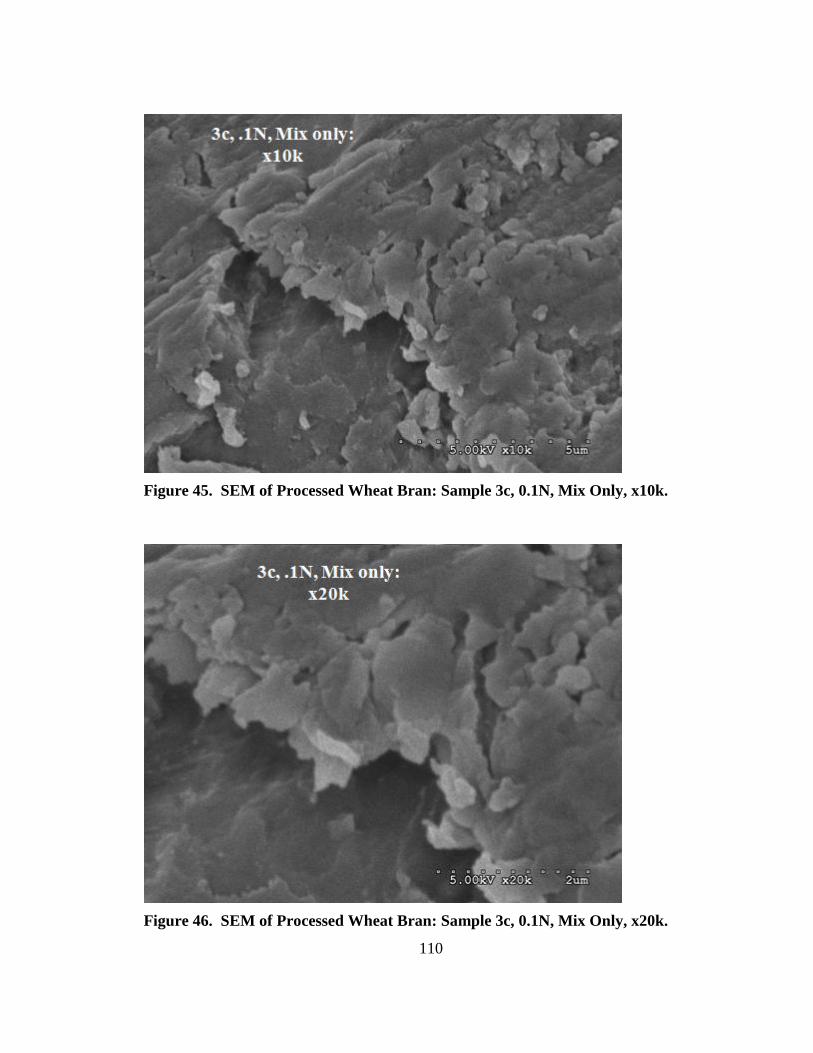
110
Figure 45. SEM of Processed Wheat Bran: Sample 3c, 0.1N, Mix Only, x10k.
Figure 46. SEM of Processed Wheat Bran: Sample 3c, 0.1N, Mix Only, x20k.

111
Unlike the physical HPH treatment where disruption in bran surfaces created small
holes and pores, the chemical pretreatment of Sample 3c shown in Figures 45 and 46
creates a weakened structure that allows high shear mixing to break apart into smaller
pieces. As previously described, the alkali treatment hydrolyzes ester linkages between
arabinoxylan and phenolic acid molecules weakening the structure and freeing the bound
phenolics. Even without HPH treatment, free phenolics increased dramatically (Figure
11) and a moderate increase in viscosity and WHC was found. Weakening the bran
structure using the chemical pretreatment made the HPH treatment much more effective.
Figure 47. SEM of Processed Wheat Bran: Sample 3d, 0.1N, Mix+HPH, x10k.

112
Figure 48. SEM of Processed Wheat Bran: Sample 3d, 0.1N, Mix+HPH, x10k.
Figures 47 and 48 show the combined chemical pretreatment followed by HPH in
Sample 3d at a medium magnification of 10,000 times. Surfaces that were once smooth
and solid are now disrupted with larger dimples, holes, and craters. Bran layers have
undergone additional particle size reduction and also layer separation. Additional detail
of these two figures is shown by increasing the magnification to 20,000 times in Figures
49 and 50, and again to 50,000 times in Figures 51 and 52. 100 to 500 nanometer holes
were common throughout the sample surface. The material that was removed by the
processing treatments went into solution either as soluble or suspended material greatly
increasing the viscosity and WHC.

113
Figure 49. SEM of Processed Wheat Bran: Sample 3d, 0.1N, Mix+HPH, x20k.
Figure 50. SEM of Processed Wheat Bran: Sample 3d, 0.1N, Mix+HPH, x20k.
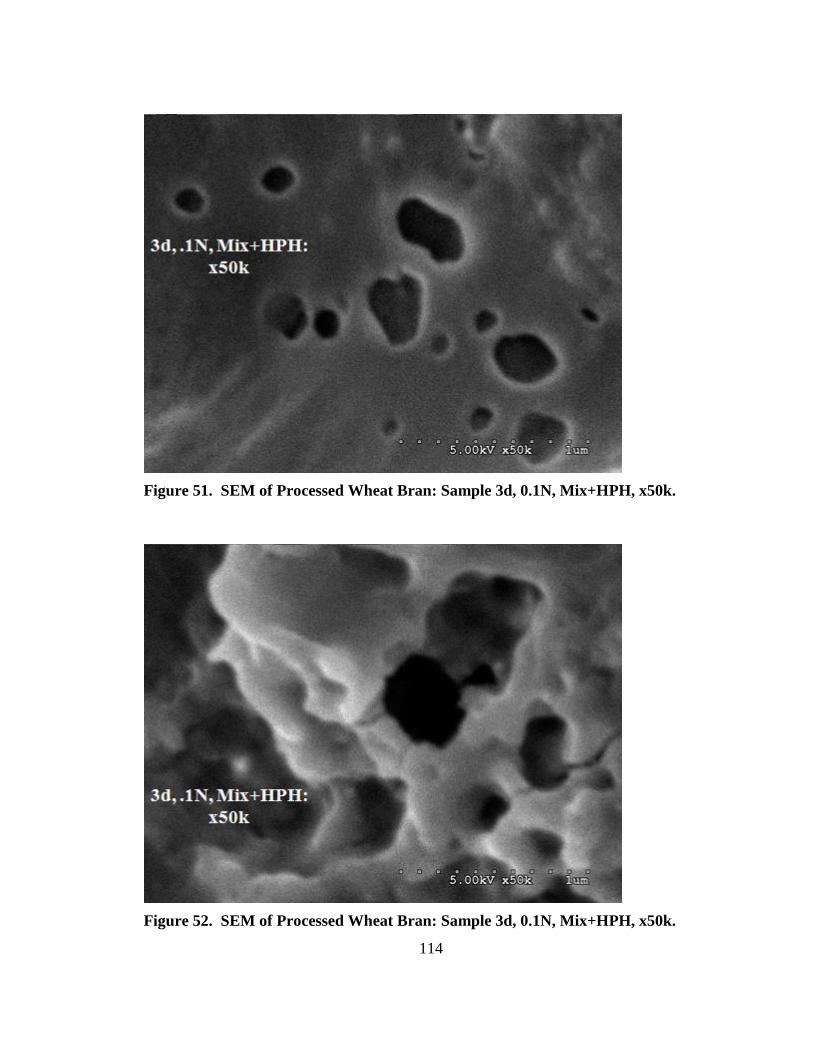
114
Figure 51. SEM of Processed Wheat Bran: Sample 3d, 0.1N, Mix+HPH, x50k.
Figure 52. SEM of Processed Wheat Bran: Sample 3d, 0.1N, Mix+HPH, x50k.

115
Conclusions
Earlier experimentation proved that chemical treatments were responsible for
maximizing release of bound phenolics and the combination of chemical and physical
treatments were important for maximizing viscosity and WHC. In this work, statistical
experimental designs were evaluated to optimize preprocessing and processing conditions
to maximize bran solution viscosity, WHC, and free phenolics. Optimum conditions for
maximizing viscosity were not identical to the conditions for maximizing WHC, so an
augmentation design was added to increase results resolution. Optimization pretreatment
conditions leading to maximum viscosity and WHC were determined and treated bran
had the following modifications: 500% increase in viscosity, 200% increase in WHC,
200% increase in Wa-Ex material, a 300 fold increase in free and soluble-bound
phenolics, and a 500% increase in soluble fiber. Visual examination by SEM confirmed
structural modification measurements.
With this phase completed, additional samples were needed for testing and
developmental work by collaborators on this program. The next phase of research begins
with producing large quantities of bran samples for the next phase. Optimization process
conditions for maximizing solution viscosity were chosen for samples moving forward.
They are: 0.1N NaOH treatment at 60°C for 24 hours prior to neutralization and HPH.
Three kilograms of treated bran was requested.

116
Project 3: Large Scale Sample Preparation of Optimized Process Bran
Large Samples Needed for Collaborative Research
Previous work to develop processes to improve the functionality and bioactivity of
wheat bran were successful based on physical and chemical measurements. The
optimized process created wheat bran samples with increased potential for bioavailability
of bioactive components and physiological benefits due to the changed physical
properties of the bran. Increased sample size was needed for further study and to provide
to collaborating researchers.
Objectives
1) Utilizing the wheat bran pretreatment and high pressure homogenization (HPH)
process settings to maximize viscosity and water hydration capacity (WHC)
determined in Project 2, process 3 kg of wheat bran for additional analysis, animal
feeding studies, and preliminary baking studies.
2) Explore process options for separating and concentrating the processed bran
suspension and produce additional quantities of bran fractions for further
research.

117
Materials and Methods
Raw Materials: Soft White Wheat (SWW) bran was obtained from King Milling
Company (Lowell, MI), Sustigrain Barley and Ultrafiber stabilized wheat bran were
obtained from ConAgra (Omaha, NE). All samples were stored at -20°C until use.
Dry Particle Size Reduction utilized rotor beater milling technology (Retsch
GmbH, Model SR 300, Haan, Germany). Bran was ground in a single pass through the
0.5mm screen to obtain coarse bran samples.
Wet Grinding/Milling was accomplished using a high shear rotor stator type
homogenizer. The T25 Basic SI homogenizer with S25N-25F dispersing element (IKA
Works, Wilmington NC) was used prior to all high pressure homogenization (HPH)
processing to reduce particle size and prevent clogging of HPH disruption chambers.
Large 5L samples were mixed for 10 minutes at 24,000 rpm.
Alkali Pretreatment: 5% bran solutions were prepared (using 500g bran sample
on dry basis, creating 10 Liters solution) with appropriate alkali concentration and
agitated in an Innova 4300 incubated shaker (New Brunswick Scientific, Edison, NJ) for
the specified time and temperature of 24 hours at 60°C. Solutions were then neutralized
to pH 7 with 1N HCl and diluted to 12.5 Liters to achieve 4% bran solutions for HPH
processing. A total of 3 kg of bran dry matter was processed.
High Pressure Homogenization (HPH) was carried out on an M-110Y Laboratory
Microfluidizer® Processor (Newton, MA). Homogenization pressure was controlled by
adjusting compressed air pressure. Air pressure and flow was targeted to achieve 23,000
psi during processing. Disruption chambers used to achieve homogenization included a

118
200 micron chamber followed by a 100 micron dispersion chamber in series. The 200
micron chamber reduced bran particle size to prevent plugging of the 100 micron
chamber. Heat was generated during processing so chilled water cooled the processed
solutions. This study utilized 4% bran solution concentration and three passes through
the homogenizer to ensure complete homogenization of samples.
Moisture Content of duplicate samples was measured by AACC Moisture method
44-15A. Briefly, 2g of sample was weighed into an aluminum dish with cover. Sample
was heated in a gravity oven at 130°F for 60 minutes. Dishes were removed from the
oven, covered, and placed in a desiccator to cool. Moisture was calculated as loss in
weight divided by original sample weight. Replicates must be within 0.2% moisture.
Particle Size Distribution was measured by laser diffraction particle size analyzer
(LS-13-320, Beckman Coulter Inc., Brea, CA) using the Universal Liquid Module.
Paper Filtration of Processed Bran Solution was tested using Whatman Grade 1
and Grade 4 qualitative paper discs in a Buchner funnel mounted to a suction flask.
Evaporative Concentration of Processed Bran Solution was tested using a small
―homemade‖ dairy evaporator (Dairy Pilot Plant, University of Minnesota Dept. of Food
Science and Nutrition). The sample was indirectly heated under vacuum and as vapor
was removed and condensed, the sample was concentrated, cooled, and freeze dried. The
bran sample was condensed from about 2.9% solids to about 5.5% solids.
Laboratory Scale Separation of Processed Bran into More Soluble and Less
Soluble Fractions was tested on a Beckman J2-MC High Speed Floor Model Centrifuge

119
(Beckman Coulter Inc., Brea, CA). Samples were centrifuged at 10,000g for 30 minutes.
Supernatant and pellet were separated, pooled, and freeze dried.
Large Scale Separation of Processed Bran into More Soluble and Less Soluble
Fractions was accomplished by passing processed bran solution through a desludging
centrifuge (Westfalia Clarifier/Separator, Model SB7, Oelde, Germany) creating a more
―soluble‖ fraction and a more ―insoluble‖ fraction. Bran solution was processed
approximately 2 liters per minute, with flushing of the solids after 4 minutes. Centrifuge
speed was 9200 rpm. Intake was adjusted to achieve roughly equal amounts of soluble
and insoluble fractions. Clean incoming water was used to flush the insoluble fraction
during continuous operation and this diluted the samples. The insoluble fraction was
passed through the separator a second time and the soluble fraction was added to the first
pass soluble fraction. All materials were freeze dried.
Freeze Drying was carried out using multiple VirTis EL series Freezemobile freeze
dryers (SP Scientific, Warminster, PA). Processed bran samples were either shell frozen
in jars and dried using manifold trees, frozen in trays and dried in a tray dryer, or frozen
into round cake pans, placed into 7.2 Liter stainless steel vessels with acrylic lids
(Millrock Technology, Kingston, NY) and attached to a freeze dryer manifold port.
Dried samples were quickly ground in a food processer and combined into one lot for
further study and analysis.

120
Results and Discussion
Increased Scale Production of Optimized Processed Bran
In order to provide processed bran samples for chemical analysis, animal feeding
studies, bioactivity and bioavailability analysis, and test baking studies, a large quantity
of viscosity optimized processed bran was needed. Previous sample size contained only
10 grams of bran dry matter, so a 300 fold increase was a large challenge. Although the
HPH equipment remained the same and could process approximately 60 ml per minute
per pass, this was not the bottleneck in the process as it could run continuously until
processing was complete. The alkali pretreatment conditions were modified the most.
Figure 53 shows a flowchart of the entire bran process. First, the bran quantity
needed to be increased and it was decided to utilize 500 grams of bran dry matter in each
of six batches that were reacted in 5 gallon pails with tightly closing lids. 5% bran
solutions were made with 10 liters total. This was the same bran concentration as
previously tested samples, but now much larger quantity. After alkali treatment, the
samples were neutralized and diluted to 12.5 liters creating 4% bran dry matter
concentration in the solution, twice the concentration of previous experimental designs.

121
Figure 53. Processing Flowchart for Large Scale Sample Preparation of Optimized
Processed Bran and Fractionated Bran.
Bran Processing Flowchart:
Process Steps and Collection Points
Unground
Bran
Freeze Dried Samples
for Further Analysis
Grind Through 0.5m Screen
High Shear
Mixing
Neutralize
pH
High Pressure
Homogenization
3 Passes, 23,000 psi
Agitated
Soaking
Conditions
(60°C, 24 hr,
0.1N NaOH)
Water
Separator
Freeze Dry
More “Soluble”
Fraction
Less “Soluble” Fraction
(returned for additional
pass through separator)
122
The concerns with increasing the concentration of the solution for HPH treatment
were clogging of the chambers with too much bran material, and processed bran viscosity
too high to pump. Preliminary testing showed that neither was an issue. Though the
solution viscosity after HPH processing was high, the powerful HPH pump had no issues
with either pumping or clogging when processing the more viscous bran solution.
Additionally, three passes through the HPH were utilized instead of two. This ensured
the complete homogenization processing of the more concentrated solution.
Three kilograms of optimized process bran were processed and freeze dried and
stored at -40°C for further testing. An additional three kilograms of control bran was
freeze dried and also held at -40°C for further testing.
Separating or Concentrating the Soluble Fraction of Optimized Process Wheat Bran
After learning that more than half of the optimized processed bran fiber content was
insoluble as shown in Figure 35, it was decided to experiment with processing
techniques that could separate or concentrate the soluble fraction. The soluble fraction
will contain the free and soluble bound phenolics so the ability to concentrate that
fraction would be beneficial. Gallaher et al. (1993) suggested that materials moderately
increasing the viscosity of intestinal contents could be effective in reducing plasma
cholesterol, primarily by disrupting cholesterol absorption/reabsorption in the small
intestine. Native wheat bran does not create viscosity in solution or in in-vitro intestinal
simulations (Dikeman et al., 2006), but it is hypothesized that the modified wheat bran in
this research may have a measurable cholesterol lowering effect as that of oat or barley

123
beta glucan soluble fiber (Dongowski et al., 2002) or other high viscosity soluble fibers
like hydroxypropyl methylcellulose (Carr, et al., 1996).
Several methods to separate or concentrate the soluble bran fraction were evaluated
including filtration, evaporation, and centrifugation. On a larger scale, membrane
filtration, evaporation, and centrifugation are commonly used to separate and concentrate
food ingredients. Laboratory testing of qualitative paper filters indicated that membrane
filtration would not work. Laboratory samples were filtered using Whatman qualitative
Grade 4 circles in a Buchner funnel mounted to a suction flask. When first tested, Grade
1 filter paper (11 micron particle retention) clogged almost immediately and even Grade
4 (25 micron particle retention) was very slow to filter. Although particle size analysis
indicated roughly 50% of the processed bran was larger than the filter paper retention
size, the bran clogged the paper almost immediately and 872 ml of 2.5% bran solution
took many six hours to filter. Of the 24.28g of bran recovered from filtration after freeze
drying, the ―soluble‖ fraction passing through the filter was 52.6% of the total and the
―insoluble‖ retentate was 47.4%. The viscous fibrous nature of the bran solution would
also clog membranes of a commercial membrane filtration system, so separation or
concentration by membrane filtration was not possible.
Evaporation to concentrate the bran solution to remove water was also tested.
Approximately 8 liters of viscosity optimized bran solution was processed. The
evaporative concentration of the bran solution nearly doubled the solids content, from
about 2.9% to about 5.5% bran solids, but the increased temperature caused browning
reactions to occur. As evaporation progressed, the bran solution became more and more

124
difficult to concentrate. On a larger scale, indirect heating, increased vacuum and better
temperature control might limit sample heating, browning, oxidation, and degradation,
but concentration to high solids content would still be limited by the highly viscous, high
WHC nature of the bran in solution. Heating the free phenolic compounds in the
solution, even under vacuum, would cause reactions detrimental to bioactivity. Other
forms of concentration, such as microwave assisted vacuum drying or microwave assisted
freeze drying may improve the likelihood of commercial success of a dried ingredient
that would otherwise be too costly to produce and dry by means of freeze drying alone.
Laboratory centrifugation of the bran solution at 10,000g for 30 minutes proved to
be a simple way of separating a more soluble fraction from a more insoluble fraction. A
total of 2.2 kilograms of solution was centrifuged. Supernatants and pellets were pooled
and freeze dried. The starting concentration of bran dry matter in solution was 3%. The
solids content of the ―soluble‖ supernatant fraction was 1.87%, while the solids content
of the ―insoluble‖ pellet fraction was 15.2%. For this process, the soluble fraction
comprised 57% of the total bran material and 43% remained in the insoluble fraction.
Based on the success of the laboratory centrifuge test, an additional four kilograms
of optimized processed bran was made for the purpose of centrifuge separation using a
desludging dairy separator. The process is shown at the bottom of Figure 53. The
processed bran solution was fed into the separator centrifuge which was rotating at 9200
rpm. More ―soluble‖ material travelled out as supernatant, while more ―insoluble‖ bran
collected in the separator. Every 4 minutes, the solution in-feed stopped and water
flushed the insoluble fraction from the separator. The insoluble fraction was passed

125
through the separator a second time both fractions were freeze dried. This separation
yielded 68.8% soluble fraction and 31.3% insoluble fraction and was somewhat arbitrary
based on the settings of the separator and the second pass of the insoluble fraction.
Because one the goal of the separation was to obtain as much of the soluble phenolic
material and viscosity producing soluble fiber as possible in one fraction, the extra pass
of the insoluble fraction was desired.
Due to minor losses during separation processing, 2645 grams of freeze dried
soluble fraction and 1250 grams of freeze dried insoluble fraction were produced and
held at -40°C for further testing.
Conclusions
A large quantity of three kilograms of viscosity optimized processed bran was needed for
additional experimentation by collaborators in this research program. The process was
scaled up to produce the bran without changing its functionality. Additional testing to
separate or concentrate the more functional soluble fiber and phenolic content was
conducted. Filtration, evaporation, and centrifugation methods were tested. Only
centrifugation yielded positive and scalable results. An additional four kilograms of
processed bran was separated into more soluble and more insoluble fractions for further
research study.

126
References
Adam, A., Crespy, V., Levrat-Verny, M., Leenhardt, F., Leuillet, M., Demigne C., and
Remesy, C. 2002. The bioavailability of ferulic acid is governed primarily by the food
matrix rather than its metabolism in intestine and liver in rats. J. Nutr. 132(7): 1962-1968.
Adom, K. K., and Liu, R. H. 2002. Antioxidant activity of grains. J. Ag. and Food Chem.
50(21): 6182-6187.
Adom, K. K., Sorrells, M. E., and Liu, R. H. 2005. Phytochemicals and antioxidant
activity of milled fractions of different wheat varieties. J. Ag. and Food Chem. 53(6):
2297-2306.
Aguilar, C. N., Rodriguez, R., Gutierrez-Sanchez, G., Augur, C., Favela-Torres, E.,
Prado-Barragan, L. A., Ramirez-Coronel, A., and Contreras-Esquivel, J. C. 2007.
Microbial tannases: advances and perspectives. Appl. Microbiol. Biotechnol. 76: 47-59.
Andreasen, M. F., Kroon, P. A., Williamson, G., and Garcia-Conesa, M. 2001. Intestinal
release and uptake of phenolic antioxidant diferulic acids. Free Radical Biol. and
Medicine, 31(3): 304-314.
Antoine, C., Lullien-Pellerin, V., Abecassis, J., and Rouau, X. 2004. Effect of wheat bran
ball-milling on fragmentation and marker extractability of the aleurone layer. J. Cereal
Sci. 40(3): 275-282.
Bakke, A., Vickers, Z., Marquart, L., and Sjoberg, S. 2007. Consumer acceptance of
refined and whole wheat breads. p 255-261 in: Whole Grains and Health. Ames, Iowa:
Blackwell Publishing.
Bakke, A., and Vickers, Z. 2007. Consumer liking of refined and whole wheat breads. J.
Food Sci. 72, S473-S480.
Benoit, I., Navarro, D., Marnet, N., Rakotomanomana, N., Lesage-Meessen, L., Sigoillot,
J. C., and Asther M. 2006. Feruloyl esterases as a tool for the release of phenolic
compounds from agro-industrial by-products. Carbohydrate Research 341(11): 1820-
1827.
Bredie, W. L., Mottram, D. S., and Guy, R. C. 2002. Effect of temperature and pH on the
generation of flavor volatiles in extrusion cooking of wheat flour. J. Agric. Food Chem.
50: 1118-1125.
Caprez, A., and Fairweather-Tait, S. J. 1982. The effect of heat treatment and particle
size of bran on mineral absorption in rats. British J. Nutr. 48(03): 467-475.

127
Carr, T. P., Gallaher, D. D., Yang, C. H., and Hassel, C. A. 1996. Increased intestinal
contents viscosity reduces cholesterol absorption efficiency in hamsters fed
hydroxypropyl methylcellulose. J. Nutr. 126(5): 1463-1469.
Chang, C., and Chambers, E. IV. 1992. Flavor characterization of breads made from hard
red winter wheat and hard white winter wheat. Cereal Chem. 69(6): 556-559.
Chang, C., Seitz, L., and Chambers, E. IV. 1995. Volatile flavor components of breads
made from hard red winter wheat and hard white winter wheat. Cereal Chem. 72(3):237-
242.
Chau, C., Wen, Y., and Wang, Y. 2006. Improvement of the functionality of a potential
fruit insoluble fibre by micron technology. Int. J. Food Sci. & Technol. 41(9): 1054-1060.
Dewanto, V., Wu, X., and Liu, R. H. 2002. Processed sweet corn has higher antioxidant
activity. J. Agric.Food Chem. 50(17): 4959.
Dikeman, C. L., Murphy, M. R., and Fahey, G. C. 2006. Dietary fibers affect viscosity of
solutions and simulated human gastric and small intestinal digesta. J. Nutr. 136(4): 913-
919.
Dobberstein, D., and Bunzel, M. 2010. Separation and detection of cell wall-bound
ferulic acid dehydrodimers and dehydrotrimers in cereals and other plant materials by
reversed phase high-performance liquid chromatography with ultraviolet detection. J.
Agric.Food Chem. 58(16): 8297-8935.
Dongowski, G., Huth, M., Gebhardt, E., and Flamme, W. 2002. Dietary fiber-rich barley
products beneficially affect the intestinal tract of rats. J. Nutr. 132(12): 3704-3714.
Drzikova, B., Dongowski, G., Gebhardt E., and Habel A. 2005. The composition of
dietary fibre-rich extrudates from oat affects bile acid binding and fermentation in vitro.
Food Chem. 90(1-2): 181-192.
Ferguson, L. R., and Harris, P. J. 1997. Particle size of wheat bran in relation to colonic
function in rats. Lebensm.-Wiss. U.-Technol. 30(7): 735-742.
Fulcher, R. G. and Rooney-Duke, T. K. 2002. Whole grain structure and organization:
implications for nutritionists and processors. In Whole Grains in Health and Disease, 9-
46. ed. Marquart, L., Slavin, J. L., and Fulcher, R. G., Am. Assoc. Cereal Chem.
Fung, T. T., Hu, F. B., Pereira, M. A., Liu, S., Stampfer, M. J., Colditz, G. A., and
Willett, W. C. 2002. Whole-grain intake and the risk of type 2 diabetes: a prospective
study in men. Am. J. Clin. Nutr. 76(3): 535-540.

128
Gallaher, D. D., Hassel, C. A., and Lee, K. J. 1993. Relationships between viscosity of
hydroxypropyl methylcellulose and plasma cholesterol in hamsters. J. Nutr. 123(10):
1731-1738.
Harris, P. J. 2005. Production and characterisation of two wheat-bran fractions: an
aleurone-rich and a pericarp-rich fraction. Mol. Nutr. Food Res. 49(6): 536.
Hassan, E. G., Awad Alkareem, A. M., and Mustafa, A. M. 2008. Effect of fermentation
and particle size of wheat bran on the antinutritional factors of bread quality. Pakistan J.
Nutr. 7 (4) 521-526.
Heath, H.B., and Reineccius, G.A. 1986. Flavor and its study. Pages 1-42 in: Flavor
Chemistry and Technology. Van Nostrand Reinhold: New York.
Hedrén, E., Mulokozi, G., and Svanberg, U. 2002. In vitro accessibility of carotenes from
green leafy vegetables cooked with sunflower oil or red palm oil. Int. J. Food Sci. &
Nutr. 53(6): 445-453.
Heinio, R. L., Liukkonen, K. H., Katina, K., Myllymaki, O., and Poutanen, K. 2003.
Milling fractionation of rye produces different sensory profiles of both flour and bread.
Lebensm.-Wiss. U.-Technol. 36:577-583.
Heinio, R. L., Liukkonen, K. H., Katina, K., Myllymaki, O., Pihlava, J. M., Aldercreutz,
H., Heinonen, S. M., and Poutanen, K. 2008. Quantities of phenolic compounds and their
impacts on the perceived flavor attributes of rye grain. J. Cereal Sci. 47:566-575.
Hemery, Y. M., Anson, N. M., Havenaar, R., Haenen, G., Noort, M., Rouau, X. 2010.
Dry-fractionation of wheat bran increases the bioaccessibility of phenolic acids in breads
made from processed bran fractions. Food Res. Intl. 43(5) 1429-1438.
Jacobs Jr., D. R., Marquart, L., Slavin, J., and Kushi, L. H. 1998. Whole grains and
cancer. Nutr. Res. Newsletter. 17(6): 9.
Kahlon, T. S., and Woodruff, C. L. 2003. In vitro binding of bile acids by rice bran, oat
bran, barley and beta-glucan enriched barley. Cereal Chem. 80(3): 260-263.
Kahlon, T. S., Berrios, D. J., Smith, G. E., and Pan J. L. 2006a. In vitro bile acid binding
capacity of milled wheat bran and milled extruded wheat bran at five specific mechanical
energy levels. Cereal Chem. 83(4): 434-438.
Kahlon, T. S., Berrios, D. J., Smith, G. E., and Pan J. L. 2006b. Extrusion conditions
modify hypocholesterolemic properties of wheat bran fed to hamsters. Cereal Chem.
83(2): 152-156.

129
Katina, K., Liukkonen, K., Kaukovirta-Norja, A., Adlercreutz, H., Heinonen, S., Lampi,
A., Pihlava, J., and Poutanen, K. 2007. Fermentation-induced changes in the nutritional
value of native or germinated rye. J. Cereal Sci. 46(3): 348-355.
Kim, K., Tsao, R., Yang, R., and Cui, S. W. 2006. Phenolic acid profiles and antioxidant
activities of wheat bran extracts and the effect of hydrolysis conditions. Food Chem.
95(3): 466-473.
Klepacka, J., and Fornal, L. 2006. Ferulic acid and its position among the phenolic
compounds of wheat. Crit. Rev. Food Sci. Nutr. 46639--647.
Koh-Banerjee, P., Franz, M., Sampson, L., Liu, S., Jacobs Jr., D. R., Spiegelman, D.,
Willett, W., and Rimm, E. 2004. Changes in whole-grain, bran, and cereal fiber
consumption in relation to 8-y weight gain among men. Am. J. Clin. Nutr. 80(5): 1237-
1245.
Kroon, P. A., Faulds, C. B., Ryden, P., Robertson, J. A., and Williamson, G. 1997.
Release of covalently bound ferulic acid from fiber in the human colon. J. Agric.Food
Chem. 45(3): 661-667.
Land, C. E., and Walker, C. E. 1990. Hard white and red winter wheat comparison in
hamburger buns. Cereal Chem. 67(2): 197-201.
Li, Y., Ruan, R., Chen, P. L., Liu, Z., Pan, X., Lin, X., Liu, Y., Mok C. K., and Yang T.
2004. Enzymatic hydrolysis of corn stover pretreated by combined dilute alkaline
treatment and homogenization. Trans. ASAE 47(3): 821--825.
Liu, R. H. 2007. Whole grain phytochemicals and health. J. Cereal Sci. 46(3): 207-219.
Liyana-Pathirana, C. M., Dexter, J., and Shahidi, F. 2006. Antioxidant properties of
wheat as affected by pearling. J. Agric. Food Chem. 54(17): 6177-6184.
Liyana-Pathirana, C. M., and Shahidi, F. 2006. Importance of insoluble-bound phenolics
to antioxidant properties of wheat. J. Agric. Food Chem. 54(4): 1256-1264.
Lorenz, K., and Maga, J. 1972. Staling of white bread: Changes in carbonyl composition
and glc headspace profiles. J. Agr. Food Chem. 20 (2): 211-213.
Lundberg, B., Gu, L., Ruan, R., Chen, L., Addis, P., and Johnson, J. 2006. Cellulose
fiber-based compositions and their method of manufacture. U.S. Patent 7074300B2.
Lundberg, B., Gu, L., Ruan, R., Addis, P., and Johnson, J. 2003. Cellulose fiber-based
compositions and their method of manufacture. U.S. Patent 6506435.
130
Maeda, T., Kim J., Ubukata, Y., and Morita, N. 2009. Analysis of volatile compounds in
polished-graded wheat flour bread using headspace sorptive extraction. Eur. Food Res.
Technol. 228:457-465.
Maga, J., and Lorenz, K. 1973. Taste threshold values for phenolic acids which can
influence flavor properties of certain flours. Cereal Sci. Today. 18: 326-328, 350.
Maga, J.A. 1978. Cereal volatiles, a review. J. Agric. Food Chem. 26(1): 175-178.
Marquart, L., Jacobs Jr., D. R., McIntosh, G. H., Poutanen, K., and Reicks, M. 2007.
Whole Grains and Health. Ames, Iowa: Blackwell Publishing.
Mathew, S., and Abraham, T. E. 2004. Ferulic acid: an antioxidant found naturally in
plant cell walls and feruloyl esterases involved in its release and their applications. Crit.
Rev. Biotechnol. 24 (2-3):59-83.
Mathew, S., and Abraham, T. E. 2006. Bioconversions of ferulic acid, an
hydroxycinnamic acid. Crit. Rev. Microbiol. 32:115-125.
Merriam-Webster Online Dictionary. 2008. Bioavailability. Merriam-Webster Online.
Available at: http://medical.merriam-webster.com/medical/bioavailable. Accessed 11/18
2008.
Miller, G., Prakash A., and Decker E. A. 2002. Whole-grain micronutrients. In Whole
Grains in Health and Disease, ed. Marquart, L., Slavin, J., and Fulcher, G., Am. Assoc.
Cereal Chem.
Monsalve-Gonzalez, A., and Prakash, A. 2003. Bran and bran containing products of
improved flavor and methods of preparation. U.S. Patent 20030104103.
Montana Wheat & Barley Committee. 2006. Diagram of a kernel. Available at:
http://wbc.agr.mt.gov/Consumers/diagram_kernel.html. Accessed December 7 2007.
Naczk, M., and Shahidi, F. 1989. The effect of methanol-ammonia-water treatment on the
content of phenolic acids of canola. Food Chem. 31(2): 159-164.
Naczk, M., and Shahidi, F. 2006. Phenolics in cereals, fruits and vegetables: Occurrence,
extraction and analysis. J. Pharm. Biomed. Anal. 41:1523-1542.
Napolitano, A., Lanzuise, S., Ruocco, M., Arlotti, G., Ranieri, R., Knutsen, S. H., Lorito
M., and Fogliano, V. 2006. Treatment of cereal products with a tailored preparation of
Trichoderma enzymes increases the amount of soluble dietary fiber. J. Agric. Food
Chem. 54(20): 7863-7869.

131
North Dakota Wheat Commission. 2007. Kernel of Wheat Flyer. Available at:
http://www.ndwheat.com/uploads/resources/376/wfc-kernel-flyer.pdf. Accessed
December 7 2008.
Ohta, T., Semboku, N., Kuchii, A., Egashira, Y., and Sanada, H. 1997. Antioxidant
activity of corn bran cell-wall fragments in the LDL oxidation system. J. Agric. Food
Chem. 45(5): 1644-1648.
Parada, J., and Aguilera, J. M. 2007. Food microstructure affects the bioavailability of
several nutrients. J. Food Sci. 72(2): R21--R32.
Parker, M. L., Ng, A., and Waldron, K. W. 2005. The phenolic acid and polysaccharide
composition of cell walls of bran layers of mature wheat (<I>Triticum aestivum</I> L.
cv. Avalon) grains. J. Sci. Food Agric. 85(15): 2539--2547.
Perrin, R. K., and Anthony, P. 2001. The potential for hard white winter wheat in
Nebraska. Agricultural Economics Department, University of Nebraska. Available at:
http://digitalcommons.unl.edu/cgi/viewcontent.cgi?article=1020&context=agecon_cornh
usker. Accessed Feb. 28, 2010.
Quilez, J., Ruiz, J. A., and Romero, M. P. 2006. Relationships between sensory flavor
evaluation and volatile and nonvolatile compounds in commercial wheat bread type
baguette. J. Food Sci. 71(6):S423-S427.
Saulnier, L., Marot, C., Elgorriaga, M., Bonnin, E., and Thibault, J. 2001. Thermal and
enzymatic treatments for the release of free ferulic acid from maize bran. Carbohydrate
Polymers, 45(3): 269-275.
Schooneveld-Bergmans, M. E. F., A. M. C. P. Hopman, G. Beldman and A. G. J.
Voragen. 1998. Extraction and partial characterization of feruloylated
glucuronoarabinoxylans from wheat bran. Carbohydr. Polym. 35(1-2): 39-47.
Seitz, L.M., and Ram, M. S. 2000. Volatile methoxybenzene compounds in grains with
off-odors. J. Agric. Food Chem. 48 (9): 4279-4289.
Siliani, S., Mattei, A., Innocenti, L. B., and Zanoni, B. 2006. Bitter taste and phenolic
compounds in extra virgin olive oil: an empirical relationship. J. Food Qual. 29: 431-441.
Slavin, J. L., Martini, M. C., Jacobs Jr., D. R., and Marquart, L. 1999. Plausible
mechanisms for the protectiveness of whole grains. Am. J. Clin. Nutr. 70(3 Suppl): 459S-
463S.
Sosulski, F., Krygier, K., and Hogge L. 1982. Free, esterified, and insoluble-bound
phenolic acids. 3. Composition of phenolic acids in cereal and potato flours. J. Agric.
Food Chem. 30(2): 337-340.

132
Stanyon, P., and Costello, C. 1990. Effects of wheat bran and polydextrose on the sensory
characteristics of biscuits. Cereal Chem. 67(6):545-547.
Steffen, L. M., Jacobs Jr., D. R., Stevens, J., Shahar, E., Carithers, T., and Folsom, A. R.
2003. Associations of whole-grain, refined-grain, and fruit and vegetable consumption
with risks of all-cause mortality and incident coronary artery disease and ischemic stroke:
the Atherosclerosis Risk in Communities (ARIC) Study. Am. J. Clin. Nutr. 78(3): 383-
390.
The New Zealand Institute for Crop & Food Research Limited. 2002. Wheat and milling:
The wheat grain. Available at: http://www.bakeinfo.co.nz/cyberguide/wheat/grain.htm.
Accessed December 7 2008.
Trogh, I., Courtin, C. M., Andersson, A. A. M., Aman, P., Sorensen, J. F., and Delcour, J.
A. 2004. The combined use of hull-less barley flour and xylanase as a strategy for
wheat/hull-less barley flour breads with increased arabinoxylan and (1-->3,1-->4)-[beta]-
D-glucan levels. J. Cereal Sci. 40(3): 257-267.
US FDA. 2008. Health claims that meet significant scientific agreement (SSA).
FDA/Center for Food Safety & Applied Nutrition. Available at:
http://www.cfsan.fda.gov/~dms/lab-ssa.html. Accessed Nov. 17, 2008.
Wattenberg, L. W. 1985. Chemoprevention of cancer. Cancer Res. 451--8.
Welsh, S., Shaw, A., and Davis, C. 1994. Achieving dietary recommendations: whole-
grain foods in the food guide pyramid. Crit. Rev. Food Sci. Nutr. 34(5-6): 441--451.
Wheat: The Big Picture. 2007. Cell layers inside a grain. Available at:
http://www.wheatbp.net/cgi-
bin/grain2.pl?topic=Cell%20layers%20inside%20a%20grain. Accessed December 7
2008.
Whole Grains Council. 2004. Definition of whole grains. Available at:
http://www.wholegrainscouncil.org/whole-grains-101/definition-of-whole-grains.
Accessed 11/16 2008.
Yu, B. H., and Kies, C. 1993. Niacin, thiamin, and pantothenic acid bioavailability to
humans from maize bran as affected by milling and particle size. Plant Foods Hum. Nutr.
(Dordrecht) 43(1): 87-95.
Yuan, X., Wang, J., and Yao, H. 2005a. Antioxidant activity of feruloylated
oligosaccharides from wheat bran. Food Chem. 90(4): 759-764.
Yuan, X., J. Wang and H. Yao. 2006. Production of feruloyl oligosaccharides from wheat
bran insoluble dietary fibre by xylanases from Bacillus subtilis. Food Chem. 95(3): 484-
492.

133
Yuan, X., Wang, J., and Yao, H., and Chen, F. 2005b. Free radical-scavenging capacity
and inhibitory activity on rat erythrocyte hemolysis of feruloyl oligosaccharides from
wheat bran insoluble dietary fiber. LWT - Food Sci. Technol. 38(8): 877-883.
Zhou, K., and Yu, L. 2004. Antioxidant properties of bran extracts from Trego wheat
grown at different locations. J. Agric. Food Chem. 52(5): 1112-1117.