IMPROVING QUALITY ASSURANCE OF MSE WALL … report does not constitute a standard, ... Extensive...
79
Report No. CDOT-2008-11 Final Report IMPROVING QUALITY ASSURANCE OF MSE WALL AND BRIDGE APPROACH EARTHWORK COMPACTION Michael A. Mooney, Christopher S. Nocks, Kristi L. Selden, Geoffrey T. Bee, Christopher T. Senseney October 2008 COLORADO DEPARTMENT OF TRANSPORTATION DTD APPLIED RESEARCH AND INNOVATION BRANCH
Transcript of IMPROVING QUALITY ASSURANCE OF MSE WALL … report does not constitute a standard, ... Extensive...

Report No. CDOT-2008-11 Final Report IMPROVING QUALITY ASSURANCE OF MSE WALL AND BRIDGE APPROACH EARTHWORK COMPACTION Michael A. Mooney, Christopher S. Nocks, Kristi L. Selden, Geoffrey T. Bee, Christopher T. Senseney October 2008 COLORADO DEPARTMENT OF TRANSPORTATION DTD APPLIED RESEARCH AND INNOVATION BRANCH

The contents of this report reflect the views of the
author(s), who is(are) responsible for the facts and
accuracy of the data presented herein. The contents
do not necessarily reflect the official views of the
Colorado Department of Transportation or the
Federal Highway Administration. This report does
not constitute a standard, specification, or regulation.

Technical Report Documentation Page 1. Report No. CDOT-2008-11
2. Government Accession No.
3. Recipient's Catalog No.
5. Report Date
4. Title and Subtitle IMPROVING QUALITY ASSURANCE OF MSE WALL AND BRIDGE APPROACH EARTHWORK COMPACTION 6. Performing Organization Code
7. Author(s) Michael A. Mooney, Christopher S. Nocks, Kristi L. Seldon, Geoffrey T. Bee, Christopher T. Senseney
8. Performing Organization Report No. CDOT-2008-11
10. Work Unit No. (TRAIS)
9. Performing Organization Name and Address Colorado School of Mines 1500 Illinois Street Golden, Colorado 80401
11. Contract or Grant No. 80.24
13. Type of Report and Period Covered
12. Sponsoring Agency Name and Address Colorado Department of Transportation - Research 4201 E. Arkansas Ave. Denver, CO 80222 14. Sponsoring Agency Code
15. Supplementary Notes Prepared in cooperation with the US Department of Transportation, Federal Highway Administration
16. Abstract The objective of the study was to investigate the efficacy of new devices for quality assurance (QA) of Class 1 backfill in MSE wall and bridge approach earthwork compaction. Extensive testing at two construction sites, an MSE wall project near Golden, CO, and multiple MSE wall/bridge approach projects near Wheat Ridge, CO, revealed that the light weight deflectometer (LWD), dynamic cone penetrometer (DCP), and Clegg Hammer are all capable of assessing the compacted state of Class 1 backfill. Field test data also revealed that the current CDOT practice of single position nuclear gauge (NG) testing is inadequate. An evaluation of field data demonstrated that target values (TVs) exist for the LWD modulus (ELWD), Clegg Impact Value (CIV), and DCP penetration index that could serve as surrogates for the current 95% compaction requirement. The DCP exhibited two key limitations: moisture sensitivity and penetration resistance from placed geogrid (MSE walls) and geofabric (bridge approach). Because the LWD and Clegg Hammer do not possess the same limitations, these two devices were deemed most suitable for QA of MSE wall and bridge approach earthwork compaction. Implementation: We recommend CDOT implement a pilot study using the light weight deflectometer and Clegg Hammer in conjunction with nuclear gauge testing with the following objectives: (1) identify ELWD and CIV target values for various soils, site & moisture conditions, seasons, etc.; (2) evaluate if/how target values change with these conditions; (3) populate a database of target values; and (4) allow CDOT inspectors, consultants, and contractors to evaluate the devices.
17. Keywords Class 1 backfill, light weight deflectometers (LWD), Clegg Hammers, dynamic cone penetrometers (DCP), nuclear gauges (NG), QA, mechanically stabilized earth retaining walls
18. Distribution Statement No restrictions. This document is available to the public through the National Technical Information Service Springfield, VA 22161; www.ntis.gov
19. Security Classif. (of this report) Unclassified
20. Security Classif. (of this page) Unclassified
21. No. of Pages 77
22. Price
Form DOT F 1700.7 (8-72) Reproduction of completed page authorized

ii
IMPROVING QUALITY ASSURANCE OF MSE WALL AND BRIDGE APPROACH EARTHWORK
COMPACTION
by
Michael A. Mooney, Ph.D., P.E., Associate Professor Christopher S. Nocks, 1LT, USAF, Former Graduate Student
Kristi L. Selden, Undergraduate Student Geoffrey T. Bee, Undergraduate Student
Christopher T. Senseney, P.E., MAJ, USAF, Graduate Student
Report No CDOT-2008-11
Prepared by Colorado School of Mines Division of Engineering
1500 Illinois Street Golden, Colorado 80401
Sponsored by the Colorado Department of Transportation
In Cooperation with the U.S. Department of Transportation Federal Highway Administration
October 2008
Colorado Department of Transportation DTD Applied Research and Innovation Branch
4201 E. Arkansas Ave. Denver, CO 80222
(303) 757-9506

iii
ACKNOWLEDGEMENTS The authors wish to thank CDOT’s DTD Applied Research and Innovation Branch for funding this study, and the panel including C.K. Su, Dr. H.C. Liu, Mark Vessely, Dr. Trever Wang, Lynn Croswell, Matt Greer, and Dr. Aziz Khan for investing their time to oversee the project. We are extremely grateful to the many CDOT personnel and consultants at project sites that helped during this study. We would particularly like to acknowledge Mr. Martin Herbaugh, Project Manager for the SH40 - I70 project and Mr. Rene Valdez, Project Manager for the SH58 - I70 project, without whose support this project would not have been possible.

iv
EXECUTIVE SUMMARY This report presents the findings from CDOT Study 80.24, Improving Quality Assurance of MSE Wall and Bridge Approach Earthwork Compaction. The objective of the study was to investigate the efficacy of new devices for quality assurance (QA) of Class 1 backfill in MSE wall and bridge approach earthwork compaction. The report documents the preliminary assessment of a number of potential earthwork QA devices, and recommends further investigation through field testing for the dynamic cone penetrometer (DCP), light weight deflectometer (LWD), and Clegg Hammer. Field testing was conducted at two sites – an MSE wall construction project at the intersection of I-70 and State Highway (SH) 40 near Golden, CO, and multiple MSE wall/bridge approach construction projects at the intersection of I-70 and SH58 near Wheat Ridge, CO. DCP, Clegg Hammer, LWD, and nuclear gage (NG) tests were performed on numerous test beds at these sites. Analysis of field data revealed that the current CDOT practice of single position NG testing is inadequate. The uncertainty in single position NG density was found to be equivalent to ± 3-4 percent compaction (%C). The orientation of the device alone (e.g., north, south, east, west) often determined whether passing (> 95 %C) or failing (< 95 %C) density was achieved. Moreover, soil is heterogeneous, and soil density, shear strength and modulus vary spatially. This heterogeneity should be accounted for through a statistically-based QA approach. To better represent the variability in soil density and to minimize uncertainty in reported data, we recommend that CDOT increase the required number of tests per lot (evaluation area). A specific number is not recommended here as it was not the focus of this study; however, an approach similar to that recommended in Section 5.2.3 could be pursued. At an absolute minimum, CDOT could improve the current procedure with no additional time/cost by modifying the current inspection practice from a single position 4 minute reading to a four position NG test (i.e., north, south, east, west) with each position as a 1-minute reading. A revised approach could be investigated within the pilot implementation of new devices as described below. Extensive testing on MSE wall and bridge approach earthwork compaction sites revealed that the LWD, DCP, and Clegg Hammer are all capable of reflecting the compacted state of Class 1 structure backfill soil. ELWD (modulus of elasticity or soil stiffness as measured by LWD in MPa), CIV (Clegg impact value of soil stiffness as measured by Clegg Hammer without units), and DPI (average DCP penetration index as measured in mm/blow) are much more sensitive to changes in compaction than density. While dry density ranged by 20% from typical uncompacted to fully compacted states, ELWD, CIV and DPI were found to vary by 500%, 400% and 1000% respectively. Testing with all devices revealed that adequate compaction is not being achieved within 1 m (3 ft) of MSE wall faces. This is attributed to the compaction procedure where contractors are reluctant to use vibratory rollers within 1 m of the wall. The vibratory plates used in this zone are not providing adequate compactive effort. Inadequate compaction in this zone is exacerbated by the measurement restriction of the NG within 1.6 m (5 ft) of the wall. An evaluation of the data reveals that target values (TVs) exist for ELWD, CIV and DPI that could serve as surrogates for the current 95 %C density requirement. Over multiple sites, test

vi
beds and Class 1 backfill soils, consistent TVs emerged. The observed TVs for ELWD, CIV and DPI were found to be 32.5 MPa, 11.9 and 10.2 mm/blow. Within the scatter of the data, the TVs did not vary across the different Class 1 backfill soils. DPI values appear to be sensitive to moisture while ELWD seem to be insensitive to moisture for these soils tested. The moisture sensitivity of CIV was inconclusive. Moisture sensitivity constitutes a limitation to implementing the TV approach in the absence of NG testing because moisture would need to be measured. Currently, LWD, DCP, and Clegg Hammer devices do not include moisture measurement. The LWD, DCP, and Clegg Hammer are all capable of evaluating soil properties within 0.3 m (1 ft) of the wall face. This is a significant advantage over the 1.5 m (5 ft) wall proximity restriction of the NG particularly in light of the inadequate compaction observed and measured within 1 m (3 ft) of MSE walls. ELWD is most closely aligned with design parameters (e.g., modulus) for pavements, while CIV is an index parameter that is currently not linked to design parameters. The DCP exhibited two key limitations. Because the DCP test involves penetration through the soil, the DPI is influenced by the placed geogrid (MSE walls) and geofabric (bridge approach). In addition, the moisture sensitivity of DPI values requires consideration of moisture in developing TVs and evaluating acceptance. When compared to the LWD and Clegg Hammer results where moisture sensitivity was not clearly observed, DCP implementation requires additional effort. Implementation Statement The LWD and Clegg Hammer are both deemed suitable QA devices for MSE wall and bridge approach Class 1 structure backfill. They were found to be equally effective in capturing the degree of compaction. The Clegg Hammer is less expensive and easier to use than the LWD. Conversely, the LWD produces a modulus that can be tied to design and there is significant momentum nationally towards LWD use. To move towards CDOT-wide formal implementation, we recommend that CDOT implement a pilot study using the LWD and Clegg Hammer in conjunction with NG testing on 5-10 MSE wall and/or bridge approach construction sites. The objectives of the pilot program are multiple: (1) identify ELWD and CIV target values (TVs) for the various soils, site & moisture conditions, seasons, etc., observed in practice; (2) evaluate if/how TVs change with soil type, moisture, season, and from site to site; (3) populate a database of TVs; (4) allow a range of CDOT inspectors, consultants and contractors to evaluate all aspects of the devices, e.g., handling, operation, durability, portability. Details of the recommended pilot implementation procedure are provided in Chapter 5. The pilot implementation will reveal and confirm the efficacy of the LWD and Clegg hammer as a supplement or replacement for the NG in earthwork QA. In addition, the results of the pilot study combined with the findings herein will lead to specific guidelines for TVs, number of required tests, statistical approach to data analysis and acceptance criteria, lot size, etc. A specification can then be written to replace the appropriate sections of the CDOT Bridge Project Special Provisions, the Standard Specifications for Road and Bridge Construction, and the Field Materials Manual.

vi
TABLE OF CONTENTS CHAPTER 1: Introduction 1.1 Introduction....................................................................................................................1 1.2 Current CDOT Practice for QA of MSE Wall and Bridge Approach Earthwork .........2 1.3 Current Approach to CDOT QA: Nuclear Gauge..........................................................3 1.4 Summary of Report........................................................................................................7 CHAPTER 2: Literature Review and Best Practices 2.1 Literature Review of QA Devices..................................................................................9 2.2 Best Practices for QA of MSE Wall, Bridge Approach, or Related Earthwork ..........22 2.3 Phase I Findings and Phase II Field Evaluation Recommendations............................25 CHAPTER 3: Overview of Field Testing and Evaluation of Device Uncertainty 3.1 Test Sites and Procedures ............................................................................................29 3.2 Uncertainty in Device Measurement ...........................................................................34 3.3 Assessment of Local Variability..................................................................................39 3.4 Conclusions..................................................................................................................42 CHAPTER 4: Field Test Results 4.1 Characterization of MSE Wall and Bridge Approach Compaction.............................45 4.2 Identification of Target Values ....................................................................................51 4.3 Conclusions..................................................................................................................59 CHAPTER 5: Conclusions and Recommendations 5.1 Findings........................................................................................................................61 5.2 Recommended Approach for CDOT Adoption and Further Study .............................64 REFERENCES ..............................................................................................................................67

vii
LIST OF FIGURES Figure 1-1. Illustration of Nuclear Gauge Operation.............................. ........................................5 Figure 2-1. DCP Illustration ............................................................................................................9 Figure 2-2. Manual, Automated Data Acquisition, and Fully Automated DCPs ..........................10 Figure 2-3. Clegg Hammer Models ...............................................................................................11 Figure 2-4. Acceptance Criteria for Clegg Hammer......................................................................14 Figure 2-5. Geogauge Photo ..........................................................................................................14 Figure 2-6. TDR Device Photo ......................................................................................................16 Figure 2-7. Dynatest 3031 LWD (left) and Zorn ZFG 2000 LWD (right) ....................................17 Figure 2-8. Dirt Seismic Pavement Analyzer (DSPA) from Geomedia R&D Services................19 Figure 2-9. Seismic Surface Wave Testing Using One Receiver and One Source........................20 Figure 3-1. SH40 – I70 Hogback MSE Wall.................................................................................29 Figure 3-2. SH58 – I70 MSE Wall (Parallel to SH58) ..................................................................29 Figure 3-3. DCP and Clegg Impact Hammer Operation................................................................30 Figure 3-4. Seating the LWD Plate and Administering a NG Test ...............................................30 Figure 3-5. Typical Layout Adopted for Single Location Testing ................................................31 Figure 3-6. NG Repeatability Data in Density and Moisture ........................................................35 Figure 3-7. Repeatability Tests Conducted on Varying Soils........................................................36 Figure 3-8. In-Place Test Results for Clegg Hammer....................................................................37 Figure 3-9. Precision Corresponding to Measurement Value........................................................38 Figure 3-10. Comparison of Measurement Volumes of QA Devices............................................39 Figure 3-11. NG Testing Pattern for Local Variability..................................................................40 Figure 3-12. 4-Position and Average Density and Moisture at 12 Locations (Points) ..................41 Figure 3-13. Variability in Density and Moisture Determined by 4-Position NG Test.................41 Figure 3-14. Precision Uncertainty for Each Device on Various Test Beds .................................42 Figure 4-1. Offset X for MSE Wall and Bridge Approach Testing...............................................45 Figure 4-2. MSE Wall Soil Characteristics as Determined by all Devices ...................................46 Figure 4-3. DPI Profiles at Varying Distances from Wall.............................................................47 Figure 4-4. Data from Test Beds 1, 3, 4.........................................................................................48 Figure 4-5. Test Bed 30 – CIV and DCP Data ..............................................................................49 Figure 4-6. Near Wall Compaction Techniques ............................................................................50 Figure 4-7. ( ) LWDESEˆ −−μ vs. %C ..................................................................................................53 Figure 4-8. Average Moisture Content vs. ( ) LWDESEˆ −−μ ..............................................................54 Figure 4-9. ( )CIVSEˆ −μ vs. %C.......................................................................................................55 Figure 4-10. Average Moisture Content vs. ( )CIVSEˆ −μ ................................................................56 Figure 4-11. ( )DPISEˆ −μ vs. Percent Compaction ..........................................................................58 Figure 4-12. Average Moisture Content vs. ( )DPISEˆ −μ ................................................................58 Figure 5-1. Recommended Test Lot for Pilot Study......................................................................65

viii
LIST OF TABLES
Table 2-A. Potential Devices and Soil Properties............................................................................9 Table 2-B. Available Clegg Hammer Packages ............................................................................12 Table 2-C. Summary of Non-nuclear Devices Being Used or Studied by Various States ............13 Table 2-D. Mn/DOT DCP Penetration Requirements ...................................................................22 Table 2-E. Mn/DOT Predicted Zorn LWD Deflection and Modulus Values................................24 Table 2-F. ISSMGE Zorn LWD Modulus Required Values .........................................................25 Table 2-G. DCP Strengths and Limitations ...................................................................................26 Table 2-H. Clegg Hammer Strengths and Limitations ..................................................................26 Table 2-I. GeoGauge Strengths and Limitations ...........................................................................27 Table 2-J. LWD Strengths and Limitations ...................................................................................28 Table 2-K. Surface Wave Testing Strengths and Limitations .......................................................28 Table 3-A. Summary of Modified Proctor Compaction Results ...................................................31 Table 3-B. Summary of 30 Test Beds............................................................................................32 Table 3-C. Data Summary of Figure 3-6 .......................................................................................36 Table 3-D. Uncertainty in CIV ......................................................................................................37 Table 3-E. 95% Confidence Interval for Precision of Each Device ..............................................38 Table 4-A. LWD Data Summary ...................................................................................................52 Table 4-B. Clegg Hammer Data Summary....................................................................................55 Table 4-C. DCP Data Summary.....................................................................................................57 Table 5-A. Summary of Device Capabilities.................................................................................63 Table 5-B. On-site Testing Protocol of Pilot Study.......................................................................65

1
CHAPTER 1: OVERVIEW
1.1 Introduction Proper earthwork compaction is a critically important factor for satisfactory performance of
highways, bridges and mechanically stabilized earth walls. Inadequate compaction of soils and
aggregates leads to bridge approach settlement and poor performance of mechanically stabilized
earth walls (lateral movement, settlement). CDOT is acutely aware of the importance of
earthwork preparation. Many mechanically stabilized earth walls (MSE) and bridge approach
failures in Colorado can be attributed to lack of adequate and uniform compaction. Current
CDOT earthwork quality assurance (QA) exclusively involves nuclear gage (NG) density testing.
NG testing has limitations. The NG is a 10-15 minute test, and therefore, inspection is performed
infrequently at discrete locations. As a result, the vast majority of the earth structure remains
untested. The NG can not be used within 5 feet of an MSE or abutment wall due to obstruction-
induced false readings, thus leaving this critical area untested. The NG is inaccurate when large
size particles are present. Finally, regulatory constraints of using a nuclear based device make
operating and maintaining the NG burdensome and costly.
A number of new and proven devices, e.g., the light weight deflectometer (LWD), Clegg Impact
Hammer and the dynamic cone penetrometer (DCP), are capable of more rapid inspection of
materials with large size aggregates to depths of 24 inches or more (for DCP). A positive
evaluation of these devices would enable CDOT to adopt improved QA techniques for MSE wall
and bridge approach QA. The objectives of this study were to:
I. Identify the most appropriate device(s) and the appropriate methodology for QA of
compacted Class 1 structure backfill material in bridge approach and MSE wall projects.
II. Outline the steps to adopt the new devices and methodologies in CDOT QA in two stages:
• Short-Term: One or more of the new devices could initially be adopted to supplement NG
testing. This will allow the continued use of the NG in concert with these devices.
• Long-Term: As CDOT personnel become more comfortable with the methods, NG
testing could be phased out over a number of years.

2
1.2 Current CDOT Practice for QA of MSE Wall and Bridge Approach Earthwork MSE wall design and construction for CDOT projects are governed primarily by Section 504 of
the Bridge Project Special Provisions (last revised in 2002). Subsection 504(b) of the Material
section states that backfill materials for MSE walls shall conform to the Structure Backfill (Class
1) requirements defined by Section 703.08 of the 2005 Standard Specifications for Road and
Bridge Construction. Section 703.08 defines Structure Backfill (Class 1) as follows:
703.08 Structure Backfill Material (a) Class 1 structure backfill shall meet the following gradation requirements
Sieve Size Mass Percent Passing
Square Mesh Sieves
50 mm (2 inch) 100 4.75 mm (No. 4) 30-100 300 μm (No. 50) 10-60 75 μm (No. 200) 5-20
In addition this material shall have a liquid limit of 35 or less and a plasticity index of 6 or less when determined in conformity with AASHTO T 89 and T 90 respectively.
In certain cases in mountainous areas, CDOT allows a maximum particle size of 4 inches to be
used in structural backfill for MSE walls (Trevor Wang, personal communication, 2006).
The Construction Requirements section, specifically subsection 504(e) Excavation and Backfill,
requires that MSE wall backfill material be compacted to a density of at least 95% of the
maximum modified Proctor density determined in accordance with AASHTO T-180. There are
no specified moisture requirements for Class 1 structural backfill. Subsection 504(e) also states
that compacted lifts shall not exceed 8 inches in thickness.
Bridge approach earthwork design and construction is governed by Section 206 of CDOT’s 2005
Standard Specifications for Road and Bridge Construction. Like MSE wall material, bridge
approach material must conform to the Class 1 structure backfill requirements of 703.08, and
must be compacted to a density of at least 95% of the maximum modified Proctor density

3
determined via AASHTO T-180. There are no moisture specifications. Test frequency for both
MSE wall and bridge approach earthwork is addressed in the CDOT 2007 Field Materials
Manual, Item 203, Compaction. Under the Field Tests subsection of Item 203, it states that a
minimum of one density test be taken for each 2,000 cubic yards of embankment material
placed.
1.3 Current Approach to CDOT QA: Nuclear Gauge While four approved field testing methods are listed in Item 203 of the CDOT 2007 Field
Materials Manual for confirming the compacted density of embankment material, CP 80 (nuclear
method) is the approach that is used almost exclusively on CDOT projects. This method uses the
NG to determine the compacted dry density and moisture content of the emplaced material. A
recent survey of other State Departments of Transportation showed that all but one state,
Minnesota, are using the NG almost exclusively for this purpose. This device, however, has
limitations when used in this capacity. Before discussing the limitations that research and
experience have identified, it would be beneficial to briefly review the principle of operation for
this device.
The NG measures density using a gamma ray emitter and receiver (see Figure 1-1). The emitter,
or source rod, sends out photons that interact with the soil mass; the receiver counts the number
of photons returned. The theory behind this process is that a high density soil will contain a
higher number of electrons for the photons to interact with and thus a lower number of photons
will be returned to the receiver. Therefore there is an inverse relationship between the density of
the soil and the returned photon count rate. Most commercial devices are capable of operating in
two modes: direct transmission and backscatter. The direct transmission mode involves inserting
the gamma ray source rod into the soil to depths of 2 to 12 inches in 1 or 2 inch intervals. This
method requires up to 4 minutes of gauge processing time, but returns accurate density results
(+/- 0.11 pcf) (Troxler, 2006). Independent testing by Ayers and Bowen (1988), using more
dated devices, showed that gauge accuracy in direct transmission mode was around (+/- 0.80
pcf). The backscatter method uses the same device, but is a non-intrusive, surface method.
Instead of inserting the rod into the material (typically asphalt or concrete), the gauge is placed

4
on the ground surface and gamma rays are emitted and collected. The backscatter method is
slightly less accurate (+/- 0.25 pcf) and only characterizes density to a depth of approximately 4
inches (Troxler, 2006).
Most NGs also measure moisture content using a neutron emission device (see Figure 1) in a
manner similar to the backscatter method discussed above. To estimate moisture content, the
device uses a different radioactive source that emits fast neutrons. These fast neutrons interact
with hydrogen atoms, which slow their velocities, and the slowed neutrons are then returned to a
receiver in the device only capable of counting these slowed neutrons. The device counts the
number of slow neutrons received back, and then estimates the number of hydrogen atoms that
the radiation interacted with. Since hydrogen atoms are present both in the minerals that make up
the soil, as well as the water entrained in the soil, it is necessary to conduct calibration
procedures to determine what ratio of the hydrogen atoms that the neutrons interacted with are
attributed to the water content, as opposed to the mineral composition of the soil. Once
calibrated, the device automatically calculates and returns the estimated moisture content that is
accurate to ±2.1% (Troxler, 2006).
The depth to which the NG estimates moisture content ranges from about 4 to 8 inches. This
depth is dependent on complex relationships with soil composition, degree of saturation, and
other site conditions. Typically density and moisture content measurements are conducted
simultaneously by the device. It should be noted, however, that in direct transmission mode with
full insertion of the source rod, density is characterized to a depth of 12 inches, whereas moisture
content may only be estimated for the top 4 inches of soil. Due to the way in which this device
operates, there are certain inherent limitations that trouble QC inspectors with respect to the
monitoring of compaction for MSE wall and bridge approach backfills.
• Limited depth of measurement – the NG is capable of estimating material densities and
moisture contents to depths of 4 to 8 inches. For density, this depth is controlled by the
depth in which the source rod is inserted into the soil, and most devices only have an 8
inch source rod.

5
`
Figure 1-1. Illustration of Nuclear Gauge Operation (from Troxler, 2006)
Backscatter is rapid and nondestructive. The gamma source and detectors remain inside the gauge which rests on the surface of the test material. Gamma rays enter the test material and those scattered through the material and reaching the detectors are counted. Backscatter is primarily used to determine density on layers of asphalt and concrete approximately 4 inches thick
The gamma source is positioned at a specific depth within the test material by insertion into an access hole. Gamma rays are transmitted through the test material to detectors located within the gauge. The average density between the gamma source and the detectors is then determined. Errors resulting from surface roughness and chemical composition of the test material are greatly reduced, and gauge accuracy is improved. Direct transmission is used for testing lifts of soil, aggregate, asphalt, and concrete up to 12 inches in depth.
Direct Transmission
Detectors
Photon Paths Source
Detectors
Photon Paths Source
Source
Moisture Detection
Detector
Backscatter
The moisture measurement is nondestructive with the neutron source and detector located inside the gauge just above the surface of the test material. Fast neutrons enter the test material and are slowed after colliding with the hydrogen atoms present. The helium3 detector in the gauge counts the number of thermalized (slowed) neutrons, which relates directly to the amount of moisture in the sample.

6
• Burdensome handling and operating costs - a NG requires stringent handling
procedures and safeguards. NGs must be secured in locked cases when not in use.
Individual users must also undergo DOT training on the transport of hazardous material
every three years. In Colorado, NG licensing is required by the Colorado Department of
Public Health and Environment, Hazardous Materials and Waste Management Division.
Companies that operate NGs must license each facility from which they operate these
devices. At the time of this writing, licensing fees in Colorado include an initial
application fee of $1300 and an annual fee of $1850. These licenses only permit the use of
NGs in areas under the jurisdiction of the State of Colorado, meaning that users need to
obtain further licenses to operate in other states or on federal lands. NG operators who
hold licenses in other states must pay an annual reciprocity fee to operate their gauges in
Colorado (i.e., 75% of the annual fee = $1400). These costs are passed on to CDOT.
• Inaccuracy while measuring density near walls – walls present a unique challenge to
estimating compacted density with a NG. When the NG emits photons, the photons
typically interact with electrons in the soil and a certain number are then returned to the
receiver. Nearby walls, however, tend to reflect a significant number of photons back to
the receiver, and produces an artificially higher returned photon count rate, which the
device interprets as a lower soil density. To the authors’ knowledge, the detailed
relationship between under-registration of density, distance from the wall, and soil type
has not been investigated. However, Humboldt suggests taking density readings no closer
than 5 feet from a wall. In MSE wall and bridge approach construction, this leaves a vital
portion of the wall system left untested.
• Coarse aggregate – Class 1 structure backfill can contain aggregates as large as 2 inches,
and even as large as 4 inches in certain cases. To create a void that allows the radioactive
source rod to be inserted into the soil, a rod is driven into the ground and then removed
leaving behind a cylindrical void in which the source rod can be placed. Should this drive
rod, which is typically driven with a moderately sized hammer, encounter a large
aggregate, it will undoubtedly displace the aggregate in some manner and create an
additional void space. When the source rod is then placed in the soil, it is unable to obtain

7
an intimate contact with the soil due to the void spaces created by the displacing of
aggregate, resulting in inaccurate density measurements.
• Density is not necessarily indicative of performance – the objective of MSE wall and
bridge approach earthwork compaction is to achieve suitable levels of shear strength and
stiffness in the soil and to minimize compressibility. While density is somewhat
proportional to soil strength and stiffness and inversely proportional to compressibility,
density is only a surrogate for these engineering properties. A more direct measurement of
shear strength (e.g. friction angle) and stiffness (e.g. resilient modulus) would enable the
use of performance based QC/QA specifications. In this regard, density measurement and
thus the nuclear density gauge are somewhat limited.
In summary, the NG is capable of estimating densities of uniform materials under favorable site
conditions. With a required offset of 5 feet near a wall, use limitations due to particle size, and
noted user costs and handling issues, the NG has limitations as a QA device for MSE wall and
bridge approach earthwork. In addition, material density is not analogous to or indicative of soil
stiffness or shear strength, both of which are integral engineering properties.
1.4 Summary of Report This report contains five chapters. Chapter 2 presents a literature review of QA devices and best
practices for QA of MSE wall, bridge approach and other related earthwork. Chapter 2 also
summarizes the preliminary evaluation of many potential QA devices, and the recommendations
for follow-up field testing. Chapter 3 presents the field testing overview and fundamental
analysis of NG density and moisture testing, as well as LWD, DCP, and Clegg devices. Chapter
4 presents field assessment of CDOT’s MSE and bridge approach earthwork QA procedures, and
the analysis of target values for the various devices. Chapter 5 presents conclusions and
recommendations for CDOT.

8
9
CHAPTER 2 LITERATURE REVIEW AND BEST PRACTICES
2.1 Literature Review of QA Devices From the start, a broad approach was taken to gain a general understanding of what earthwork
QA devices were available, how each device operates, and what level of performance would be
expected when used. Table 2-A summarizes candidate devices that meet the requirements of this
study. Capability overviews of each device, developed from an extensive literature review, are
presented in Section 2.1. Best practices of these devices are presented in Section 2.2. A summary
of Phase I findings and recommendations for Phase II field evaluations are presented in Section
2.3.
Table 2-A. Potential Devices and Soil Properties Measured Device Soil Property Measured
Dynamic Cone Penetrometer (DCP) Shear Strength Clegg Hammer Shear Strength, Modulus
Soil Stiffness Gauge (aka GeoGauge) Low Strain Modulus Time Domain Reflectometry (TDR) Density, Moisture Light Weight Deflectometer (LWD) Modulus
Dirt Seismic Property Analyzer (DSPA) Low Strain Modulus
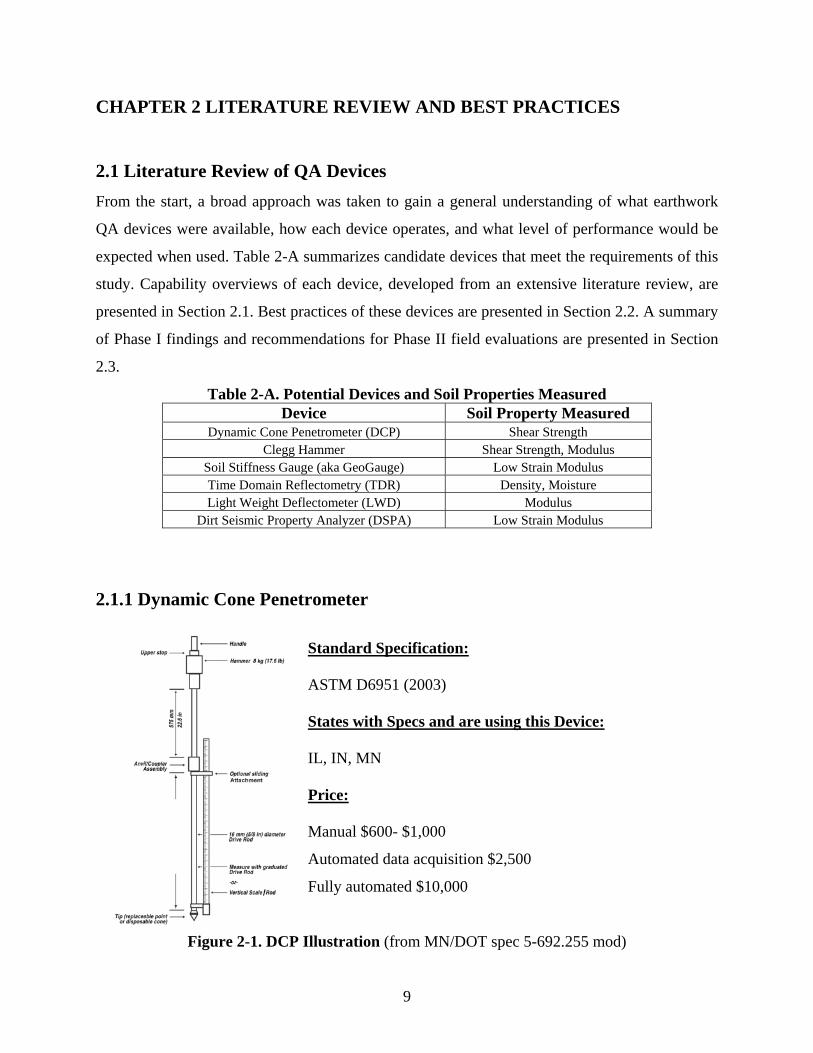
2.1.1 Dynamic Cone Penetrometer Standard Specification: ASTM D6951 (2003) States with Specs and are using this Device: IL, IN, MN Price: Manual $600- $1,000
Automated data acquisition $2,500
Fully automated $10,000
Figure 2-1. DCP Illustration (from MN/DOT spec 5-692.255 mod)

10
Figure 2-2. Manual, Automated Data Acquisition, and Fully Automated DCPs (right two photographs from Vertek, 2006)
The standard DCP is comprised of a 16mm diameter drive rod that can be as long as 1.2 m, an 8
kg drop (hammer) mass, and a 60º cone located at the tip of the drive rod with a diameter of 20
mm (see Figure 2-1). The DCP works by holding the device perpendicular to the soil surface and
dropping the 8 kg mass from a pre-specified height of 575 mm on top of the anvil. The impact
causes the probe cone to penetrate into the soil. The depth of penetration per hammer blow is
recorded. A Dynamic Penetration Index (DPI) is developed in units of mm/blow and is recorded
versus depth. This process is repeated at a test location and creates a profile of DPI values to
depths of up to 1.2 m, allowing the DCP test to profile multiple layers at a test site. Based on
these results, different subsurface strata and pockets of loose material can be identified. Many
correlations have been developed to relate the average DPI over a defined depth (hereafter
referred to as DPI ) to more universally accepted engineering parameters such as California
Bearing Ratio (CBR), resilient modulus, and friction angle.
Of the devices researched for this report, the DCP has the most extensive and documented track
record. However, little success has been achieved linking DPI to dry unit weight of a given
material. Salgado and Yoon (2003) found that a general relationship does exist, as the dry unit
weight increases, the DPI decreases. Unfortunately, they were not able to develop a numerical
relationship, a setback cited in much of the literature. Instead of adopting density or stiffness
based DCP correlations, Mn/DOT has adopted specifications that require a maximum allowable
Manual Automated Data Acquisition
Fully Automated

11
DPI for a variety of soil materials. This eliminates the uncertainties involved with trying to
correlate DPI measurements to density and stiffness values and allows for easy “in-the-field”
determination of whether or not a material meets the specification requirements. Multiple reports
stated that DCP testing is sensitive to soil moisture conditions, and Salgado and Yoon (2003)
showed that the DPI for a given material slightly increases with increasing moisture content.
Mn/DOT has taken this into account and adjusted DPI target values based on moisture content.
Mn/DOT’s procedures for using the DCP are summarized in Section 2.2.
Salgado and Yoon (2003) noted that soils containing gravel can cause the DCP to produce
unrealistic DPI measurements, likely the cause of the DCP coming in contact with a large
aggregate. This causes some concern with using the DCP as a QA device on MSE wall and
bridge approach earthwork, especially when particle sizes approaching 4 inches are permitted.
2.1.2 Clegg Impact Tester Standard Specification:
ASTM D 5874 (2002)
States Using Device:
None States Reviewing Device: IN, NM Price:
$3,000 - $3,500
Figure 2-3. Clegg Hammer Models (Lafayette, 2006) The Clegg Impact Soil Tester, commonly referred to as the Clegg Hammer, is a device that uses
a standard weight, or hammer, that is dropped from a height of 18 inches. The primary
components of this device are a flat-ended cylindrical hammer and a guide tube, through which
the mass is dropped. In the U.S., the Clegg Hammer is produced and marketed by Lafayette

12
Instruments in Lafayette, Indiana. Hammer masses of 0.5 kg, 2.25 kg, 4.5 kg, 10 kg and 20 kg
are available for different applications of the device (see Figure 2-3). As shown in Table 2-B,
only the 4.5 kg, 10 kg, and 20 kg Clegg Hammers are intended for use with structural earthwork
compaction.
Table 2-B. Available Clegg Hammer Packages (from Lafayette, 2006)
Hammer Mass (kg)
Hammer Diameter
(mm) Recommended
Applications
0.5 50 Soft turf, sand, golf greens
2.25 50 Natural or synthetic turf (athletic fields)
4.5 50 Pre-constructed soils, trench
reinstatement, bell holes, foundations
10 130
20 130
Flexible pavement, aggregate road beds, trench
reinstatement, bell holes, foundations
The measurement element of the Clegg Hammer is an accelerometer attached to the top of the
hammer that measures deceleration upon impact with the soil. The device electronically reports a
Clegg Impact Value (CIV), which is the peak deceleration value measured in tens of gravities.
ASTM D5874 requires that four consecutive drops be carried out at the same location, and that
the value returned from the peak drop be reported as the measured CIV. In the past, the 4.5 kg
Clegg Hammer has been calibrated for a site using Proctor compacted samples at optimal density
and moisture content. By using the Clegg Hammer on these samples, a target CIV is established
and can be used in the field to ensure proper compaction. This approach is not possible with
larger 10 or 20 kg models. Assuming that elastic plate bearing theory applies to the Clegg
Hammer operation, this device is capable of investigating compaction to a depth of 1 to 1.5
hammer diameters, or up to 26 cm (10 inches) for the 10 and 20 kg hammers (Mooney and
Miller 2008). Optional accessories to this device also allow for integrated GPS locating, moisture
testing, and data collection and storage.

13
Unlike the DCP, the Clegg Hammer has not been extensively studied and reported on in
literature. The results of the survey of State Departments of Transportation show that no states
are currently using the device. New Mexico and Indiana are actively studying the device but
have not conducted enough tests to draw any conclusions. A report prepared by the Gas
Technology Institute (GTI, 2004) investigated the Clegg Hammer and other QC/QA devices to
evaluate its usefulness in monitoring backfill compaction in utility trenches. This report
developed no correlations for this device, but did make a few important qualitative observations.
GTI (2004) found that in weak materials the CIV is more a measure of shear strength, whereas in
stronger materials the CIV is more a measure of stiffness. They also found that CIV readings
increase with increasing moisture content to a maximum value (wetter than optimum) and then
decrease at higher moisture contents. Soils tested included silty clay, sand, and gravel base. GTI
(2004) found that the Clegg Hammer produced results that were independent of factors related to
the operator. Adams (2004) criticized the Clegg Hammer’s inability to track changes in density
and moisture content, a criticism common among devices that measure soil strength and
stiffness. Erchul and Meade (1994) developed acceptance criteria for the Clegg Hammer for use
in QA of utility trench backfill compaction in Chesterfield County, Virginia. Using the Clegg
Hammer on four different soil materials common to the area, Erchul and Meade (1994) noted
that for soils returning similar CIVs, the depth to which the impact hammer penetrated the soil
was often quite different. In order to track the depth of penetration for each test, Erchul and
Meade (1994) added a penetration scale, in units of tenths of an inch, to the handle of the Clegg
Hammer. Following the fourth drop of the hammer, the depth of penetration was recorded. In
comparing the CIV and penetration data with density and moisture data collected using the
nuclear density gauge, Erchul and Meade developed graphical acceptance criteria for soils
encountered in Chesterfield County (see Figure 2-4).

14
Figure 2-4. Acceptance Criteria for Clegg Hammer (from Erchul and Meade, 1994)
2.1.3 GeoGauge (or Soil Stiffness Gauge)
Standard Specification:
ASTM D6758 (2002) States using device: None
States Reviewing Device:
FL, ID, IL, MD, MI, MT, NM, NC, WY States that Previously Studied Device: GA, KS, LA, MD, MN, MS, NH, NJ, NY, OK, OR, PA, TX, WA, WV
Price:
$5,000 - $5,500
Figure 2-5. GeoGauge Photo (from Humboldt, 2006)
Clegg Impact Value (CIV)
Pene
tratio
n (0
.1 in
ch u
nits
)

15
The Soil Stiffness Gauge (SSG), also referred to as the Humboldt Stiffness Gauge (HSG) or
GeoGaugeTM, measures in-place stiffness of soil, a mechanical property (Lenke et al., 2001),
which can translated to modulus using elastic half-space theory. One of the most concerning
findings discovered while researching this device is the number of states that have studied the
GeoGauge and concluded that it failed to satisfactorily meet their requirements. A survey
conducted of State Departments of Transportation showed that 15 states were unhappy with the
results produced by the GeoGauge. At the time of this writing, no states have adopted the
GeoGauge for use in any specification. A complaint nearly universally voiced by states who
have studied the device is that the GeoGauge results are extremely inconsistent and no
correlation to other forms of testing could be developed. The cause of these inconsistencies,
which was not speculated on in the survey, could be rooted in either operator-induced error or
inherent shortcomings of the device. However, the fact that so many states have reported
negative findings for the GeoGauge causes much doubt in its prospect as a QA device. While
investigating the device for New Mexico State Highway and Transportation Department, Lenke
et al. (2001) noted that while the GeoGauge showed promise as an earthwork QA device,
developing specifications using lab-derived target values was difficult. Boundary effects
apparent while using the GeoGauge on common lab-sized compaction molds produced unusable
data. Lenke et al. (2001) suggested that a shift from lab-derived target values to target values
established during construction of control strips would be required to incorporate this device into
QA specifications. Lenke et al. (2001) reported that the GeoGauge was sensitive to moisture
content, and than the optimum moisture content based on stiffness readings did not coincide with
the optimum moisture content obtained from lab density tests. As a result of these complications,
New Mexico decided against implementing the GeoGauge as a QA device.

16
2.1.4 Time Domain Reflectometry
Standard Specification: ASTM D6780 (2005)
States Using Device:
None States Reviewing Device:
FL, MN, NJ, NC States that Previously Studied Device: IN Price:
$3,000 - $5,000
Figure 2-6. TDR Device Photo (from Durham, 2006) Time domain reflectometry is a method that uses electromagnetic wave propagation to estimate
moisture content and dry density. Many commercial TDR devices exist on the market, and each
is slightly different in terms of components and geometry. Overall, all devices consist of multiple
metal probes connected to a single voltage source. Typical rod lengths are about 8 inches and
common rod configurations involve 3 rods in a triangular configuration. The rod spacing is only
2.5 inches; therefore, this presents a problem for large particle sizes. The probes are inserted into
the soil and voltage pulses are sent down, the time required for the pulse to travel from the
voltage source to the end of the probe and back is measured. This travel time is principally
dictated by the moisture content of the soil. Therefore the TDR device is capable of directly
measuring the volumetric water content and the apparent dielectric constant for the soil.
Procedures do exist, however, to calculate the dry density and gravimetric water content. Depth
of investigation for this device is dictated by the length of the rods with typical rod lengths
around 8 inches for commercially available devices. Siddiqui and Drnevich (1995) established a
method that uses field calibration of site soils to determine gravimetric water content and dry
density. After extensive laboratory and field testing showed that this method returned sufficiently
accurate results, it was accepted by ASTM and designated ASTM D6780 in 2003. The authors
cautioned that the TDR method of determining density and water content is only applicable to
soils where less than 30% of the sample by weight has particle sizes the exceeding 4.75 mm (No.

17
4) sieve and the maximum particle size passes the 19 mm (3/4 in) sieve. The method cannot be
used on fat clays or soils with high moisture contents due to the fact that no significant secondary
reflections of the voltage pulses can be observed, which does not allow for an apparent dielectric
constant to be calculated.
2.1.5 Light Weight Deflectometer (LWD)
Standard Specification:
ASTM E2583 - 07
States Using Device:
MN States Evaluating Device:
IN, KS, MN (other uses), MO, MS Price:
$8,000 - $15,000
Figure 2-7. Dynatest 3031 LWD (left) and Zorn ZFG 2000 LWD (right)
The Light Weight Deflectometer (LWD) was developed to measure the in-situ elastic modulus of
soils. A typical LWD weighs approximately 15 to 25 kg, can be operated by 1 person, and
requires approximately 2 minutes per test. There are currently three LWDs commercially
available in the U.S.: the Dynatest 3031 LWD, Zorn ZFG 2000 and the Carl Bro PRIMA 100.
The concept of each device is simple; an impulse load is imparted via drop weight onto a load
plate and into the soil. That load is either measured (in the case of the Dynatest) or assumed
constant based upon the drop height, loading weight, and damper (in the case of the Zorn). The
Dynatest imparts an impulse load with an approximate magnitude and duration of 9.8 kN and 20
ms (Hoffmann et al. 2003). According to German specifications, the Zorn LWD imparts an
impulse load not to exceed 7.07 kN with duration of 18 ± 2 ms (Adam et al. 2004). The impulse
magnitude and duration are meant to approximately replicate a traffic and/or construction load
(Fleming et al. 2007).

18
During the LWD test, when the drop weight impacts the housing and plate, the response of the
plate or ground surface is measured with a geophone (Dynatest) or an accelerometer (Zorn). The
output from the geophone or accelerometer is used to determine the displacement time history of
the ground surface via numerical integration. The maximum applied force and maximum
displacement are determined and used to estimate soil modulus (ELWD). Per ASTM E2583, three
seating drops of the hammer are followed by three measurement drops. ELWD reflects the average
values from the measurement drops.
In current practice, modulus is typically estimated via rigid or flexible plate on elastic half-space
theory (Adam et al. 2004, Hoffmann et al. 2003). Both LWDs offer multiple loading plate
diameters (typically 100 mm, 200 mm, and 300 mm). The most common plate diameter is 300
mm. However, the plate diameter can be reduced to ensure the deflection values can be
accurately measured; deflections too small or too large may introduce unwanted errors (Lin et al.
2006). Many research studies have been conducted on the LWD. Good agreement has been
shown between moduli measured by several LWDs and modulus values from other in-situ tests
(Fleming et al. 2007, Siekmeier et al. 2000, Abu-Farsakh et al. 2004). The LWD has been
recommend as a good in-situ testing device by multiple researchers (White et al. 2004, Kremer &
Dai 2004, Abu-Farsakh et al. 2004). The LWD also provides rapid assessment of layer stiffness
and identification of localized weak spots (Lin et al. 2006). The measurement depth of the
Dynatest LWD with a 200 mm diameter loading plate has been estimated to be 270-280 mm
deep (Abu-Farsakh et al. 2004). Mooney and Miller (2008) and Fleming et al. (2007) estimate
the measurement depth to be 1-1.5 times the plate diameter, thus extending to 450 mm deep for
the 300 mm diameter LWD plate and 300 mm for the 200 mm LWD plate.
No known studies have been performed on the use of the LWD during MSE wall construction;
however, multiple studies have been successfully conducted on LWD use on coarse base
aggregate (Von Quintas et al. 2005, Kremer & Dai 2004, White et al. 2004, Lin et al. 2006).
While LWD modulus estimates on coarse gravel produced higher standard deviations than other
soils, they were deemed to be within an acceptable level and likely due to uneven contact surface
and heterogeneity of the soil (Lin et al. 2006). There are no protruding or penetrating aspects of

19
the LWD, therefore, there should be no interference created by large particle sizes. There have
been no investigations into the influence of a rigid wall on LWD results. Using the common 2:1
stress distribution with depth rule of thumb, the LWD should be able to operate within 200 mm
of a wall without influencing the results. Moisture content can influence modulus reading. As
moisture content increases, modulus generally decreases. Mn/DOT incorporated this relationship
into their LWD pilot specification as displayed in Table 2-E.
2.1.6 Surface Seismic Testing Standard Specification:
TxDOT (pending) States using device: None States Reviewing Device:
FL, TX
Price: $30,000, includes Toughbook laptop computer
Figure 2-8. Dirt Seismic Pavement Analyzer (DSPA) from Geomedia Research &
Development Services Surface waves are stress waves traveling along the free surface of a material, similar to waves
propagating on the surface of water. In soils, the velocity of these surface waves is mainly
dependent on the skeleton stiffness of the particles (modulus), the porosity or dry density, and
the degree of water saturation. Specifically, surface wave velocity increases as soil modulus
increases. Since soil compaction involves the increase in dry density and soil modulus as
moisture remains constant (in theory), surface wave velocity measurement is a good technique to
assess compaction. Surface seismic methods rely on one or several receivers (typically
accelerometers or geophones) arranged at known distances from each other on the surface and an
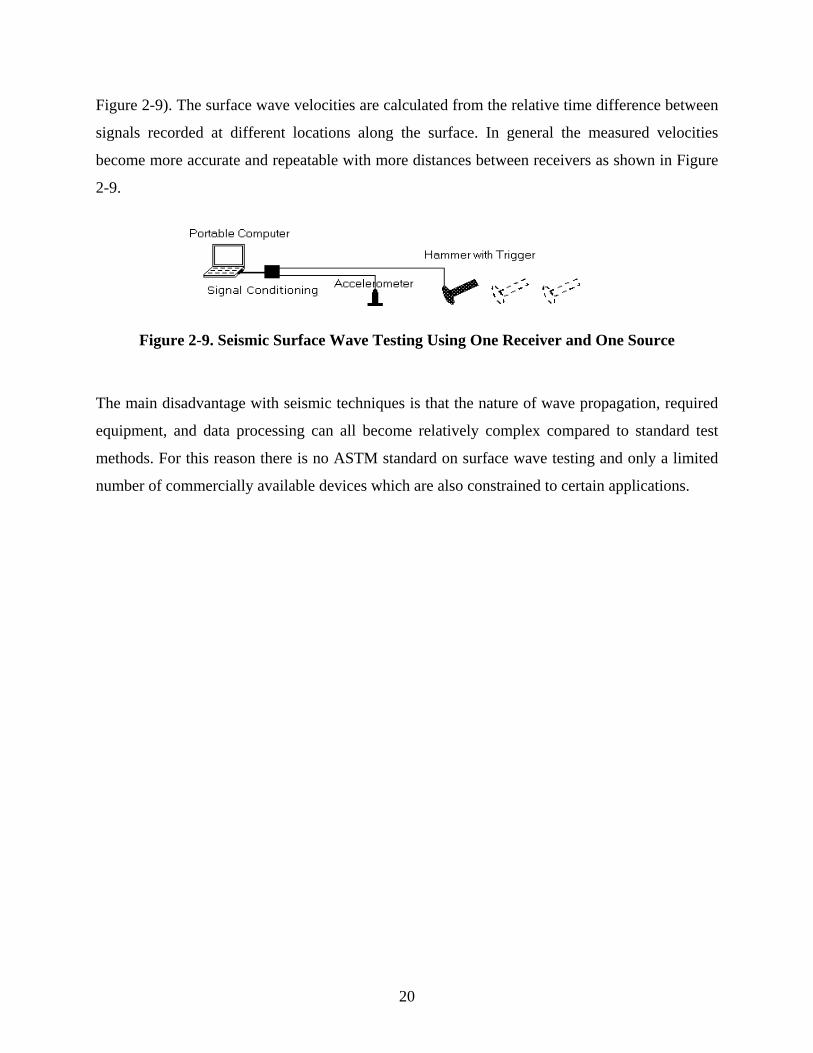
impulse or vibrating source that generates seismic waves at one or several locations. Figure 2-8
illustrates the DSPA (Geomedia Research & Development) that uses two accelerometers and one
impulse source. Conversely, one can use an instrumented hammer and one other receiver (see
20
Figure 2-9). The surface wave velocities are calculated from the relative time difference between
signals recorded at different locations along the surface. In general the measured velocities
become more accurate and repeatable with more distances between receivers as shown in Figure
2-9.
Figure 2-9. Seismic Surface Wave Testing Using One Receiver and One Source
The main disadvantage with seismic techniques is that the nature of wave propagation, required
equipment, and data processing can all become relatively complex compared to standard test
methods. For this reason there is no ASTM standard on surface wave testing and only a limited
number of commercially available devices which are also constrained to certain applications.

21
2.2 Best Practices for QA of MSEW, Bridge Approach, or Related Earthwork The vast majority of states are still almost exclusively using the NG for QA of earthwork
compaction. Minnesota is the only state not using the nuclear density gauge, and has taken a very
progressive stance on implementing cutting edge devices for earthwork QA. Two other states,
Indiana and Illinois, have adopted new technologies but are still relying heavily on the NG for
QA testing. Many states are reviewing or have reviewed a variety of devices, but have yet to
incorporate these devices into standard practice. Table 2-C summarizes what devices are being or
have been studied by different states, and which of these devices have been adopted into
practice.
Table 2-C. Summary of Non-nuclear Devices Being Used or Studied by Various States
Devices
LWD DCP GeoGauge Clegg Hammer
Time Domain Reflectometry
Dirt Seismic Property Analyzer
In use; spec.
developed MN1 IL1, IN1,
MN1
Currently Under
Review
IN, KS, MN2,
MO, MS
FL, IA, IL2, IN2,
LA
FL, ID, IL, MD, MI, MT, NC, NM WY
IN, NM FL, MN, NJ, NC FL, TX
Previously Studied and Not Adopted
into Practice
GA, KS, LA, MD, MN, MS, NH, NJ, NY, OK, OR, PA, TX, WA, WV
IN
1Only pilot specifications at the time of this writing 2Device still being reviewed for use in other applications
2.2.1 Mn/DOT DCP Specification The DCP is currently being used in earthwork QA at Mn/DOT. In their 2002 Grading and Base
Manual (modified in 2006), Mn/DOT published specification 5-692.255, which describes the use
of the DCP for granular materials. In this specification, testing procedures are described for using
the DCP on base course, granular subgrades, and aggregate filter materials. Maximum allowable
penetration indices at specified moisture contents have been developed by Mn/DOT through
their experience with this device. Table 2-D shows the Mn/DOT DCP specification. Grading

22
Number is calculated using Equation 1 in Section 2.2.2. Percent Dry of Optimum is the
percentage less than optimum of the field moisture content as compared to laboratory optimum
moisture content. Maximum allowable seat is the depth of penetration of the first 2 blows.
Maximum allowable DPI is the average penetration of blows 3, 4, and 5. Approximate test layer
is the depth below the surface to which the DCP tip evaluates.
Table 2-D. Mn/DOT DCP Penetration Requirements
Grading
Number
Gravimetric
Moisture
Maximum
Allowable Seat
Maximum
Allowable DPI
Approximate
Test Layer
GN % mm mm/blow mm < 5.0 40 10
5.0-8.0 40 12 3.1-3.5
> 8.0 40 16
100-150
< 5.0 40 10
5.0-8.0 45 15 3.6-4.0
> 8.0 55 19
100-150
< 5.0 50 13
5.0-8.0 60 17 4.1-4.5
> 8.0 70 21
100-150
< 5.0 65 15
5.0-8.0 75 19 4.6-5.0
> 8.0 85 23
125-175
< 5.0 85 17
5.0-8.0 95 21 5.1-5.5
> 8.0 105 25
150-300
< 5.0 105 19
5.0-8.0 115 24 5.6-6.0
> 8.0 125 28
175-300

23
2.2.2 Mn/DOT LWD Pilot Specification Mn/DOT has a pilot specification (Pilot Specification 2105) for the LWD, permitting its use as
an earthwork QA device. The specification includes specific requirements for QA of bridge
approach earthwork. Under this specification, Mn/DOT requires contractors to construct a
control strip to develop compaction target values for the LWD. LWD readings are recorded at
three locations on designated proof layers in the control strip between passes of compaction
equipment. Once LWD values appear to reach a maximum value, the values at the three
locations are recorded and control strip construction moves on to the next layer. Multiple proof
layers are required to fully characterize the influence moisture content has on LWD modulus
values. The compaction target values are then determined by averaging the maximum LWD
modulus readings at the three designated locations on each proof layer and then averaging the
average maximum LWD modulus values from all proof layers constructed under the same
moisture conditions.
Mn/DOT recognizes construction of control strips can be cumbersome and impractical for
certain earthwork projects. After 2008, they are hoping to eliminate control strips and establish
target values for QA specification. As opposed to LWD modulus target values, Mn/DOT plans to
adopt LWD deflection target values for field QA (John Siekmeier, personal conversation, 2008).
This is a more conservative approach as the LWD specifically measures deflection. The LWD
makes some assumptions to determine modulus including contact stress and Boussinesq linear
half-space. Mn/DOT will utilize deflection values from Table 2-E, or a slightly modified version,
for determination of target values. The selected target value would need to be verified. This
methodology will be determined after verification of these numbers during the 2008 construction
season. Note that Table 2-E is based on a load of 6.28 kN and a drop height of approximately
0.52 m because Mn/DOT employs an LWD with a shorter drop arm in the interest of portability.
Mn/DOT uses Grading Number (GN), similar to Fineness Modulus in concrete mix design, to
classify granular materials. GN uses percent passing values from a traditional sieve analysis and
is calculated using Equation 1. A GN of 3.1-3.5 approximately corresponds to a GW material
while a GN of 5.6-6.0 corresponds to an SM or SC.

24
100
200#40#10#4#"83"4
3"1 ++++++=GN (1)
Where: 1” = % passing 1” sieve, #4 = % passing #4 sieve, etc.
As Mn/DOT does not permit use of the NG, either the Burner Method or Speedy Method are
specified to determine moisture content. The Burner Method uses traditional oven drying by
comparing the weight of a wet sample to the weight of a dry sample. The Speedy Method uses a
cast aluminum pressure bottle to measure pressure generated inside the bottle when combining
the sample soil with calcium carbide. Moisture content is read directly off a gauge on the bottle.
Table 2-E. Mn/DOT Predicted Zorn LWD Deflection and Modulus Values (from Mn/DOT Pilot Spec 2105)1
Grading Number Moisture
Content
Target Zorn
LWD Modulus
Target Zorn
LWD Deflection
GN % MPa mm 5-7 80 0.38
7-9 67 0.45 3.1-3.5
9-11 50 0.60
5-7 80 0.38
7-9 53 0.56 3.6-4.0
9-11 42 0.71
5-7 62 0.49
7-9 47 0.64 4.1-4.5
9-11 38 0.79
5-7 53 0.56
7-9 42 0.71 4.6-5.0
9-11 35 0.86
5-7 47 0.64
7-9 38 0.79 5.1-5.5
9-11 32 0.94
5-7 42 0.71
7-9 33 0.90 5.6-6.0
9-11 29 1.05 1200mm load plate, 10kg hammer, 0.52m drop height, F=6.28kN
25
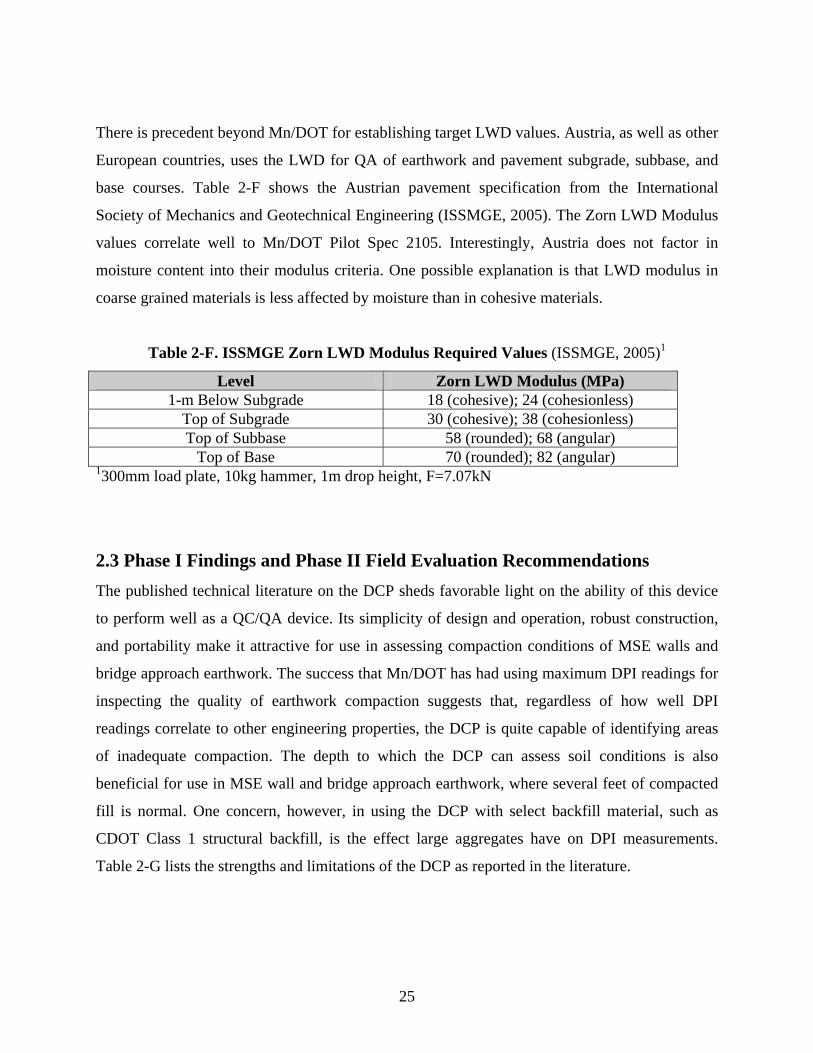
There is precedent beyond Mn/DOT for establishing target LWD values. Austria, as well as other
European countries, uses the LWD for QA of earthwork and pavement subgrade, subbase, and
base courses. Table 2-F shows the Austrian pavement specification from the International
Society of Mechanics and Geotechnical Engineering (ISSMGE, 2005). The Zorn LWD Modulus
values correlate well to Mn/DOT Pilot Spec 2105. Interestingly, Austria does not factor in
moisture content into their modulus criteria. One possible explanation is that LWD modulus in
coarse grained materials is less affected by moisture than in cohesive materials.
Table 2-F. ISSMGE Zorn LWD Modulus Required Values (ISSMGE, 2005)1
Level Zorn LWD Modulus (MPa) 1-m Below Subgrade 18 (cohesive); 24 (cohesionless)
Top of Subgrade 30 (cohesive); 38 (cohesionless) Top of Subbase 58 (rounded); 68 (angular)
Top of Base 70 (rounded); 82 (angular) 1300mm load plate, 10kg hammer, 1m drop height, F=7.07kN
2.3 Phase I Findings and Phase II Field Evaluation Recommendations The published technical literature on the DCP sheds favorable light on the ability of this device
to perform well as a QC/QA device. Its simplicity of design and operation, robust construction,
and portability make it attractive for use in assessing compaction conditions of MSE walls and
bridge approach earthwork. The success that Mn/DOT has had using maximum DPI readings for
inspecting the quality of earthwork compaction suggests that, regardless of how well DPI
readings correlate to other engineering properties, the DCP is quite capable of identifying areas
of inadequate compaction. The depth to which the DCP can assess soil conditions is also
beneficial for use in MSE wall and bridge approach earthwork, where several feet of compacted
fill is normal. One concern, however, in using the DCP with select backfill material, such as
CDOT Class 1 structural backfill, is the effect large aggregates have on DPI measurements.
Table 2-G lists the strengths and limitations of the DCP as reported in the literature.

26
Table 2-G. DCP Strengths and Limitations
Strengths Limitations Simple design, robust construction, good portability
Manual operation may require 2 personnel (one to operate, one to take readings)
Capable of assessing soil conditions to a depth of 1.2 m
Sensitive to moisture conditions (though mostly in cohesive soils)
Well studied and documented track record, strong correlation with CBR
DPI measurements do not correlate well with dry density readings
Shallow testing can be done quickly, 1 to 5 min/location Large aggregate may cause erroneous test results
Successfully being used (in MN) Deeper testing in dense material can take up to 10 to 15 min/location
The Clegg Hammer appears to be a very capable device for use in QA of MSE wall and bridge
approach earthwork. Good correlations have been developed for Clegg CIV, albeit for the 4.5 kg
hammer. The manufacturer cautions that even though all Clegg Hammer models report CIVs,
these values are dependent on hammer weight and geometry, thus two different weight hammers
will report different CIVs for the same material. Therefore, more correlation equations will need
to be developed in order to accommodate the 10 kg and 20 kg hammers. These heavier hammers
seem better suited for MSE wall and bridge approach earthwork due to the depths to which they
are able to measure. Table 2-H lists the strengths and limitations of the Clegg Hammer.
Table 2-H. Clegg Hammer Strengths and Limitations
Strengths Limitations Simple operation, portable design, integrated data acquisition Sensitive to moisture conditions
Nondestructive, non-intrusive Possibility of boundary effects when calibrating device using Proctor molds
Developed correlations with CBR values Weak correlation to density measurements
Quick testing, < 1 min/location Different weight hammers report different CIV values
Optional accessories allow integrated GPS positioning and moisture content testing via integrated moisture probe

27
After reviewing the literature and canvassing other State Departments of Transportation, the
viability of the GeoGauge as a QA device was deemed questionable. It appears that the
complications of inconsistent testing results stem from the difficulty in obtaining a proper
foot/soil contact. Table 2-I identifies some strengths and limitations of this device. Further
consideration of this device is deemed unnecessary.
Table 2-I. GeoGauge Strengths and Limitations
Strengths Limitations
User-friendly operation, portable design Extremely sensitive to seating conditions
Capable of calculating soil stiffness from direct measurements of force and displacement
Questionable correlations due to inconsistencies in testing data
Quick testing, 1-2 min/location (after proper seating established) No correlation to density measurements
Non-destructive and non-intrusive Sensitive to moisture conditions
Unfavorable findings by multiple State DOT’s
Time Domain Refrectometry cannot be used on soils containing particle sizes larger than ¾ inch
or on material containing more than 30% (by weight) of particles coarser than the No. 4 sieve
make it unacceptable for use as a QA device for MSE wall and bridge approach earthwork with
Class 1 backfill. Further analysis of this device is thus deemed unnecessary.
The LWD seems a very capable device for MSE wall and bridge approach earthwork QA. The
device would likely be best utilized when supported by less frequent testing with the DCP or
nuclear density gage to provide a comprehensive understanding of the subsurface stratum and
soil properties. Strengths and weaknesses of the LWD are summarized in Table 2-J.

28
Table 2-J. LWD Strengths and Limitations
Strengths Limitations
Easy to transport and simple to operate Modulus is moisture-dependent and the LWD does not measure moisture
Quick test – 1 min/test Sensitivity to changes in compaction not well developed
Multiple size loading plates enable measurement over a range of modulus values and different depths
Seemingly no influence caused by large aggregate
No interference with MSE wall reinforcement
Measurement depth (up to 0.5 m) allows assessment of multiple layers
At this time, surface seismic wave testing appears too complex for QA inspection. The approach
is fundamentally sound, but further analysis is deemed unnecessary due to complexity and
fragility of existing systems. This approach should be considered as simpler systems are
developed. Table 2-K summarizes the strengths and limitations.
Table 2-K. Surface Wave Testing Strengths and Limitations
Strengths Limitations Measures a fundamental soil property (small strain stiffness modulus) which can also be measured in the laboratory
Complexity and accuracy is dependent on the layer profile
Can resolve different layers and hence measure a material property of each layer that is independent of the complete layer profile and surface condition
Can be time consuming and can require complex data processing to resolve different layers
Samples a large volume of the material Currently no ASTM procedure
Sensitive to changes in compaction Measurements can be affected by the surrounding geometry such as an MSE wall
Is not influenced by large aggregate materials Fragile equipment components
In summary, the DCP, Clegg Impact Hammer, and LWD were selected for field evaluation.

29
CHAPTER 3: OVERVIEW OF FIELD TESTING AND EVALUATION OF DEVICE UNCERTAINTY 3.1 Test Sites and Procedures Field testing with the DCP, LWD, Clegg Hammer, and NG was performed at two construction
sites (see Figs. 3-1 and 3-2):
(1) SH40 – I70 Hogback Park and Ride MSE Wall, Golden.
(2) SH58 – I70 Multi-MSE Wall and Bridge Approach Intersection, Golden.
Figure 3-1. SH40 – I70 Hogback MSE Wall
Figure 3-2. SH58 – I70 MSE Wall (Parallel to SH58)

30
Field testing with the DCP, LWD, and Clegg Hammer was performed at numerous discrete
locations within active construction sections at each site (see Figs. 3-3 and 3-4). At most test
locations, NG testing was also performed by the QA representative at each site. This allowed
direct comparison of DCP, LWD, and Clegg data to moisture-density data. Figure 3-5 illustrates
a typical single-position testing configuration.
Figure 3-3. DCP and Clegg Impact Hammer Operation
Figure 3-4. Seating the LWD Plate and Administering a NG Test

31
Figure 3-5. Typical Layout Adopted for Single Location Testing
At each site, test beds were identified as single lift areas where multiple spot tests could be
performed, typically within 1-2 hours. Test beds for MSE wall were generally 10m (30ft) wide,
the width of the backfill, and 30m (100ft) to 60m (200ft) long. Test beds for bridge approaches
were generally 10m (30ft) wide and 7m (20ft) long. Tables 3-A and 3-B summarize the modified
Proctor compaction results for the 5 soils encountered and the 30 test beds, respectively.
Table 3-A. Summary of Modified Proctor Compaction Results
Soil # Max Dry Density kg/m3 (lb/ft3) Optimum Moisture (%) 1 2171 135.5 4.6 2 2249 140.4 4.6 3 2263 141.3 5.9 4 2171 135.5 7.9 5 2204 137.6 7.4

32
Table 3-B. Summary of 30 Test Beds
Number of Test Locations Test Bed Location
Size m x m (ft x ft)
Soil #
Test Date DCP LWD Clegg NG
1 SH-40 Hogback MSE 61x8 (200x25) 1 3/22/07 24 0 24 24 3 SH-40 Hogback MSE 30x8 (100x25) 1 3/26/07 12 12 18 18 4 SH-40 Hogback MSE 30x8 (100x25) 1 3/28/07 20 20 20 20 5 SH-40 Hogback MSE 50x8 (160x25) 2 4/5/07 21 21 21 21 6 SH-40 Hogback MSE 5x8 (15x25) 2 4/18/07 0 5 0 5 7 Bridge App. SH-58 12x6 (40x20) 3 7/3/07 10 0 10 10 8 Bridge App. SH-58 12x6 (40x20) 3 7/5/07 5 0 0 0 9 Bridge App. SH-58 12x6 (40x20) 3 7/5/07 5 0 2 5 10 Bridge App. SH-58 12x6 (40x20) 3 7/6/07 5 0 0 5 11 MSE SH-58 17x6 (55x20) 4 7/9/07 11 0 11 11 12 Bridge App. SH-58 12x6 (40x20) 3 7/9/07 3 0 3 3 13 MSE I-70 15x4 (50x12) 4 7/9/07 6 0 5 6 14 MSE I-70 30x8 (100x25) 4 7/10/07 9 0 9 9 15 MSE SH-58 8x6 (25x20) 4 7/10/07 3 0 3 3 16 MSE SH-58 15x5 (48x16) 5 7/11/07 6 0 6 6 17 MSE SH-58 30x8 (100x25) 5 7/11/07 5 0 2 6 18 MSE SH-58 46x8 (150x25) 5 7/17/07 15 9 15 6 19 MSE SH-58 37x8 (120x25) 5 7/18/07 15 15 15 15 20 MSE SH-58 24x8 (80x25) 3 7/23/07 10 10 10 10 21 MSE SH-58 24x8 (80x25) 3 7/23/07 4 11 11 11 22 MSE SH-58 15x8 (50x25) 3 7/24/07 0 10 10 10 23 MSE SH-58 18x8 (60x25) 3 7/24/07 0 6 6 6 24 MSE SH-58 30x8 (100x25) 3 7/25/07 0 11 11 11 25 MSE SH-58 30x8 (100x25) 3 7/30/07 0 14 14 14 26 MSE SH-58 30x8 (100x25) 3 7/31/07 0 15 15 15 27 MSE SH-58 30x8 (100x25) 3 8/1/07 0 10 10 10 28 MSE SH-58 30x8 (100x25) 3 8/6/07 0 12 12 12 29 MSE SH-58 30x8 (100x25) 3 8/7/07 0 10 10 10 30 Bridge App. SH-58 12x3 (40x10) 3 7/17/08 15 0 15 0
Hogback MSE Wall Testing – Test beds 1-6 were performed at the SH40 – I70 Hogback MSE
wall construction project. The Hogback MSE wall was approximately 100 m (300 ft) in length
and included sections with wall heights varying from 3-12 m (10-40 ft) (see Figure 3-1). The
modular MSE wall included 200mm (8 in) tall bricks and geogrid reinforcing placed every 600
mm (24 in) in elevation. Compaction QA requirements included 200 mm (8 in) lift thickness and

33
achievement of 95% modified Proctor maximum dry density. Per CDOT requirements, there was
no moisture specification when using Class 1 backfill.
SH58 – I70 Interchange Testing – Test beds 7-30 were conducted within four structures on the
SH58 – I70 construction site. The earthwork structures included a westbound bridge approach to
I70, the MSE wall parallel to SH58, the MSE wall parallel to I70 ramping into the flyover, and
the bridge approach connecting the I70 parallel MSE wall to the flyover. The MSE wall parallel
to SH58 was approximately 200 m (660 ft) long and ranged from 2 to 6 m (6 to 20 ft) in height.
The modular MSE walls were constructed with 200 mm (8 in) tall pin locking blocks and
included geogrid reinforcing placed between each lift. The length of the geogrid was varied from
approximately 1.5 m to 5 m (5 to 16 ft) alternating with each 200 mm lift. Each lift included a
coarse gravel placed against the MSE wall for drainage which extending approximately 0.1 - 0.3
meters (0 - 1ft) and Class 1 backfill. Compaction QA requirements included 200 mm (8 in) lift
thickness and achievement of 95% modified Proctor maximum dry density. Per CDOT
requirements, there was no moisture specification when using Class 1 backfill.

34
3.2 Uncertainty in Device Measurement
This section characterizes the precision uncertainty of each device, the local variability measured
with each device, and the appropriate statistical representation of data based on these findings.
For any experimental test, accuracy and precision of the test device are key characteristics that
define uncertainty. Accuracy – defined as the difference between the true and measured values –
is unknown for the LWD, Clegg Hammer, or DCP because the true value cannot be measured.
The accuracy of the NG was quantified by Troxler to be ±1.0% for density (Troxler, 2006). The
precision of a measured value reflects the degree of reproducibility or repeatability. Precision is
often reported in terms of the standard deviation (σ) and the associated confidence intervals, i.e.,
± 1σ implies 68% confidence, ± 2σ implies 95% confidence. This chapter presents results to
quantify precision uncertainty.
The geotechnical properties of earthwork (e.g., density, moisture, modulus, strength) vary
spatially. It is critically important to understand the local variability of these properties,
particularly when comparing data from two devices that measure over different volumes of soil.
Here we present the results of local variability studies for the NG, LWD, DCP, and Clegg
Hammer. The chapter concludes with recommendations for statistical representation of data that
is then used throughout the report.
3.2.1 Device Precision To quantify the working precision of each device, repeatability testing was performed using two
approaches. For both approaches, the device was placed at a given location and an initial test was
performed (i.e., one minute reading from nuclear gage (NG), average of 3 LWD drops, peak of 4
Clegg Hammer drops). For the ‘in place’ approach, 5-10 repeated tests were performed without
removing or re-placing the device. For the ‘re-place’ approach, the device was removed and re-
placed between each test.
Nuclear Gauge - A direct transmission nuclear gage (NG) test was performed at a 200 mm (8 in)
probe depth thirty two times in the same location. The first sixteen times were run as ‘in-place’
tests where the device was left in exactly the same position. The following sixteen tests were run
as ‘re-place’ tests where the device was removed from the ground and replaced in the same

35
location. The location for each re-place test was identified by the indentation the gage left in the
soil. The data is presented in Figure 3-6. The standard deviation (σ) of dry density and moisture
were 6.1 kg/m3 (0.38 pcf) and 0.16% respectively. The corresponding COVs were 0.30% and
4.13%. For 95% confidence (2σ), the uncertainty was ±0.60% (density) and ±8.27% (moisture).
1850
1900
1950
2000
2050
2100
2150
2200
0 2 4 6 8 10 12 14 16Test Number
Dry
Den
sity
(kg/
m3 )
2
4
6
8
10
Moi
stur
e (%
)
In-Place
Re-Place
In-Place (Moisture)
Re-Place (Moisture)
Figure 3-6. NG Repeatability Data in Density and Moisture
LWD – Shown in Figure 3-7 are plots of the data collected from five LWD repeatability tests
conducted over a range of soil stiffness. These LWD repeatability tests were conducted over a
range of soil stiffness in order to determine the effects of stiffness on precision uncertainty. After
3 seating drops, 3 measurement drops were performed to determine the first value of ELWD (test
1). An additional 9 tests (3 drops per test) were performed. Series 4 and 5 in Figure 3-7 represent
re-place tests were the LWD was picked up and re-placed in the same location (easy to do
because the plate outline was visible in the soil). Testing was conducted on an MSE wall and
stiffness was varied by starting close to the wall and moving perpendicularly away from it. In
each case the data was de-trended in order to remove the effects of compaction where multi drop
tests were conducted.

36
y = -0.04x2 + 0.87x + 29.07R2 = 0.97
y = -0.13x2 + 2.24x + 41.26R2 = 0.96
y = 19.07x0.04
R2 = 0.16
y = -0.04x2 + 0.58x + 6.52R2 = 0.31
y = 1.01Ln(x) + 40.49R2 = 0.82
0
10
20
30
40
50
60
0 2 4 6 8 10Test Number
ELW
D (M
Pa)
1
2
3
4
5
Figure 3-7. Repeatability Tests Conducted on Varying Soils
(increase in E suggests some compaction continued)
The LWD data from Figure 3-7 is presented in Table 3-C and reveals that precision uncertainty
is strongly dependent on the value of ELWD. Precision uncertainty improves from ±12.5% at a
modulus of 20 MPa to less than ±2% at values greater than 30 MPa. As will be shown in Chapter
4, ELWD > 30 MPa is desirable, and for this level, precision uncertainty is adequate.
Table 3-C. Data Summary of Figures 3-6
Series Offset From MSE
Wall µ ELWD (MPa) 2σ-Uncertainty
(MPa) 2σ-Uncertainty
(%) 1 0.3 m (0.98 ft) 8.21 1.73 21.02 2 0.8 m (2.62 ft) 20.40 2.54 12.43 3 3.0 m (9.84 ft) 49.25 0.85 1.72 4 NA 32.72 0.50 1.52 5 NA 42.19 0.70 1.66

37
Clegg Hammer - Figure 3-8 shows the results from three in-place repeatability tests conducted
with the Clegg Hammer. Results from these tests were de-trended and presented in Table 3-D.
y = 0.88Ln(x) + 11.67R2 = 0.68
y = 2.76Ln(x) + 10.62R2 = 0.96
y = 1.05Ln(x) + 13.09R2 = 0.94
10.5
12.5
14.5
16.5
18.5
0 2 4 6 8 10 12 14 16 18Test Number
CIV
123
Figure 3-8. In-Place Test Results for Clegg Hammer
Table 3-D: Uncertainty in CIV
Series µ (Clegg) 2σ Uncertainty (CIV) 2σ Uncertainty (%) 1 14.37 0.37 2.58 2 12.74 0.83 6.54 3 16.05 0.85 5.28
Average 0.68 4.80
Table 3-D indicates that the Clegg Hammer’s precision uncertainty is less impacted by different
soil stiffness with an average precision uncertainty of ±4.8%. It should be noted that series one
brings the average precision uncertainty down with a values twice as low as the other two series.
It is also important to note that the best precision achieved by the Clegg of 2.6% is 1% higher
than the precision achieved by the LWD on soils with moduli over 30MPa.
Table 3-E summarizes the precision uncertainty of the tested devices. DCP precision can not be
obtained due to the destructive nature of the test. The precision of the LWD changes dramatically
with stiffness and therefore an equation has been listed instead of a value. The plot in Figure 3-9

38
shows the relationship between ELWD and precision uncertainty. It can be seen that a low value in
ELWD leads to a high degree of imprecision. For example, an ELWD value of 16 MPa corresponds
to a precision of ±15%, while a value of 40 MPa corresponds to a precision of ±1.6%. The NG
determined density has the lowest precision uncertainty however both the LWD and Clegg
Hammer achieve less uncertainty than the NG determined moisture.
Table 3-E. 95% Confidence Interval for Precision of Each Device
Device Precision1 (%) LWD P = 0.015(ELWD)2 - 1.360(ELWD)+31.866 Clegg 4.80
NG - Density 0.60 NG - Moisture 8.27
DCP NA 1 Precision reported as % based on the device’s mean value and reflects 95% confidence
P = 0.02(ELWD)2 - 1.36(ELWD) + 31.87R2 = 0.97
0
5
10
15
20
25
0 10 20 30 40 50 60ELWD (MPa)
Unc
erta
inty
(%)
Figure 3-9. Precision Corresponding to Measurement Value

39
3.3 Assessment of Local Variability
Local variability in soil properties also contributes to uncertainty in single or multiple
measurements. The characterization of local variability is particularly important when comparing
values between devices. As shown in Figure 3-10, each device provides an average measurement
over a volume of soil. The measurement volumes vary considerably across devices. The
implication of local variability on earthwork QA will first be shown by considering NG density
and moisture.
Figure 3-10. Comparison of QA Device Measurement Volumes
A four-position test (see Figure 3-11) was used to explore the local variability in density and
moisture of soil with the NG. This configuration was selected because this measurement volume
is roughly equivalent to that evaluated with the LWD test. One hole was driven as marked by the
X in Figure 3-11. A one minute test was conducted beginning in position 1. The NG was rotated
90 degrees to position 2 and another one minute test was conducted. This procedure continued
through position 4. The volume of soil tested with this configuration is difficult to precisely

40
define, however, it is assumed to be a 3D clover shape originating at the probe depth of 8 inches
and expanding upward and outward to the surface detector location (see Fig. 3-10).
Figure 3-11. NG Testing Pattern for Local Variability
Twelve 4-position tests were conducted on a well compacted high quality aggregate base
material. Figure 3-12 presents the values recorded at each position for each of the 12 points
(tests). The circle for each point (test) reflects the average of the four positions. Figure 3-11
shows that at one-half of the points, the positional orientation of the device dictated whether the
required density was met or not met. This is pertinent because current CDOT NG practice uses a
single-position approach to testing. Based on these results, acceptance or failure is often
determined by orientation (position) of the NG in CDOT practice.
Figure 3-13 presents histograms of the variability of the Figure 3-12 data. Specifically, the 4-
position density or moisture range (R) normalized by the 4-position density or moisture average
(× 100) yields a measure of variability (as a percentage of the density). The mean R/μ (× 100) in
dry density was found to be 4%, implying that a single position measurement of dry density
carries an uncertainty due to local variability of ± 4%. The corresponding uncertainty in percent
compaction (%C) is ± 3-4%. This single position uncertainty in NG density is significant when
one considers that the entire compaction process induces a %C change of ≈ 10 % (i.e., soil is
typically placed at %C ≈ 85 % and acceptance is based on achieving %C ≥ 95%). Therefore, the
compaction process induces a %C change of ≈ 10 % yet a single position NG density carries an
uncertainty of ± 3-4%. The uncertainty in density can be decreased significantly by adopting the
4-position NG test. This is described further below and in Chapter 5.

41
2.6
3
3.4
3.8
4.2
0 1 2 3 4 5 6 7 8 9 10 11 12 13Point
Moi
stur
e (%
)
1960
2010
2060
2110
2160
2210
2260
0 1 2 3 4 5 6 7 8 9 10 11 12 13Point
Den
sity
(kg/
m^3
)
95% of Modified Proctor
0
2
4
6
8
10
12
14
0.5
1.5
2.5
3.5
4.5
5.5
6.5
7.5
8.5
9.5
10.5
Mor
e
R/μ × 100
Freq
uenc
y
0
0.05
0.1
0.15
0.2
0.25
Pro
babi
lity
Den
sity
0
1
2
3
4
5
6
7
8
9
0 4 8 12 16 20 24 28More
R/μ × 100
Freq
uenc
y
0
0.01
0.02
0.03
0.04
0.05
0.06
0.07
Pro
babi
lty D
ensi
ty
The local variability within the 4-position area depicted in Figure 3-10 is also important when
considering correlations between density and ELWD, CIV, and DPI. For example, one LWD test
produces an ELWD value that represents an average value over a volume roughly similar to the
four-position volume of the NG setup. To this end, the appropriate density to compare with EVIB
should be the average of the four positions. Considerable variability induced error can result
from using a single-position NG density when comparing to ELWD.
Figure 3-12: 4-Position and Average Density and Moisture at 12 Locations (Points)
Figure 3-13: Variability in Density and Moisture Determined by 4-Position NG Test

42
The variability of soil properties should be considered when implementing QA procedures. The
R/μ of LWD, Clegg Hammer, DCP and NG data collected on 4 test beds were assessed to
characterize local variability. As shown in Figure 3-14, NG density varied by 5-10%. This is
reasonably consistent with the results presented above. The R/μ for ELWD, CIV and DPI were
much greater, and are consistent with the findings of Nazarian et al. (2005) who found that
modulus exhibits much higher variability than density. These results illustrate that all soils have
sufficient variability in density, modulus and shear strength that should be captured in QA
procedures. The importance of capturing variability is more critical for modulus and strength.
0
0.2
0.4
0.6
0.8
1
1.2
1.4
1.6
1.8
6.43 ft 2̂ 1400 ft^2 (TB-5) 192 ft 2̂ (TB-7) 350 ft^2 (TB18)
R/µ
LWDCleggNG DensityNG MoistureDCP
Figure 3-14: Precision Uncertainty for Each Device on Various Test Beds
3.4 Conclusions In this chapter, the uncertainty in NG, DCP, LWD, and Clegg Hammer data were examined.
Precision uncertainty was evaluated through repeatability testing. Uncertainty due to local
variability was also examined over comparative measurement volumes and over larger test bed
areas. The precision uncertainty of each device was considered acceptable for QA testing.
Uncertainty is much greater when soil is poorly compacted (e.g., ELWD is low). Evaluation of NG
testing over an area equal to the measurement volume of the LWD test revealed significant
variability. Specifically, by rotating the NG around the same source rod location, %C varied by ±

43
3-4%. This implies that within a small area (less than 2 sq. ft), NG dry density and thus
acceptance or failure, is often dictated by orientation (position) of the NG. Because of this large
relative uncertainty (± 3-4% compared to the approximate 10% change in %C typical as material
is compacted) in single-position NG testing, we recommend CDOT modify the current NG
approach to better account for local variability. This is addressed in Chapters 4 and 5.
An assessment of variability in NG, LWD, DCP, and Clegg Hammer data over typical test bed
areas revealed 5-10% R/μ results for NG density and much greater R/μ values for ELWD, DPI,
and CIV. These results indicate that soil property variability must be statistically accounted for in
QA. The methodology to account for variability is addressed in Chapters 4 and 5.

44

45
CHAPTER 4: FIELD TEST RESULTS
As described in Chapter 3, field testing with the NG, LWD, DCP, and Clegg Hammer was
performed on 30 test beds and five soils. The objectives were two-fold: (1) assess the compaction
of MSE wall and bridge approach earthwork with all four devices; and (2) evaluate the ability of
each of the proposed devices to characterize compaction. This effort included evaluating the
ability of each device to evaluate soil compaction close to the MSE and abutment walls, and to
identify if the resulting ELWD, CIV and DPI data suggests that target values from these devices
can be used for QA criteria (as a supplement to or replacement for NG density).
4.1 Characterization of MSE Wall and Bridge Approach Compaction The general ability of each device to assess compacted state was investigated on numerous MSE
wall and bridge approach earthwork sections (test beds). Testing was performed in discrete
locations beginning at the MSE or bridge approach wall face (i.e., X = 0 as shown in Figure 4-1)
and extending out to the edges of Class 1 backfill. LWD, DCP, and Clegg Hammer testing were
successfully performed within 0.3 m (1 ft) of the wall face. To fit into active construction
projects with disrupting the contractor, most testing was performed on completed (compacted)
sections.
Figure 4-1. Offset X for MSE Wall and Bridge Approach Testing

46
1750180018501900195020002050210021502200
0 0.6 1.2 1.8 2.4 3 3.6 4.2 4.8 5.4 6Offset X (m)
Dry
Den
sity
(kg/
m3)
95% Mod. Proctor
0
20
40
60
80
100
120
140
0 0.6 1.2 1.8 2.4 3 3.6 4.2 4.8 5.4 6Offset X (m)
Ave
DP
I (m
m/b
low
)
0
24
68
10
1214
16
0 0.6 1.2 1.8 2.4 3 3.6 4.2 4.8 5.4 6Offset X (m)
CIV
0
5
10
15
20
25
30
0 0.6 1.2 1.8 2.4 3 3.6 4.2 4.8 5.4 6Offset X (m)
ELW
D-3
(MP
a)
Figure 4-2 presents dry density (NG), ELWD, CIV and DPI data collected at 18 test locations on
test bed 3 as a function of offset X. The X scale is presented in 0.3 m increments for visual
interpretation in ft (0.3 m = 1 ft). Compared to the 95 %C acceptance shown in Figure 4-2, the
area within approximately 1 m (3-4 ft) of the MSE wall face has not met the required 95 %C. All
other density values indicate acceptable compaction has been achieved. The ELWD, CIV and DPI
data points each produce trends similar to NG density. For example, ELWD is very low (5-8 MPa)
within 1 m of the wall face but is relatively constant (20 MPa) for X > 1 m. It is important to
note that these ELWD values were determined using a 300 mm diameter load plate, whereas the
target values in Section 4.2 were determined using a 200 mm diameter load plate.
Figure 4-2. MSE Wall Soil Characteristics as Determined by all Devices ( DPI is denoted as Ave DPI)

47
The DPI data is similarly clear. Here, a high DPI indicates softer material and low DPI indicates
stiffer material. For X > 1 m, DPI is reasonably constant (10 mm/blow). The CIV data exhibits a
similar trend with X; however, there is greater scatter particularly at X = 4.5 m.
The greater variability in ELWD, CIV and DPI as compared to dry density is evident by the
changes in values in Figure 4-2. From X = 0-6 m, dry density varies by 14% while ELWD, CIV
and DPI vary by 500%, 400% and 1200%, respectively. These data suggest that soil modulus
and shear strength undergo much greater changes during compaction than does dry density.
The DPI data in Figure 4-2 stems from the DPI profile created from each DCP test. Figure 4-3
presents complete DPI records for 6 locations ranging from X = 0-6 m in test bed 3. The DPI
presented in Figure 4-2 reflects the mean value over 200 mm (8 in), less seating drops 1 and 2,
and reflects the lift thickness. This definition can be modified to any lift thickness or depth up to
1 m. Figure 4-2 illustrates how inadequate compaction is achieved even in lifts below the current
one being assessed (e.g., depths of 0.8 m in Fig. 4-2). In contrast to the other devices and NG, the
DCP enables a QA inspector to evaluate compaction of underlying lifts to a depth of 1.2 m.
0
100
200
300
400
500
600
700
800
900
0 50 100 150 200 250DPI (mm/blow)
Dep
th (m
m)
0.3 (m)0.8 (m)1.5 (m)3.0 (m)4.6 (m)6.1 (m)
Figure 4-3. DPI Profiles at Varying Distances from Wall

48
17001750180018501900195020002050210021502200
0 0.6 1.2 1.8 2.4 3 3.6 4.2 4.8 5.4 6Offset X (m)
Dry
Den
sity
(kg/
m3)
95% Mod. Proctor
02468
1012141618
0 0.6 1.2 1.8 2.4 3 3.6 4.2 4.8 5.4 6Offset X (m)
CIV
020406080
100120140160180
0 0.6 1.2 1.8 2.4 3 3.6 4.2 4.8 5.4 6Offset X (m)
Ave
DP
I (m
m/b
low
)
TB 1TB 3TB 4
05
1015202530354045
0 0.6 1.2 1.8 2.4 3 3.6 4.2 4.8 5.4 6Offset X (m)
ELW
D-3
One limitation observed during DCP testing stems from the DCP tip interaction with geogrid and
geofabric. With geogrid and geofabric placed at 200 mm (8 in) spacings, the DCP tip must
penetrate through the grid or fabric. Similar to the influence of large rocks that artificially alter
the DPI readings, the geogrid and fabric provides some resistance during DCP testing. This was
noticeable to the DCP operator during testing. This is a limitation of the DCP device for MSE
wall and bridge approach earthwork where geogrid and geofabrics are always present.
Dry density, ELWD, CIV and DPI data from test beds 1, 3 and 5 are presented together in Figure
4-5. While greater scatter in data exists, the trend is similar across all 3 MSE wall test beds. First,
adequate compaction is not being achieved within 1.2 m (4 ft) of the wall face. Second, the
LWD, DCP, and Clegg Hammer values mimic the dry density results, and therefore compaction.
Figure 4-4. Data from Test Beds 1, 3, 4 ( DPI is denoted as Ave DPI)

49
6
8
10
12
14
16
18
0 0.3 0.6 0.9 1.2 1.5Offset X (m)
CIV
0
2
4
6
8
10
12
14
0 0.3 0.6 0.9 1.2 1.5Offset X (m)
Ave
. DP
I (m
m/b
low
)In test bed 30, a similar assessment of compaction at various X offsets from a bridge abutment
was performed. The data collected from these 15 locations are presented in Figure 4-5 and reveal
an increase in compaction for increasing X. Here, NG testing was not performed, and therefore it
is difficult to definitively identify if there is an offset range where adequate compaction was not
achieved. It is worth noting that the X < 1 m values of CIV and DPI indicate much better
compaction than the similar MSE wall values shown in Figure 4-4.
Figure 4-5. Test Bed 30 – CIV and DCP Data ( DPI is denoted as Ave DPI) The inadequate compaction within 1 m of MSE wall faces and the improved near bridge
abutment compaction can be attributed to compaction methods. As shown in Figure 4-6,
vibratory roller compactors are used for X > 1 m and plate compactors are used for X < 1 m of
MSE walls. In contrast, vibratory roller compactors are used for earthwork against abutment
walls. Per the results presented here, the vibratory plate compactors being used are not able to
provide adequate compaction. The inadequate compaction within 1 m of the wall face largely
goes unnoticed because of the near-wall limitation of the NG. These results suggest that CDOT
should revisit compaction equipment requirements for near wall situations. Heavier plate
compactors and/or vibratory trench compactors (see Fig. 4-6) may provide the required
compactive effort and thus might be mandated.

50
Figure 4-6. Near Wall Compaction Techniques

51
4.2 Identification of Target Values To implement LWD, DCP, and/or Clegg Hammer based testing in earthwork QA, test results
must reveal ELWD, CIV and DPI values that correlate to the required dry density requirements.
Here, we investigate whether such ELWD, CIV and DPI “target values” are evident. Before
examining the collected data for target values, it is beneficial to introduce the proposed
specification. The proposed QA methodology is similar in concept to the Mn/DOT specification
(see Section 2.2), and would involve comparison of ELWD, CIV or DPI data collected during QA
against an ELWD, CIV or DPI target value.
The specification would require that the average of spot test data ( μ̂ ) within a test area or lot
minus the standard error (SE) of the data be greater than the target value (TV) as shown in
Equation 2. SE is the standard deviation of the average, and is an unbiased estimate of
uncertainty in a sample average. SE is quantified in Equation 3 using standard deviation (σ) and
number of test points (n) (Bevington and Robinson 2003).
TVSEˆ >−μ (2)
σ=n
1SE (3)
The form of Equation 2 has statistical significance. Assuming a Gaussian distribution in the data,
there is 68% confidence that the true test bed average value is within the window SEˆ ±μ . Recall
that μ̂ is a sample average, and an estimate of the true average. Consequently, there is 84%
confidence that the true test bed average is greater than SEˆ −μ . Hence, the requirement in
Equation (2) provides 84% confidence that the sample average μ̂ is greater than the TV. The
specification is discussed further in Chapter 5 and only introduced here to provide some
backdrop for the evaluation of TVs.
ELWD, DPI and CIV TVs were determined by examination of all data sets collected, and by using
the average %C as an indication of a passing or failing test bed. As shown below, the approach
involves trial and error setting of the TV in an attempt to minimize false positives and true
negatives when compared to the existing 95 %C specification.
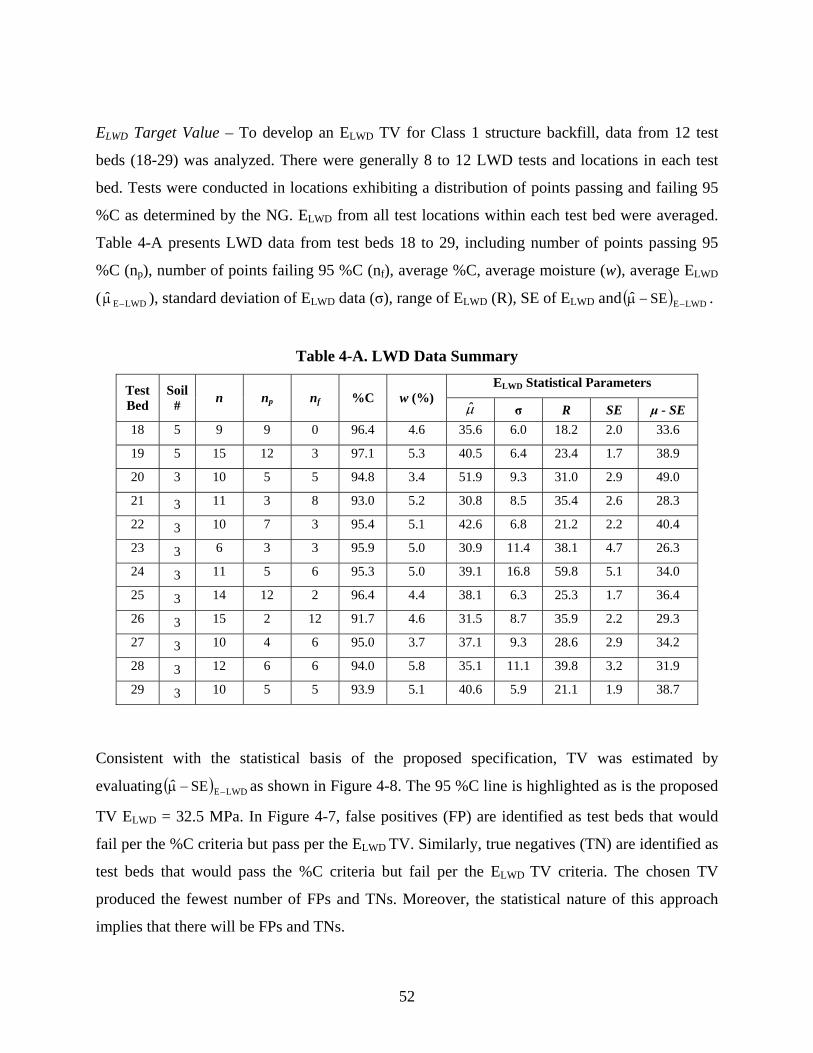
52
ELWD Target Value – To develop an ELWD TV for Class 1 structure backfill, data from 12 test
beds (18-29) was analyzed. There were generally 8 to 12 LWD tests and locations in each test
bed. Tests were conducted in locations exhibiting a distribution of points passing and failing 95
%C as determined by the NG. ELWD from all test locations within each test bed were averaged.
Table 4-A presents LWD data from test beds 18 to 29, including number of points passing 95
%C (np), number of points failing 95 %C (nf), average %C, average moisture (w), average ELWD
( LWDEˆ −μ ), standard deviation of ELWD data (σ), range of ELWD (R), SE of ELWD and ( ) LWDESEˆ −−μ .
Table 4-A. LWD Data Summary ELWD Statistical Parameters Test
Bed Soil
# n np nf %C w (%) μ̂ σ R SE μ - SE
18 5 9 9 0 96.4 4.6 35.6 6.0 18.2 2.0 33.6
19 5 15 12 3 97.1 5.3 40.5 6.4 23.4 1.7 38.9
20 3 10 5 5 94.8 3.4 51.9 9.3 31.0 2.9 49.0
21 3 11 3 8 93.0 5.2 30.8 8.5 35.4 2.6 28.3
22 3 10 7 3 95.4 5.1 42.6 6.8 21.2 2.2 40.4
23 3 6 3 3 95.9 5.0 30.9 11.4 38.1 4.7 26.3
24 3 11 5 6 95.3 5.0 39.1 16.8 59.8 5.1 34.0
25 3 14 12 2 96.4 4.4 38.1 6.3 25.3 1.7 36.4
26 3 15 2 12 91.7 4.6 31.5 8.7 35.9 2.2 29.3
27 3 10 4 6 95.0 3.7 37.1 9.3 28.6 2.9 34.2
28 3 12 6 6 94.0 5.8 35.1 11.1 39.8 3.2 31.9
29 3 10 5 5 93.9 5.1 40.6 5.9 21.1 1.9 38.7
Consistent with the statistical basis of the proposed specification, TV was estimated by
evaluating ( ) LWDESEˆ −−μ as shown in Figure 4-8. The 95 %C line is highlighted as is the proposed
TV ELWD = 32.5 MPa. In Figure 4-7, false positives (FP) are identified as test beds that would
fail per the %C criteria but pass per the ELWD TV. Similarly, true negatives (TN) are identified as
test beds that would pass the %C criteria but fail per the ELWD TV criteria. The chosen TV
produced the fewest number of FPs and TNs. Moreover, the statistical nature of this approach
implies that there will be FPs and TNs.

53
The LWDEˆ −μ and ( ) LWDESEˆ −−μ values are highlighted for test beds 18 and 28 to illustrate the
influence of SE. For test bed 18, LWDEˆ −μ = 35.6 MPa and ( ) LWDESEˆ −−μ = 33.6 MPa, while for test
bed 28, LWDEˆ −μ = 35.1 MPa and ( ) LWDESEˆ −−μ = 32.0 MPa. The average %C data indicated a
passing test bed 18 and a failing test bed 28 (see Table 4-A). Hence, the SE was important in
identifying test bed 28 as a failing test bed. It is worth mentioning that SE values ranged from 2-
5 (Table 4-A) and constitutes 5-10% of LWDEˆ −μ . SE can be reduced by increasing the number of
test points.µ
91
92
93
94
95
96
97
98
25.0 30.0 35.0 40.0 45.0 50.0
(µ - SE)E-LWD (MPa)
%C
Soil #3
Soil #5
Figure 4-7. ( ) LWDESEˆ −−μ vs. %C
The possible influence of moisture on ELWD was also evaluated. Average moisture content versus
( ) LWDESEˆ −−μ is plotted in Figure 4-8. Figure 4-8 shows no significant trend. The influence of
moisture content on ELWD was considered negligible for these Class 1 structure backfill test beds.
35.6 33.6
35.1 32.0 FP
TN

54
25.0
30.0
35.0
40.0
45.0
50.0
3.0 3.5 4.0 4.5 5.0 5.5 6.0Average Moisture Content (%)
(µ -
SE
)E-L
WD (
MP
a)
Soil #3
Soil #5
Figure 4-8. Average Moisture Content vs. ( ) LWDESEˆ −−μ
It should be noted that ELWD values are device and device parameter specific (e.g., plate
diameter, drop mass and height). Therefore, the target values recommended in this study are
based on 200 mm plate diameter Zorn device with an impulse of 7.07 kN. To calculate ELWD, a
Boussinesq linear half space solution is used assuming Poisson’s ratio of 0.5 and uniform stress
distribution.
Clegg Hammer Target Value – CIV data from 17 Class 1 backfill test beds were analyzed to
develop a TV CIV. The statistics of CIV data are presented in Table 4-B, and test bed ( )CIVSEˆ −μ
is plotted versus %C in Figure 4-9. The 95 %C line and proposed CIV = 11.9 TV line are
highlighted. The CIV = 11.9 TV results in three FPs and two TNs. Again, these are acceptable
given the statistical nature of this approach. The statistics CIVμ̂ and ( )CIVSEˆ −μ are highlighted for
test beds 19 and 26 to illustrate their importance and relationship to the proposed criteria.
Moreover, these two test beds can be used to illustrate how the specification would work.
Target Value = 32.5 MPa

55
Table 4-B. Clegg Hammer Data Summary
CIV Statistical Parameters Test Bed
Soil # n np nf %C w (%)
μ σ R SE μ - SE 7 3 10 3 7 93.5 5.1 9.1 1.7 5.7 0.5 8.6
9 3 2 2 0 95.5 6.3 12.4 0.5 0.7 0.4 12.0
12 5 3 3 0 96.3 7.0 12.0 2.8 5.2 1.6 10.4
16 5 6 4 2 95.8 6.3 11.7 1.4 4.1 0.6 11.1
17 5 6 2 4 96.3 6.5 12.1 0.1 0.2 0.1 12.0
18 5 9 9 0 96.4 4.6 13.6 1.1 2.5 0.4 13.2
19 5 15 12 3 97.1 5.3 12.6 1.3 4.1 0.3 12.3
20 3 10 5 5 94.8 3.4 16.9 2.0 5.2 0.6 16.3
21 3 11 3 8 93.0 5.2 15.7 2.9 10.4 0.9 15.2
22 3 10 7 3 95.4 5.1 15.8 2.1 7.5 0.7 15.1
23 3 6 3 3 95.9 5.0 14.8 1.6 4.3 0.7 14.1
24 3 11 5 6 95.3 5.0 15.4 3.8 12.7 1.1 14.3
25 3 14 12 2 96.4 4.4 16.1 1.8 5.7 0.5 15.6
26 3 15 2 12 91.7 4.6 12.2 2.1 6.6 0.6 11.6
27 3 10 4 6 95.0 3.7 14.7 1.7 5.6 0.5 14.2
28 3 12 6 6 94.0 5.8 12.7 2.3 7.9 0.7 12.0
29 3 10 5 5 93.9 5.1 14.2 1.7 5.2 0.6 13.6
91
92
93
94
95
96
97
98
8.0 10.0 12.0 14.0 16.0 18.0
(µ - SE)CIV
%C
Soil #3
Soil #5
Figure 4-9. ( )CIVSEˆ −μ vs. %C
12.2 11.6
12.6 12.3
FP
FP
TN TN
FP

56
The Clegg Hammer QA specification would be stated as Equation (4).
9.11ˆn
1ˆCIV
>⎟⎟⎠
⎞⎜⎜⎝
⎛σ−μ (4)
Assume a QA inspector conducted 15 Clegg Hammer tests on an MSE earthwork section and
that the QA test results are identical to test bed 19 data in Table 4-B. The ( )CIVSEˆ −μ = 12.3 for
test bed 19, and therefore would pass inspection. Conversely if test bed 26 were used, ( )CIVSEˆ −μ
= 11.6 and it would fail inspection.
The influence of moisture on CIV was also evaluated. The results in Figure 4-10 suggest that
CIV decreases with increasing moisture; however, the correlation is not strong. Moving forward
with CIV TVs, the moisture influence requires further monitoring.
8.0
9.0
10.0
11.0
12.0
13.0
14.0
15.0
16.0
3.5 4.0 4.5 5.0 5.5 6.0 6.5 7.0 7.5Average Moisture Content (%)
(µ -
SE
)CIV
Soil #3
Soil #5
Figure 4-10. Average Moisture Content vs. ( )CIVSEˆ −μ
Target Value = 11.9

57
DCP Target Value – DCP data collected on 14 test beds was evaluated to help identify a TV
DPI (see Table 4-C). For each test bed, 3 to 15 DCP tests were conducted and DPI values were
determined. Recall that each DPI reflects the average DPI (less the first two seating drops) over
a 200 mm penetration depth to match with lift thickness. This depth of analysis can be modified
to accommodate thicker or multiple lifts. Figure 4-11 illustrates the relationship between
( )DPISEˆ −μ and %C. The 95 %C line and proposed DPI TV = 10.2 are highlighted. The TV DPI
= 10.2 produced 3 FPs and 2 TNs.
Table 4-C. DCP Data Summary
DCP Statistical Parameters Test Bed
Soil # n np nf %C w (%)
μ σ R SE μ - SE 7 3 15 5 10 93.5 5.2 11.5 2.0 7.7 0.5 11.0
9 3 5 5 1 96.4 6.8 16.8 2.6 6.6 1.1 15.7
10 3 5 5 0 97.6 6.5 12.7 2.4 6.3 1.1 11.6
11 4 11 11 0 97.1 6.1 11.2 1.5 5.8 0.8 10.4
12 3 3 3 0 96.3 7.0 11.1 0.4 1.3 0.2 10.9
13 4 6 5 1 96.0 5.7 16.6 1.9 4.6 2.1 14.5
14 4 9 7 2 97.2 5.7 12.9 2.6 6.9 1.3 11.6
15 4 3 1 2 95.3 3.6 15.9 3.5 6.8 3.0 12.9
16 5 6 4 2 95.8 6.3 12.6 1.3 3.4 1.7 10.9
17 5 5 2 3 93.9 5.7 14.3 3.6 8.7 2.7 11.6
18 5 6 6 0 96.5 4.6 10.3 0.8 2.1 1.3 9.0
19 5 15 12 3 97.1 5.3 9.9 1.5 5.5 0.8 9.1
20 3 10 5 5 94.8 3.4 6.9 1.0 2.8 0.3 6.6
21 3 4 1 3 94.2 4.3 8.3 1.1 4.0 0.6 7.7
The influence of moisture on DPI data was also evaluated. Figure 4-12 suggests that a
correlation exists between DPI and moisture. As the moisture increases, DPI decreases. These
results imply that moisture dependence should be factored into DPI TVs, and that QA personnel
must measure moisture along with DPI to evaluate acceptance. From a practical perspective, this
constitutes a limitation of DCP testing.

58
93
94
95
96
97
98
6.0 8.0 10.0 12.0 14.0 16.0 18.0
(μ - SE)DPI
%C
Soil #3
Soil #4
Soil #5
Figure 4-11. ( )DPISEˆ −μ vs. Percent Compaction
6.0
8.0
10.0
12.0
14.0
16.0
3.0 3.5 4.0 4.5 5.0 5.5 6.0 6.5 7.0 7.5Average Moisture Content (%)
(μ -
SE
)DPI
Soil #3
Soil #4
Soil #5
Figure 4-12. Average Moisture Content vs. ( )DPISEˆ −μ
11.2 10.4
FP
FP
TN
TN
Target Value = 10.2

59
4.3 Conclusions Extensive testing on MSE wall and bridge approach earthwork compaction revealed that LWD,
The DCP and Clegg Hammer are both capable of reflecting the compacted state of Class 1
structure backfill soil. In fact, ELWD, CIV and DPI are much more sensitive to changes in
compaction than density. While dry density ranged by 20% from typical uncompacted to fully
compacted states, ELWD, CIV and DPI were found to vary by 500%, 400% and 1000%
respectively. The LWD, DCP, and Clegg Hammer are all capable of evaluating soil properties
within 0.3 m (1 ft) of the wall face. Testing with all devices revealed that adequate compaction is
not being achieved within 1 m (3-4 ft) of MSE wall faces. This is attributed to the compaction
procedure where contractors are reluctant to use vibratory rollers within 1 m (3 ft) of the wall.
The vibratory plates used in this zone are not providing adequate compactive effort. The
inadequate compaction in this zone is exacerbated by the measurement restriction of the NG
within 1.6 m (5 ft) of the wall.
An evaluation of the data reveals that target values (TVs) exist for ELWD, CIV and DPI that
could serve as surrogates for the current 95 %C density requirement. Over multiple sites, test
beds and Class 1 backfill soils, consistent TVs emerged. The observed TVs for ELWD, CIV and
DPI were found to be 32.5 MPa, 11.9 and 10.2 mm/blow. Within the scatter of the data, the TVs
did not vary across the different Class 1 backfill soils. DPI values appear to be sensitive to
moisture while ELWD seem to be insensitive to moisture for these soils tested. The moisture
sensitivity of CIV was inconclusive. Moisture sensitivity constitutes a limitation to implementing
the TV approach in the absence of NG testing because moisture would need to be measured.
Currently, LWD, DCP and Clegg Hammer devices do not include moisture measurement.
The DCP exhibited two limitations. Because the DCP test involves penetration through the soil,
the DPI is influenced by the placed geogrid (MSE walls) and geofabric (bridge approach).
Second, the moisture sensitivity of DPI requires consideration of moisture in developing TVs
and evaluating acceptance. When compared to the LWD and Clegg Hammer results where
moisture sensitivity was not clearly observed, DCP implementation requires more work.

60

61
CHAPTER 5: CONCLUSIONS AND RECOMMENDATIONS
5.1 Findings A number of devices were investigated for use in MSE wall and bridge approach earthwork
quality assurance (QA). If capable, one or more devices would be selected to supplement nuclear
gage (NG) testing in the short term, and possible replace NG testing in the long term. Of the six
devices initially explored through literature review and a study of best practices nationally, three
were selected for field assessment, namely the DCP, LWD, and Clegg Hammer. Field testing
with the LWD, Clegg Hammer, DCP, and NG was performed at two construction sites in
Colorado and included 30 test beds and 5 Class 1 structure backfill soils.
While not the objective of the study, extensive field testing revealed that the current CDOT
practice of single position NG testing is inadequate. The uncertainty in single position NG
density was found to be equivalent to ± 3-4 percent compaction (%C). The orientation of the
device alone (e.g., north, south, east, west) often determined whether a passing (> 95 %C) or
failing (< 95 %C) density was achieved. Moreover, soil is heterogeneous, and soil density, shear
strength and modulus vary spatially. This heterogeneity should be accounted for through a
statistically-based QA approach.
Extensive testing on MSE wall and bridge approach earthwork compaction sites revealed that the
LWD, DCP, and Clegg Hammer are all capable of reflecting the compacted state of Class 1
structure backfill soil. ELWD, CIV and DPI are much more sensitive to changes in compaction
than density. While dry density ranged by 20% from typical uncompacted to fully compacted
states, ELWD, CIV and DPI were found to vary by 500%, 400% and 1000% respectively. Testing
with all devices revealed that adequate compaction is not being achieved within 1 m (3-4 ft) of
MSE wall faces. This is attributed to the compaction procedure where contractors are reluctant to
use vibratory rollers within 1 m of the wall. The vibratory plates used in this zone are not
providing adequate compactive effort. The inadequate compaction in this zone is exacerbated by
the measurement restriction of the NG within 1.6 m (5 ft) of the wall.

62
An evaluation of the data reveals that target values (TVs) exist for ELWD, CIV and DPI that
could serve as surrogates for the current 95 %C density requirement. Over multiple sites, test
beds and Class 1 backfill soils, consistent TVs emerged. The observed TVs for ELWD, CIV and
DPI were found to be 32.5 MPa, 11.9 and 10.2 mm/blow. Within the scatter of the data, the TVs
did not vary across the different Class 1 backfill soils. DPI values appear to be sensitive to
moisture while ELWD seem to be insensitive to moisture for these soils tested. The moisture
sensitivity of CIV was inconclusive. Moisture sensitivity constitutes a limitation to implementing
the TV approach in the absence of NG testing because moisture would need to be measured.
Currently, LWD, DCP, and Clegg Hammer devices do not include moisture measurement.
Table 5-A summarizes the key attributes and capabilities of the LWD, DCP, and Clegg Hammer.
The LWD, DCP, and Clegg Hammer are all capable of evaluating soil properties within 0.3 m (1
ft) of the wall face. This is a significant advantage over the 1.6 m (5 ft) wall proximity restriction
of the NG, particularly in light of the inadequate compaction observed and measured within 1 m
of MSE walls. The ELWD is most closely aligned with design parameters (e.g., modulus) for
pavements, while CIV is an index parameter that is currently not linked to design parameters.
The DCP exhibited two key limitations. Because the DCP test involves penetration through the
soil, the DPI is influenced by the placed geogrid (MSE walls) and geofabric (bridge approach).
In addition, the moisture sensitivity of DPI values requires consideration of moisture in
developing TVs and evaluating acceptance. When compared to the LWD and Clegg Hammer
results where moisture sensitivity was not clearly observed, DCP implementation requires
additional effort.
The LWD and Clegg Hammer are both deemed suitable QA devices for MSE wall and bridge
approach Class 1 structure backfill QA. They were found to be equally effective in capturing the
degree of compaction. The Clegg Hammer is less expensive and easier to use than the LWD.
Conversely, the LWD produces a modulus that can be tied to design and there is significant
momentum nationally towards LWD use. As described in Section 5.2, we recommend that
CDOT continue to consider these two devices.

63
Table 5-A. Summary of Device Capabilities LWD Clegg Hammer DCP Depth of investigation
30-45 cm (12-18 in) with 300 mm plate diameter; 20-30 cm (8-12 in) with 200 mm plate diameter
14-26 cm (5-10 in) Any depth up to 120 cm (48 in)
Testing & transport time
4 minutes (1 person) 2 minutes (1 person) 5 to 15 minutes (2 people)
Cost $8,000 - $15,000 $3,000 - $3,500 Manual $600 - $1,000 Proximity to wall for testing
20 cm (8 in) 13 cm (5 in) 20 cm (8 in)
Strengths - Provides actual deflection and modulus which could be used in design or performance based QA - Has been implemented in other states (MN) and in Europe - Gaining momentum in DOT community as pavement evaluation and design tool - Multiple size loading plates enable measurement over range of modulus and depth - ELWD was found to be insensitive to moisture for Class 1 structure backfill
- Simplest device to operate & transport around on site - Relatively low cost - CIV was found to be insensitive to moisture for Class 1 structure backfill - CIV has the potential to be linked to design parameters
- Simple design, robust construction, good portability - Well studied and documented track record - Successfully used in other states (MN, TX, IN) and in military
Weaknesses - Sensitivity to changes in compaction not well developed - Can be difficult to transport - Relatively high cost
- Limited published information and data - CIV is not an engineering property and correlations are limited
- DPI is influenced by geogrid and geofabric of MSE wall and bridge approaches - Deeper testing in dense material is time consuming - Large aggregate may cause erroneous results - DPI was found to be moisture sensitive for Class 1 structure backfill

64
5.2 Recommended Approach for CDOT Adoption and Further Study The following three recommendations stem from the findings in this study. If CDOT decides to
pursue these recommendations, is important that CDOT personnel play an integral role in
carrying out the suggested tasks.
5.2.1 Revise NG Testing Procedure
As described in Section 5.1, single position NG testing is inadequate given the significant
variability in earthwork soil properties. To better represent the variability in soil density and to
minimize uncertainty in reported data, we recommend that CDOT increase the required number
of tests per lot (evaluation area). A specific number is not recommended here as it was not the
focus of this study; however, an approach similar to that recommended in Section 5.2.3 could be
pursued. At an absolute minimum, CDOT could improve the current procedure with no
additional time/cost by modifying the current inspection practice from a single position 4 minute
reading to a four position NG test (i.e., north, south, east, west) with each position as a 1-minute
reading. A revised approach could be investigated within the pilot implementation of new
devices as described below.
5.2.2 Implement LWD and Clegg Hammer Pilot Study to Supplement NG-Based QA
We recommend that CDOT implement a pilot study using the LWD and Clegg Hammer in
conjunction with NG testing on 5-10 MSE wall and/or bridge approach construction sites. The
objectives of the pilot program are multiple: (1) identify ELWD and CIV target values (TVs) for
the various soils, site & moisture conditions, seasons, etc., observed in practice; (2) evaluate
if/how TVs change with soil type, moisture, season, and from site to site; (3) populate a database
of TVs; (4) allow a range of CDOT inspectors, consultants and contractors to evaluate all aspects
of the devices, e.g., handling, operation, durability, portability. Ultimately, CDOT personnel will
determine which device best fits their needs. Therefore, it is critical that CDOT personnel buy
into and support the pilot study.
The recommended pilot implementation procedure is as follows. LWD and/or Clegg Hammer
testing should be performed at a minimum of 8 locations within a lot. Note that LWD and Clegg
testing is much faster than NG testing (see Table 5-A). Recommended MSE wall and bridge

65
approach lot sizes are summarized in Table 5-B and illustrated in Figure 5-1. At least 25% of the
spot tests should be performed within 1 m (3-4 ft) of the MSE wall or bridge abutment and
individual tests should be well-spaced to capture the variability in soil properties.
NG testing should be performed on these lots. The frequency of NG tests may be reduced to a
minimum of 4. Each NG test should employ the 4-position approach described in Chapter 4. The
average NG density per lot should be used to evaluate acceptance. Similarly, the ELWD and CIV
data can be evaluated to identify TVs, etc.
Table 5-B: On-site Testing Protocol of Pilot Study
MSE wall Bridge approach Lot size Approx. 30m x 8m (100’ x 25’) Approx. 12m x 6m (40’ x 20’)
Number of tests Minimum of 8 Minimum of 8 Proximity to wall 25% within 1m (3’) of wall 25% within 1m (3’) of abutment
Proximity of test locations Tests no closer than 2m (6’) Tests no closer than 2m (6’) Test distribution Evenly distributed along wall length Along full lane width
Figure 5-1. Recommended Test Lot for Pilot Study

66
5.2.3 Develop Specification for LWD and/or Clegg Hammer Use as a Supplement or Replacement for NG The recommendation detailed in Section 5.2.2 will reveal the efficacy of the LWD and Clegg
Hammer as a supplement or replacement for the NG in earthwork QA. In addition, the results of
the pilot study combined with the findings herein will lead to specific guidelines for TVs,
number of required tests, statistical approach to data analysis and acceptance criteria, lot size,
etc. A specification can then be written to replace the appropriate sections of the CDOT Bridge
Project Special Provisions, the Standard Specifications for Road and Bridge Construction, and
the Field Materials Manual.

67
REFERENCES
1) Abu-Farsakh, M., Alshibi, K., Nazzal, M., Seyman, E., 2004, “Assessment of In-Situ
Test Technology for Construction Control of Base Courses and Embankments,” Louisiana Department of Transportation and Development: Louisiana Transportation Research Center, Baton Rouge, LA.
2) Adam, D., Adam, C., Kopf, F., 2004, “The dynamic load plate test with the Light Falling
Weight Device: Experimental and numerical investigations” In Proc. of The 11th International Conference on Soil Dynamics & Earthquake Engineering (11th ICSDEE) and The 3rd International Conference on Earthquake Geotechnical Engineering (3rd ICEGE), University of California, Berkeley, USA, 7th - 9th January 2004.
3) Adams, A. R., 2004, “Assessment of Rapid Methods for Density Control of MSE Walls
and Embankments,” [Masters Thesis]: University of Texas at Austin, 178 pp.
4) Ayers, P.D. and Bowen, H.D., 1988, “Laboratory Investigation of Nuclear Density Gauge Operation.” Transactions of the ASAE. American Society of Agricultural Engineers. March 1988.
5) Bevington, P.R. and Robinson D.K., 2003, Data Reduction and Error Analysis for the
Physical Sciences. 3rd Edition, McGraw-Hill, Boston.
6) Colorado Dept of Trans. 2005 Standard Specifications for Road and Bridge Construction. available online at http://www.dot.state.co.us/DesignSupport/Construction/Index.htm
7) Colorado Dept of Trans. 2007 Field Materials Manual. available online at
http://www.dot.state.co.us/DesignSupport/Field%20Materials%20Manual/2007/2007%20Field%20Material%20Manual%20Index.htm
8) Colorado Dept of Trans. Bridge Project Special Provisions. Section 504. available online
at http://www.dot.state.co.us/Bridge/ProjectSpecials/Project_Specials.htm
9) Durham GeoSlope Indicator Inc., 2006, “Moisture + Density Indicator (M+DI)” product brochure. Stone Mountain, GA. accessed online 28 Nov 06 at http://www.durhamgeo.com/pdf/m_test-pdf/soil/M%2BDI%20Brochure.pdf
10) Erchul, R.A. and Meade, R.B., 1994, “Using an Impact Hammer to Evaluate
Compaction.” Chesterfield County, VA.
11) Fleming, P.R., Frost, M.W., and Lambert, J.P., 2007, “A Review of the Lightweight Deflectometer (LWD) for Routine Insitu Assessment of Pavement Material Stiffness”, Transportation Research Record 2004, Soil Mechanics, pp. 80-87.
12) Gas Technology Institute (GTI), 2004, “Evaluation of Soil Compaction Measuring
Devices.” GRI Report No. 04/0067. Gas Research Institute. Des Plaines, IL. April 2004.

68
13) Hoffmann, O., Guzina B., Drescher A., May 2003. “Enhancements and Verification Tests for Portable Deflectometers.” Report No. MN/RC – 2003-10, Minnesota Department of Transportation, St Paul, MN.
14) Humboldt Manufacturing Inc., 2006, “GeoGauge” product brochure. Northridge, IL.
accessed online 28 Nov 2006 at http://www.humboldtmfg.com/pdf/H-4140GeoGauge.pdf
15) ISSMGE, 2005, “Geotechnics for pavements in transportation infrastructure” Roller-Integrated Continuous Compaction Control (CCC), Technical Contractual Provisions – Recommendations, International Society for Soil Mechanics and Geotechnical Engineering.
16) Kremer, K., and Dai, S., 2004. “Improvement and Validation of Mn/DOT DCP
Specification for Aggregate Base Materials and Select Granular Task 3: Field Testing.” Minnesota Department of Transportation, Office of Materials, Maplewood, MN.
17) Lafayette Instrument, 2006, “Clegg Hammer Impact Tester” accessed online 28 Nov 06
at http://www.lafayetteclegg.com/
18) Lenke, L. R., McKeen, R. G., Grush, M., 2001, “Evaluation of a Mechanical Stiffness Gauge for Compaction Control of Granular Media,” New Mexico State Highway and Transportation Department Research Bureau, Albuquerque, NM.
19) Lin, D.F., Liau, C.C., Lin, J.D., 2006. “Factors Affecting Portable Falling Weight
Deflectometer Measurements.” J. Geotech. & Geoenv. Engineering, Vol. 132, No. 6.
20) Minnesota Dept of Trans. 2002 Grading and Base Manual. available online at http://www.mrr.dot.state.mn.us/pavement/gradingandbase/copy%20(2)%20of%20gradingandbase.asp#grading%20and%20base%20manual
21) Minnesota Dept of Trans. Pilot Spec 2105 “Excavation and Embankment QC/QA – LWD
Quality Compaction.” available online at http://www.dot.state.mn.us/materials
22) Minnesota Dept of Trans. Specification 5-692.255 “Modified Dynamic Cone Penatrometer” available online at http://www.dot.state.mn.us/materials
23) Mooney, M.A. and Miller, P.K. "Analysis of Light Falling Weight Deflectometer Test
based on In-situ Stress and Strain Response," J. Geotech. & Geoenv. Engineering, ASCE, 134(10), 2008, in press.
24) Nazarian, S., Yuan, D., Tandon, V., Arellano, M., 2005, “Quality Management of
Flexible Pavement Layers with Seismic Methods,” Research Report 0-1735-3, Center for Transportation Infrastructure Systems, University of Texas at El Paso.

69
25) Salgado, R. and Yoon, S., 2003, “Dynamic Cone Penetration Test (DCPT) for Subgrade Assessment.” Joint Transportation Research Program. Proj. No. C-36-45S. Published by Purdue University. West Lafeyette, IN. February 2003.
26) Siekmeir, J.A., Mn/DOT engineer, personal communication, 17 July 2008.
27) Siekmeier, J.A., Young, D., Beberg, D., 2000, “Comparison of the Dynamic Cone
Penetrometer with Other Tests During Subgrade and Granular Base Characterization in Minnesota,” Nondestructive Testing of Pavements and Backcalculation of Moduli: Third Volume, ASTM STP 1375, S.D. Tayabji and E. O. Lukanen, Eds., American Society for Testing and Materials, West Conshohocken, PA.
28) Siddiqui, S.I., and Drnevich, V.P., 1995, “A new method of measuring density and
moisture content of soil using the technique of Time Domain Reflectometry.” Rep No.:FHWA/IN/JTRP-95/9, Joint Transportation Research Program, Indiana Dept of Transportation-Purdue University.
29) Troxler Electronic Laboratories Inc., 2006, “RoadReader ™ Nuclear Density Guages.”
product brochure. Research Triangle Park, NC. accessed online 28 Jul 2008 at http://www.troxlerlabs.com/pdf%20files/3430_40bro.pdf
30) Vertek, a Division of Applied Research Associates Inc., 2006, “Dynamic Cone
Penetrometer with Data Acquisition System.” product brochure. Randolph, VT. accessed online 28 Nov 06 at http://vertek.ara.com/product%20brochures/dcp%20das.pdf
31) Von Quintus, H.L., Rao, C., Minchin, Jr., R.E., Maser, K.R., Nazarian, S., Prowell, B.,
2005. “Nondestructive Testing Technology for Quality Control and Acceptance of Flexible Pavement Construction, Phase II, Part A – Interim Report Task 6.” National Cooperative Highway Research Program, Transportation Research Board, National Research Council, NCHRP Project 10-65.
32) Wang, T., CDOT engineer, personal communication, 10 May 2006.
33) White, D.J., Vennapusa, P., Jahren, C.T., 2004, “Determination of the Optimum Base
Characteristics for Pavements.” Iowa DOT Project TR-482, Iowa Department of Transportation, Ames, IA.