Improving Fertilizer Markets in West Africa: The ... · Promoting and Improving Smallholder...
38
Improving Fertilizer Markets in West Africa: The Fertilizer Supply Chain in Ghana
Transcript of Improving Fertilizer Markets in West Africa: The ... · Promoting and Improving Smallholder...

Improving Fertilizer Markets in West Africa: The Fertilizer Supply Chain in Ghana

Improving Fertilizer Markets in West Africa: The Fertilizer Supply Chain in Ghana
P.A. Fuentes, B. Bumb and M. Johnson
International Fertilizer Development Center (IFDC) and
International Food Policy Research Institute (IFPRI)
December 2012

Preface
African governments, in response to the recent oil and food crisis and to Resolution 5 of the Abuja Declaration on Fertilizer for an African Green Revolution,1 have been induced to [re-]introduce subsidies as a short-term solution to artificially reduce fertilizer prices and increase its use. Yet, if these subsidies are not managed properly and are implemented in a constrained environment that contributes to inefficiencies and higher fertilizers costs, the introduction of subsidies not only adds to market distortions but also to higher fiscal burdens. Therefore, a primary motivation for this study is to identify key constraints along the fertilizer supply chain and recommend policies to expand fertilizer markets through more efficient distribution and to lower the fiscal burden on governments that seek to effectively increase fertilizer use in their country and in the West Africa (WA) region.
To carry out this work, four country case studies were undertaken in 2009 and 2010 to assess the fertilizer supply chain in West Africa. The countries included are Ghana, Mali, Nigeria and Senegal. Field visits were made to each country to assess the domestic supply chain, including fertilizer distribution channels and their associated supply cost structure in order to identify key constraints, analyze them and ultimately recommend policies necessary to effectively remove such constraints, or at least reduce their negative impact along the domestic supply chain.
This document, part of a series of case studies for the WA region, is based on data and information collected during the country visit to Ghana for a rapid appraisal, complemented by a literature review and an analysis of secondary data.2 In addition, this and the other country assessments are the basis for and a complement to the document “Policy Options for Improving Regional Fertilizer Markets in West Africa” by Bumb, Johnson and Fuentes (IFDC/IFPRI, 2011), which has a broader regional perspective.
Opinions expressed in this paper are those of the authors and not of the International Fertilizer Development Center (IFDC) or the International Food Policy Research Institute (IFPRI).
1 Resolution 5 of the 2006 Abuja Declaration on Fertilizer for an African Green Revolution calls for African governments to improve small/ poor farmer’s access to fertilizer through targeted subsidies in favor of the fertilizer sector.
2 Fertilizer cost and subsidy data analysis refer to the situation prevailing in 2008 and 2009.
ii
Acknowledgments
This study would not have been possible without the collaboration of numerous private organizations, government agencies and individuals who assisted IFDC during field visits to Ghana. In particular, the authors wish to acknowledge the assistance and collaboration of Patrice Annequin, IFDC market information specialist, based in Ghana; Jean Claude Camaleonte, consultant; and other regional personnel who contributed to accomplish the tasks set forth during the implementation of this study.
Both IFDC and IFPRI wish to thank the Bureau for Africa of the United States Agency for International Development (USAID/AFR/SD) for making the study possible through its financial support.
Authors
Porfirio A. Fuentes, IFDCSenior Scientist – Economics (Trade)[email protected]
Balu Bumb, IFDCConsultant, Policy & Trade Specialist [email protected]
Michael Johnson, IFPRIResearch Fellow, [email protected]
iii

Table of Contents
Introduction 1 The Fertilizer Supply Chain in Ghana 1 Methodology 2Evolution of Fertilizer Supply and Use in Ghana 3 Overview 3 Trends in Fertilizer Use Intensity 4Fertilizer Marketing Structure and Distribution System 5 Market Players 5 Distribution Channels 6Analysis of the Fertilizer Supply Chain Cost Structure 6 Fertilizer Cost Structure 9 Finance Cost 11 Marketing and Distribution Margin 11 Domestic Transportation Cost 11 Port Charges 11 Government Charges 12Identifying Key Constraints and Bottlenecks 13 High Costs and Inefficiencies at the Port 13 High Marketing Costs and Margins 14 High Finance Costs and Poor Access to Credit 14 Obsolete Domestic Infrastructure: Transportation Equipment and Degraded Roads 15 Undeveloped Domestic Distribution/Retail Network 15 Low Farmers’ Demand 16Policy Implications and Recommendations 16 Providing a Conducive Policy Environment 16 Strengthening the Institutional and Regulatory Environment 17 Improved Investments in Infrastructure and Transportation 17 Promoting Expansion of Rural Input Dealer Networks and Market Information 18 Promoting and Improving Smallholder Agricultural Intensification 18References 25Annex. The 2009 and 2010 Fertilizer Subsidy Program 26
iv
List of Figures
Figure 1. Ghana Fertilizer Supply Cost Structure and Players’ Functions in the Domestic Supply Chain 2Figure 2. Ghana and WA Regional Average Fertilizer Consumption per Hectare 5Figure 3. Ghana Regions and Geographic Distribution of Input Retailers 7Figure 4. General Fertilizer Distribution and Marketing Structure in Ghana 8Figure 5. Ghana Fertilizer Cost Components per Metric Ton in US $/mt, 2009 10Figure 6. Fertilizer Domestic Cost Components per 50-kg Bags in Ghana in US $/Bag, 2009 10Figure 7. Fertilizer Cost Components in US $/50-kg Bag to Different Locations in Ghana, 2009 12Figure 8. Performance of Fertilizer Supply Chain in Ghana, 2009 13
List of Tables
Table 1. 2009 Fertilizer Prices and Coupon Values in Ghana 9Table 2. Fertilizer Price Evolution in Ghana 2004-09 9Table 3. Summary Matrix of Key Constraints and Policy Recommendations 20
v

Acronyms
AMITSA Regional Agricultural Input Market Information and Transparency System
AS ammonium sulfate
CEPS Customs, Excise and Preventive Service
c.i.f. cost, insurance and freight
COCOBOD Ghana’s Cocoa Board
ECOWAS Economic Community of West African States
EPA Environmental Protection Agency
ERP Economic Recovery Program
FAO Food and Agriculture Organization of the United Nations
f.o.b. free on board
GAIDA Ghana Agricultural Input Dealers Association
GHC Ghana Cedi (Currency)
GoG Government of Ghana
GS&CT Ghana Shipper and Council Tax
ha hectare
IFPRI International Food Policy Research Institute
IRS Internal Revenue Service
JICA Japan International Cooperation Agency
kg kilogram
KRII Kennedy Round II
MoFA Ministry of Food and Agriculture
MOP muriate of potash
mt metric ton
mtpy metric ton per year
R&D research and development
SOP sulfate of potash
SRID Statistics Research and Information Directorate
SSP single superphosphate
TSP triple superphosphate
USAID/AFR/SD Bureau for Africa of the United States Agency for International Development
WA West Africa
vi
1
Introduction The main focus of this study is on the marketing/distribution networks and cost structure of the domestic supply chain in the Ghanaian fertilizer market. The premise of this assessment is that high fertilizer prices paid by farmers are the result of high transaction costs along the domestic supply chain (in addition to international prices and transportation), perhaps due to an inefficient distribution structure and ineffective marketing – factors that are also constraining consumption and demand. Although we recognize the intricate nature of supply and demand and the importance of addressing other factors that are also affecting demand and therefore the expansion of the fertilizer market, those factors will not be addressed in this report. However, some of the recommendations made in this document to address issues on the supply side of fertilizer market to ultimately reduce its price will also have an effect on demand.
The fertilizer market in Ghana is the fourth largest in the WA region, representing an average of about 10.6 percent of the total fertilizer consumed (in nutrients base) in the Economic Community of West African States (ECOWAS) after Nigeria, Burkina Faso and Côte d’Ivoire, for the years 2005-2009 average. Yet the average nutrient fertilizer application rate estimated at 7.3 kilograms/hectare1 (kg/ha) in 2009 (FAOSTAT, 2011) is high relative to the 2009 regional average of almost 4.0 kg/ha. Over half of the fertilizer imported in Ghana is consumed by export crops (MoFA/SRID, 2009). In fact, findings of this assessment, based on data collected during the country visit, indicate that in 2009 out of 218,000 metric tons (mt) of fertilizer consumed in Ghana, 51 percent was for the production of export crops (e.g., cocoa, cotton, horticultural crops, oil palm, sugarcane) that covered about 60 percent of cultivated area while the rest of the fertilizer (49 percent) was utilized for the production of staple food crops (e.g., cassava, maize, millet, planting,
1 The application rate is estimated as a ratio of total fertilizer consumption and total arable land and permanent crops based on FAOSTAT 2011 data. However, recent household survey data from IFPRI show higher nutrient use of 13.4 kg/ha for 2010, a rate that may be more consistent with the subsidy program implemented since 2007-08.
rice, sorghum and yams) that covered about 40 percent of cultivated area. This level of fertilizer consumption for the production of food crops represented an increase relative to previous years, thanks to the fertilizer subsidy introduced by the government of Ghana (GoG) in response to the 2007-08 oil and food crises, which played a part in the fertilizer domestic price increase.
Ghana imports the bulk of its fertilizer, and given the relative small size of its domestic market the country is a ‘price-taker’ in the international market. Thus, the upward price fluctuation in the international market resulting from the oil and food crises, explains in part the high price farmers pay for fertilizer in the domestic market. Additionally, there is evidence suggesting that in Ghana there are market constraints throughout the domestic supply chain that contribute to a nearly 50 percent increase in the total domestic fertilizer cost, doubling the price farmers ultimately pay relative to the international/border price. Consequently, the objective of this study is to identify what these constraints are and to what extent domestic costs could be lowered to achieve more affordable fertilizer if such constraints are removed. This study is also intended for the reader to gain a better understanding of the fertilizer market distribution and supply cost structure in Ghana. The report will identify the different cost components along the supply chain, the factors contributing to an increase in fertilizer costs and will shed light on potential ways to cut distribution costs, improve efficiency along the supply chain and reduce fertilizer prices paid by farmers in Ghana.
The Fertilizer Supply Chain in Ghana Figure 1 (page 2) provides a general schematic view of the domestic fertilizer supply chain cost structure and highlights the role of the various actors along the chain, as well as the policy, socio-economic and physical environments that may influence their evolution. According to Figure 1 (page 2), costs that arise from the different steps along the domestic fertilizer supply chain contribute to the final price paid by farmers. The final cost is affected by limited access to finance and strict collateral requirements; high interest rates in the domestic banking system; poor
Improving Fertilizer Markets in West Africa: The Fertilizer Supply Chain in Ghana

2
infrastructure and market coordination inefficiencies; poor rural road conditions; weak and underdeveloped retail marketing networks; and weak institutional and regulatory environment. Improving these factors will positively affect the functioning of the fertilizer supply chain and reduce transaction costs while improving its efficiency; consequently, the need for subsidies could be reduced. Additionally, in the event that a subsidy is still required, the improved efficiency along the supply chain would lower the ultimate cost of the subsidy program and therefore reduce its fiscal burden.
MethodologyTo accomplish our objective, this study involved gathering a combination of qualitative information and quantitative data through field visits and interviews with private sector traders and government agencies involved in fertilizer procurement and distribution in Ghana. The information was explicitly gathered to identify the distribution channels and assess the cost structure along the domestic fertilizer supply chain from importation to the point of sale to the
Note: The pyramid illustrates the cost structure, the number of actors and their functions along the supply chain.Source: IFDC
Figure 1. Ghana Fertilizer Supply Cost Structure and Players’ Functions in the Domestic Supply Chain

3
final consumer. To facilitate the collection of data and information, a local consultant on Ghanaian fertilizer markets was hired to assist with the coordination of country visits and interviews. Data collection involved informal (semi-structured) and formal interview methods. Informal methods were used to gather qualitative information and documentation on the domestic distribution and cost structure of the fertilizer supply chain, including known constraints and inefficiencies. Formal interviews were conducted to gather cost and price information on the main components of the domestic fertilizer supply chain. This document is organized as follows. First, overall trends of fertilizer markets in Ghana are reviewed in terms of consumption, production and trade (page 3). This is followed by a detailed assessment of the fertilizer distribution structure based on in-country surveys (page5 ), with particular attention given to analyzing the domestic fertilizer distribution performance and conduct (page 6). The information on page 13 identifies key constraints and bottlenecks along the supply chain before concluding with policy recommendations needed to address such constraints (page 16). Finally, the Annex (page 26) provides a brief general description of the fertilizer subsidy program in Ghana during 2009 and 2010.
Evolution of Fertilizer Supply and Use in GhanaOverviewMineral fertilizers were first introduced in Ghana in the early part of the 20th century. Before 1960, fertilizer products commonly imported and used were ammonium sulfate (AS), single superphosphate (SSP), triple superphosphate (TSP), muriate of potash (MOP) and sulfate of potash (SOP). Compound fertilizers were introduced in the early 1960s for cereal production, consisting of variations of N-P-K formulations. Urea, on the other hand, was introduced in the late 1980s as a substitute for AS to reduce soil acidification and the per-unit cost of nitrogen nutrient application. Through time, in response to changes in economic conditions and soil fertility, other formulations – mainly blended products – were introduced into the country, in most cases targeted to a particular crop; e.g., Yara’s 0-22-18 blend for cocoa and more recently “Activa™” blend (23-10-05 + 3S + 2MgO + 0.3Zn) for maize and other cereal production. Prior to the 1980s, the amount of fertilizer imported into Ghana was below 60,000 product mt per year (mtpy). By 1986, imports declined to less than
20,000 mtpy, due in part to macro-economic reforms that resulted in the elimination of subsidies, currency devaluation that made imports more expensive and the lack of available foreign currency. Based on data gathered from the Ministry of Food and Agriculture (MoFA), adjusted and modified by IFDC, fertilizer imports increased to 56,000 mtpy by the late 1990s following the improvement of the economy, and by 2003 imports peaked at almost 93,000 mtpy before taking a dive in 2004 to 56,000 mtpy, and then rose to 137,000 mtpy by 2006. According to MoFA data, despite the crisis of 2008, fertilizer imports suffered a small decline of approximately 10 percent relative to the previous year and then reached the all-time maximum of 218,000 product mtpy in 2009, out of an estimated potential that oscillates between 250,000 and 300,000 mtpy. The slow decrease in imports during 2008 and the spike of 2009 can be attributed to an aggressive GoG agricultural support program to incentivize the use of fertilizer through subsidized coupons to make it more affordable. Prior to market liberalization, the public sector was directly involved in fertilizer importation and distribution. By 1991, the private sector began direct importation of fertilizer as a result of structural and economic reforms and associated market liberalization measures implemented in the early 1980s. By the end of 1992, after a gradual phase-out of government direct participation in the market, fertilizer importation and distribution were fully privatized, most agricultural price controls were lifted and subsidies on agricultural inputs were terminated. As a consequence, most fertilizer imports and distribution in Ghana are currently done through private sector channels. At the same time, the density of independent private operators has increased, particularly at the retail end of the supply chain. Following the implementation of market liberalization measures, there was a surge of small businesses entering the fertilizer and agro-input markets, attracted by an almost immediate profit-making opportunity offered by the importation and distribution of fertilizer. Eventually, the number of participating businesses was substantially reduced by market forces to fewer players, especially at the import level. Currently, there are just a few importers and independent traders, accounting for more than 95 percent of fertilizer imports. The limited number of players in the upstream fertilizer market is attributed to low volume of trade and high transaction costs related to finance and logistics, leading to an apparent low trading margin. These factors make investing in fertilizer trading
4
unattractive while allowing for a small concentration of businesses at the import and wholesale levels, resembling an oligopolistic market (Chemonics/IFDC, 2007). Factors that contributed to the reduction of players in the market include macro-economic instability related to scarcity, the high cost of foreign exchange and the rapid devaluation of local currency. Almost all of the fertilizer used in Ghana is still imported in spite of the country’s phosphate rock deposits (similar conditions exist in many other WA countries). Even though there is no facility for fertilizer production in Ghana, there are at least three blending plants in operation, as indicated in Figure 4 (page 8).
Trends in Fertilizer Use Intensity Fertilizer use per unit of cultivated area in Ghana traditionally has been below the total average of the WA region, except for the 1970-1982 period when the GoG had a policy of subsidizing fertilizer. The low volume of fertilizer importation and use in Ghana worsened after the input and output market liberalization and the elimination of subsidies in 1983. These changes in the Ghanaian policy environment caused the demand for fertilizer to decrease substantially and the input-to-output price ratio to increase. This effect was of particular relevance for smallholder subsistent farmer producers of staple food crops, since it provided a disincentive to continue using fertilizer. These producers constitute about 80 percent of the farming population and represent close to 50 percent of the total potential fertilizer demand. More recently, consumption and use of fertilizer have been skewed toward commercial (industrial and export) crops rather than staple food crops. The level of fertilizer used per cultivated hectare in Ghana, which follows a similar pattern as imports, had an increasing trend from the early 1960s until it reached a maximum of 9 kg/ha by the late 1970s (Figure 2, page 5). However, by 1984 fertilizer use dropped to a level of about 2 kg/ha, similar to the 1974 average use. Fertilizer use remained at low levels throughout 2004 when fertilizer consumption reached nearly 8 kg/ha, above the average regional consumption for the first time in about 20 years. During this period, between 1984 and 2004, the lowest level of fertilizer use was 1.7 kg/ha of nutrients in 1994. After 2000, fertilizer usage started increasing again and, despite an increase in imported quantities and the new subsidy program initiated in 2008, the usage level per hectare of land was about 7.3 kg/ha of nutrients as of 2009. This rate was below the 1977 average level of 9 kg/ha, after reaching an all
time high of 12 kg/ha in 2006. This level of 7.3 kg/ha, although above the regional average, is relatively low considering the incentives provided by the subsidy program. This can perhaps be attributed in part to an increase in cultivated area resulting from the traditional extensive cropping system. This indicates that the amount of fertilizer use in the country has not kept pace with the increase in cultivated area. In general, inputs and fertilizer/crop price ratios have remained unfavorable resulting in low fertilizer use in Ghana. This is in spite of improved output prices, particularly for those who grow commercial and tradable products. Farmers have responded by reducing the rate of fertilizer application in the same planted area, spreading it over a larger planted area or abandoning its use altogether. Nevertheless, they are expanding the area of cultivated land, at times into fragile lands, and diversifying toward crops that are less sensitive to changes in market and/or weather conditions. Expansion into fragile lands without adequate replenishment of nutrients is bound to cause high economic costs and environmental problems.
From a policy perspective, the GoG has made considerable advances on market liberalization, allowing the private sector to play a larger role in fertilizer/input importation and distribution and by introducing a subsidy to increase the use of fertilizer among smallholder farmers. However, despite these efforts, fertilizer markets, especially on the supply side, are not operating efficiently (which also affects the demand side of fertilizer). This inefficiency is reflected in the high cost of fertilizer and, consequently, on the reduced demand. As a result, farmers do not have access to fertilizer and other inputs in terms of price, quality, quantity and place, despite Ghana having one of the most extensive distribution networks in the WA region.

5
Fertilizer Marketing Structure and Distribution System Market Players The fertilizer marketing and distribution structure in Ghana follows a pyramid shape, with a few importers at the top, more wholesalers at the middle and an estimated 2,700 fertilizer retailers at the base (Krausova and Banful, 2010). The few players at the import level resemble an oligopoly of four large firms (Chemonics/IFDC, 2007) with a clear dominance by one of the importers which has a marked influence in price determination and in negotiation with the government subsidy program.
In 2009, more than 95 percent of fertilizer imported into Ghana was dominated by four major companies: Yara-Ghana/Wienco, the leader in fertilizer imports and distribution, followed by Chemico, Golden Stork and Dizengoff. The remaining was in the hands of small importers and/or entered the country as aid-in-kind, e.g., fertilizer donated by the Japan International Cooperation Agency (JICA) under the Kennedy Round II (KRII) Program. Before 2007, Wienco was a competitor in fertilizer distribution. Wienco established an effective distribution and retail network to service the cotton fertilizer market by entering into an exchange arrangement with the cotton companies and successfully integrating the sale of fertilizer and purchase of cotton. However, cotton production and the cotton industry in Ghana have decreased
significantly and, as a result, in April 2007 Wienco was absorbed by Yara-Ghana under a joint venture agreement. In the agreement, Yara assumed all aspects of importation and wholesale operations, and Wienco, taking advantage of its experience in the fertilizer market and its already established retail network, assumed the responsibility of further developing the fertilizer retail business. Golden Stork, a subsidiary of the Belgian-French corporation La Cigogne-SCPA SIVEX, recently entered the Ghana market with a relatively small operation near the port of Tema (storage and blending capacity). Golden Stork has a growing share of the regional market because of its presence in WA, similar to Yara but mainly in francophone countries. Dizengoff, a subsidiary of the British-Israeli company Balton CP, is dedicated to the import and distribution of agricultural equipment, electronics and agro-inputs. Fertilizer represents a minor percentage of its business portfolio. The company specializes in the importation and distribution of soluble solids and specialty fertilizers. Chemico, in part as a result of its political clout, previously had dominance in the Ghanaian fertilizer market with large operational facilities near the port of Tema, including plenty of storage and blending capacity which is now becoming obsolete. Currently, Chemico primarily serves the cocoa sector through the COCOBOD, which has a lot of political influence under the management of the Ministry of Finance. Typically in Ghana, most importers do not own the distribution network down to the retail level, but prefer to associate with local businesses involved in fertilizer wholesaling and retailing under different forms of
Figure 2. Ghana and WA Regional Average Fertilizer Consumption per Hectare
Data source: FAO, 2011
Ghana

6
associations. This may include joint ventures similar to Yara-Ghana and Wienco or other types of formal and non-formal agreements. Yara-Wienco owns storage and distribution centers in the main Ghanaian commercial centers (e.g., Kumasi and Tamale). From those distribution centers, the company supplies fertilizer to associated but independent distributors/wholesalers. Agro-input distributor operations often are a combination of wholesale and retail businesses, typically located in most of the 10 regions in the country. The major ones are in the larger regional capital cities, mainly Kumasi and Tamale, which are considered the main distribution hubs for the central and northern regions. The exception is the Greater Accra region, which is the national hub where the importers’ principal operations are located. Distributors are independent businesses that work with their own capital or under a bank line of credit. In a few cases, the most prominent with a good credit rating also work in association with importers. The association may or may not have a formal agreement, which includes preferential wholesale price treatment and/or credit from the importer after a stringent scrutiny of the wholesale partners. Credit is typically in consignment product for a limited period of time up to a month. Most of the other importers work with wholesalers on price preferential agreements (or price discounts) according to the volume of product moved by each of them. These wholesalers have to rely on their own storage facilities, which determine the volume of product they can commercialize in a given period of time. Some distributors may employ their own agronomists who make farm visits, serving as sales and private extension agents in support of their own business operations and their associated rural retail network. Most of the fertilizer distribution, estimated at 75 percent of imports, takes place in Kumasi because of its central location in Ghana. Wholesalers, distributors and retailers are registered or are expected to register with the Ghana Agricultural Input Dealers Association (GAIDA). According to GAIDA, retailers are small input and fertilizer shops located in most of the 158 districts in the country, characterized by having poor facilities, lack of cash and no access to credit. Occasionally, retailers receive credit from wholesalers and sell their products to farmers in the typical 50-kg bags or in smaller quantities, according to the farmer’s need. Their operation is typically situated within the peri-urban areas of towns and villages to provide easy access to producers because most farms are located outside of the villages, in most cases a considerable distance away. There are more than 2,700 fertilizer retail shops spread throughout the country, with the highest concentration in the central regions of Ashanti and the eastern and southwest area of Brong Ahafo (Figure 3, page 7), where
the majority of cocoa and maize producers are located. These producers combined farm more than 2.3 million ha, which explains in part why a large percentage of fertilizer distribution takes place in Kumasi.
Distribution ChannelsThe imported fertilizer in Ghana follows all or just one of three differentiated distribution channels according to the end user: (a) plantations and commercial/industrialized crops; (b) parastatal agriculture organizations such as COCOBOD; and (c) small farmers/producers of staple food crops.
Plantations are large private operations for the production of industrialized crops such as oil palm, tobacco, rubber and sugarcane. These operations, although extensive in area, typically do not produce all the raw material necessary to feed their industry, which is the reason why they also rely on independent producers. Plantation operations typically have been involved in the importation and distribution of fertilizer for their own operations and to provide it to a select group of large independent producers under a contractual agreement. The agreement involves agro-input supply and crop management services with a guaranteed output price. Farmers, who are not eligible to receive services and inputs (e.g., fertilizer) from the plantation operation, have to purchase it locally at the prevailing market price. More recently, given the demand for substantial financial resources, time and logistics coordination, most plantations have turned the fertilizer importing operations over to the main in-country importers, while keeping the distribution within their own operation.
COCOBOD is a state-run umbrella organization under the Ministry of Finance, which covers more than 90 percent of cocoa farmers in Ghana. Thousands of small cocoa producers also produce staple food crops, mainly corn. The importance of cocoa production is not just because of the numerous small farmers involved in its production, but also because cocoa is an important source of foreign currency and tax revenues for the government. COCOBOD has traditionally imported its own fertilizer for use in the cocoa subsector, but because of the government market liberalization efforts, the organization has left the importation operation to the major fertilizer importers, such as Chemico and Yara-Wienco. Nevertheless, they are keeping the distribution through their network of 70-plus outlet shops in Ghana’s cocoa-producing regions.
In contrast, most smallholder producers of staple food crops, cocoa or any other cash crops must acquire their fertilizer and other inputs from the private

7
Source: IFDC Ghana.
Figure 3. Ghana Regions and Geographic Distribution of Input Retailers
8
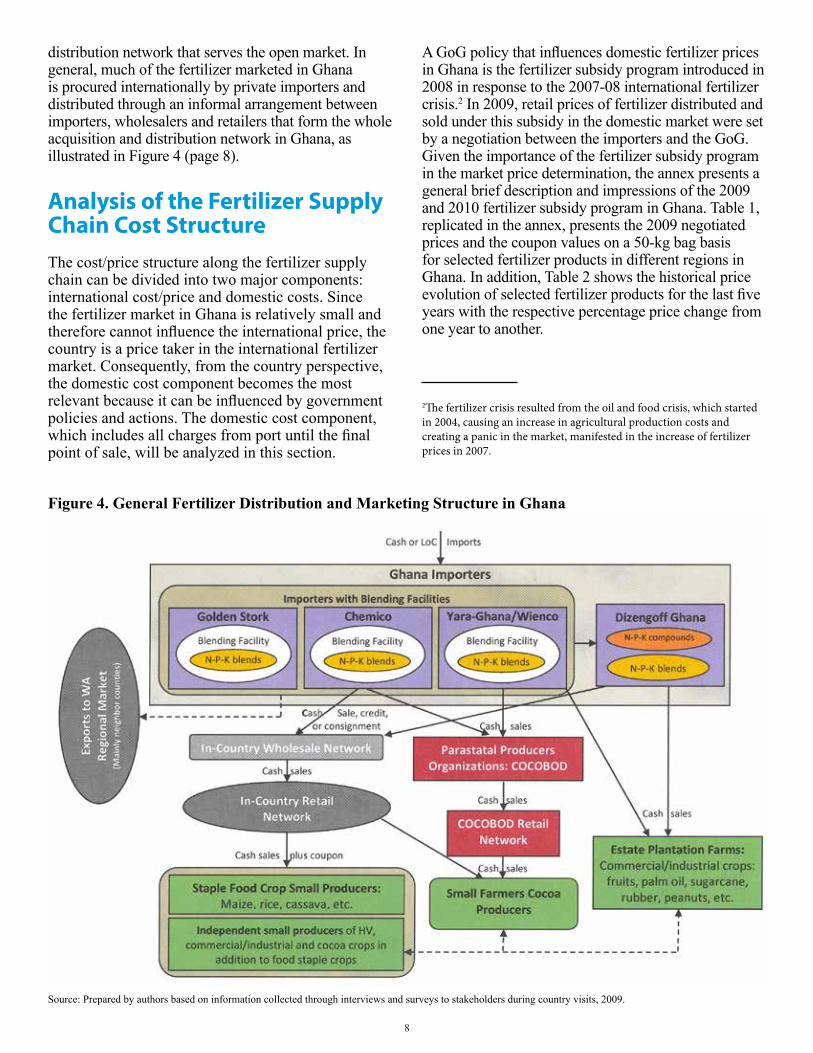
distribution network that serves the open market. In general, much of the fertilizer marketed in Ghana is procured internationally by private importers and distributed through an informal arrangement between importers, wholesalers and retailers that form the whole acquisition and distribution network in Ghana, as illustrated in Figure 4 (page 8).
Analysis of the Fertilizer Supply Chain Cost StructureThe cost/price structure along the fertilizer supply chain can be divided into two major components: international cost/price and domestic costs. Since the fertilizer market in Ghana is relatively small and therefore cannot influence the international price, the country is a price taker in the international fertilizer market. Consequently, from the country perspective, the domestic cost component becomes the most relevant because it can be influenced by government policies and actions. The domestic cost component, which includes all charges from port until the final point of sale, will be analyzed in this section.
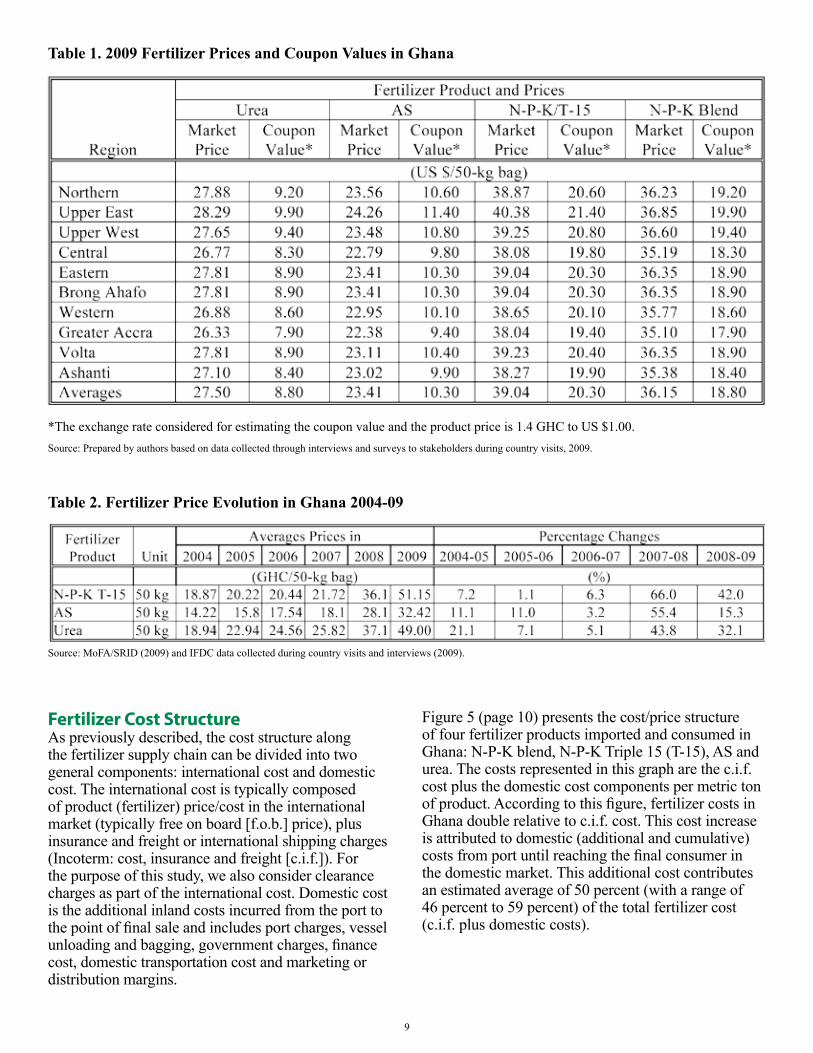
A GoG policy that influences domestic fertilizer prices in Ghana is the fertilizer subsidy program introduced in 2008 in response to the 2007-08 international fertilizer crisis.2 In 2009, retail prices of fertilizer distributed and sold under this subsidy in the domestic market were set by a negotiation between the importers and the GoG. Given the importance of the fertilizer subsidy program in the market price determination, the annex presents a general brief description and impressions of the 2009 and 2010 fertilizer subsidy program in Ghana. Table 1, replicated in the annex, presents the 2009 negotiated prices and the coupon values on a 50-kg bag basis for selected fertilizer products in different regions in Ghana. In addition, Table 2 shows the historical price evolution of selected fertilizer products for the last five years with the respective percentage price change from one year to another.
2The fertilizer crisis resulted from the oil and food crisis, which started in 2004, causing an increase in agricultural production costs and creating a panic in the market, manifested in the increase of fertilizer prices in 2007.
Figure 4. General Fertilizer Distribution and Marketing Structure in Ghana
Source: Prepared by authors based on information collected through interviews and surveys to stakeholders during country visits, 2009.
9
Table 1. 2009 Fertilizer Prices and Coupon Values in Ghana
Table 2. Fertilizer Price Evolution in Ghana 2004-09
*The exchange rate considered for estimating the coupon value and the product price is 1.4 GHC to US $1.00. Source: Prepared by authors based on data collected through interviews and surveys to stakeholders during country visits, 2009.
Source: MoFA/SRID (2009) and IFDC data collected during country visits and interviews (2009).
Fertilizer Cost Structure As previously described, the cost structure along the fertilizer supply chain can be divided into two general components: international cost and domestic cost. The international cost is typically composed of product (fertilizer) price/cost in the international market (typically free on board [f.o.b.] price), plus insurance and freight or international shipping charges (Incoterm: cost, insurance and freight [c.i.f.]). For the purpose of this study, we also consider clearance charges as part of the international cost. Domestic cost is the additional inland costs incurred from the port to the point of final sale and includes port charges, vessel unloading and bagging, government charges, finance cost, domestic transportation cost and marketing or distribution margins.
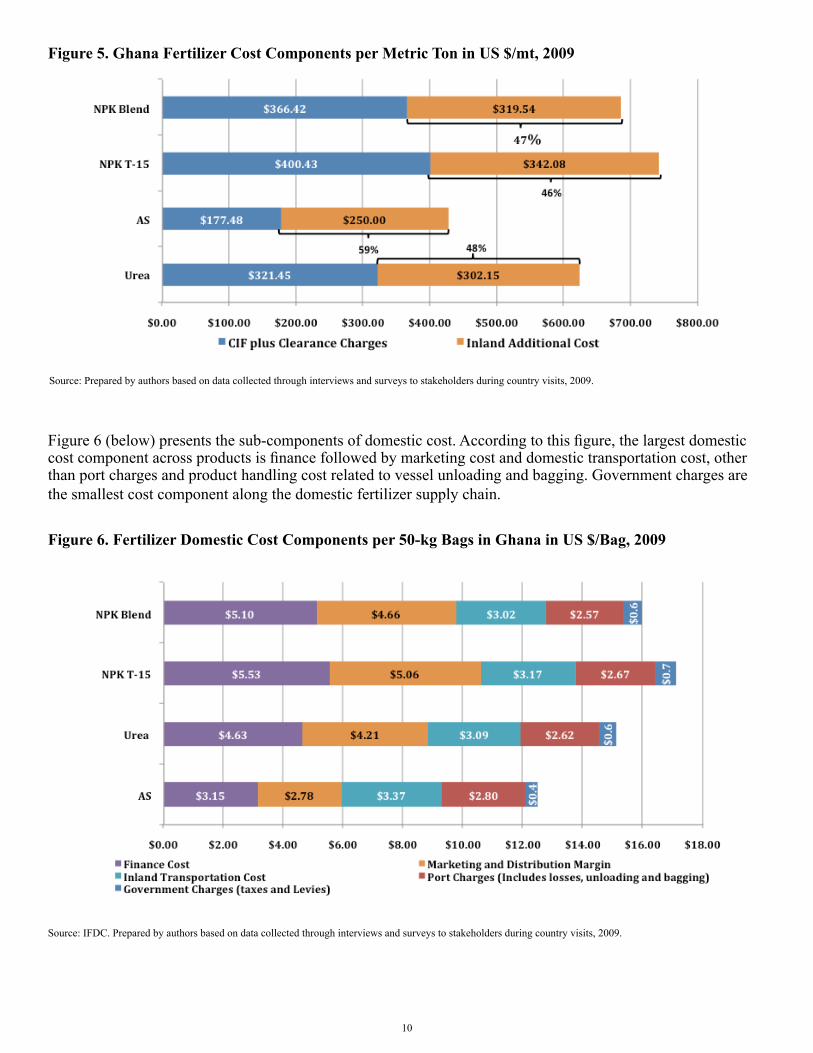
Figure 5 (page 10) presents the cost/price structure of four fertilizer products imported and consumed in Ghana: N-P-K blend, N-P-K Triple 15 (T-15), AS and urea. The costs represented in this graph are the c.i.f. cost plus the domestic cost components per metric ton of product. According to this figure, fertilizer costs in Ghana double relative to c.i.f. cost. This cost increase is attributed to domestic (additional and cumulative) costs from port until reaching the final consumer in the domestic market. This additional cost contributes an estimated average of 50 percent (with a range of 46 percent to 59 percent) of the total fertilizer cost (c.i.f. plus domestic costs).
10
Source: Prepared by authors based on data collected through interviews and surveys to stakeholders during country visits, 2009.
Figure 5. Ghana Fertilizer Cost Components per Metric Ton in US $/mt, 2009
Figure 6. Fertilizer Domestic Cost Components per 50-kg Bags in Ghana in US $/Bag, 2009
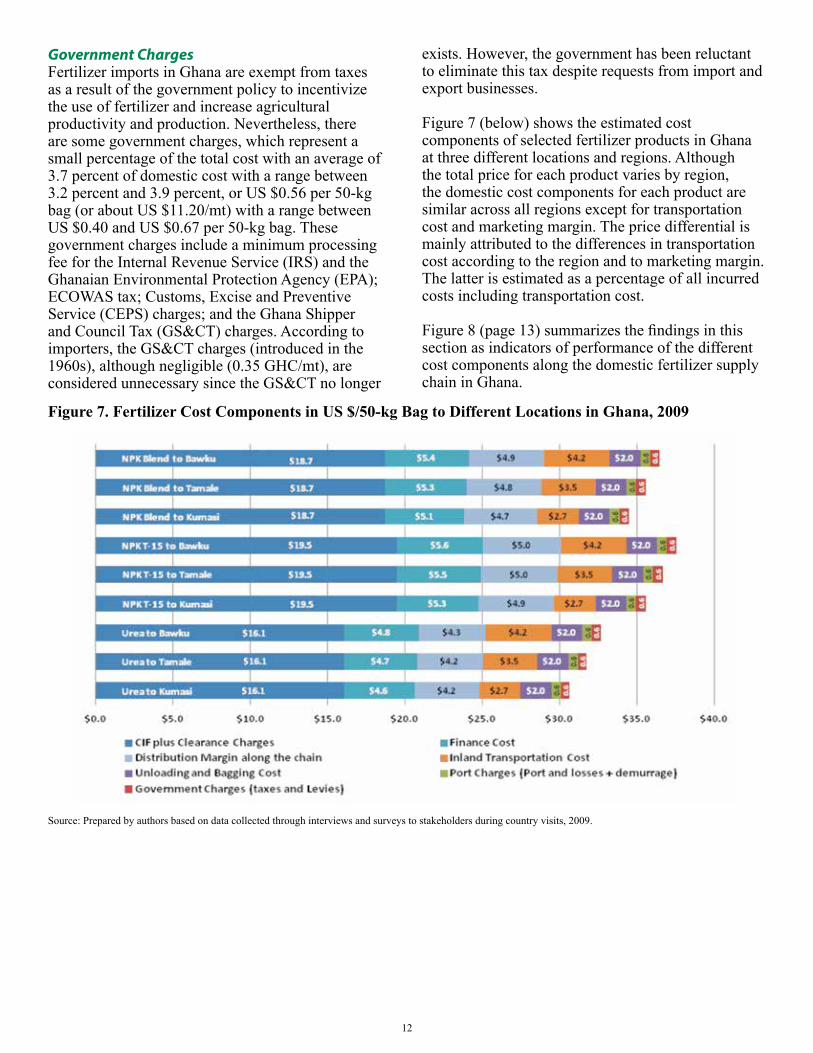
Figure 6 (below) presents the sub-components of domestic cost. According to this figure, the largest domestic cost component across products is finance followed by marketing cost and domestic transportation cost, other than port charges and product handling cost related to vessel unloading and bagging. Government charges are the smallest cost component along the domestic fertilizer supply chain.
Source: IFDC. Prepared by authors based on data collected through interviews and surveys to stakeholders during country visits, 2009.

11
Finance CostIn Ghana, finance is the highest cost component along the domestic fertilizer supply chain, accounting for an average of 30 percent (with a range between 25 and 32 percent of the total domestic cost). In monetary terms, these figures represent an average of US $4.60 per 50-kg bag across products considered in this assessment, with a range between US $3.15 and US $5.53 of the domestic [additional] cost, according to the fertilizer product being distributed.
Although access and availability of finance for agribusiness activities are considered major problems in Ghana, subsidiaries of international corporations have access to finance in foreign currency in the international financial market at an interest rate between 7 percent and 10 percent, and even lower in cases of organizations with their own internal finance. However, as the product moves down the domestic distribution channels, wholesalers and retailers do not have access to finance even at a national level. When finance is available, it is with collaterals of more than 100 percent of the loan, in addition to a high interest rate between 33 percent and 35 percent in local currency.
Marketing and Distribution MarginMarketing or distribution margin is the second highest cost component along the domestic supply chain in Ghana. This cost is typically set as a mark-up percentage of the total transaction cost, including the product cost, added by each agro-input business owner along the distribution chain. This cost covers part of the unaccounted costs and profit or compensation for entrepreneurial efforts. In Ghana the average fertilizer marketing and distribution margin is estimated to contribute about 27.2 percent to the domestic cost, with a range between 22 percent and 29.5 percent. In monetary terms, these figures represent US $4.18 per 50-kg bag with a range between US $2.78 and US $5.06, respectively. The breakdown of this cost along the domestic supply chain is not quite as clear. According to industry experts, of 27.2 percent, 20 percent or US $3.10 is absorbed by importers, while the 7.2 percent or US $1.08 differential is shared between the wholesaler/distributor and retailers.
Domestic Transportation CostDomestic transportation is the third highest cost component along the domestic supply chain representing an average of 21 percent of the cost, with a range between 19 percent and 27 percent. In monetary terms these figures represent US $3.16 per 50-kg bag (with a range between US $3.02 and US $3.37). Transportation costs, which include trucks loading and unloading cargo at the point of origin
and destination, have increased recently because of the increased price of fuel. The currency devaluation and the new restriction imposed by the government on the maximum axle load of 35 mt per truck (down from an unregulated load up to 70 mt that was causing road damage and fatal road accidents) have exacerbated the situation. The estimated average domestic transportation cost to all regions in Ghana is US $0.14/mt/km (or almost 0.21 Ghana cedi [GHC]/mt/km). Although this cost appears low relative to other standards, it could be further reduced and/or the service substantially improved with the implementation of proper policies to incentivize public and private investment in infrastructure and transportation equipment.
Port ChargesFor purposes of this assessment, port charges include vessel unloading and bagging. This is the fourth largest component of domestic cost in Ghana. Port charges, which can vary from port to port, are associated with the use of the port facilities including site occupation or berth charges, wharf charges and pilotage service, among others. Vessel unloading and bagging are considered one activity, including the costs of bags, bagging equipment rental and labor. These combined port charges average 17.8 percent, with a range between 15.6 percent and 22.4 percent. In monetary terms these values represent an average of US $2.67 per 50-kg bag with a range between US $2.57 and US $2.80, depending on the product and port. As such, this relatively high cost may be an indication of port inefficiency influenced mainly by the vessel unloading and bagging process at port, which represents an average of 12 percent out of the combined average of about 18 percent. This unloading and bagging inefficiency contributes to the increase in port charges, especially on demurrage.
For fertilizer importation, Ghana has two active ports: Tema and Takoradi. Both ports have the capacity to receive fertilizer; however, most fertilizer is imported through Tema because of its strategic geographic location. Tema has better road access to move products to the central, northern, Upper and Volta regions where there is a high fertilizer demand for the production of cash and high-value vegetable crops under irrigation. In addition, Tema is a larger port and since most fertilizer is imported in bulk, on-site bagging and storage facilities are available. Furthermore, most importers’ main operations are located in the Greater Accra region near the Tema Port.
12
Government ChargesFertilizer imports in Ghana are exempt from taxes as a result of the government policy to incentivize the use of fertilizer and increase agricultural productivity and production. Nevertheless, there are some government charges, which represent a small percentage of the total cost with an average of 3.7 percent of domestic cost with a range between 3.2 percent and 3.9 percent, or US $0.56 per 50-kg bag (or about US $11.20/mt) with a range between US $0.40 and US $0.67 per 50-kg bag. These government charges include a minimum processing fee for the Internal Revenue Service (IRS) and the Ghanaian Environmental Protection Agency (EPA); ECOWAS tax; Customs, Excise and Preventive Service (CEPS) charges; and the Ghana Shipper and Council Tax (GS&CT) charges. According to importers, the GS&CT charges (introduced in the 1960s), although negligible (0.35 GHC/mt), are considered unnecessary since the GS&CT no longer
exists. However, the government has been reluctant to eliminate this tax despite requests from import and export businesses.
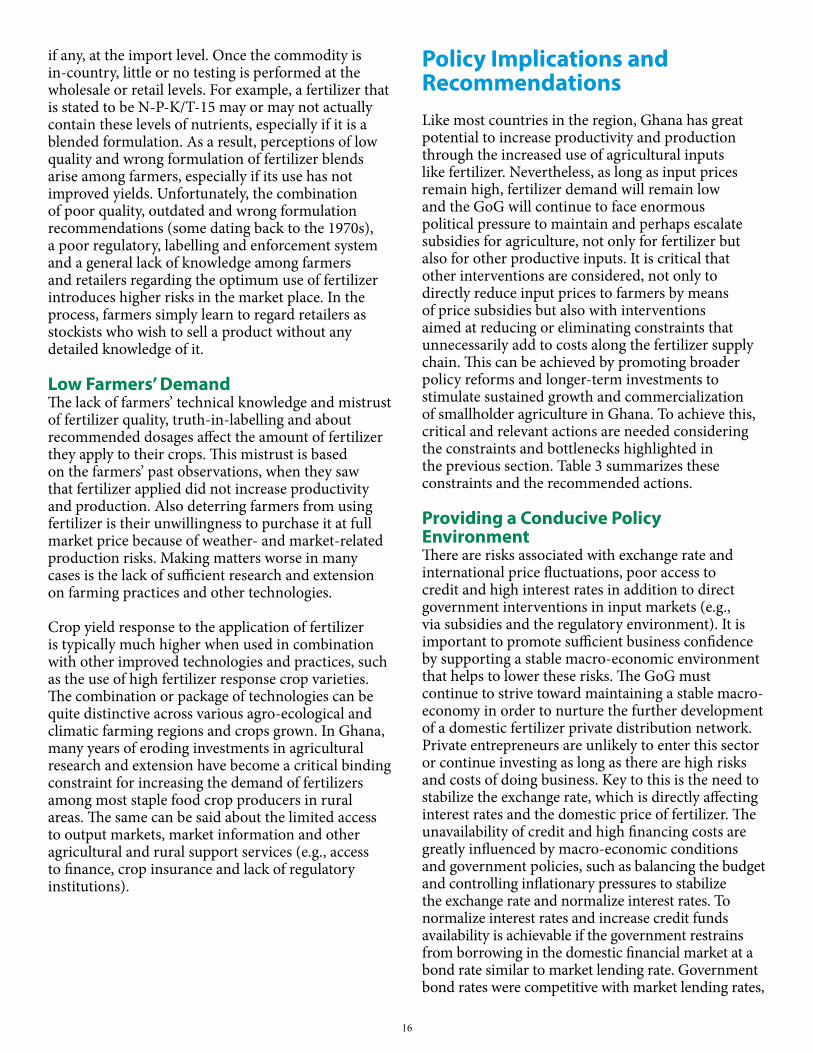
Figure 7 (below) shows the estimated cost components of selected fertilizer products in Ghana at three different locations and regions. Although the total price for each product varies by region, the domestic cost components for each product are similar across all regions except for transportation cost and marketing margin. The price differential is mainly attributed to the differences in transportation cost according to the region and to marketing margin. The latter is estimated as a percentage of all incurred costs including transportation cost.
Figure 8 (page 13) summarizes the findings in this section as indicators of performance of the different cost components along the domestic fertilizer supply chain in Ghana.
Figure 7. Fertilizer Cost Components in US $/50-kg Bag to Different Locations in Ghana, 2009
Source: Prepared by authors based on data collected through interviews and surveys to stakeholders during country visits, 2009.

13
Figure 8. Performance of Fertilizer Supply Chain in Ghana, 2009
a Performance indicators are average percentages and monetary values across different products on a 50-kg bag. b This cost increase at retail includes government charges, which account for 3.7 percent (US $0.56/50-kg bag) of domestic cost.
Source: Prepared by authors based on data collected through interviews and surveys to stakeholders during country visits, 2009.
Identifying Key Constraints and BottlenecksAs previously shown, much of the high domestic supply costs of fertilizer in Ghana can be associated with several factors from port to final consumer point of sale. Figure 8 summarizes the key findings in the cost structure in the form of performance of the fertilizer supply chain in Ghana. The following text will elaborate on those key findings, followed by implications and recommendations to improve the performance of the supply chain. Table 3 (page 20)summarizes these findings focusing on constraints while considering a range of policy implications and recommendations for addressing them.
High Costs and Inefficiencies at the PortBeginning at product entry point, high port costs can be attributed to numerous operational inefficiencies in port services and the port’s limited capacity, resulting in larger per unit processing costs. The regulation of permitting only port employees (stevedores) to perform the unloading and bagging of products at port introduces inefficiency in the process and additional demurrage charges. According to importers, port costs could be reduced if the contractual arrangements with the stevedores could be changed. Currently, labor compensation for vessel unloading and product bagging at port is on an hourly basis at rates pre-established by the port authority. Port regulations do not allow for direct contractual arrangements between importer

14
and stevedores. Consequently, there is no incentive for workers to increase productivity, increasing the cost of the activity. In addition, the insufficient, ill-maintained and often obsolete port equipment adds to the inefficiencies associated with the unloading and bagging process. Moreover, shallow drafts do not allow the docking of vessels larger than 15,000 mt, foregoing potential gains from economies of scale.
High Marketing Costs and MarginsHigher costs in fertilizer procurement and distribution also arise from the GoG-induced inefficiencies with the fertilizer subsidy program and its bidding practices, which allow for potentially higher than normal profit margins in the domestic market. Higher than normal profit margins arise due to the ability of a few major importers to negotiate domestic prices of fertilizer with the government as delivered at regional warehouses. In this price negotiation, there is no agro-dealer participation; therefore, they become price takers while allowing importers to potentially capture a larger margin from the domestic supply chain. A larger than normal margin could be justified for hedging against risks associated with international price fluctuations, currency devaluation and high interest rates. However, such margins could be reduced if the government eliminates the price negotiation practice with importers. Alternatively, if the domestic distributors and retailers are allowed to participate in the negotiations, a more even spread of the margin along the domestic supply chain would occur, providing an incentive for the expansion of wholesale and retail distribution networks while also allowing them to hedge against exogenous negative market effects. The current subsidy program does not deal with these inefficiencies and, therefore, effectively restricts the expansion of domestic wholesale and retail distribution networks. In addition, it is important to point out that the marketing and distribution margin is mainly influenced by the major cost components (finance, transportation, government and port charges). Consequently, implementing policy measures to reduce these other costs will also help to reduce the marketing cost.
High Finance Costs and Poor Access to CreditIn contrast to the major importing firms, which have the option to access finance in international markets at more favorable terms, domestic fertilizer distribution and retail networks do not enjoy the same degree of market power. Domestic interest rates are high (about 30 to 35 percent) and additional
high collaterals are typically expected, sometimes reaching levels equal to or above the funds being borrowed. These high rates and collateral requirements are prohibitive for any type of business and even more so for an agriculture-related business with the inherent risks involved in agriculture. These are the same risks that keep financial institutions neglecting the agriculture sector, exacerbated by the exchange rate risk. In addition, due to insecurity and a high lending risk perception, there is an absence of financial services in the rural areas, including government-backed banks such as the Agricultural Development Bank of Ghana. Consequently, retailers and farmers have to rely almost entirely on their own finances and, in very rare cases, retailers may receive credit from the wholesaler, a practice that is neither common nor encouraged by importers.
The high interest rate was attributed to the volatile local currency, which was devaluated by more than 50 percent between December 2008 and 2009, and to the GoG policy of financing its deficit by borrowing in the domestic market at a rate of 27 to 29 percent. This policy has caused a scarcity of funds in the market because few banks were willing to lend to agriculture-related activities and other economic sectors. They would rather invest in government bonds, which offer an acceptable return equivalent to the prime rate of about 29 percent with a minimum risk relative to lending to the agricultural sector. The high interest rate of lending is faced by all economic sectors. For a business to pay this high rate, it would have to make a net profit much higher than normal, which is difficult in a competitive market such as Ghana, and even more difficult for agribusinesses.
It is considered an acceptable business practice for banks to invest in government bonds, especially considering the bond interest rate, which is a few points lower than the market rate with an almost negligible risk relative to lending to agriculture. With the government borrowing in the domestic market through bonds, it is crowding out private financing and investments in agriculture and other economic sectors.
Other finance-related constraints include the lack of risk management instruments for lending and investments in agriculture. As a result, local fertilizer businesses are typically unable to access finance, forcing them to rely on their own limited finances (if any). This has important implications in contributing to observed higher prices for fertilizer because the expected return on investors’ own capital remains high given the high interest rates and exchange rate instability.

15
Obsolete Domestic Infrastructure: Transportation Equipment and Degraded RoadsTransportation cost is another major issue that affects the profitability of fertilizer distribution and increases its cost to farmers. As a consequence of poor road conditions and few access or feeder roads in rural areas, the cost of distribution to more remote areas is prohibitive for the private distribution network. Farmers in affected areas cannot access fertilizer unless they travel long distances to the nearest fertilizer retail outlet, increasing fertilizer cost in terms of farmers’ opportunity cost. This is particularly critical in the northern regions where the use of fertilizer is necessary for increasing the productivity of cash crops.
Most existing roads are in poor condition as a result of Ghana’s previous lack of restrictions on axle loads in the past and the lack of alternative transportation modes. Deteriorated roads have contributed to the faster wear and tear of transportation equipment, which in addition to the dependence on imported oil has played a part in the high transportation costs. Consequently, these high costs contribute considerably to the domestic costs of supplying fertilizer and the high price paid by consumers. But worse is the limited access to remote rural areas, especially during the rainy seasons. Additionally, the lack of adequate storage facilities and access to credit and other support services adds to the disincentives for private sector investments in these areas. Although the most used mode for domestic transportation in Ghana is by trucks, there is also a potential for transportation using the Volta waterway to move fertilizer to the northern and eastern regions. However, proper infrastructure will need to be developed along the waterway.
Undeveloped Domestic Distribution/Retail NetworkThe main issue facing the development of the domestic fertilizer distribution network and supply chain in Ghana is the subsidized coupon program (briefly described in the annex to this document). The program unintentionally restrains the expansion of the national distribution network while neglecting complementary investment to increase fertilizer domestic supply and demand. The implementing mechanism of the subsidy program (e.g., retail prices are determined by negotiations between importers and government without the participation of the domestic distribution network) does not allow for an even spread of the profit margins along the domestic supply chain. Rather, most of the margin seems to be captured by importers and wholesalers, neglecting
the domestic distribution network profit margin. Any narrow marketing margins left over are then captured mostly by wholesalers; this fact discourages the expansion of the domestic fertilizer retail network.
The fertilizer subsidy/coupon program, which covers an estimated 50 percent of the potential total fertilizer needs of targeted beneficiaries, provides incentives for importers to provide all required subsidized fertilizer; however, the same subsidy program does not provide the incentive to import supplemental quantities to supply unforeseen needs of the targeted farmer population or support the development of the existing network into remote rural areas. This action would require further investment and unnecessary risk not justified when considering the level of profit being made at the import and wholesale distribution levels. The task of developing the distribution network down to the farmer has been left to a more competitive and weak domestic retail network, rural investors and small entrepreneurs. These entrepreneurs, instead of receiving the proper economic and financial incentives for investment and expansion in the retail business, are facing adverse macro-economic conditions like devaluation, lack of access to credit and high interest rates, logistics and infrastructure constraints and a seemingly low profit margin.
These adverse conditions increase risk and costs faced by the domestic distribution network and explain why they are concentrated in some areas of the country and generally located on the outskirts of towns and principal commercial centers. Unfortunately, the current policy framework in Ghana has not addressed these constraints directly. In addition, even if the fertilizer reaches some of the agro-dealers, most still lack sufficient managerial and technical skills and knowledge to market the product and provide advice on appropriate blends and dosages according to the crops. Moreover, lack of adequate access to market information introduces additional risks and costs to the already high marketing and distribution costs agro-dealers have to absorb. The lack of knowledge of retailers on the proper use and recommendations of fertilizer according to local crop and soil conditions also restricts market expansion and the demand for fertilizers. As price takers, a majority of small agro-dealers can be easily wiped out of business if prices fall below a level required to recover their own marginal costs of operation.
Furthermore, fertilizer sold in the Ghanaian market is not guaranteed, particularly in terms of its nutrient content, net product weight and physical qualities. The Ghana Standards Board only performs tests,
16
if any, at the import level. Once the commodity is in-country, little or no testing is performed at the wholesale or retail levels. For example, a fertilizer that is stated to be N-P-K/T-15 may or may not actually contain these levels of nutrients, especially if it is a blended formulation. As a result, perceptions of low quality and wrong formulation of fertilizer blends arise among farmers, especially if its use has not improved yields. Unfortunately, the combination of poor quality, outdated and wrong formulation recommendations (some dating back to the 1970s), a poor regulatory, labelling and enforcement system and a general lack of knowledge among farmers and retailers regarding the optimum use of fertilizer introduces higher risks in the market place. In the process, farmers simply learn to regard retailers as stockists who wish to sell a product without any detailed knowledge of it.
Low Farmers’ DemandThe lack of farmers’ technical knowledge and mistrust of fertilizer quality, truth-in-labelling and about recommended dosages affect the amount of fertilizer they apply to their crops. This mistrust is based on the farmers’ past observations, when they saw that fertilizer applied did not increase productivity and production. Also deterring farmers from using fertilizer is their unwillingness to purchase it at full market price because of weather- and market-related production risks. Making matters worse in many cases is the lack of sufficient research and extension on farming practices and other technologies.
Crop yield response to the application of fertilizer is typically much higher when used in combination with other improved technologies and practices, such as the use of high fertilizer response crop varieties. The combination or package of technologies can be quite distinctive across various agro-ecological and climatic farming regions and crops grown. In Ghana, many years of eroding investments in agricultural research and extension have become a critical binding constraint for increasing the demand of fertilizers among most staple food crop producers in rural areas. The same can be said about the limited access to output markets, market information and other agricultural and rural support services (e.g., access to finance, crop insurance and lack of regulatory institutions).
Policy Implications and RecommendationsLike most countries in the region, Ghana has great potential to increase productivity and production through the increased use of agricultural inputs like fertilizer. Nevertheless, as long as input prices remain high, fertilizer demand will remain low and the GoG will continue to face enormous political pressure to maintain and perhaps escalate subsidies for agriculture, not only for fertilizer but also for other productive inputs. It is critical that other interventions are considered, not only to directly reduce input prices to farmers by means of price subsidies but also with interventions aimed at reducing or eliminating constraints that unnecessarily add to costs along the fertilizer supply chain. This can be achieved by promoting broader policy reforms and longer-term investments to stimulate sustained growth and commercialization of smallholder agriculture in Ghana. To achieve this, critical and relevant actions are needed considering the constraints and bottlenecks highlighted in the previous section. Table 3 summarizes these constraints and the recommended actions.
Providing a Conducive Policy EnvironmentThere are risks associated with exchange rate and international price fluctuations, poor access to credit and high interest rates in addition to direct government interventions in input markets (e.g., via subsidies and the regulatory environment). It is important to promote sufficient business confidence by supporting a stable macro-economic environment that helps to lower these risks. The GoG must continue to strive toward maintaining a stable macro-economy in order to nurture the further development of a domestic fertilizer private distribution network. Private entrepreneurs are unlikely to enter this sector or continue investing as long as there are high risks and costs of doing business. Key to this is the need to stabilize the exchange rate, which is directly affecting interest rates and the domestic price of fertilizer. The unavailability of credit and high financing costs are greatly influenced by macro-economic conditions and government policies, such as balancing the budget and controlling inflationary pressures to stabilize the exchange rate and normalize interest rates. To normalize interest rates and increase credit funds availability is achievable if the government restrains from borrowing in the domestic financial market at a bond rate similar to market lending rate. Government bond rates were competitive with market lending rates,

17
especially when considering that they were about three points lower than lending rates, the high volatility of the exchange rate and the lower risk of lending to the government relative to other economic sectors. This fact discourages banks lending to agriculture and reduces the amount of funds available for private sector investment.
Given the volatility of the fertilizer market, the GoG should revisit the subsidy program to make adjustments and assess how much the government can afford to finance fertilizer subsidies vis-à-vis its current revenues and expenditures. While revenues could be increased through alternative taxes, the challenge will be to not add a greater burden to the agriculture sector through taxes and by reducing further long-term investments and support services in smallholder agriculture. If the government is compelled to maintain or escalate a subsidy program, it should be better targeted to the intended farming population. In addition, it must allow for broader private sector participation by eliminating price negotiations with importers while favoring a more open competition in fertilizer importation and distribution. A more even spread of marketing and distribution margin along the domestic supply chain can incentivize the expansion of the distribution network nearer to farmers.
Strengthening the Institutional and Regulatory EnvironmentMacro-economic reforms alone are not sufficient to induce stability in the market. Certain institutional and regulatory reforms are also needed, particularly those that affect competition and efficiencies at the port and the overall financial and credit markets, which restrict expansion in domestic fertilizer trade. For example, to improve port efficiencies, the government should revise and update port regulations according to current economic conditions to allow for more efficient processes, especially unloading and bagging, and eliminate unnecessary/obsolete and unjustified charges. The government should at least allow the privatization of port operations for proper maintenance of equipment (e.g., unloading and bagging) and negotiation of rates with private importers. Providing fiscal incentives to invest in upgrading port facilities to modern equipment to increase port operational efficiency is needed.
Finance reforms should also be explored to ease the availability of credit, especially among domestic entrepreneurs for input distribution and warehousing. Options include creating a risk management fund to support trade and retail businesses in fertilizer and
other agricultural inputs in neglected rural areas. The creation and development of local financial markets and institutions (i.e., local savings and loans institutions) and financial instruments (special savings accounts and loans for agriculture, crop insurance instruments, etc.) would help the domestic fertilizer retail industry to grow. Similarly, it would also open the way for increasing numbers of farmers to access credit for purchasing seeds and fertilizer. In addition to credit, the need to increase saving among small farmers is just as critical. The government, therefore, should seek policy solutions that provide incentives for financial institutions to expand into rural areas. Developing effective financial risk management tools to address the inherent risks associated with agriculture and introducing loan-guarantee programs are necessary. Such interventions should be intended to not only protect a bank’s own lending portfolio but to also provide positive returns to farmers who choose to use credit. Because there are often high production-related risks associated with weather uncertainty, other complementary investments may also be needed to lower such risks, including weather insurance and investments in irrigation or other water management technologies.
In addition to expanding access to rural finance institutions, the development of a strong regulatory environment is also needed to strengthen the rule of law and enforcement in the rural sector. This will enable markets, provide growth in business entrepreneurship and protect consumers, producers and merchants. For example, improved quality control and truth-in-labeling can serve as catalysts to market development and growth, particularly as markets become more diverse and dynamic. For fertilizer markets in particular, the MoFA has drafted a regulatory framework, which needs to be revised, passed and implemented in order to restore farmer confidence and assure them that the fertilizer they purchase is not nutrient-deficient, adulterated or sold in short-weight bags.
Improved Investments in Infrastructure and TransportationThe development of fertilizer markets in Ghana is inherently tied to the more general problems of poor physical infrastructure (at the port, inland roads and warehousing), transportation and access to rural services (extension, market information). For example, the improvement of port infrastructure and handling efficiencies would reduce the overall costs of imports and provide a competitive advantage for exports, especially for high-value perishable goods. High inland transportation costs contribute

18
to underdevelopment of input and output markets. A recent study undertaken on the Accra to Burkina Faso trade corridor highlighted transportation inefficiencies, which involve the capture of high profit margins by a few trucking firms and serves as a critical source of high costs of input and output trade in the region (USAID, 2010).
Introducing policies that encourage more competition in the trucking industry would be a first step at lowering costs. This should be in addition to investing in improving transportation equipment and warehousing for storage, increased maintenance of existing roads, construction of rural feeder roads and enforcement of road use regulations. Implementing and enforcing the new maximum truck axle load law to maintain the existing roads and extend the life of transportation equipment is needed. As much as possible, the maintenance and construction of new rural feeder roads should be done in ways that can help create more employment in rural areas. The typical problems of inadequate access to transportation, poorly maintained and damaged roads and the poor construction of new roads should be addressed. In the less-developed northern regions of Ghana, alternative transportation, such as the use of existing waterways and/or building a railroad system, could be especially beneficial in reaching some of the remote areas in the country. Public-private partnerships should also be considered to provide incentives for the larger private sector traders to invest in rural infrastructure.
Promoting Expansion of Rural Input Dealer Networks and Market InformationSo far, we have focused more on national-level policy reforms and investments such as improved macro-economic policies, institutional and regulatory environment and infrastructure and transportation systems. However, more targeted interventions are needed, especially for promoting growth of the fertilizer retail distribution network in more remote rural areas.
First, there is a need to improve access to credit by domestic entrepreneurs who wish to expand their retail network and outlets in the limited market areas. The establishment of a guaranteed fund or subsidized interest rate may be desirable or any other type of public-private partnership that allows the government to bear some of the risks that come with doing business in remote rural undeveloped markets. In these areas, incentives for private sector investments are prohibitive because the markets are often too thin, risky and produce low to negative returns.
Additionally, the training of agro-input dealers and retailers in extension can help ensure that they have adequate knowledge for recommending crop-specific input requirements to obtain optimum yields. Innovative approaches – such as the use of mobile phone technologies – should also be considered to improve the flow of market information to both farmers and input dealers.
To induce growth and improve effectiveness of agro-dealer networks, it will be necessary to complement the subsidies with transparent practices that increase the participation of domestic fertilizer distributors and retailers in fertilizer price determination. One example is ensuring that profit and margins along the domestic supply chain are spread out broadly and redistributed more equitably among importers and the domestic distribution network. Currently, a larger share of profits and margins is captured by few importers. To achieve this, it means eliminating or discouraging excessive control of the market by a few importers by encouraging more involvement of the retail networks in domestic price determination. Lowering the likelihood of collusion in domestic price determination should create a more even spread of marketing margins along the whole distribution chain. Simultaneously, any bureaucratic processes required to manage the public sector’s oversight and regulatory framework must be minimized – and yet sufficiently transparent to discourage any future rent-seeking behavior.
Promoting and Improving Smallholder Agricultural IntensificationIn addition to investments and policy reforms that lower fertilizer distribution costs on the supply side (while improving market performance), the resulting increase in the derived demand for fertilizers is not guaranteed to rise dramatically without other complementary investments on the demand side. For example, a critical demand-side constraint is having adequate access to rural support services such as extension, credit, market information and market access. Improved farming practices by using improved varieties with higher response rates, the optimum amount of fertilizer plus water conservation and irrigation techniques will lead to greater agricultural intensification. Ultimately, this will lead to increased fertilizer use and market growth in the sector. Additionally, improved market information systems and adequate storage facilities will hedge against seasonal price risks.
Therefore, rather than investing the bulk of public sector resources in the fertilizer subsidy program, the

19
government should consider intervention options that account for the complete technological package, i.e., to include incentives for purchasing other complementary inputs such as seeds, pesticides and minor equipment. This is in addition to improved access to credit and other services, such as weather-related crop insurance.
Farmers’ involvement in the design and provision of research and development (R&D), extension and support services is important to ensure that their specific needs for technical and managerial skills are properly addressed. This practice will lead to a more effective and efficient use of modern inputs that are more suitable to local agronomic and socio-economic conditions. Moreover, such participatory approaches not only create a better link between researchers, extension agents and farmers but empower farmers to participate more actively in the marketplace, both as buyers of inputs and sellers of output. The inclusion of input suppliers in trainings related to business management and on the proper use of inputs would also extend links between farmers and input traders,
even promoting the input dealers to serve as private extension agents.
For fertilizer use in particular, sufficient research should be dedicated to providing specific recommendations in different environments and cropping systems and, in the process, be integrated with the enforcement of fertilizer laws and regulations. To be effective, inspectors must be sufficiently trained by extension agents or government agencies and be knowledgeable to help police and enforce fertilizer laws and regulations. The development and establishment of a market information system, in addition to accessing extension information and regulations, would help create greater transparencies in conducting commerce between farmers and agro-dealers and/or traders.

20
34
Tabl
e 3. S
umm
ary
Mat
rix
of K
ey C
onst
rain
ts a
nd P
olic
y R
ecom
men
datio
ns
Key
Con
strai
nts
Nat
ure/
Des
crip
tion
of C
onstr
aint
s Ef
fect
On
Ferti
lizer
Mar
ket
and/
or S
uppl
y Co
sts
Polic
y M
easu
res/R
ecom
men
datio
ns
I.
Inef
fect
ive
subs
idy
prog
ram
N
egot
iatio
n be
twee
n im
porte
rs a
nd
gove
rnm
ent u
nder
the
subs
idy
prog
ram
has
led
to a
n ap
pare
nt
collu
sion
in d
omes
tic re
tail
pric
e de
term
inat
ion.
In
effe
ctiv
e, bu
rden
som
e an
d po
orly
de
signe
d an
d im
plem
ente
d su
bsid
y co
upon
syste
m d
eter
s ret
aile
rs a
nd
bene
ficia
ry fa
rmer
s’ p
artic
ipat
ion,
co
nseq
uent
ly a
ffect
ing
ferti
lizer
su
pply
and
dem
and
and,
at t
imes
, le
adin
g to
corru
ptio
n at
all
leve
ls.
Su
bsid
y pr
ogra
m in
trodu
ced
in re
spon
se to
20
08 fe
rtiliz
er an
d fo
od c
risis
has
negl
ecte
d co
mpl
emen
tary
inve
stmen
ts to
in
crea
se su
pply
and
dem
and.
Im
porte
rs-G
oG n
egot
iate
d pr
ices
also
be
com
e th
e (n
on-s
ubsid
ized
) ope
n m
arke
t pr
ice.
Im
porte
rs-G
oG p
rice
nego
tiatio
n al
low
s im
porte
rs to
pot
entia
lly c
aptu
re a
larg
er
prof
it m
argi
n. In
this
nego
tiatio
n,
impo
rters
fact
or in
the p
rice
the
pote
ntia
l ef
fect
of m
acro
-insta
bilit
y an
d de
valu
atio
n of
the
curre
ncy.
Also
cons
ider
ed ar
e th
e de
ficie
ncie
s of t
he p
rogr
am, l
ike
late
go
vern
men
t sub
sidy
paym
ents
to
impo
rters
am
ong
othe
rs, t
o th
eir b
enef
it,
whi
le n
egle
ctin
g th
e do
mes
tic d
istrib
utio
n ne
twor
k. T
his p
roce
ss c
ontri
bute
s to
ferti
lizer
cos
t inc
reas
es.
Su
bsid
y pr
ogra
ms d
o no
t inc
entiv
ize
impo
rters
to su
pply
targ
eted
farm
ers
addi
tiona
l nee
ds o
f fer
tiliz
er b
eyon
d w
hat
the
prog
ram
dem
ands
and
allo
ws,
thus
re
stric
ting
the e
xpan
sion
of th
e m
arke
t.
La
ck o
f rev
enue
s to
fund
subs
idy
prog
ram
s pla
ces b
urde
n on
dist
ribut
ion
netw
ork,
mai
nly
on im
porte
rs w
ho h
ave
to
wai
t up
to a
yea
r or m
ore f
or su
bsid
y pa
ymen
ts. C
onse
quen
tly, t
his i
nflu
ence
s a
high
er c
ost o
f fer
tiliz
er si
nce
impo
rters
fa
ctor
-in th
is po
tent
ial b
urde
n in
the
nego
tiate
d pr
ice
unde
r the
subs
idy
prog
ram
.
G
oG sh
ould
use
a c
ombi
natio
n of
wel
l-tar
gete
d,
time-
limite
d su
bsid
ies a
nd p
erha
ps co
ver o
ther
in
puts
and
serv
ices
, i.e
., se
eds,
cred
it fo
r fe
rtiliz
er im
porta
tion.
Mor
e im
porta
ntly
, it i
s re
com
men
ded
to su
bsid
ize
cred
it fo
r far
mer
s, pr
omot
e co
nsum
ptio
n of
ferti
lizer
/inpu
ts an
d pr
ovid
e m
arke
t acc
ess.
Im
plem
ent e
ffect
iven
ess e
nhan
cing
mea
sure
s an
d/or
mea
sure
s to
indu
ce d
ynam
ic e
ffect
iven
ess
like
mul
tiple
subs
idie
s and
inve
stmen
ts ta
rget
ed
at b
oth
the s
uppl
y an
d de
man
d sid
es, e
xpec
ted
to
have
a m
ultip
licat
ive
effe
ct ra
ther
than
a si
ngle
su
bsid
y on
the s
uppl
y sid
e.
Le
vel o
f sub
sidy
mus
t be
set w
ithin
the
coun
try
budg
etar
y co
nstra
ints
in a
way
that
will
not
di
scou
rage
dom
estic
priv
ate s
ecto
r par
ticip
atio
n in
the s
ubsid
y pr
ogra
m d
ue to
late
/no
paym
ents.
G
iven
the
vola
tility
of t
he in
tern
atio
nal f
ertil
izer
m
arke
t, th
e G
oG sh
ould
revi
sit th
e su
bsid
y pr
ogra
m. B
ette
r tar
getin
g to
the
inte
nded
fa
rmin
g po
pula
tion
is ne
eded
. In
the
proc
ess,
elim
inat
e th
e re
tail
pric
e ne
gotia
tions
and
favo
r a
mor
e op
en co
mpe
titio
n in
the
impo
rtatio
n an
d di
strib
utio
n of
ferti
lizer
and
a m
ore
even
spre
ad
of m
argi
n al
ong
the
dom
estic
supp
ly c
hain
to
ince
ntiv
ize
the e
xpan
sion
of th
e dist
ribut
ion
netw
ork
clos
er to
farm
ers.
(con
tinue
d)
Tabl
e 3.
Sum
mar
y M
atri
x of
Key
Con
stra
ints
and
Pol
icy
Rec
omm
enda
tions

21
(con
tinue
d)
Tabl
e 3.
Sum
mar
y M
atri
x of
Key
Con
stra
ints
and
Pol
icy
Rec
omm
enda
tions
(con
tinue
d)

22
Tabl
e 3.
Sum
mar
y M
atri
x of
Key
Con
stra
ints
and
Pol
icy
Rec
omm
enda
tions
(con
tinue
d)
(con
tinue
d)

23
Tabl
e 3.
Sum
mar
y M
atri
x of
Key
Con
stra
ints
and
Pol
icy
Rec
omm
enda
tions
(con
tinue
d)
(con
tinue
d)

24
Tabl
e 3.
Sum
mar
y M
atri
x of
Key
Con
stra
ints
and
Pol
icy
Rec
omm
enda
tions
(con
tinue
d)

25
ReferencesAfrican Development Bank Group. 2002. “Ghana Agriculture Sector Rehabilitation Programme,” Program Performance Report (PPER).
Banful, A.B. 2009. “Operational Details of the 2008 Fertilizer Subsidy in Ghana—Preliminary Report,” GSSP Background Paper 18, IFPRI.
Breisinger, C., X. Diao and J. Thurlow. 2008. “Agriculture for Development in Ghana, New Opportunities and Challenges,” IFPRI Discussion Paper 00784.
Bumb, B.L., J.H. Teboh and J.K. Atta. 1994. “Ghana-Policy Environment and Fertilizer Sector Development,” Technical Bulletin T-41, IFDC.
Chemonics/IFDC. 2007. “Fertilizer Supply and Cost in Africa.”
IFA and FAO. 2005. “Fertilizer Use by Crop in Ghana,” Rome, Italy.
IFDC. 2008. “State of Agri-Inputs Market in Ghana,” Draft report.
Krausova, M., and A.B. Banful. 2010. “Overview of Agricultural Input Sector in Ghana,” IFPRI/DSGD Discussion Paper 01024.
Ministry of Food and Agriculture, Government of Ghana. 2007. “National Fertilizer Strategy.”
Ministry of Food and Agriculture’s Statistics, Research and Information Directorate (SRID). 2009. “Agriculture in Ghana, Facts and Figures, 2008.”
The World Bank. 2009. “Project Appraisal Document for a Transport Sector Project Proposal, Republic of Ghana.”
USAID West Africa Trade Hub. 2010. “Transport and Logistics Cost on the Tema-Ouagadougou Corridor,” West Africa Trade Hub Technical Report #25, USAID/West Africa.
USAID. 2008. “Commercial Legal and Institutional Reform Diagnostic of Ghana’s Agriculture Sector (AgCLIR:GHANA), Agenda for Action.”
26
Given the importance of the government’s subsidy program in the fertilizer price setting in Ghana, it is relevant to present a brief description of the program that was initially established in response to the fertilizer crisis of 2007-08. 2010 was the third year the subsidy program was implemented, with a modified delivery approach relative to 2009. Up to the time of this assessment update, it was not clear how long the program was to remain in place.
Overview of the SubsidySubsidies are not new to Ghana. In fact, COCOBOD’s fertilizer subsidy targeted to cocoa producers has been in place for many years. COCOBOD is a parastatal organization, which provides direct services to cocoa farmers in the form of technical assistance, fertilizer and other input supply, cocoa processing and output marketing in domestic and international markets. The COCOBOD fertilizer subsidy is a unique self-sustained subsidy paid with earnings from cocoa exports. Based on sales estimates by wholesalers in the Brong Ahafo region, the fertilizer provided to farmers under the COCOBOD subsidy has an estimated cost of about US $34 per 50-kg bag of NPK and is sold to producers at a nominal price of more than US $40 per 50-kg bag, with cocoa producers paying about $15. Consequently, fertilizer for cocoa production is apparently heavily subsidized, estimated at more than 60 percent of the nominal price. Given the lack of transparency in COCOBOD, however, it is not clear if rent-seeking exists, which affects the nominal price and subsidy offered to farmers.
During the 2007-08 fertilizer crises, the GoG introduced a second and more comprehensive fertilizer subsidy coupon program to target the millions of smallholder farmers who produce staple food crops. Smallholder farmer producers of export crops (e.g., cocoa) were not explicitly excluded if they also produced food crops. In essence, this smaller group of farmers that produce staple food crops in addition to cocoa could make use of the new subsidy program to complement the allowance under the COCOBOD subsidy program. For example, since cocoa producers are allowed a maximum of 12 bags of fertilizer under the COCOBOD subsidy, any amount beyond that quantity could be acquired from the new subsidy program for application on food crops. So, while smallholder commercial farmers typically benefit from other input support programs, e.g., through contract farming with plantation companies and COCOBOD in the case of cocoa,
fertilizer intended for cocoa production may actually be used for food crop production and vice versa.
Every year, the GoG makes a budgetary allocation under the agricultural sector support program to subsidize fertilizer based on historical fertilizer consumption by small farmers. In 2009, this amount was estimated to be at least 50 percent of total imports. The rest of fertilizer imported by the private sector is used by the cocoa sector and for rubber, palm oil and other plantation crops. In 2009, the estimated fertilizer consumption by small farmers was about 107,000 mt based on the amount covered by the subsidized coupon program.
As previously stated, in 2008 and 2009, retail prices of fertilizer distributed and sold under this subsidy in the domestic market were set by a negotiation between the importers and the GoG. This price was fixed on a per-bag basis (50-kg bag) for each fertilizer product imported and sold in-country. However, the sale price to the final consumer varied according to the region where the product was delivered. This price differential was expected to reflect the transportation cost from port to the point of sale, which is typically the wholesale regional warehouse. There was an additional domestic transportation cost incurred between the wholesaler and the retailer and between the retailer and the farm, which was not accounted for in the importer-GoG negotiated price.
The negotiated price, according to the importers, was estimated taking into consideration the fluctuation of fertilizer prices in the international market, the different cost components along the fertilizer supply chain and, more importantly, the expected exchange rate at the time of product delivery in the future. Negotiated prices also included a markup of 2.00 GHC per 50-kg bag, allowed for the distributors and retailers in compensation for coupon handling. The set price was the same as in the open market for non-subsidized fertilizer and for farmers who needed to purchase extra quantities beyond the amount allowed under the subsidy program. In the subsidized and open market price determination, one importing firm dominated although most importers participated in the subsidized price negotiation with the government. Since the domestic distribution and retail network did not participate in price determination and negotiation, they were considered price takers.Table A-1 shows the coupon value and sale price of the various products at the main retail outlet in each of the 10 regions in Ghana. The sale price varies according to the transportation costs to each region and includes
Annex. The 2009 and 2010 Fertilizer Subsidy Program

27
the GHC 2.00 markup (about US $1.45) allowed by the government to compensate the wholesaler and retailer for handling the coupons. The portion of total fertilizer price to be paid by farmers (normally in cash) is the same in all regions, a price that is fixed by the importers and government negotiation. In 2009, the prices paid by farmers after the coupon were: for urea US $18.60 (GHC 26.00), for AS US $12.86 (GHC 18.00), N-P-K/T-15 US $18.60 (GHC 26.00) and N-P-K/23-10-5 was US $17.15 (GHC 24.00) (MoFA).
The overall average coupon value across all regions and products was estimated at US $14.60 (GHC 20.4) per 50-kg bag, which represents an average of 45 percent of the fertilizer’s total price. The highest level of subsidy was
for N-P-K formulations with an average of 52 percent across all regions; the subsidy was even higher than the average for the northern and upper regions. The lowest level of subsidy was for urea, with an average of 32 percent across all regions, while AS received an intermediate level of 44 percent on average. All subsidy levels for each product follow a similar pattern according to the distance from port to the region of final delivery and sale. The farther away the region, the higher the percentage value of the coupon is in relation to the total price, which perhaps is intended to compensate for the additional domestic transportation cost in the price.The original (2008) subsidy implementation modality set a pan-territorial price based on government-importer negotiations and using coupons or vouchers that were expected to cover on average 50 percent of negotiated
prices, targeted to specific fertilizer products and regions. As such, vouchers were not intended to target the subsidy to smallholder producers of staple food crops but to the products, as a way to make sure importers and distributors served all regions in the country and to verify the payments to importers, since they were refunded the subsidized component only for fertilizer sold.
During the original modality (in 2008 and 2009), coupons were issued by the MoFA and distributed by the extension agents to the farmers. Each agent caters to at least 25 small farmers. For farmers to receive the coupon, they had to visit their respective extension agent; then, for the coupons to be redeemed by the farmer at a wholesale or retail store, they required the signature of
the MoFA district director. As such, farmers had to visit the extension agents and the district director to get the coupons and have them signed and stamped with the MoFA seal; then, farmers were expected to redeem the signed and sealed coupons at the nearest retail store of their preference. Given the low probability of always finding the extension agents and regional directors in their respective offices when needed, farmers had to make several trips to claim their vouchers and have them signed and sealed; a long process that discouraged many farmers from claiming or even using the vouchers. Allegedly, farmers were even more discouraged by demands for payment from these government agents in order to claim their vouchers.
*The exchange rate considered for estimating the coupon value and the product price is 1.4 GHC to US $1.00.
Source: IFDC data collected during country visits and interviews.
Table A-1
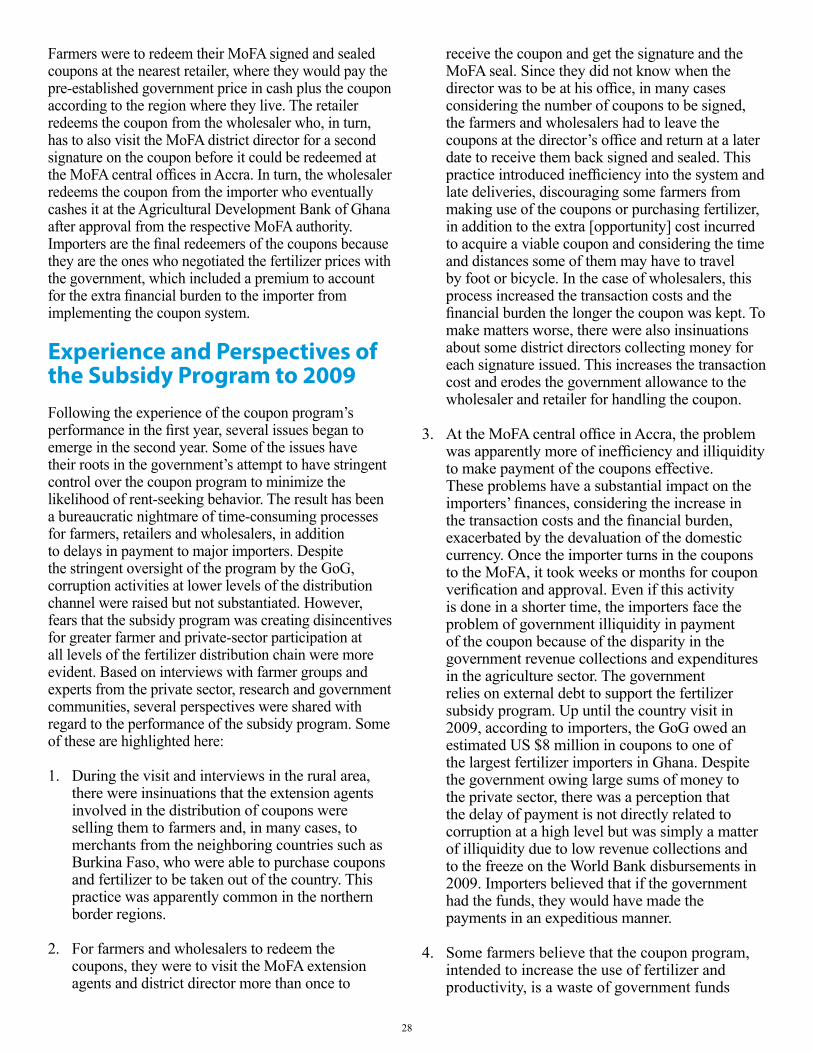
28
Farmers were to redeem their MoFA signed and sealed coupons at the nearest retailer, where they would pay the pre-established government price in cash plus the coupon according to the region where they live. The retailer redeems the coupon from the wholesaler who, in turn, has to also visit the MoFA district director for a second signature on the coupon before it could be redeemed at the MoFA central offices in Accra. In turn, the wholesaler redeems the coupon from the importer who eventually cashes it at the Agricultural Development Bank of Ghana after approval from the respective MoFA authority. Importers are the final redeemers of the coupons because they are the ones who negotiated the fertilizer prices with the government, which included a premium to account for the extra financial burden to the importer from implementing the coupon system.
Experience and Perspectives of the Subsidy Program to 2009Following the experience of the coupon program’s performance in the first year, several issues began to emerge in the second year. Some of the issues have their roots in the government’s attempt to have stringent control over the coupon program to minimize the likelihood of rent-seeking behavior. The result has been a bureaucratic nightmare of time-consuming processes for farmers, retailers and wholesalers, in addition to delays in payment to major importers. Despite the stringent oversight of the program by the GoG, corruption activities at lower levels of the distribution channel were raised but not substantiated. However, fears that the subsidy program was creating disincentives for greater farmer and private-sector participation at all levels of the fertilizer distribution chain were more evident. Based on interviews with farmer groups and experts from the private sector, research and government communities, several perspectives were shared with regard to the performance of the subsidy program. Some of these are highlighted here:
1. During the visit and interviews in the rural area, there were insinuations that the extension agents involved in the distribution of coupons were selling them to farmers and, in many cases, to merchants from the neighboring countries such as Burkina Faso, who were able to purchase coupons and fertilizer to be taken out of the country. This practice was apparently common in the northern border regions.
2. For farmers and wholesalers to redeem the coupons, they were to visit the MoFA extension agents and district director more than once to
receive the coupon and get the signature and the MoFA seal. Since they did not know when the director was to be at his office, in many cases considering the number of coupons to be signed, the farmers and wholesalers had to leave the coupons at the director’s office and return at a later date to receive them back signed and sealed. This practice introduced inefficiency into the system and late deliveries, discouraging some farmers from making use of the coupons or purchasing fertilizer, in addition to the extra [opportunity] cost incurred to acquire a viable coupon and considering the time and distances some of them may have to travel by foot or bicycle. In the case of wholesalers, this process increased the transaction costs and the financial burden the longer the coupon was kept. To make matters worse, there were also insinuations about some district directors collecting money for each signature issued. This increases the transaction cost and erodes the government allowance to the wholesaler and retailer for handling the coupon.
3. At the MoFA central office in Accra, the problem was apparently more of inefficiency and illiquidity to make payment of the coupons effective. These problems have a substantial impact on the importers’ finances, considering the increase in the transaction costs and the financial burden, exacerbated by the devaluation of the domestic currency. Once the importer turns in the coupons to the MoFA, it took weeks or months for coupon verification and approval. Even if this activity is done in a shorter time, the importers face the problem of government illiquidity in payment of the coupon because of the disparity in the government revenue collections and expenditures in the agriculture sector. The government relies on external debt to support the fertilizer subsidy program. Up until the country visit in 2009, according to importers, the GoG owed an estimated US $8 million in coupons to one of the largest fertilizer importers in Ghana. Despite the government owing large sums of money to the private sector, there was a perception that the delay of payment is not directly related to corruption at a high level but was simply a matter of illiquidity due to low revenue collections and to the freeze on the World Bank disbursements in 2009. Importers believed that if the government had the funds, they would have made the payments in an expeditious manner.
4. Some farmers believe that the coupon program, intended to increase the use of fertilizer and productivity, is a waste of government funds

29
because, despite the use of fertilizer, they have not seen a substantial increase in their yields. The main reason attributed is that they believe they are being sold the wrong formulation according to their crops and soil needs, or they are getting adulterated product with low nutrient content and short in weight. However, there is a possibility that some farmers may not have the technical knowledge to make proper use of fertilizer and consequently are not getting the expected results.
5. If the price of fertilizer increases due to unforeseen external circumstances affecting the cost of the major components (international fertilizer price, finance cost, transportation), the final price to farmers did not change. The burden of this extra cost was instead passed on to the government, which increased the subsidy level to compensate the importers for the extra cost, neglecting again the domestic distribution network.
According to GAIDA, although the fertilizer subsidy coupon program has been beneficial to both farmers and importers, traders in the domestic distribution network have not seen the benefits other than increased sales. Sales increase has not translated into a significant increase in profits among traders proving a disincentive to actively participate in the coupon program or to expand their businesses. Moreover, although well-intentioned, the program has been plagued with many other problems. First, the program allows the importer to negotiate and set the fertilizer price and effectively leaves sufficient room for the few importers to capture a larger than normal profit margin. The profit margin is a hedge against risks associated with fertilizer price fluctuation in the international market, financial losses resulting from unsold and stored stock and further currency devaluation. However, this hedging does not apply to traders in the domestic distribution network who are not protected against such risks, especially from the negative effects of carrying costs, financial risk and devaluation.
The 2010 Modified Subsidy ProgramDue to the number of challenges faced with the implementation modalities of the original (2008-09) subsidy program, in 2010 the fertilizer voucher system was replaced with a “waybill” receipt system. A feature of the 2010 program is the elimination of vouchers and inclusion of all farmers (small-, medium- and large-scale) involved in all types of production activities. This modified “waybill” subsidy program is designed to absorb the operational
cost of fertilizer importation and distribution (port handling charges, loading and transport costs as well as commission and margins for the actors along the supply chain), which is paid for by the government in the form of subsidy. Under this modified subsidy, farmers receive on average a 40 percent subsidy per 50-kg bag of fertilizer across all eligible fertilizer products. Although the amount of this subsidy is lower relative to the amount under the coupon system, it provides access to more fertilizer and at a reasonable price to farmers.
This new waybill system was also designed and implemented by MOFA in close collaboration with the major fertilizer companies whereby each company has allocated quotas of various fertilizer types after price negotiations. The companies are to import fertilizers, clear them from the ports, pay all the charges and deliver allocated quantities of the various types of fertilizers to the designated regions and districts for sale to farmers by their registered sales agents (retailers). The estimated subsidy per 50-kg fertilizer bag is paid after sales, and presentation and reconciliation of the relevant waybills at: (1) district level by the companies’ agents, the district desk officer for fertilizer and district director of agriculture and (2) at the regional level by the regional desk officer for fertilizer and regional director of agriculture, using designated forms. All waybills for a given company and a given time period (normally, a month) are authenticated by the national desk officer for fertilizer and director of Agricultural Extension Services and audited by the treasury before the amount due to a company is paid.
Another feature of the implementation of the modified subsidy program is that all fertilizer agents/retailers across the country who want to retail fertilizer must register with the MoFA district offices. Fertilizer companies distribute fertilizer from their warehouses to their main distributors, where the MoFA regional desk officer verifies and signs the waybill to record the quantity of fertilizer consigned to a distributor. The waybill is counter checked and signed by the regional director of agriculture. The distributor then delivers the fertilizer to their agents at the various districts with waybills and invoices. The district desk officer (MoFA) also inspects the waybill and signs it. When the fertilizer is received at the district level, the waybill is attached to form “A.” At the end of every month, all agents fill form “A” indicating the quantity of fertilizer sold and the balance thereof (which is verified and signed by the district desk officer for fertilizer and countersigned by the district director of agriculture) and submit

30
form “A” to their distributors. The distributors also transfer the quantity sold by different agents from the form “A” onto another form “B,” which is signed by the regional desk officer and countersigned by the regional director. Form “B” is submitted by their distributors to the fertilizer companies or importers. The monthly sales returns from distributors for each region are compiled by the fertilizer companies onto form “C” and then the sales for the regions are compiled onto form “D.” The completed forms (A, B, C and D with the attached waybills) are submitted to MoFA – National Directorate of Agricultural Extension Services for verification by the national desk officer for fertilizer and countersigned by the director. After a successful verification and audit of a company’s request for payment of the subsidy, the amount involved is approved for payment.
This modified subsidy system has a number of advantages: it has eliminated some of the challenges and inefficiencies faced by MOFA in its delivery while providing better access to fertilizer by farmers who can afford the non-subsidized component of the price and allowing the participation of more retailers. However, since it is not targeted, there is a high potential for market displacement. This has created a burden to the private sector, a fact that is recognized by MoFA and justified for the sake of effective monitoring of the subsidy program and to minimize cheating.
Concluding RemarksEvidently, the subsidized coupon program is creating disincentives for the development of the domestic fertilizer distribution network and supply chain in Ghana. According to the in-country perspectives, in trying to make fertilizer more affordable to most farmers, the GoG has unintentionally restrained the expansion of input dealers and distribution networks. Some of the key problems arising are inherent to the existing market structure of the fertilizer import and distribution system in Ghana including:
• Given the implementing mechanism of the subsidy program, the potential for larger than normal profit margins being captured at the import level is high indeed as reflected in the uneven spread of marketing costs. These are mostly concentrated at the import level and essentially undermine the ability to capture additional profit margins among the domestic input dealers and distribution networks.
• Generally, importers have little incentive to develop an effective distribution network of their own and, even more so, to reach more remote rural
areas. They also may not have the incentive to import extra quantities to supply unforeseen needs among the farmers’ beneficiaries of the subsidy program, therefore restraining the actual quantity of fertilizer required.
• Given the structure of the fertilizer industry dominated by few importers, local businesses are potentially excluded from participating in the tender process, favoring the major importers who are mostly international business subsidiaries of fertilizer-producing and/or marketing firms who negotiate prices with the government.
• Finally, by neglecting other complementary investments that can lower the delivery costs of fertilizer, along the supply chain (e.g., through improved transportation and access to information) and for increasing demand at the farm level (e.g., through research and extension), it is unlikely that the subsidy can be sustained over the long run from a fiscal perspective.

Paper Series IFDC – P-40December 2012
IFDCP.O. Box 2040Muscle Shoals, Alabama 35662 (USA)