IMPROVING CHILD AND MATERNAL HEALTH: WHY ADOLESCENT GIRL PROGRAMMING MATTERS · ·...
46
IMPROVING CHILD AND MATERNAL HEALTH: WHY ADOLESCENT GIRL PROGRAMMING MATTERS POST INTERVENTION EVIDENCE FROM NIGER September, 2015
Transcript of IMPROVING CHILD AND MATERNAL HEALTH: WHY ADOLESCENT GIRL PROGRAMMING MATTERS · ·...

IMPROVING CHILD AND
MATERNAL HEALTH:
WHY ADOLESCENT GIRL
PROGRAMMING
MATTERS
POST INTERVENTION
EVIDENCE FROM NIGER
September, 2015

2
Table of Contents
Executive Summary ........................................................................................................... 3
Study Background .............................................................................................................. 5
Adolescent Girls in Niger: A Brief Overview ........................................................................ 6
Mercy Corps’ Sawki Program in Niger ................................................................................. 7
Research Objectives ........................................................................................................... 8
Study Methodology ........................................................................................................... 9
Data Collection ........................................................................................................................ 9
Identification Strategy........................................................................................................... 10
Sample ................................................................................................................................... 11
Study Limitations................................................................................................................... 13
Key Findings: Reproductive Health Knowledge, Attitudes and Behaviors .......................... 13
Attitudes and Beliefs ............................................................................................................. 13
Family Planning Behaviors .................................................................................................... 17
Key Findings: Food Security and Livelihoods ..................................................................... 19
Health and Nutrition Knowledge and Behaviors .................................................................. 20
Dietary Diversity .................................................................................................................... 21
Ability to manage, cope with and adapt to shocks and meet food needs ........................... 22
Financial Literacy and Savings Behavior ............................................................................... 24
Key Findings: Empowerment and Social Status ................................................................. 24
Decision-making and Status .................................................................................................. 24
Social Capital and Social Support .......................................................................................... 25
Confidence, Status and Decision-Making Power .................................................................. 27
Sense of Place and Community ............................................................................................. 28
Girls Sharing Information ...................................................................................................... 29
Time Use................................................................................................................................ 30
Conclusion ....................................................................................................................... 31
Annex 1: Methodology .................................................................................................... 34
Villages and Number of Girls Surveyed ................................................................................. 34
Identification Strategy........................................................................................................... 35
Balancing ............................................................................................................................... 37
Program Exposure ................................................................................................................. 38
Annex 2: Additional Findings ............................................................................................ 41
Confidence and Aspirations (Breakdown of findings) .......................................................... 41
Sense of Place Score (Breakdown of findings) ...................................................................... 42
Access to resources ............................................................................................................... 42
Annex 3: Conceptual Framework and Variable Map ......................................................... 44

3
Executive Summary
With a global budget of $1.4 billion in 2016, USAID’s Title II Food for Peace (FFP) strives to end chronic hunger and malnutrition, while helping vulnerable families break the cycle of poverty. Stretching across the world, these programs share a strategic objective to reduce chronic malnutrition among pregnant and lactating women and children under age 5, with a focus on those under age 2. But among these pregnant and lactating women are adolescent girls, who have unique needs and risks. Every year, 16 million girls give birth, putting them at higher risk for anemia, malaria, HIV and other STDs, postpartum hemorrhage, obstetric fistula and death—childbirth is the second leading cause of death among girls globally.1 Adolescent pregnancy is also dangerous for babies: rates of preterm birth, low birth weight and asphyxia are higher among these babies, all of which increase the chance of death and future health problems.2 We must target adolescent girls before they are pregnant if we want to make strides in health outcomes for both mothers and babies.3 How effective are girl-centered strategies in improving the health, nutrition and food-security outcomes of adolescent girls and their families? With support from the Population Council under the Research Initiative for Success in Girl Programming (RISING), Mercy Corps conducted a post-test with control study of 829 adolescent girls, between the ages 10 to 18, in Niger. Consistently ranked as one of the lowest countries on the United Nations Human Development Index,4 women and girls are especially vulnerable in this country where fertility rates are one of the highest in the world, coupled with very poor maternal and child health outcomes.
This research examines the unique and combined effects of two models implemented through Mercy Corps’ Sawki program in Niger, which is one of the few FFP-funded development programs to specifically target adolescent girls. The Safe Space (SS) model (35 hours of direct intervention over 8 months) focuses on teaching girls essential nutrition actions, risks associated with early marriage and early pregnancy, reproductive health and the importance of education and basic literacy. The Safe Space + Livelihood (SS+L) model (87 to 91 hours of intervention over 19 to 20 months) includes all Safe Space components, but adds livelihood trainings that focus on livestock management (i.e., goat production, poultry care, and animal health training); gardening activities; and savings and loans activities. The research compares these two groups to a control group, in which girls received no interventions.
Like adolescent girls themselves, the data show a complex picture. Overall we see that girl-centered strategies are effective in building girls’ knowledge on health and nutrition practices, reproductive health and financial literacy; in evolving girls’ perceptions on family planning; and
1 See: http://www.who.int/maternal_child_adolescent/topics/maternal/adolescent_pregnancy/en/
2 Ibid
3 The Lancet 2103 Maternal and Child Nutrition Series
4 http://hdr.undp.org/en/data
4
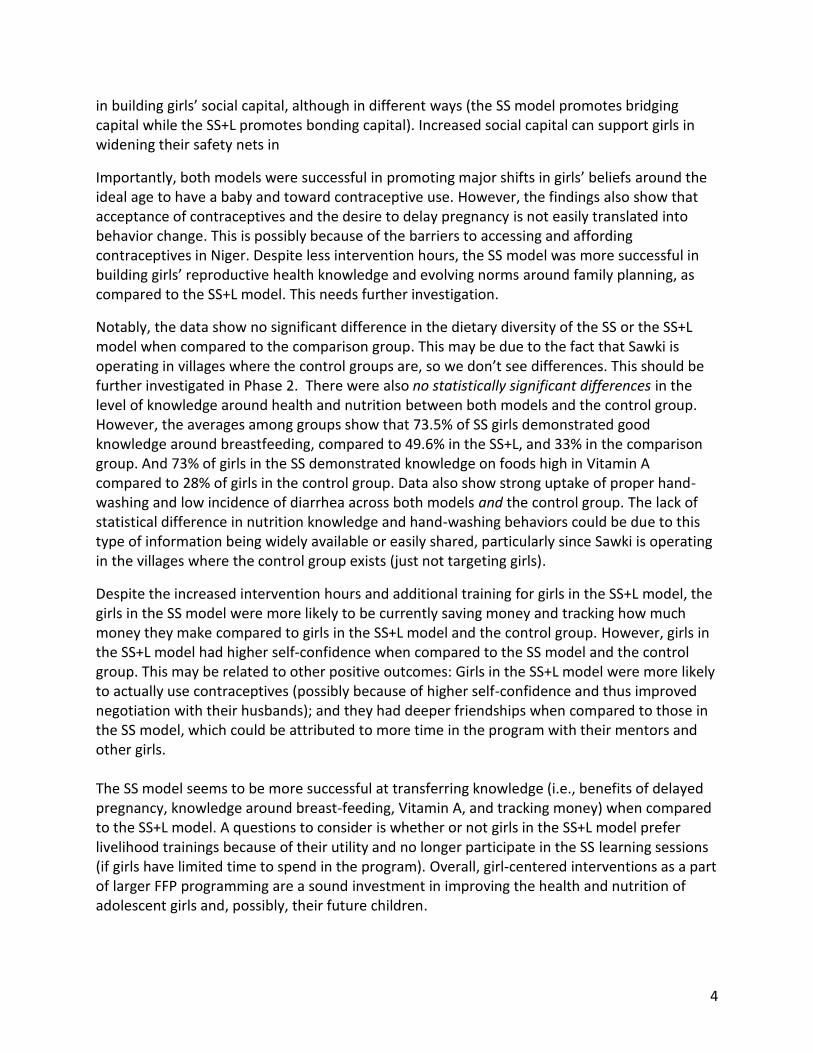
in building girls’ social capital, although in different ways (the SS model promotes bridging capital while the SS+L promotes bonding capital). Increased social capital can support girls in widening their safety nets in
Importantly, both models were successful in promoting major shifts in girls’ beliefs around the ideal age to have a baby and toward contraceptive use. However, the findings also show that acceptance of contraceptives and the desire to delay pregnancy is not easily translated into behavior change. This is possibly because of the barriers to accessing and affording contraceptives in Niger. Despite less intervention hours, the SS model was more successful in building girls’ reproductive health knowledge and evolving norms around family planning, as compared to the SS+L model. This needs further investigation.
Notably, the data show no significant difference in the dietary diversity of the SS or the SS+L model when compared to the comparison group. This may be due to the fact that Sawki is operating in villages where the control groups are, so we don’t see differences. This should be further investigated in Phase 2. There were also no statistically significant differences in the level of knowledge around health and nutrition between both models and the control group. However, the averages among groups show that 73.5% of SS girls demonstrated good knowledge around breastfeeding, compared to 49.6% in the SS+L, and 33% in the comparison group. And 73% of girls in the SS demonstrated knowledge on foods high in Vitamin A compared to 28% of girls in the control group. Data also show strong uptake of proper hand-washing and low incidence of diarrhea across both models and the control group. The lack of statistical difference in nutrition knowledge and hand-washing behaviors could be due to this type of information being widely available or easily shared, particularly since Sawki is operating in the villages where the control group exists (just not targeting girls).
Despite the increased intervention hours and additional training for girls in the SS+L model, the girls in the SS model were more likely to be currently saving money and tracking how much money they make compared to girls in the SS+L model and the control group. However, girls in the SS+L model had higher self-confidence when compared to the SS model and the control group. This may be related to other positive outcomes: Girls in the SS+L model were more likely to actually use contraceptives (possibly because of higher self-confidence and thus improved negotiation with their husbands); and they had deeper friendships when compared to those in the SS model, which could be attributed to more time in the program with their mentors and other girls. The SS model seems to be more successful at transferring knowledge (i.e., benefits of delayed pregnancy, knowledge around breast-feeding, Vitamin A, and tracking money) when compared to the SS+L model. A questions to consider is whether or not girls in the SS+L model prefer livelihood trainings because of their utility and no longer participate in the SS learning sessions (if girls have limited time to spend in the program). Overall, girl-centered interventions as a part of larger FFP programming are a sound investment in improving the health and nutrition of adolescent girls and, possibly, their future children.

5
Study Background
While global social and cultural norms have historically marginalized girls and viewed them as part of the poverty problem, there is a growing body of evidence that tells a different story. We now know that achieving positive development outcomes depends on the knowledge, choices and opportunities afforded to adolescent girls around the world. Investing in the education, health, safety and economic opportunities of adolescent girls is the key to ending inter-generational poverty because these investments have a positive ripple effect on families, communities and countries. A girl who is given access to education and protected from child marriage is able to delay her first pregnancy; give birth to fewer children; have healthier babies; enjoy good health; and decrease her risk for HIV/AIDS and domestic abuse.5 Given the opportunity to earn an income, girls and women reinvest 90% of their income into their families and have the power to boost their country’s GDP by 2%.6
But what are the most effective and impactful approaches to making these investments in adolescent girls? Mercy Corps set out to answer this question with support from the Population Council under the Research Initiative for Success in Girl Programming (RISING). Mercy Corps examined how two different girl-centered models impact the health, nutrition and food security outcomes of adolescent girls in Niger. The research tests the following hypotheses:
When girls participate in safe spaces and a tailored curriculum, their knowledge about health and nutrition practices will be enhanced, their attitudes about reproductive health will shift, and ultimately, girls will practice healthier behaviors, including appropriate family planning techniques to delay pregnancy. These healthier behaviors will decrease rates of child marriage and early pregnancy and improve food security for girls and their household.
When girls connect with their peers and trusted adults in safe spaces, they will have increased access to support networks, increasing their confidence and aspirations, their sense of place, and their social well-being. Enhanced support networks also improve girls’ abilities to cope with change.
When girls have the opportunity for livelihood training and income generation in addition to safe spaces, they will increase their ability to contribute to household income generation and the number of assets they own and control. This will, in turn, enhance their status within the household. Increased confidence and status in the household will better position girls to voice their opinions and concerns, and have a voice in major decisions about their life (i.e., when they marry and have children).
The RISING research fills a knowledge gap by demonstrating how targeting adolescent girls can improve overall health, nutrition and food security outcomes. Our hope is that this research will
5 See http://coalitionforadolescentgirls.org/wp-content/uploads/2014/02/2009PGY_ NewLessons.pdf
6 Jad Chaaban and Wendy Cunningham. Measuring the Economic Gain of Investing in Girls: The Girl Effect Dividend. The World Bank. August 2011
6
influence USAID and its Food for Peace Office to ensure their future strategy no longer focuses solely on pregnant and lactating women, but also includes adolescent girls before they become pregnant. The research will also inform how to best adjust and scale-up interventions that target adolescent girls to improve food security in Niger and beyond.
Adolescent Girls in Niger: A Brief Overview
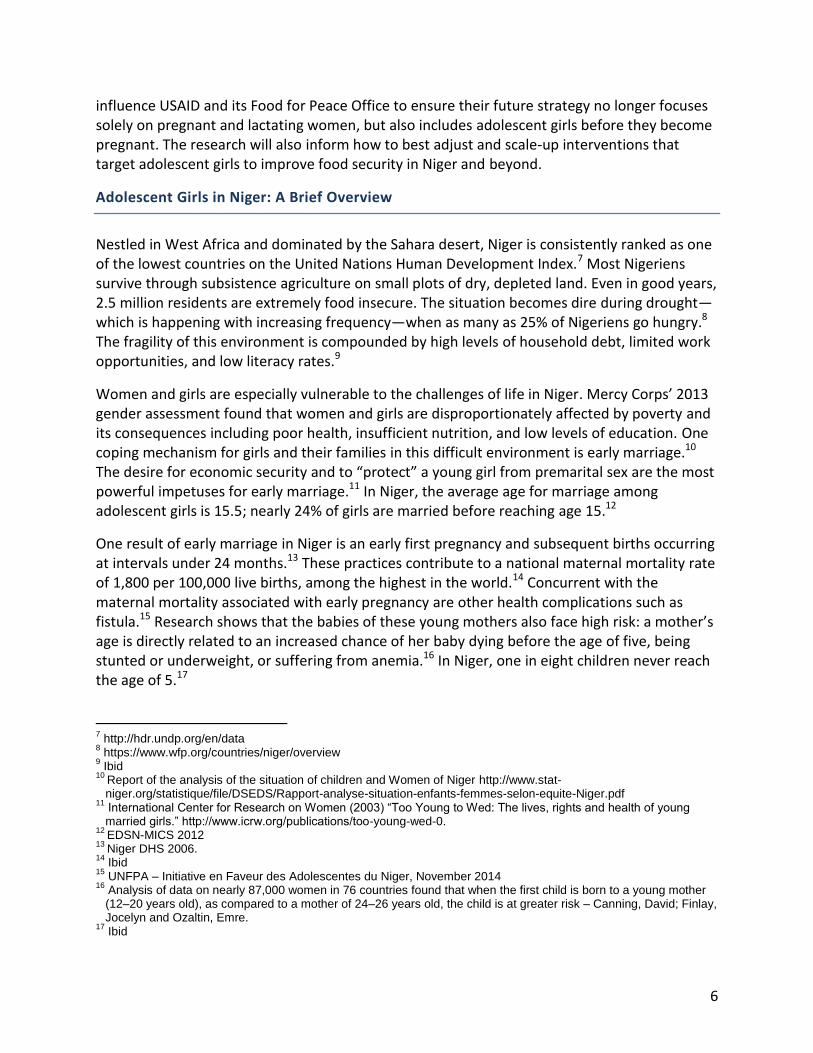
Nestled in West Africa and dominated by the Sahara desert, Niger is consistently ranked as one of the lowest countries on the United Nations Human Development Index.7 Most Nigeriens survive through subsistence agriculture on small plots of dry, depleted land. Even in good years, 2.5 million residents are extremely food insecure. The situation becomes dire during drought—which is happening with increasing frequency—when as many as 25% of Nigeriens go hungry.8 The fragility of this environment is compounded by high levels of household debt, limited work opportunities, and low literacy rates.9
Women and girls are especially vulnerable to the challenges of life in Niger. Mercy Corps’ 2013 gender assessment found that women and girls are disproportionately affected by poverty and its consequences including poor health, insufficient nutrition, and low levels of education. One coping mechanism for girls and their families in this difficult environment is early marriage.10 The desire for economic security and to “protect” a young girl from premarital sex are the most powerful impetuses for early marriage.11 In Niger, the average age for marriage among adolescent girls is 15.5; nearly 24% of girls are married before reaching age 15.12
One result of early marriage in Niger is an early first pregnancy and subsequent births occurring at intervals under 24 months.13 These practices contribute to a national maternal mortality rate of 1,800 per 100,000 live births, among the highest in the world.14 Concurrent with the maternal mortality associated with early pregnancy are other health complications such as fistula.15 Research shows that the babies of these young mothers also face high risk: a mother’s age is directly related to an increased chance of her baby dying before the age of five, being stunted or underweight, or suffering from anemia.16 In Niger, one in eight children never reach the age of 5.17
7 http://hdr.undp.org/en/data
8 https://www.wfp.org/countries/niger/overview
9 Ibid
10 Report of the analysis of the situation of children and Women of Niger http://www.stat-niger.org/statistique/file/DSEDS/Rapport-analyse-situation-enfants-femmes-selon-equite-Niger.pdf
11 International Center for Research on Women (2003) “Too Young to Wed: The lives, rights and health of young married girls.” http://www.icrw.org/publications/too-young-wed-0.
12 EDSN-MICS 2012
13 Niger DHS 2006.
14 Ibid
15 UNFPA – Initiative en Faveur des Adolescentes du Niger, November 2014
16 Analysis of data on nearly 87,000 women in 76 countries found that when the first child is born to a young mother (12–20 years old), as compared to a mother of 24–26 years old, the child is at greater risk – Canning, David; Finlay, Jocelyn and Ozaltin, Emre.
17 Ibid

7
Compounding the risks for Nigerien girls, school is perceived to have a high opportunity cost, so parents often keep their daughters home for domestic labor or give them away in marriage, limiting their opportunities to gain knowledge.18 In a country where the literacy rate is a dismal 28.7%, less than half of girls in Niger finish basic primary education.19
Mercy Corps’ Sawki Program in Niger
Sawki is a USAID-funded Development Food Aid Program (DFAP) that addresses the food security needs of more than 92,000 people in 62 villages across Maradi and Zinder, two of the most food-insecure regions in the country. It is one of the first DFAPs globally to target adolescent girls (ages 10 to 18) as a strategy to increase food security by decreasing child marriage and early pregnancy to combat subsequently high maternal and child mortality. As such, it offers the opportunity to examine how effective these girl-centered strategies are in improving the health, nutrition and food-security outcomes of adolescent girls and their families.
Funded by USAID, the $32 million program is implemented by Mercy Corps together with Helen Keller International (HKI) and supported by partnerships with the Government of Niger, local NGOs, the National Institute of Agronomy Research (INRAN) and the private sector. This complex food security program brings together complementary activities in nutrition, health, agriculture, livestock husbandry, livelihoods promotion, and market development. The program’s two strategic objectives are to: 1) reduce chronic malnutrition among pregnant and lactating women and children under five with an emphasis on children under two; and 2) increase the local availability of, and households’ access to, nutritious food by diversifying agricultural productivity, rural households’ income and increasing resilience to shocks.
Traditionally, DFAPs target women who are pregnant or lactating and do not target adolescent girls before they are pregnant. Targeting girls before they are married or pregnant is critical to: 1) improve an adolescent girl’s nutrition before she becomes pregnant, which evidence shows improves health outcomes for both mother and baby20; and 2) delay an adolescent girl’s first pregnancy, which also improves health outcomes for both mother and baby, as well as decreases the number of children a girl has in her lifetime. Currently the Sawki program reaches 3,656 girls, or 38% of all girls aged 10 to 18 in the targeted communities. Of girls who participate, 52% are between the ages of 10 and 14, while 37% reported being between the ages of 15 and 18. (The remaining 11% are not sure of their age.) Of girls who participate in Sawki, 10% are married. To engage girls, Sawki works with families and village leaders to create safe spaces in which girls gather to discuss topics adapted for their age group. This study examines the effectiveness of two models that the Sawki program is using to target adolescent girls:
18
Ibid 19
Nigerien Ministry of Education, Basic Education Statistics, 2012. 20
The Lancet 2103 Maternal and Child Nutrition Series

8
In Safe Spaces (SS), girls learn life skills, including essential nutrition actions, risks associated with early marriage and early pregnancy, and the importance of education and basic literacy. Older, married girls learn more about reproductive health. Each safe space is led by a mentor, usually an iya (traditional mentor) who offers support and advice within and outside of the safe space. The weekly meetings take place in local schools or private homes. Girls taking part in at least 80% of the meetings receive a 50 kilogram lentil ration every six months.
In Safe Space + Livelihoods (SS+L), in addition to the elements of the Safe Space Model described above, girls participate in livelihood trainings that focus on livestock management (i.e., goat production, poultry care, and animal health training); gardening activities; and savings and loans activities.
Research Objectives
In Phase 1 of the RISING research project (January 2015 – June 2015), Mercy Corps conducted a post-test with control study with 829 adolescent girls, between the ages 10 to 18, to examine the unique and combined effects of safe spaces and livelihood activities on health, nutrition and food security outcomes of adolescent girls. The principal research question is: How effective are Safe Space and Safe Space + Livelihood models at impacting the health, nutrition and food security outcomes of adolescent girls?
To investigate this question, the study examined assumptions in the logic utilized by the girl-focused activities in Mercy Corps’ Sawki program (See Annex 3 for the Conceptual Framework and Variable Map). Theories of Change tested through the research include: Effectiveness of Safe Space Model:
When programs provide girls with safe spaces and a tailored, relevant curriculum, girls’ knowledge encompassing health and nutrition practices and life skills (i.e., financial literacy) will improve; their attitudes about reproductive health will shift; and ultimately, girls will practice healthier behaviors, including appropriate family planning techniques to delay pregnancy and saving for an emergency. By practicing healthier behaviors, food security for girls and their household will improve, and rates of child marriage and pregnancy will fall.
When programs provide girls with safe spaces to connect with their peers and trusted adults, girls will have increased access to support networks they can rely on, increasing their confidence and aspirations, their sense of place, and their social well-being. Enhanced support networks are also expected to improve girls’ abilities to cope with change (ranging from major life changes – such as marriage, problems at home, pregnancy, or a family death – to community-wide disasters, such as drought), and ultimately increase their overall health, well-being and happiness.

9
Effectiveness of Safe Space + Livelihood Model:
When programs provide livelihood training and income generation opportunities for girls, girls will increase their ability to contribute to household income-generation and the number of assets they own and control. This will, in turn, enhance their status within the household. By increasing their income and asset accumulation, we expect these activities to increase girls’ confidence and aspirations for a better future, as well as their ability to manage/cope with change. With increased confidence and increased status within the household, we expect that girls will be better positioned to voice their opinions and concerns, and have a voice in major decisions about their life (including when they marry and have children).
Following this current phase of the study, Phase 2 will include a randomized control trial (RCT) to be conducted in the 6 comparison villages that were included in Phase 1. The RCT began in August 2015 and will randomize 406 adolescent girls in the 6 comparison villages into treatment and control groups. After 12 months of program implementation (September 2016), we will compare outcomes among girls in each group. (Girls not selected via lottery will remain our control group, and will then begin the program in late summer 2016.) This next phase of research will strengthen the validity of our RISING study and provide additional quantitative and qualitative evidence.
Together, Phase 1 and Phase 2 of the RISING research project will provide evidence on the effects of girl-focused programming and whether or not interventions that target adolescent girls can contribute to broader development goals.
Study Methodology
Data Collection
A quantitative survey for adolescent girls was developed and finalized in December 2014 to compare the outcomes of adolescent girls that have been exposed to the Safe Space model (35 hours of programming over 8 months); girls who have been exposed to the Safe Space + Livelihood model (87 to 91 hours of programming over 19 to 20 months); and girls who received no intervention. The survey instrument included modules covering the following:
1. Reproductive health knowledge, attitudes, and behaviors; 2. Food security, including food consumption and dietary diversity indices; 3. Health and nutrition behaviors and knowledge, including information on hand washing
and proper nutrition for pregnant and lactating women and for children under 5; 4. Access to resources and time-use; 5. Ability to manage, cope with and adapt to shocks and meet food needs; 6. Confidence, status, and decision-making power; and 7. Access to social capital and safety nets, including breadth and depth of social networks
and access to social support.

10
Because activities for girls have yet to begin in 6 of Sawki’s target communities, the RISING research provided a unique opportunity to layer this post intervention survey on top of existing program plans. The survey, conducted from January 2015 – March 2015, compared outcomes among girls in a comparison condition versus girls in safe spaces-only programming and girls in safe spaces that are receiving livelihood support and training (See Annex 1 for a detailed list of villages and girls surveyed).
Information from the Sawki baseline was used to match 6 comparison villages where safe space programming had yet to be implemented with 12 treatment villages. For each of the 6 comparison communities we examined data including:
Total population; Total number of girls between 10 and 18; Total number and percentage of girls between 10 and 18 who are married; Percentage of households in communities categorized as “poor” or “very poor;” and Percentage of total population reporting agriculture as the primary source of income.
This information was used to match the 6 comparison villages with 12 treatment villages from the communities where Sawki has been implementing program activities (6 of the treatment villages have only implemented safe spaces activities since June 2014 and 6 have implemented safe spaces and girl-focused livelihood activities since July 2013).
Identification Strategy
To create a valid measure of the impact of each treatment group, we constructed a propensity score matching (PSM) difference-in-difference model to match girls within the two distinct treatment groups with a separate sample of girls in the comparison village group (i.e., comparing observable differences in outcomes between those who received the treatment versus those who did not). Possible bias estimates of the program may arise due to unobserved characteristics affecting the probability of receiving treatment. For example, self selection or other unobservable characteristics may drive participants into either treatment group. The PSM scoring estimator helps control for this possible selection bias (See Annex 1 for more details). Because baseline demographic variables were not available for respondents, we matched beneficiaries on endline demographic covariates that were predicted to not have changed due to participation in the Sawki program. This matching creates a credible comparison group by matching treatment recipients to similar non-recipients using the following set of variables: age; education; number of siblings; with whom the respondent lives; and primary livelihood of family. We used kernel matching to create a counterfactual for each treatment observation by forming a weighted average of all the comparison observations. The regressions controlled for the variables listed above, thus these results reflect the average effects holding these variables constant. Balancing tests were conducted to investigate how the two program groups

11
compared to the comparison group along a range of demographic variables predicted to not be associated with the treatment effect (see Annex 1 for details) 21.
Sample
The sample skews toward adolescent girls who are young and unmarried, which generally reflects the population of girls who participate in Sawki (52% are 10 to 14; 37% of girls are 15 to 18; and 11% are not sure of their age). As a strategy to improve overall maternal and child health, the program primarily focuses on equipping unmarried, younger girls with the knowledge they need to practice healthy behaviors, including delaying marriage and early pregnancy; it focuses on equipping married girls with the knowledge they need to have healthy pregnancies and babies.
It is important to note that younger, unmarried adolescent girls are the majority of Sawki participants, which represents the global trend to miss older and/or married adolescent girls. We know that when girls reach puberty, their world becomes much smaller. Parents or guardians limit girls’ mobility and freedom to protect them from perceived and actual threats (i.e., sexual assault); and this includes forcing them to leave school, increasing their responsibilities at home, and limiting their time with friends. They also become eligible for marriage. Younger adolescent girls generally have more freedom of movement and time to participate in activities outside of the home.
Second, only 10% of girls who participate in Sawki are married. This is a lower percentage than our sample, which is 13.7% for the comparison group, 15.5% for the SS group, and 21.5% for the SS+L group. It is also lower than the national average as 24% of girls are married before age 15 and the average age for marriage is 15.5. This low participation rate speaks to the wider challenge of targeting and reaching married adolescent girls who have unique health, economic and social needs.
The challenge is twofold: Married girls remain invisible to many policymakers and development actors; and, as such, programming targets young girls or married adult women and mothers. Second, married girls face increased isolation from their friends and families; this isolation coupled with a lack of autonomy means that girls miss out on health care, education and meaningful employment. Marriage also leads to a dramatic increase in girls' workload at home, further limiting their ability to leave the house.22
In our sample, girls in the Safe Space intervention participated in 35 hours of programming. This is based on nearly 100% participation in one hour weekly sessions for 35 weeks (June 2014 to January 2015). Girls in the Safe Space + Livelihoods intervention participated in 87 to 91 hours of programming. This is based on nearly 100% participation in one hour weekly sessions for 87 to 91 weeks (June or July, 2013 to January 2015); livelihoods trainings took place for 48 of those weeks (March 2014 to January 2015).
21
Note: respondents whose age was reported outside the program target age range (10-18) were dropped from the database (total 41/852).
22 Peter McIntyre, Married Adolescents: No Place of Safety (Geneva: WHO, 2006)

12
Sample
Girls in Comparison
(No Treatment) Girls in Safe Space
Treatment Girls in Safe Space + Livelihood Treatment
394 observations 207 observations
228 observations
Mean age Age: 12.72
10-18 age range Age: 14.03
10-18 age range Age: 13.82
10-18 age range
Marital Status
Married: 54 (13.71% of respondents)
Unmarried: 276
(70.05% of respondents)
64 didn’t respond
Married: 32 (15.46% of respondents)
Unmarried: 169 (81.64% of
respondents)
6 didn’t respond
Married: 49 (21.49% of respondents)
Unmarried: 163
(71.49% of respondents)
16 didn’t respond
Living Situation
Lives with at least one parent: 328 (83.25% of
respondents)
Lives with at least one grandparent: 11 (2.79% of
respondents)
Lives with their spouse or spouse’s family: 50 (12.69%
of respondents)
Lives with at least one parent: 142 (68.6% of
respondents)
Lives with at least one grandparent: 27 (13.04% of
respondents)
Lives with their spouse or spouse’s family: 32 (15.46%
of respondents)
Lives with at least one parent: 165 (72.37% of
respondents)
Lives with at least one grandparent: 18 (7.89% of
respondents)
Lives with their spouse or spouse’s family: 40 (17.54%
of respondents)
5 either didn’t respond or answered they live with family friends or other
6 either didn’t respond or answered they live with family friends or other
5 either didn’t respond or answered they live with family friends or other
HH Primary Source of Income
Farmer: 344 (87.31% of respondents)
Pastoralist: 2 (0.51% of
respondents)
Agropastoralist: 44 (11.17% of respondents)
4 either didn’t respond or
answered their family makes a living with commercial activities or other ways
Farmer: 186 (89.86% of respondents)
Pastoralist: 1 (0.5% of
respondents)
Agropastoralist: 11 (5.31% of respondents)
9 either didn’t respond or
answered their family makes a living with commercial activities or other ways
Farmer: 203 (89.04% of respondents)
Pastoralist: 2 (0.88% of
respondents)
Agropastoralist: 20 (8.77% of respondents)
3 either didn’t respond or
answered their family makes a living with commercial activities or other ways
Education and Literacy
Enrolled in School: 142 (36.04% of respondents)
Other respondents either dropped out of school or
never enrolled
Able to read: 21 (5.33 % of respondents)
Other respondents could
either read only part of the sentence or not read at all
Enrolled in School: 61 (29.5% of respondents)
Other respondents either dropped out of school or
never enrolled
Able to read: 13 (6.28% of respondents)
Other respondents could
either read only part of the sentence or not read at all
Enrolled in School: 57 (25% of respondents)
Other respondents either dropped out of school or
never enrolled
Able to read: 21 (9.21% of respondents)
Other respondents could
either read only part of the sentence or not read at all

13
Study Limitations
There are several limitations to this study. They include:
The demographic covariates used to match beneficiaries to a non-beneficiary comparison group were only collected at the endline, so unobserved differences may exist between recipients and non-recipients of the interventions. These unobserved differences could be correlated with the outcomes measured, thus introducing some bias that can only be mitigated by having both baseline and endline data.
Matching: The only communities in which Sawki has yet to implement safe space programming are centered in the region of Maradi, whereas many of the “matched” treatment communities are in the Zinder region.
Treatment Groups: Both the Safe Space and the Safe Space + Livelihoods groups were not as “clean” as expected, meaning that some girls have participated in program interventions not targeted toward them.
Comparison Group: While girl-centered activities are not being implemented in the 6 comparison villages, Sawki program activities that target women and men (health and nutrition behavior change; livestock training; gardening; agriculture) have been implemented for two years, so girls have likely had some exposure to the Sawki program.
Key Findings: Reproductive Health Knowledge, Attitudes and Behaviors
Girls were asked a series of questions and statements to test the hypothesis that when programs provide girls with safe spaces and a tailored curriculum to learn and interact with their peers, their knowledge and attitudes about reproductive health will shift, and ultimately, girls will practice healthier behaviors, including appropriate family planning techniques to delay pregnancy. In summary, findings show that girls in the SS and the SS+L programs viewing contraception as an acceptable option and one in which they and their future husbands could discuss. Girls also have increased knowledge on the benefits of delaying first pregnancy when compared to girls who have not participated in Sawki, and they are comfortable talking with their parents about delaying marriage and pregnancy. Girls in both models indicate an ideal age for first childbirth that is, on average, two years later than girls in the comparison group. Despite this, girls in the SS and the SS+L do not feel they have the right to refuse sex to their husbands, indicating limited perceptions of equality between men and women in the home.
Attitudes and Beliefs
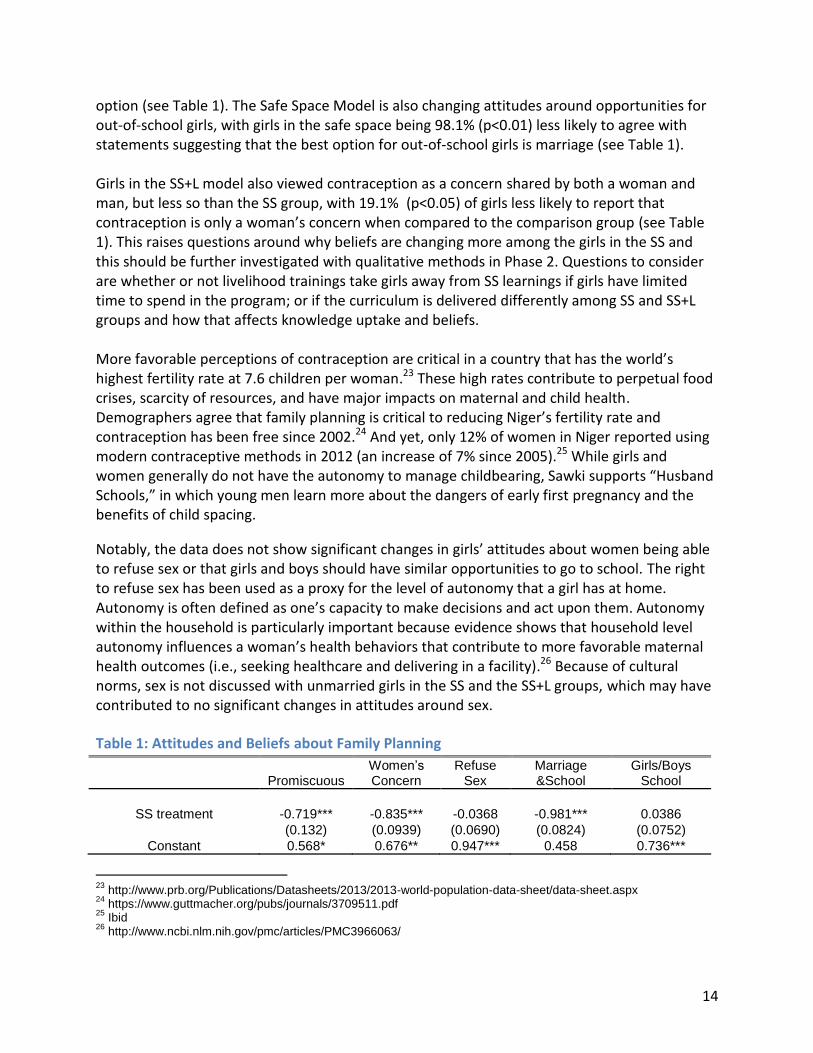
To understand if and how Sawki’s girl-focused programs have shifted attitudes around reproductive health issues, the RISING research survey shared a series of statements with respondents and asked each girl to state whether she agreed or disagreed with each statement. Overall, findings suggest Sawki is promoting major shifts in girls’ beliefs about contraception. When compared to girls not in the program, girls in the SS program are 83.5% (p<0.01) less likely to view contraception as a concern of only a woman, while also 71.9% (p<0.01) less likely to link contraception use to promiscuity, indicating that contraception is viewed as a valid
14
option (see Table 1). The Safe Space Model is also changing attitudes around opportunities for out-of-school girls, with girls in the safe space being 98.1% (p<0.01) less likely to agree with statements suggesting that the best option for out-of-school girls is marriage (see Table 1). Girls in the SS+L model also viewed contraception as a concern shared by both a woman and man, but less so than the SS group, with 19.1% (p<0.05) of girls less likely to report that contraception is only a woman’s concern when compared to the comparison group (see Table 1). This raises questions around why beliefs are changing more among the girls in the SS and this should be further investigated with qualitative methods in Phase 2. Questions to consider are whether or not livelihood trainings take girls away from SS learnings if girls have limited time to spend in the program; or if the curriculum is delivered differently among SS and SS+L groups and how that affects knowledge uptake and beliefs. More favorable perceptions of contraception are critical in a country that has the world’s highest fertility rate at 7.6 children per woman.23 These high rates contribute to perpetual food crises, scarcity of resources, and have major impacts on maternal and child health. Demographers agree that family planning is critical to reducing Niger’s fertility rate and contraception has been free since 2002.24 And yet, only 12% of women in Niger reported using modern contraceptive methods in 2012 (an increase of 7% since 2005).25 While girls and women generally do not have the autonomy to manage childbearing, Sawki supports “Husband Schools,” in which young men learn more about the dangers of early first pregnancy and the benefits of child spacing.
Notably, the data does not show significant changes in girls’ attitudes about women being able to refuse sex or that girls and boys should have similar opportunities to go to school. The right to refuse sex has been used as a proxy for the level of autonomy that a girl has at home. Autonomy is often defined as one’s capacity to make decisions and act upon them. Autonomy within the household is particularly important because evidence shows that household level autonomy influences a woman’s health behaviors that contribute to more favorable maternal health outcomes (i.e., seeking healthcare and delivering in a facility).26 Because of cultural norms, sex is not discussed with unmarried girls in the SS and the SS+L groups, which may have contributed to no significant changes in attitudes around sex.
Table 1: Attitudes and Beliefs about Family Planning
Promiscuous
Women’s Concern
Refuse Sex
Marriage &School
Girls/Boys School
SS treatment -0.719*** -0.835*** -0.0368 -0.981*** 0.0386
(0.132) (0.0939) (0.0690) (0.0824) (0.0752)
Constant 0.568* 0.676** 0.947*** 0.458 0.736***
23
http://www.prb.org/Publications/Datasheets/2013/2013-world-population-data-sheet/data-sheet.aspx 24
https://www.guttmacher.org/pubs/journals/3709511.pdf 25
Ibid 26
http://www.ncbi.nlm.nih.gov/pmc/articles/PMC3966063/

15
(0.344) (0.339) (0.309) (0.292) (0.275)
Observations 415 452 452 452 452
R-squared 0.097 0.176 0.155 0.379 0.067
Promiscuous
Women’s Concern
Refuse Sex
Marriage & School
Girls/Boys School
SS+L treatment -0.255 -0.199** -0.00740 -0.0834 -0.0178
(0.177) (0.0896) (0.0624) (0.0915) (0.0686)
Constant 0.808** 0.302 0.631** 0.408 0.672***
(0.369) (0.300) (0.260) (0.320) (0.245)
Observations 495 550 549 551 551
R-squared 0.073 0.179 0.117 0.371 0.081
For all tables: * p<0.10; ** p<0.05; and *** p<0.01
Girls were also asked about the ideal age to marry; the ideal age to have her first child; and the ideal number of children to have. Girls in both treatment groups showed significant differences in their reported ideal age for a woman to have children. Girls in the SS model reported the ideal age for a female to have her first child as 2.167 (p<0.01) years older than girls in the comparison group (see Table 2). Girls in the SS+L answered that the ideal age to have a first child is 2.435 (p<0.05) years older than girls in the comparison group (see Table 2). Both treatment groups also demonstrate increased knowledge about the benefits of delaying pregnancy when compared with girls in the comparison group. Girls in safe spaces are 69.7% (p<0.01) more likely to know one benefit of delaying pregnancy to age 18 or older; while girls in the livelihood program are 27.7% (p<0.05) more likely to do so (see Table 2). This is compared to girls who have not participated. The desire and ability to delay first pregnancy is critical to decreasing maternal and child mortality rates, while improving the health outcomes of mothers and babies. Maternal mortality is the leading cause of death for girls outside of the industrialized world, and accounts for 13% of all deaths and 23% of all disabilities. Early childbearing also negatively impacts the survival of newborns, with studies showing that newborn death is 50% higher to adolescent mothers versus mothers in their 20s.27 Findings show no significant difference around the ideal age of marriage or number of children girls want. However, averages for each group show a more nuanced picture, with girls in the SS reporting ideal age at marriage to be 14.7 compared to age 17 in the SS+L group and 15.7 in the comparison group (see Table 3). This hints at the possibility that livelihood training and economic opportunity decreases the desire to get married younger and should be investigated in focus group discussions. There is more than a 4-year gap between ideal age at marriage and
27
Macro International 2008.

16
childbirth for girls in the SS, which supports the girls’ growing acceptance of contraception and the idea that they could delay pregnancy after marriage. Also to note is that girls across all groups report wanting 7.3 to 8.1 children (see Table 2), which is less than the national average of wanting 9.1 children.28
Desired age at marriage and family size reflect deeply entrenched social and cultural norms, such as the belief that a large family equates economic security, and these norms take time to evolve. The demographic transition theory says that for fertility to decline, mortality must decline (through increased health, nutrition and medical advances) in conjunction with economic growth. This suggests that programming must take a holistic approach that combines health and nutrition improvements with economic opportunity before we see true decline. Programming should strive to give girls alternatives to building economic security (outside of children), such as vocational skills, farming knowledge, and financial literacy if we expect to see changes in the norms. Table 2: Beliefs and Knowledge on Marriage, Childbirth, Number of Children and Delayed
Pregnancy
Ideal Age at Marriage
Ideal Age at Childbirth
Ideal # of Children
Benefit of Delaying
Pregnancy
SS treatment -3.192 2.167* 0.526 -0.697***
(2.107) (1.299) (0.671) (0.0647)
Constant 1.975 2.597 8.861*** 2.001***
(4.963) (5.039) (2.400) (0.177)
Observations 564 562 542 452
R-squared 0.189 0.210 0.191 0.432
Ideal Age at Marriage
Ideal Age at Childbirth
Ideal # of Children
Benefit of Delaying
28
http://www.dhsprogram.com/pubs/pdf/CR25/CR25.pdf
17
Pregnancy
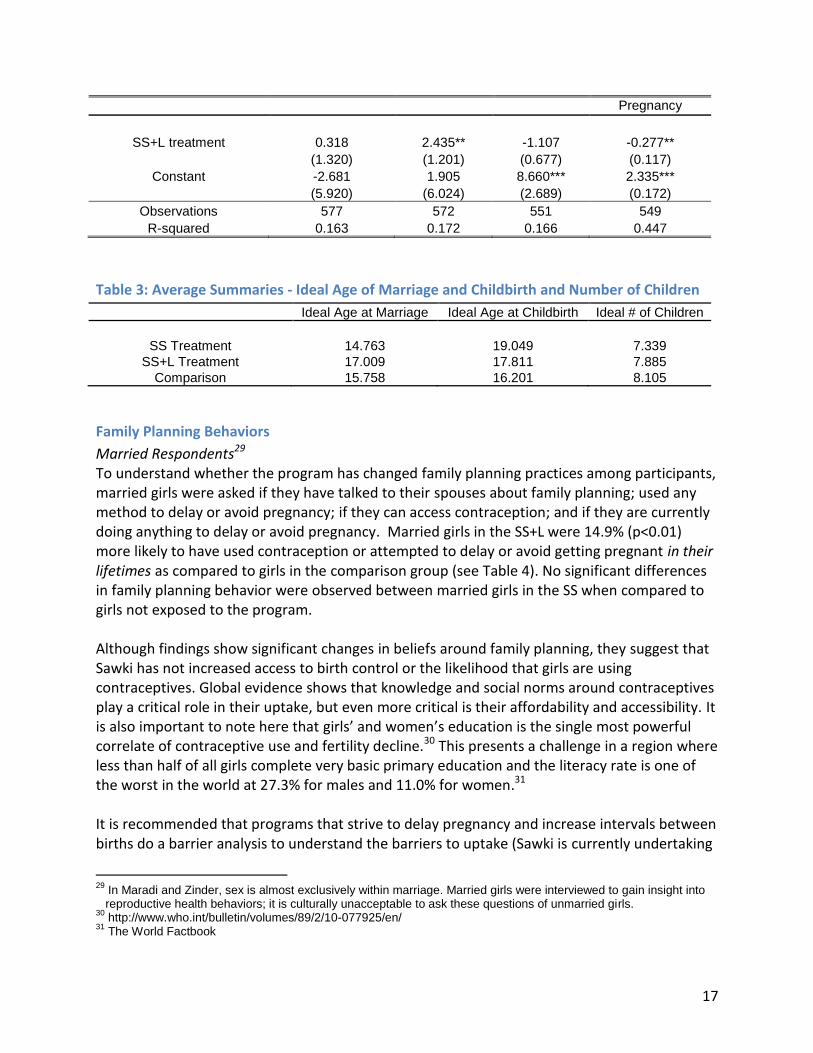
SS+L treatment 0.318 2.435** -1.107 -0.277**
(1.320) (1.201) (0.677) (0.117)
Constant -2.681 1.905 8.660*** 2.335***
(5.920) (6.024) (2.689) (0.172)
Observations 577 572 551 549
R-squared 0.163 0.172 0.166 0.447
Table 3: Average Summaries - Ideal Age of Marriage and Childbirth and Number of Children
Ideal Age at Marriage Ideal Age at Childbirth Ideal # of Children
SS Treatment 14.763 19.049 7.339
SS+L Treatment 17.009 17.811 7.885
Comparison 15.758 16.201 8.105
Family Planning Behaviors
Married Respondents29 To understand whether the program has changed family planning practices among participants, married girls were asked if they have talked to their spouses about family planning; used any method to delay or avoid pregnancy; if they can access contraception; and if they are currently doing anything to delay or avoid pregnancy. Married girls in the SS+L were 14.9% (p<0.01) more likely to have used contraception or attempted to delay or avoid getting pregnant in their lifetimes as compared to girls in the comparison group (see Table 4). No significant differences in family planning behavior were observed between married girls in the SS when compared to girls not exposed to the program. Although findings show significant changes in beliefs around family planning, they suggest that Sawki has not increased access to birth control or the likelihood that girls are using contraceptives. Global evidence shows that knowledge and social norms around contraceptives play a critical role in their uptake, but even more critical is their affordability and accessibility. It is also important to note here that girls’ and women’s education is the single most powerful correlate of contraceptive use and fertility decline.30 This presents a challenge in a region where less than half of all girls complete very basic primary education and the literacy rate is one of the worst in the world at 27.3% for males and 11.0% for women.31 It is recommended that programs that strive to delay pregnancy and increase intervals between births do a barrier analysis to understand the barriers to uptake (Sawki is currently undertaking
29
In Maradi and Zinder, sex is almost exclusively within marriage. Married girls were interviewed to gain insight into reproductive health behaviors; it is culturally unacceptable to ask these questions of unmarried girls.
30 http://www.who.int/bulletin/volumes/89/2/10-077925/en/
31 The World Factbook

18
such an analysis). Additionally, although both treatment groups show significant changes in beliefs about contraception being the responsibility of men and women, this is not translated into behavior change. Married girls in the program are not more likely to report that they’re discussing family planning with their spouse, which could increase their access to contraception and help delay pregnancy.
Table 4: Family Planning Behaviors
Talked to Spouse
Access Contraception
Currently Using Contraception
Delayed Pregnancy
SS treatment -0.546 -0.492 -0.183 0.0546
(0.254) (0.520) (0.224) (0.0511)
Constant -0.517 1.874** 0.214 -0.219
(0.650) (0.801) (0.561) (0.409)
Observations 86 86 86 86
R-squared 0.258 0.201 0.307 0.304
Talked to Spouse
Access Contraception
Currently Using Contraception
Delayed Pregnancy
SS+L treatment 0.0553 0.0324 -0.0717 0.149*
(0.405) (0.236) (0.221) (0.0864)
Constant -0.128 1.493* -0.458 -0.837**
(0.850) (0.778) (0.488) (0.361)
Observations 103 103 103 103
R-squared 0.319 0.271 0.233 0.264
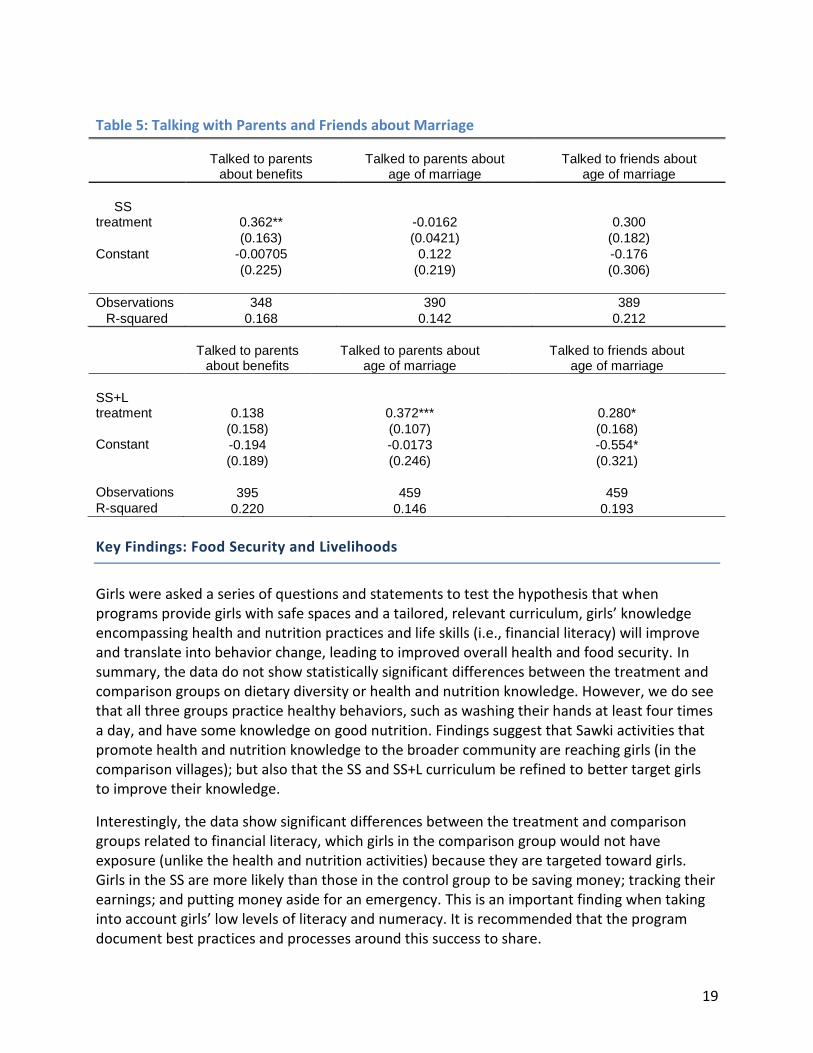
Unmarried Respondents Unmarried girls were asked questions about whether or not they have talked to others—their parents or friends—about the benefits of delaying marriage or the ideal age at which they want to marry. Findings show that girls in SS are 36.2% (p<0.05) more likely than girls in the comparison group to have discussed the benefits of delaying marriage with their parents. Despite this, there were no significant changes in the likelihood that girls in the SS would talk about their ideal age of marriage with their parents or friends (see Table 5). Conversely, girls in the SS+L program were not more likely than girls in the comparison group to share information about delaying marriage with their parents, but were 37.2% (p<0.01) more likely to discuss the age they would like to get married with their parents and 28% (p<0.01) more likely to discuss with their friends (see Table 5). Having little autonomy in choosing when and whom they marry, it is important that girls feel empowered to advocate to their parents the benefits of delaying marriage. Because girls have less voice and agency in the household, programming may consider coaching parents and guardians on how to discuss such sensitive topics with their daughters, which would give girls the opportunity to share their learning with parents.
19
Table 5: Talking with Parents and Friends about Marriage
Talked to parents about benefits
Talked to parents about age of marriage
Talked to friends about age of marriage
SS treatment 0.362** -0.0162 0.300
(0.163) (0.0421) (0.182)
Constant -0.00705 0.122 -0.176
(0.225) (0.219) (0.306)
Observations 348 390 389
R-squared 0.168 0.142 0.212
Talked to parents
about benefits
Talked to parents about
age of marriage
Talked to friends about
age of marriage
SS+L treatment 0.138 0.372*** 0.280* (0.158) (0.107) (0.168) Constant -0.194 -0.0173 -0.554* (0.189) (0.246) (0.321)
Observations 395 459 459 R-squared 0.220 0.146 0.193
Key Findings: Food Security and Livelihoods
Girls were asked a series of questions and statements to test the hypothesis that when programs provide girls with safe spaces and a tailored, relevant curriculum, girls’ knowledge encompassing health and nutrition practices and life skills (i.e., financial literacy) will improve and translate into behavior change, leading to improved overall health and food security. In summary, the data do not show statistically significant differences between the treatment and comparison groups on dietary diversity or health and nutrition knowledge. However, we do see that all three groups practice healthy behaviors, such as washing their hands at least four times a day, and have some knowledge on good nutrition. Findings suggest that Sawki activities that promote health and nutrition knowledge to the broader community are reaching girls (in the comparison villages); but also that the SS and SS+L curriculum be refined to better target girls to improve their knowledge.
Interestingly, the data show significant differences between the treatment and comparison groups related to financial literacy, which girls in the comparison group would not have exposure (unlike the health and nutrition activities) because they are targeted toward girls. Girls in the SS are more likely than those in the control group to be saving money; tracking their earnings; and putting money aside for an emergency. This is an important finding when taking into account girls’ low levels of literacy and numeracy. It is recommended that the program document best practices and processes around this success to share.
20
Health and Nutrition Knowledge and Behaviors
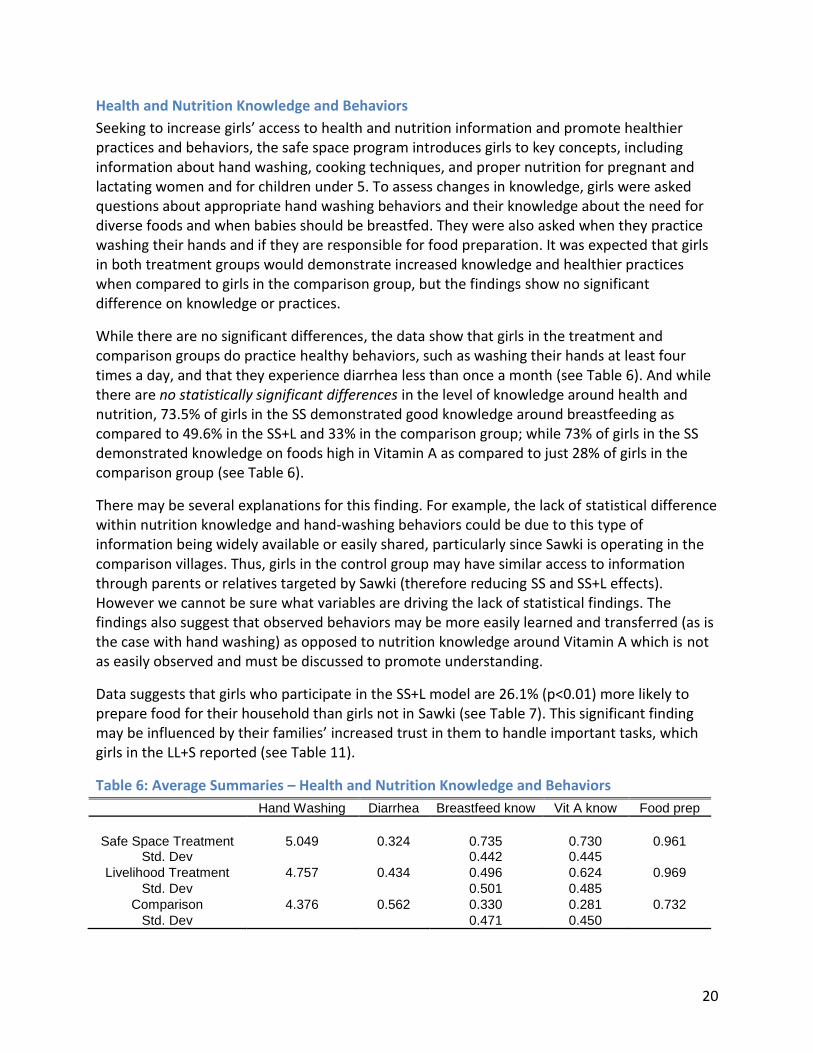
Seeking to increase girls’ access to health and nutrition information and promote healthier practices and behaviors, the safe space program introduces girls to key concepts, including information about hand washing, cooking techniques, and proper nutrition for pregnant and lactating women and for children under 5. To assess changes in knowledge, girls were asked questions about appropriate hand washing behaviors and their knowledge about the need for diverse foods and when babies should be breastfed. They were also asked when they practice washing their hands and if they are responsible for food preparation. It was expected that girls in both treatment groups would demonstrate increased knowledge and healthier practices when compared to girls in the comparison group, but the findings show no significant difference on knowledge or practices.
While there are no significant differences, the data show that girls in the treatment and comparison groups do practice healthy behaviors, such as washing their hands at least four times a day, and that they experience diarrhea less than once a month (see Table 6). And while there are no statistically significant differences in the level of knowledge around health and nutrition, 73.5% of girls in the SS demonstrated good knowledge around breastfeeding as compared to 49.6% in the SS+L and 33% in the comparison group; while 73% of girls in the SS demonstrated knowledge on foods high in Vitamin A as compared to just 28% of girls in the comparison group (see Table 6).
There may be several explanations for this finding. For example, the lack of statistical difference within nutrition knowledge and hand-washing behaviors could be due to this type of information being widely available or easily shared, particularly since Sawki is operating in the comparison villages. Thus, girls in the control group may have similar access to information through parents or relatives targeted by Sawki (therefore reducing SS and SS+L effects). However we cannot be sure what variables are driving the lack of statistical findings. The findings also suggest that observed behaviors may be more easily learned and transferred (as is the case with hand washing) as opposed to nutrition knowledge around Vitamin A which is not as easily observed and must be discussed to promote understanding.
Data suggests that girls who participate in the SS+L model are 26.1% (p<0.01) more likely to prepare food for their household than girls not in Sawki (see Table 7). This significant finding may be influenced by their families’ increased trust in them to handle important tasks, which girls in the LL+S reported (see Table 11).
Table 6: Average Summaries – Health and Nutrition Knowledge and Behaviors
Hand Washing Diarrhea Breastfeed know Vit A know Food prep
Safe Space Treatment 5.049 0.324 0.735 0.730 0.961 Std. Dev 0.442 0.445
Livelihood Treatment 4.757 0.434 0.496 0.624 0.969
Std. Dev 0.501 0.485
Comparison 4.376 0.562 0.330 0.281 0.732
Std. Dev 0.471 0.450

21
Table 7: Health and Nutrition Knowledge and Behaviors
Hand Washing Diarrhea Breastfeed know Vit A know Food prep
Safe Space Treatment 1.398 -3.026 0.0780 -0.117 0.206
(1.037) (2.949) (0.150) (0.152) (0.126)
Constant 11.23 -20.61 0.111 -0.112 -0.931***
(7.728) (21.40) (0.276) (0.272) (0.243)
Observations 594 594 594 594 594
R-squared 0.033 0.024 0.271 0.257 0.248
Hand Washing Diarrhea Breastfeed know Vit A know Food prep
Livelihood Treatment 0.246 -0.0350 -0.0937 0.145 0.261***
(0.542) (0.170) (0.108) (0.104) (0.0643)
Constant 13.78 0.270 0.242 0.0294 -0.562**
(12.73) (0.782) (0.268) (0.234) (0.234)
Observations 615 615 615 615 615
R-squared 0.028 0.046 0.128 0.205 0.220
Dietary Diversity
Seeking to determine how various forms of the program have impacted nutrition and food security outcomes for adolescent girls, girls were asked about the types of foods they had eaten the previous day to assess their levels of food diversity. Using a weighted score to calculate the frequency of consumption of different food groups, the data show no significant difference in the dietary diversity of the SS or the SS+L model when compared to the comparison group (see Table 8). These food categories and scores were weighted according to the World Food Program guidelines,32 ranging from 0-16.
There are several reasons for this. As discussed, although SS and SS+L activities are not being implemented in the 6 comparison villages, broader Sawki activities are being implemented for men and women. So there may not be a gap in the types of foods available if all 18 villages have increased access to vegetable gardening and livelihood activities around livestock. The lack in difference may also be attributed to girls having limited input on the types of food their families cultivate or purchase or to intra-family power dynamics allocating more diverse or expensive food to men and boys.
The tables below represent the difference in average dietary diversity score between the treatment and comparison groups.
32
World Food Programme. (2008). HQ Rome.

22
Table 8: Dietary Diversity Score33
Poor Borderline Acceptable Food index
Safe Space treatment 0.0642 -0.171 0.107 0.223
(0.132) (0.115) (0.0951) (0.917)
Constant 0.889*** 0.223 -0.112 1.153
(0.306) (0.292) (0.117) (1.462)
Observations 594 594 594 594
R-squared 0.139 0.071 0.249 0.190
Poor Borderline Acceptable Food index
Livelihood treatment 0.0848 -0.162 0.0775 0.240
(0.132) (0.122) (0.0813) (0.803)
Constant 0.961*** 0.0841 -0.0452 0.249
(0.301) (0.291) (0.166) (1.417)
Observations 615 615 615 615
R-squared 0.146 0.092 0.202 0.188
Ability to manage, cope with and adapt to shocks and meet food needs
Recognizing that Niger faces chronic and recurring food crises due to climate change, droughts and other sources of instability, the study asked girls about the types of coping strategies they have used in the past 30 days to understand whether the SS or SS+L are changing coping mechanisms that girls use during food crises.34
Overall, participation in the SS+L allowed girls to avoid using as many negative coping mechanisms when compared to girls in the control group; they were 21.7% (p<0.05) less likely to reduce the number of meals eaten per day; 29.4% (p<0.01) less likely to borrow food or rely on help from friends or relatives; and 29.4% (p<0.01) less likely to answer they go to eat at a friends or relatives house than girls not in the program (see Table 9). Girls in the SS were 8.59% (p<0.05) less likely to answer that they begged for food in the past 30 days as compared to girls not in the program (see Table 9). Participation in either version of the program does not significantly change the likelihood that girls will rely on high or very high severity coping mechanisms that will make them more vulnerable to future shocks, such as leaving school to save money or developing new male relationships to secure food, money or gifts (see Table 9).
33
"Poor" (0-3), "Borderline" (3.5-7), "Acceptable" (7+) 34
Questions were adapted from the Coping Strategies Index (CSI). The full CSI was conducted on the HH-level

23
Table 9: Food Security Coping Strategies During Crisis
Reduce # meals
Borrow food
Eat outside home
Reduce intake, males eat
Safe Space treatment 0.195 -0.0530 -0.104 0.218
(0.133) (0.136) (0.139) (0.146)
Constant 1.211*** 0.956*** 1.384*** 1.269***
(0.276) (0.257) (0.268) (0.285)
Observations 594 594 594 594
R-squared 0.253 0.254 0.294 0.329
Beg for food
Sell assets
Additional work
Leave school
New male relations
Safe Space treatment -0.0859** 0.337 0.193 0.0201 0.376
(0.0426) (0.268) (0.151) (0.0424) (0.237)
Constant 0.309 0.391 0.383 0.330 -0.0169
(0.211) (0.502) (0.306) (0.244) (0.462)
Observations 594 594 594 594 594
R-squared 0.042 0.306 0.199 0.132 0.035
Reduce # meals
Borrow food
Eat outside home
Reduce intake, males eat
Livelihood treatment -0.217** -0.294*** -0.229*** -0.0315
(0.0891) (0.0753) (0.0879) (0.0837)
Constant 0.894*** 0.577** 1.154*** 0.625***
(0.271) (0.249) (0.251) (0.199)
Observations 615 615 615 615 R-squared 0.187 0.202 0.221 0.248
Beg for food
Sell assets
Additional work
Leave school
New male relations
Livelihood treatment -0.0455 -0.229 -0.284 -0.0461 0.165
(0.0453) (0.175) (0.0781) (0.0466) (0.143)
Constant 0.349** 0.369 -0.210 0.0963 -0.323
(0.139) (0.473) (0.245) (0.245) (0.496)
Observations 615 615 615 615 615 R-squared 0.054 0.195 0.204 0.086 0.036

24
Financial Literacy and Savings Behavior
Girls were asked questions about their saving behavior, including whether they are currently saving, if they keep track of the money they make, and if they keep money in case of an emergency. Compared to the control group, girls in the SS are 65% (p<0.01) more likely to be currently saving money; 23.2% (p<0.01) more likely to be tracking how much money they make; and 36.8% (p<0.01) more likely to have money in case of an emergency (see Table 10). Although girls in the SS+L treatment are not more likely to report currently saving or tracking their earned income than those in the control, they are 28% (p<0.05) more likely to report that they have money saved for an emergency (see Table 10). Table 10: Savings Behaviors
Currently Saving Kept Track You Make Emergency
Safe Space Treatment 0.650*** 0.232* 0.368***
(0.0911) (0.134) (0.123)
Constant -0.442 0.0471 -0.365
(0.314) (0.282) (0.286)
Observations 594 593 594
R-squared 0.166 0.191 0.199
Currently Saving Kept Track You Make Emergency
Livelihood Treatment -0.0375 -0.0369 0.280**
(0.0960) (0.104) (0.112)
Constant -0.0346 -0.0615 -0.159
(0.270) (0.259) (0.254)
Observations 615 615 614
R-squared 0.155 0.127 0.150
Key Findings: Empowerment and Social Status
Girls were asked a series of questions and statements to test the hypothesis that when programs provide girls with safe spaces to connect with their peers and trusted adults, they will have increased access to support networks, increasing their confidence and aspirations, their sense of place, and their social well-being. Questions also tested the hypothesis that providing livelihood training and income-generation opportunities for girls will increase their confidence and aspirations for a better future, as well as their ability to voice their opinions and concerns, and have a voice in major decisions about their life (i.e., timing of marriage and children).
Decision-making and Status
Girls were asked questions about their status within the household: whether their family (or spouse) listens when they speak, considers their concerns when making decisions, and trusts them with important household tasks. Girls in the SS and the SS+L were more likely to feel a greater sense of trust from family members to handle important tasks, 18% (p<0.01) and 16.1%

25
(p<0.01) respectively, when compared to girls in the comparison group (see Table 11). This finding reflects that the SS and the SS+L models give girls very practical information that can be used in their traditional roles at home, for example having more knowledge around Vitamin A rich foods may mean their families trust them more to prepare meals.
When the programs seek to empower girls beyond the roles they are expected to play, the data suggests no difference between girls in the treatment and comparison groups in how much they feel their families listen to them or consult them about decisions. Building trust does not seem to translate into influence in families. Improving girls’ influence requires targeted interventions aimed at girls’ gatekeepers and the wider community to change cultural and social norms to value girls and their opinions more. As girls spend more time in the SS and the SS+L and increase their overall knowledge and financial assets—and then translate this knowledge to healthier behaviors and become teachers to their friends or at home—we expect to see an increase in their decision-making and status at home.
Table 11: Decision-making and Status
Listens to me Considers my concerns Trusts me
Safe Space treatment -0.0746 -0.0882 0.180***
(0.124) (0.127) (0.0623)
Constant 0.334 0.533* 0.515**
(0.265) (0.293) (0.249)
Observations 594 594 594
R-squared 0.256 0.080 0.087
Listens to me Considers my concerns Trusts me
Livelihood treatment -0.00865 -0.0420 0.161***
(0.0771) (0.0870) (0.0544)
Constant 0.734*** 0.599*** 0.580***
(0.173) (0.220) (0.196)
Observations 615 614 615
R-squared 0.167 0.043 0.072
Social Capital and Social Support
To gauge girls’ social networks and support, they were asked questions about the number of friends they have outside of the family, whether they have a place to meet friends, and if they have someone they can rely on or go to for help in different situations (i.e., when they have a health or family issue).
Girls in the SS model report having a higher number of non-family friends.35 They are also, on average, 8.63% (p<0.01) more likely to have a place to meet female friends at least once a week
35
A 0-3 scale, 1 point = 1 non-family friend, 2 points = 3 non-family friends, and 3 points = 5 or more non-family friends.
26
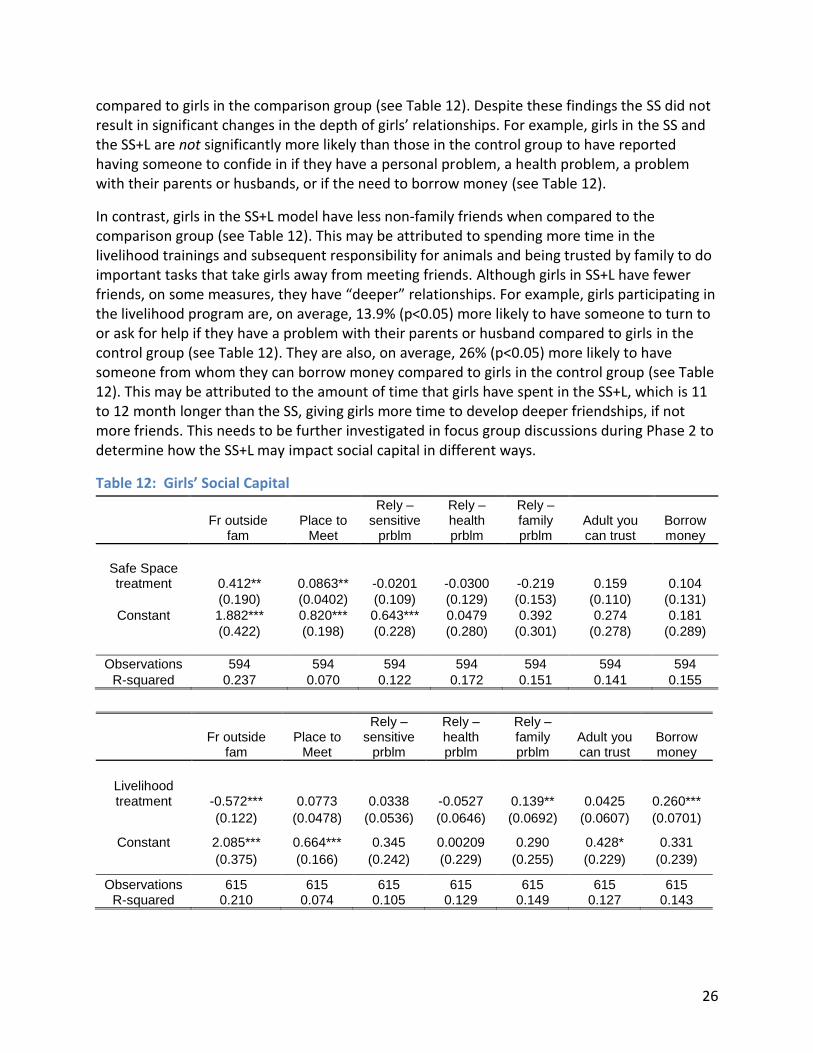
compared to girls in the comparison group (see Table 12). Despite these findings the SS did not result in significant changes in the depth of girls’ relationships. For example, girls in the SS and the SS+L are not significantly more likely than those in the control group to have reported having someone to confide in if they have a personal problem, a health problem, a problem with their parents or husbands, or if the need to borrow money (see Table 12).
In contrast, girls in the SS+L model have less non-family friends when compared to the comparison group (see Table 12). This may be attributed to spending more time in the livelihood trainings and subsequent responsibility for animals and being trusted by family to do important tasks that take girls away from meeting friends. Although girls in SS+L have fewer friends, on some measures, they have “deeper” relationships. For example, girls participating in the livelihood program are, on average, 13.9% (p<0.05) more likely to have someone to turn to or ask for help if they have a problem with their parents or husband compared to girls in the control group (see Table 12). They are also, on average, 26% (p<0.05) more likely to have someone from whom they can borrow money compared to girls in the control group (see Table 12). This may be attributed to the amount of time that girls have spent in the SS+L, which is 11 to 12 month longer than the SS, giving girls more time to develop deeper friendships, if not more friends. This needs to be further investigated in focus group discussions during Phase 2 to determine how the SS+L may impact social capital in different ways.
Table 12: Girls’ Social Capital
Fr outside fam
Place to Meet
Rely – sensitive
prblm
Rely – health prblm
Rely – family prblm
Adult you can trust
Borrow money
Safe Space treatment 0.412** 0.0863** -0.0201 -0.0300 -0.219 0.159 0.104
(0.190) (0.0402) (0.109) (0.129) (0.153) (0.110) (0.131)
Constant 1.882*** 0.820*** 0.643*** 0.0479 0.392 0.274 0.181
(0.422) (0.198) (0.228) (0.280) (0.301) (0.278) (0.289)
Observations 594 594 594 594 594 594 594
R-squared 0.237 0.070 0.122 0.172 0.151 0.141 0.155
Fr outside fam
Place to Meet
Rely – sensitive
prblm
Rely – health prblm
Rely – family prblm
Adult you can trust
Borrow money
Livelihood treatment -0.572*** 0.0773 0.0338 -0.0527 0.139** 0.0425 0.260***
(0.122) (0.0478) (0.0536) (0.0646) (0.0692) (0.0607) (0.0701)
Constant 2.085*** 0.664*** 0.345 0.00209 0.290 0.428* 0.331
(0.375) (0.166) (0.242) (0.229) (0.255) (0.229) (0.239)
Observations 615 615 615 615 615 615 615 R-squared 0.210 0.074 0.105 0.129 0.149 0.127 0.143

27
Confidence, Status and Decision-Making Power
The survey asked girls a range of questions to assess their confidence and aspirations for the future. These included questions that examined whether girls felt important; their ability to express their ideas and feelings; and whether they feel in control of and have hope for their future. Findings suggest no significant statistical difference in the total confidence score36 between girls in the SS model and girls in the comparison group.
However, girls in the SS+L model scored 1.145 points more in their overall confidence score as compared to girls in the control group. This depicts a complex picture. When compared to girls in the control group, SS+L girls were 27% (p<0.01) more likely to feel as capable as other people to do things and 27.3% (p<0.01) to feel that they will have a better life as compared to their parents and girls not in the program, they were still 33.7% (p<0.01) more likely to answer that “people like me cannot make a positive impact in the community.”
This finding supports the hypothesis that livelihood training and income generation opportunities increase girls’ confidence and aspirations for a better future, but demonstrates the difficulty increasing girls’ actual or perceived influence in the home and community. It also suggests that programming needs to make links between building knowledge and income generating opportunities (i.e., knowledge is necessary but not sufficient for improved lives).
Table 13: Confidence and Aspirations for the Future37
Feel Important Express Ideas Feel in control
Safe Space treatment -0.0587 -0.0683 0.0706
(0.104) (0.0944) (0.0980)
Constant 0.955*** -0.159 0.202
(0.220) (0.258) (0.229)
Observations 594 594 594
R-squared 0.214 0.124 0.094
Feel Important Express Ideas Feel in control
Livelihood treatment 0.194*** 0.0731 0.111
(0.0749) (0.0509) (0.0750)
Constant 0.654*** 0.153 0.526***
(0.197) (0.244) (0.189)
Observations 615 615 615
R-squared 0.127 0.100 0.048
36
Eight questions related to confidence were asked. Each counted as one point if the participant agreed with the statement.
37 See Annex 2 for the breakdown of findings related to Confidence and Aspirations.
28
Sense of Place and Community
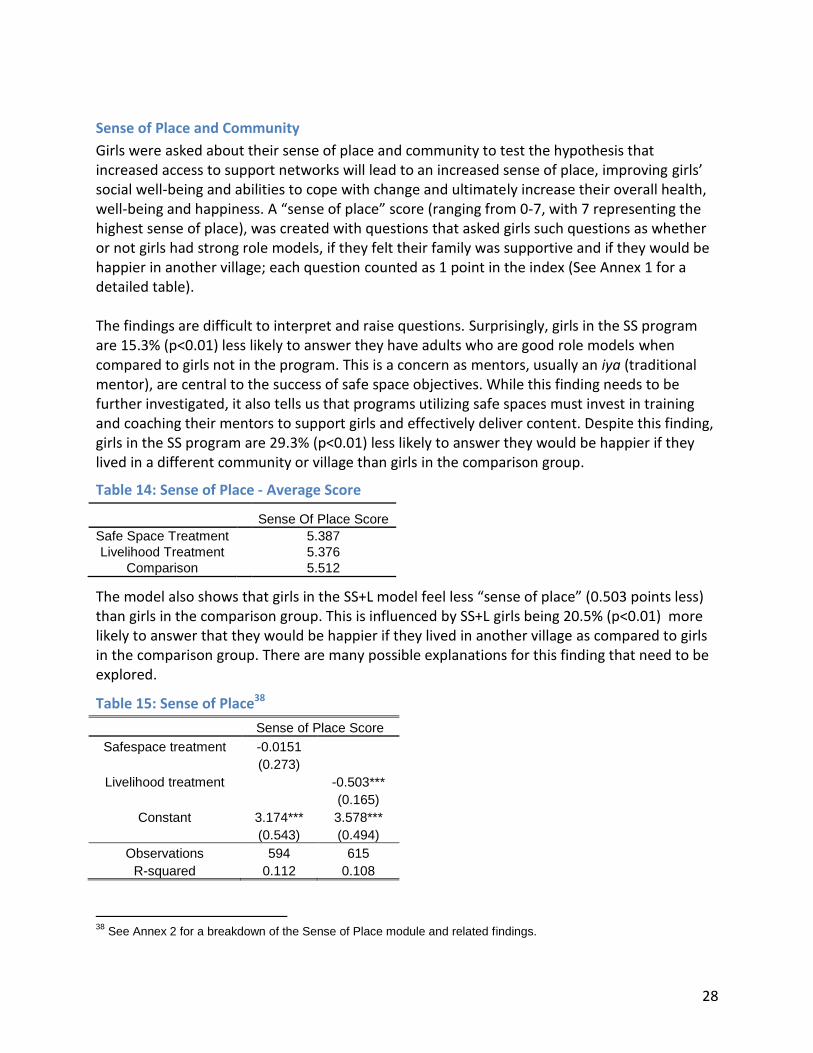
Girls were asked about their sense of place and community to test the hypothesis that increased access to support networks will lead to an increased sense of place, improving girls’ social well-being and abilities to cope with change and ultimately increase their overall health, well-being and happiness. A “sense of place” score (ranging from 0-7, with 7 representing the highest sense of place), was created with questions that asked girls such questions as whether or not girls had strong role models, if they felt their family was supportive and if they would be happier in another village; each question counted as 1 point in the index (See Annex 1 for a detailed table). The findings are difficult to interpret and raise questions. Surprisingly, girls in the SS program are 15.3% (p<0.01) less likely to answer they have adults who are good role models when compared to girls not in the program. This is a concern as mentors, usually an iya (traditional mentor), are central to the success of safe space objectives. While this finding needs to be further investigated, it also tells us that programs utilizing safe spaces must invest in training and coaching their mentors to support girls and effectively deliver content. Despite this finding, girls in the SS program are 29.3% (p<0.01) less likely to answer they would be happier if they lived in a different community or village than girls in the comparison group.
Table 14: Sense of Place - Average Score
Sense Of Place Score
Safe Space Treatment 5.387
Livelihood Treatment 5.376
Comparison 5.512
The model also shows that girls in the SS+L model feel less “sense of place” (0.503 points less) than girls in the comparison group. This is influenced by SS+L girls being 20.5% (p<0.01) more likely to answer that they would be happier if they lived in another village as compared to girls in the comparison group. There are many possible explanations for this finding that need to be explored.
Table 15: Sense of Place38
Sense of Place Score
Safespace treatment -0.0151
(0.273)
Livelihood treatment -0.503***
(0.165)
Constant 3.174*** 3.578***
(0.543) (0.494)
Observations 594 615
R-squared 0.112 0.108
38
See Annex 2 for a breakdown of the Sense of Place module and related findings.

29
Girls Sharing Information
Girls were asked about what types of information they share and discuss with their friends and family to help illuminate the depth of their social networks and their confidence in sharing ideas to further test hypothesis that safe space activities will increase social support.
Compared to girls in the comparison group, over the past 30 days girls in the SS program are 38.5% (p<0.01) more likely to have spoken about their future goals, financial problems, or money they have saved or earned; 25.4% (p<0.05) more likely to have spoken about family planning or contraception to their friends; 25.5% (p<0.05) more likely to have spoken about techniques for livestock care; and 65% (p<0.01) more likely to have discussed techniques for food preparation.
Compared to girls in the control group, over the past 30 days girls in the SS+L program are 34.1% (p<0.01) more likely to have spoken about their future goals, financial problems, or money they have saved or earned; 31.3% (p<0.01) more likely to have spoken about their relationship with a parent or spouse; 28.8% (p<0.01) more likely to have spoken about family planning or contraception; 28% (p<0.01) more likely to have spoken about techniques for livestock care; and 36.9% (p<0.01) more likely to have spoken about techniques for food preparation. They are 51.1% (p<0.01) less likely to have spoken about things they learned in school.
Table 16: Types of Information Shared
Future & financial planning Relationships Health
Family Planning
Livestock care
Food prep School
Livelihood treatment 0.341*** 0.313*** 0.0604 0.288*** 0.280***
0.369*** -0.511***
(0.0689) (0.107) (0.0918) (0.0931) (0.0910) (0.101) (0.0741)
Constant -0.333 0.0969 0.356 0.148 -0.192 -0.306 1.148***
Future & financial planning Relationships Health
Family Planning
Livestock care
Food prep School
Safe Space treatment 0.385*** 0.102 0.156 0.254** 0.255** 0.650*** -0.204
(0.0887) (0.144) (0.123) (0.119) (0.128) (0.127) (0.140)
Constant -0.0566 0.0288 0.421 0.207 -0.113 -0.0108 1.546***
(0.236) (0.283) (0.288) (0.268) (0.225) (0.301) (0.293)
Observations 594 594 594 594 594 594 594
R-squared 0.263 0.270 0.080 0.358 0.119 0.155 0.250
30
(0.219) (0.264) (0.278) (0.265) (0.237) (0.267) (0.288)
Observations 615 615 615 615 615 615 615
R-squared 0.205 0.174 0.100 0.216 0.152 0.199 0.230
Time Use
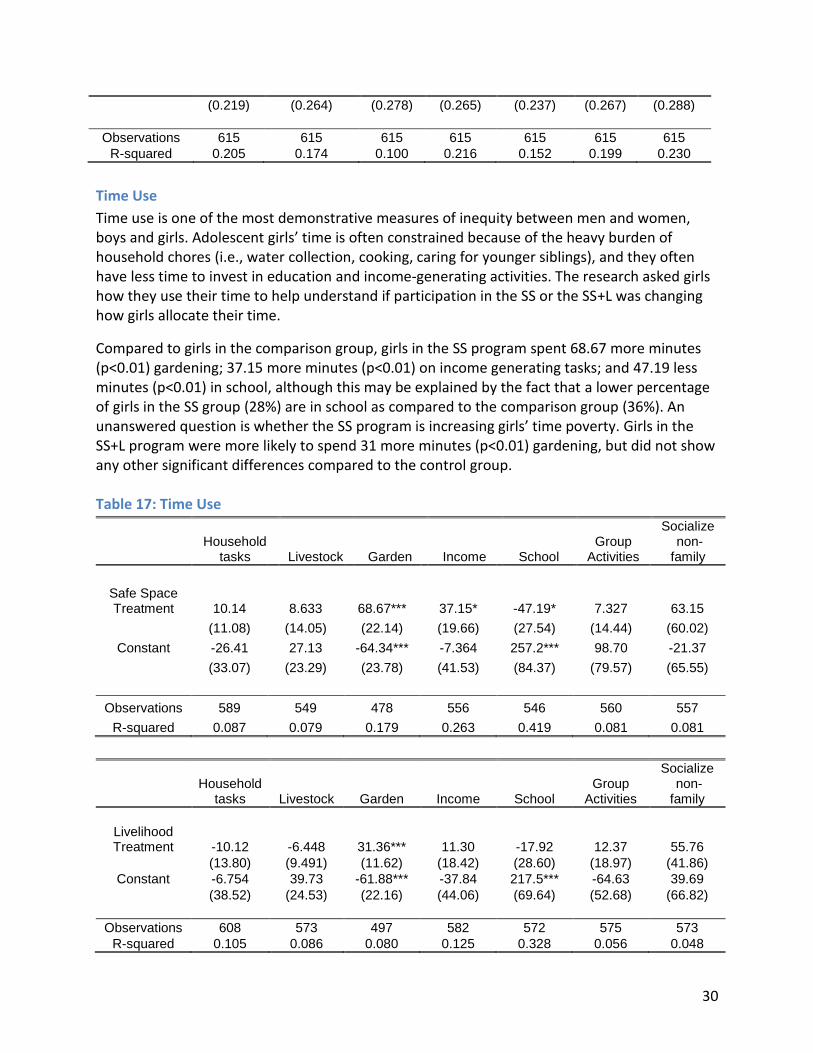
Time use is one of the most demonstrative measures of inequity between men and women, boys and girls. Adolescent girls’ time is often constrained because of the heavy burden of household chores (i.e., water collection, cooking, caring for younger siblings), and they often have less time to invest in education and income-generating activities. The research asked girls how they use their time to help understand if participation in the SS or the SS+L was changing how girls allocate their time.
Compared to girls in the comparison group, girls in the SS program spent 68.67 more minutes (p<0.01) gardening; 37.15 more minutes (p<0.01) on income generating tasks; and 47.19 less minutes (p<0.01) in school, although this may be explained by the fact that a lower percentage of girls in the SS group (28%) are in school as compared to the comparison group (36%). An unanswered question is whether the SS program is increasing girls’ time poverty. Girls in the SS+L program were more likely to spend 31 more minutes (p<0.01) gardening, but did not show any other significant differences compared to the control group. Table 17: Time Use
Household tasks Livestock Garden Income School
Group Activities
Socialize non-family
Safe Space Treatment 10.14 8.633 68.67*** 37.15* -47.19* 7.327 63.15
(11.08) (14.05) (22.14) (19.66) (27.54) (14.44) (60.02)
Constant -26.41 27.13 -64.34*** -7.364 257.2*** 98.70 -21.37
(33.07) (23.29) (23.78) (41.53) (84.37) (79.57) (65.55)
Observations 589 549 478 556 546 560 557
R-squared 0.087 0.079 0.179 0.263 0.419 0.081 0.081
Household tasks Livestock Garden Income School
Group Activities
Socialize non-family
Livelihood Treatment -10.12 -6.448 31.36*** 11.30 -17.92 12.37 55.76
(13.80) (9.491) (11.62) (18.42) (28.60) (18.97) (41.86)
Constant -6.754 39.73 -61.88*** -37.84 217.5*** -64.63 39.69
(38.52) (24.53) (22.16) (44.06) (69.64) (52.68) (66.82)
Observations 608 573 497 582 572 575 573
R-squared 0.105 0.086 0.080 0.125 0.328 0.056 0.048

31
Conclusion
This study used survey methods to investigate the effectiveness of girl-centered strategies in improving the health, nutrition and food security outcomes of adolescent girls. The research examines two types of models, Safe Spaces (SS) and Safe Spaces + Livelihoods (SS+L), and compares the models against no intervention and against each other.
The data show a complex picture, but overall it supports the hypothesis that girl-centered strategies are effective in building girls’ knowledge on health and nutrition practices, reproductive health and financial literacy. However, the findings show that this knowledge is not as easily translated into behavior change. The barriers between knowledge and behavior change should be further investigated to inform future programming.
The SS and SS+L models were successful in promoting major shifts in girls’ beliefs around the ideal age to be married and toward contraceptive use. When compared to girls not in the program, girls in the SS are 83.5% less likely to view contraception as a concern of only a woman and 71.9% less likely to link contraception use to promiscuity, indicating that contraception is a valid option to prevent pregnancy. Girls in the SS+L model also viewed contraception as a concern shared by both a woman and man, but were only 19.1% less likely to report that contraception is only a woman’s concern when compared to the comparison group.
Girls in both the SS and the SS+L groups showed significant differences in their ideal age to first have a baby. Girls in the SS model reported the ideal age for a female to have her first child as 2.167 years older than girls in the comparison group. Girls in the SS+L answered that the ideal age for a female to have her first child is 2.435 years older than girls in the comparison group. We believe this is a direct reflection of the girls’ increased knowledge around the benefits of delaying pregnancy. Girls in SS were 69.7% more likely to know one benefit of delaying pregnancy to age 18 or older; while girls in the SS+L were 27.7% more likely to know the benefits as compared to girls who have not participated in the program. The data support that the SS is more successful in building girls’ reproductive health knowledge and evolving norms, as compared to the SS+L model. This needs further investigation. The findings suggest that neither the SS nor the SS+L have increased the likelihood that girls are using contraceptives or their access. Global evidence shows that knowledge and social norms around contraceptives play a critical role in their uptake, but even more critical is their affordability and accessibility.
Notably, the findings show no statistically significant differences on health and nutrition knowledge or practices between the treatment and control groups. However, the data show that girls in the treatment and comparison groups do practice healthy behaviors, such as washing their hands at least four times a day, and that they experienced diarrhea less than once a month.

32
There may be several explanations for this. For example, the lack of statistical difference in nutrition knowledge and hand-washing behaviors could be due to this type of information being widely available or easily shared, particularly since Sawki is operating in the comparison villages (just not targeting girls). Thus, girls in the comparison group (i.e., non-program participants) may have similar access to information through parents or relatives. The findings also suggest that observed behaviors may be more easily learned and transferred (as is the case with hand washing) as opposed to nutrition knowledge around Vitamin A or breast-feeding, which isn’t as easily observed and must be discussed to promote understanding.
While there is no statistically significant differences in the level of knowledge around healthy and nutrition, the averages among groups show that 73.5% of SS girls demonstrated good knowledge around breastfeeding, 49.6% in the SS+L, and 33% in the comparison group; 73% of girls in the SS demonstrated knowledge on foods high in Vitamin A and 28% of girls in the comparison group had similar knowledge.
Interestingly, the data show significant differences between the treatment and comparison groups on financial literacy. Girls in the SS were 65% more likely to be currently saving money; 23.2% more likely to be tracking how much money they make; and 36.8% more likely to have money in case of an emergency. Although girls in the livelihood program were not more likely to report currently saving or tracking their earned income, they were 28% more likely to report that they have money saved for an emergency. This is an important finding when taking into account girls’ low levels of literacy and numeracy. It is recommended that the program document best practices and processes around this success to share. Overall, the SS model seems to be more successful at transferring knowledge (i.e., benefits of delayed pregnancy, knowledge around breast-feeding, Vitamin A, and tracking money) when compared to the SS+L model. Questions to consider are whether or not livelihood trainings take girls away from SS learning sessions (if girls have limited time to spend in the program) or if the curriculum is delivered differently among SS and SS+L groups and how that affects knowledge uptake and beliefs.
The data also support the hypothesis that when girls connect with their peers and trusted adults in safe spaces, they will have increased access to support networks, increasing their social wellbeing. Enhanced support networks are also expected to improve girls’ abilities to cope with change. While we hypothesized that this would contribute to girls’ sense of community and place, the data didn’t support that assumption.
Participation in the SS+L allowed girls to not use distressful coping mechanisms compared to girls in the comparison group. For example, they were 21.7% less likely to reduce the number of meals eaten per day; 29.4% less likely to borrow food or rely on help from friends or relatives; and 29.4% less likely to answer they go to eat at a friends or relatives house than girls not in the program. Girls in the SS were 8.59% less likely to answer they begged for food in the past 30 days as compared to girls not in the program. Here, the SS+L offered more protective factors when compared to girls in the SS. Yet, girls in the SS+L were less likely to have non-family friends as compared to girls with no intervention, although they have “deeper” friendships.
33
The data support the hypothesis that providing livelihood training and income generation opportunities for girls will increase their confidence and aspirations for a better future, but do not support the assumption that this will then increase girls’ ability to voice their opinions and concerns, and have a voice in major decisions about their life.
Girls in the SS and the SS+L were more likely to feel a greater sense of trust from family members to handle important tasks (18% and 16.1% respectively) when compared to girls in the comparison group. This finding reflects that the SS and the SS+L models give girls very practical information that can be used in their traditional roles at home. But the data show no difference between girls in the treatment and comparison groups in how much they feel their families listen to them or consult them about decisions. Building trust does not seem to translate into influence in families.
Compared to girls with no intervention, girls in the SS+L model were more confident overall. They were 27% more likely to feel as capable as other people to do things and 27.3% to feel that they will have a better life as compared to their parents and girls not in the program, and yet they were still 33.7% more likely to answer that “people like me cannot make a positive impact in the community.” Giving girls the skills and opportunities to build livelihoods is critical for girls to build a future.
The data speak to the importance of girl-centered programming to improve the health, nutrition, food security and economic opportunities for girls. It also hints at the complex lives that adolescent girls lead, from the demands on their time, to their sense of self, their perceptions of how their families value them, and their hopes for the future. It is this complexity that makes girl programming itself complex, but we are starting to ask the right questions to solicit the answers needed to ensure that girls are at the center of their own development agenda.

34
Annex 1: Methodology
Villages and Number of Girls Surveyed
COMPARISON VILLAGES – NO ACTIVITIES
Region Village Number of Girls Surveyed
Maradi Baban Kori 56
Maradi Kalgo Arzika 79
Maradi Mai Banda 92
Maradi Dan Dasseyou Dan Sofo 55
Maradi Magajin Kori 38
Maradi Tadone 74
TREATMENT 1 VILLAGES: SAFE SPACE ONLY
Region Village Number of Girls Surveyed
Program start-date
Zinder Kalgo Maikassoua V A 46 June 2014
Zinder Garin Galadima V A 41 June 2014
Maradi Sae 20 June 2014
Zinder Mai Douroumi 41 June 2014
Zinder Gamdou 35 June 2014
Zinder Garin Tamdji 24 June 2014
TREATMENT 2 VILLAGES: SAFE SPACE PLUS LIVELIHOOD TRAINING
Region Village Number of Girls Surveyed
Program start-date (safe space)
Program start-date (livelihood training)
Zinder Banima I V A 43 July 2013 March 2014
Zinder Kourko 39 July 2013 March 2014
Zinder Kaouri Touareg 29 July 2013 March 2014
Maradi Dan Gado 42 July 2013 March 2014
Maradi Kouya Guidan Alkali
38 July 2013 March 2014
Maradi Halbawa Salifou 37 July 2013 March 2014

35
Identification Strategy
Based on Heckman, Ichimura, and Todd (1998)39 and Gilligan and Hoddinott (2007)40, let Y1t be
a girl’s outcome at endline if she is a recipient of the Safe Space treatment and let Y1c be a girl’s
outcome at endline if she is not a recipient of treatment. The impact of the Safe Space treatment is the difference in the outcome between the two groups: ∆= Y1
t - Y1c. However,
measuring impact strictly in this method leaves potential bias, as each girl can only be observed in one group or the other at endline. Let A=1 if a girl receives Safe Space and 0 otherwise, and X be the vector of control variables. An estimate for the average impact of the treatment on the treated (ATT):
(1)
ATT = E(∆|X,A=1)
= E(Y1t - Y1
c|X,A=1)
= E(Y1t|X,A=1) - E(Y1
c|X,A=1)
Because E(Y1c|X,A=1) is not observed, the analysis uses PSM to estimate the counterfactual
outcome for treatment girls (Rosenbaum and Rubin 1983)41. Let P(X)=Pr(A=1|X) be the probability of participating in the Safe Space treatment. PSM constructs a statistical comparison group by matching observations in Safe Space treatment to observations in comparison with similar values of P(X). The validity of this approach relies on the following two assumptions:
(2) E(Y1t|X,A=1) = E(Y1
t|X,A=0)
(3) 0<P(X)<1
Formula (2) assumes “conditional mean independence,” that conditional on X non-treatment girls have the same mean outcomes as Safe Space treatment girls would have if they did not receive treatment. Formula (3) assumes that valid matched on P(X) can be found for all valued of X. If both (2) and (3) are true, PSM provides a valid method for estimating E(Y1
t|X,A=1).
Kernel matching made use of all available information to reduce variance. If treatment and comparison observations are similar to each other on observable characteristics, this method assumed they are similar across unobservable characteristics as well. When this is the case, they fall under what is called “common support.” If a substantial number of treatment observations fall outside of common support, then the impact estimates are at risk of being
39
Heckman, J., H. Ichimura, J.A. Smith, and P.E. Todd. 1998. “Characterizing Selection Bias Using Experimental Data.” Econometrica 66:1017–98.
40 Gilligan, D., J. Hoddinott. 2007. “Is there persistence in the impact of emergency food aid? Evidence on consumption, food security, and assets in rural Ethiopia.” Amer. J. Agr. Econ. 89(2): 225-42.
41 Rosenbaum, P., and D.B. Rubin. 1983. “The Central Role of the Propensity Score in Observational Studies for Causal Effects.” Biometrika 70:41– 55.
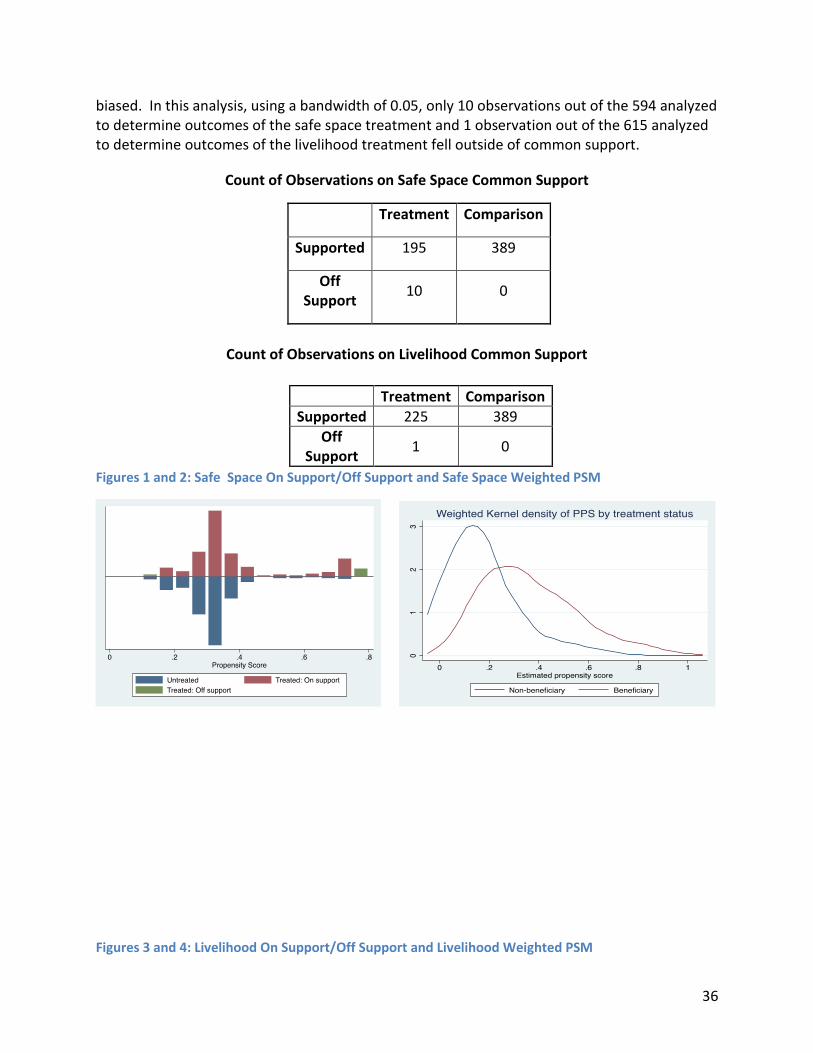
36
biased. In this analysis, using a bandwidth of 0.05, only 10 observations out of the 594 analyzed to determine outcomes of the safe space treatment and 1 observation out of the 615 analyzed to determine outcomes of the livelihood treatment fell outside of common support.
Count of Observations on Safe Space Common Support
Treatment Comparison
Supported 195 389
Off Support
10 0
Count of Observations on Livelihood Common Support
Figures 1 and 2: Safe Space On Support/Off Support and Safe Space Weighted PSM
Figures 3 and 4: Livelihood On Support/Off Support and Livelihood Weighted PSM
Treatment Comparison
Supported 225 389
Off Support
1 0

37
Regressions were conducted after comparison and treatment groups were matched using propensity score matching (PSM), using only variables both correlated with the outcome and the probability of receiving treatment. Sufficient common support was confirmed, and the PSM scores were used as weights in the regression analysis. The safe space treatment coefficients in the following regression output tables are the difference in average output between the girls who received the safe space program and the comparison group. The livelihood coefficient is the difference in average output participation between the comparison group and the group of girls who received livelihood trainings in addition to the safe space program.
Balancing
Overall, For the safe space program, results show that comparisons between the two treatment groups and comparison groups previous to matching differed along age, how many older siblings the respondent has, if they live with at least one parent, if they live with a grandparent, and if their family identified as agropastoralists. Girls were on average equal when comparing the safe space treatment group to the comparison group when comparing whether or not they lived with a spouse or spouse’s family and if their family identified as a farmer or pastoralist.
Table 1. Safe Space Balancing Results
Treatment Mean Comparison Mean P-value
Age 14.054 12.733 0.016**
Matched 14.041 12.938 0.141
Older Siblings 3.3268 3.8509 0.021**
Matched 3.441 3.3701 0.770
Lives with 1 parent 0.6829 0.8303 0.000***
Matched 0.7128 0.7402 0.546
Lives with grandparent 0.1317 0.0283 0.000***
Matched 0.0974 0.1074 0.747
Lives with spouse 0.1561 0.1285 0.355
Matched 0.1590 0.1375 0.552
Table 1. Safe Space Balancing Results (cont.)
Treatment Mean Comparison Mean P-value

38
In terms of the livelihood program, results show that comparisons between the two treatment groups and comparison groups previous to matching differed along age, if they live with at least one parent, and if they live with a grandparent. Girls were on average equal when comparing the livelihood treatment group to the comparison group regarding how many older siblings the respondent has, if they lived with a spouse or spouse’s family, and if their family identified as a farmer, pastoralist, or agropastoralist. In all cases, demographic characteristics were controlled for in the regression analysis.
Table 2. Livelihood Balancing Results
Treatment Mean Comparison Mean P-value
Age 13.845 12.733 0.019**
Matched 13.844 12.914 0.122
Older Siblings 3.677 3.8509 0.466
Matched 3.6578 3.846 0.488
Lives with 1 parent 0.7212 0.8303 0.001***
Matched 0.72 0.7306 0.801
Lives with grandparent 0.0797 0.0283 0.004***
Matched 0.08 0.0808 0.974
Lives with spouse 0.1770 0.1285 0.102
Matched 0.1778 0.1740 0.917
Farmer 0.8894 0.8715 0.514
Matched 0.8933 0.9351 0.113
Pastoralist 0.0089 0.0051 0.582
Matched 0.0089 0.0031 0.425
Agropastoralist 0.0886 0.0541 0.336
Matched 0.0844 0.0540 0.205
Program Exposure
To determine exposure to other Sawki program activities and how those might influence results, survey respondents were asked about their participation in non-adolescent focused activities. These included livestock training, agricultural practice training (i.e., field farmer schools), and women’s gardening activities. Our model predicts that those girls participating in
Farmer 0.8976 0.8715 0.352
Matched 0.9026 0.8880 0.641
Pastoralist 0.0049 0.0051 0.966
Matched 0.0051 0.0056 0.951
Agropastoralist 0.0537 0.1131 0.017**
Matched 0.0513 0.0628 0.624

39
the SS program are more likely to have also participated in Sawki’s non-adolescent focused activities including livestock, agro-practice or gardening trainings. Similarly, girls participating in the SS+L program are more likely to have participated in certain Sawki activities– agro-practice and gardening – than those in the comparison group. The regression tables below reflect the difference in average training participation between the treatment groups and the comparison groups.
Livestock Training Agri-Practice Training Women Gardening Activities
Safe Space Treatment 0.769*** 0.278** 0.625***
(0.113) (0.108) (0.120)
Constant 0.138 0.230 0.0477
(0.126) (0.143) (0.134)
Observations 594 594 594
R-squared 0.399 0.196 0.531
Livestock Training Agri-Practice Training Women Gardening Activities
Livelihood Treatment 0.0305 0.134** 0.412***
(0.0317) (0.0580) (0.0813)
Constant 0.0526 0.0832 0.0613
(0.199) (0.158) (0.190)
Observations 615 615 615
R-squared 0.379 0.230 0.321
Safe Space Model:
Holding all else constant, girls assigned to the safe space treatment group are, on average, 76.9% more (p<0.01) likely to have participated in Sawki’s livestock-training program than girls who are not a part of safe spaces.
Holding all else constant, girls assigned to the safe space treatment group are, on average, 27.8% more (p<0.05) likely to have participated in Sawki’s agro-practice training program than girls who are not a part of safe spaces.
Holding all else constant, girls assigned to the safe space treatment group are, on average, 62.5% more (p<0.01) likely to have participated in Sawki’s women’s gardening activities than girls who are not a part of safe spaces.
Safe Space + Livelihood Model:
Holding all else constant, girls assigned to the livelihood treatment group are, on average, 13.4% more (p<0.05) likely to have participated in the agro-practice training program run by Sawki than girls who are not a part of the program.

40
Holding all else constant, girls assigned to the livelihood training are, on average, 41.2% more (p<0.01) likely to participate in women’s gardening activities than girls not participating in the program.

41
Annex 2: Additional Findings
Confidence and Aspirations (Breakdown of findings)
Feel as
important Capable
Express Ideas
Positive Impact
Smart Optimism for better
life
Defend Ideas
Control of life
Safe Space treatment
0.0767 0.0762 -0.0641 0.0263 -0.190 -0.147 -0.0724 0.0650
(0.153) (0.120) (0.0901) (0.156) (0.134) (0.142) (0.133) (0.142)
Constant 0.854*** 0.504** 0.0135 0.751** 1.176*** 1.039*** -0.331 -0.0997
(0.304) (0.256) (0.266) (0.321) (0.310) (0.317) (0.296) (0.304)
Observations 594 594 594 594 594 594 594 594
R-squared 0.194 0.084 0.114 0.115 0.206 0.124 0.215 0.086
Feel as
important Capable
Express Ideas
Positive Impact
Smart Optimism for better
life
Defend Ideas
Control of life
Livelihood treatment
0.0290 0.270*** 0.103* 0.337*** 0.138 0.273*** 0.0431 -0.0481
(0.109) (0.0754) (0.0533) (0.101) (0.107) (0.0931) (0.0656) (0.109)
Constant 0.747** 0.726*** 0.301 0.0338 0.805** 1.031*** 0.00494 0.326
(0.306) (0.208) (0.249) (0.263) (0.331) (0.279) (0.269) (0.274)
Observations 615 615 615 615 615 615 615 615
R-squared 0.118 0.075 0.069 0.104 0.109 0.084 0.176 0.037
When disaggregated, the safe space treatment still shows no statistical significance between treatment and comparison groups. In terms of livelihood treatment group, F2, F3, F4 and F6 predict highly significant differences between the treatment and comparison groups (ranging from 1-10% level).
Holding all else constant, girls participating in the livelihood program are, on average, 27% more (p<0.01) likely to answer they feel as capable of doing many things as other people than girls not in the program.
Holding all else constant, girls participating in the livelihood program are, on average, 33.7% more (p<0.01) likely to answer that “people like me cannot make a positive impact in the community” compared to girls not in the program.
Holding all else constant, girls participating in the livelihood program are, on average, 27.3% more (p<0.01) likely to answer they feel optimistic that they will have a better life than their parents than girls not in the program.
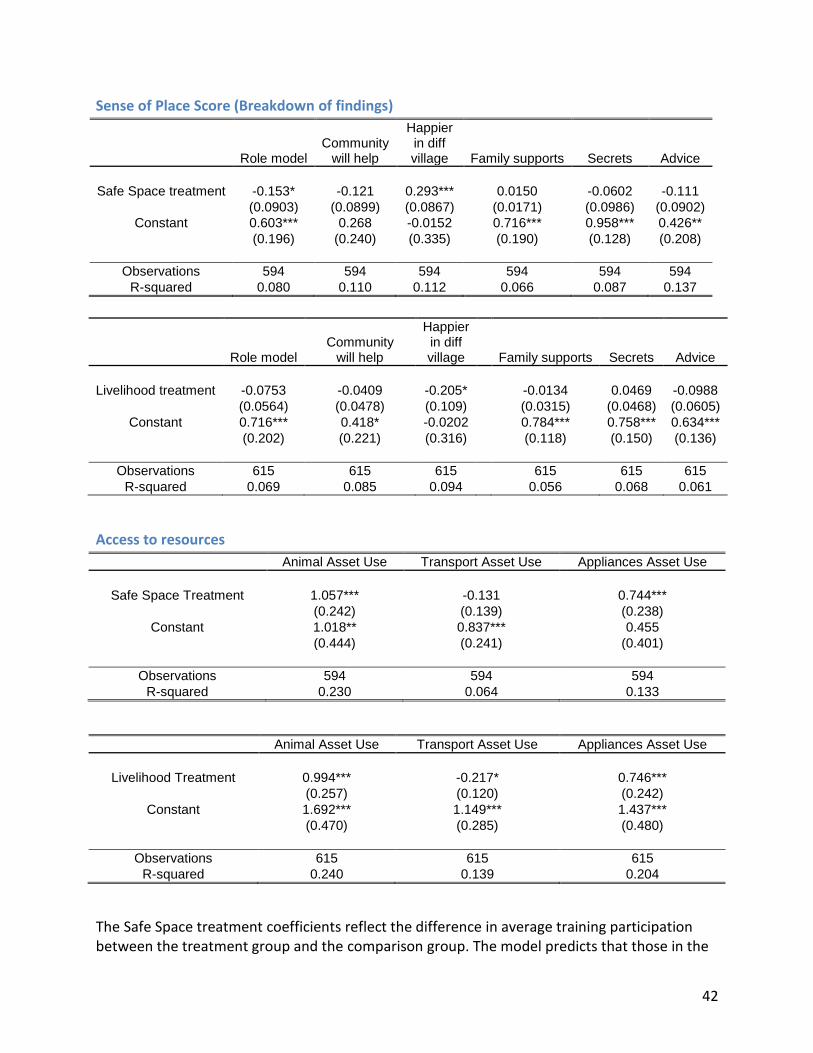
42
Sense of Place Score (Breakdown of findings)
Role model
Community will help
Happier in diff village Family supports Secrets Advice
Safe Space treatment -0.153* -0.121 0.293*** 0.0150 -0.0602 -0.111
(0.0903) (0.0899) (0.0867) (0.0171) (0.0986) (0.0902)
Constant 0.603*** 0.268 -0.0152 0.716*** 0.958*** 0.426**
(0.196) (0.240) (0.335) (0.190) (0.128) (0.208)
Observations 594 594 594 594 594 594
R-squared 0.080 0.110 0.112 0.066 0.087 0.137
Access to resources
Animal Asset Use Transport Asset Use Appliances Asset Use
Safe Space Treatment 1.057*** -0.131 0.744***
(0.242) (0.139) (0.238)
Constant 1.018** 0.837*** 0.455
(0.444) (0.241) (0.401)
Observations 594 594 594
R-squared 0.230 0.064 0.133
Animal Asset Use Transport Asset Use Appliances Asset Use
Livelihood Treatment 0.994*** -0.217* 0.746***
(0.257) (0.120) (0.242)
Constant 1.692*** 1.149*** 1.437***
(0.470) (0.285) (0.480)
Observations 615 615 615
R-squared 0.240 0.139 0.204
The Safe Space treatment coefficients reflect the difference in average training participation between the treatment group and the comparison group. The model predicts that those in the
Role model
Community will help
Happier in diff village Family supports Secrets Advice
Livelihood treatment -0.0753 -0.0409 -0.205* -0.0134 0.0469 -0.0988
(0.0564) (0.0478) (0.109) (0.0315) (0.0468) (0.0605)
Constant 0.716*** 0.418* -0.0202 0.784*** 0.758*** 0.634***
(0.202) (0.221) (0.316) (0.118) (0.150) (0.136)
Observations 615 615 615 615 615 615
R-squared 0.069 0.085 0.094 0.056 0.068 0.061

43
treatment group are more likely to be able to use more animal and appliance assets than those in the comparison group, a difference significant at the 1% level for two types of assets. The livelihood control coefficient is also the difference in average difference between the treatment and comparison group, only this time all 3 asset types showing statistical significance (1% and 10% levels respectively).
Holding all else constant, girls assigned to the Safe Space treatment group are, on average, predicted to be able to use 1.057 animal assets and 0.744 appliance assets more (p<0.01) than girls who are not in the program.
Holding all else constant, girls assigned to the livelihood treatment group are, on average, predicted to be able to use 0.994 more (p<0.01) animal assets, and -0.217 less (p<0.1) transport assets, and 0.746 more (p<0.01) appliance assets than girls who are not a part of livelihood.
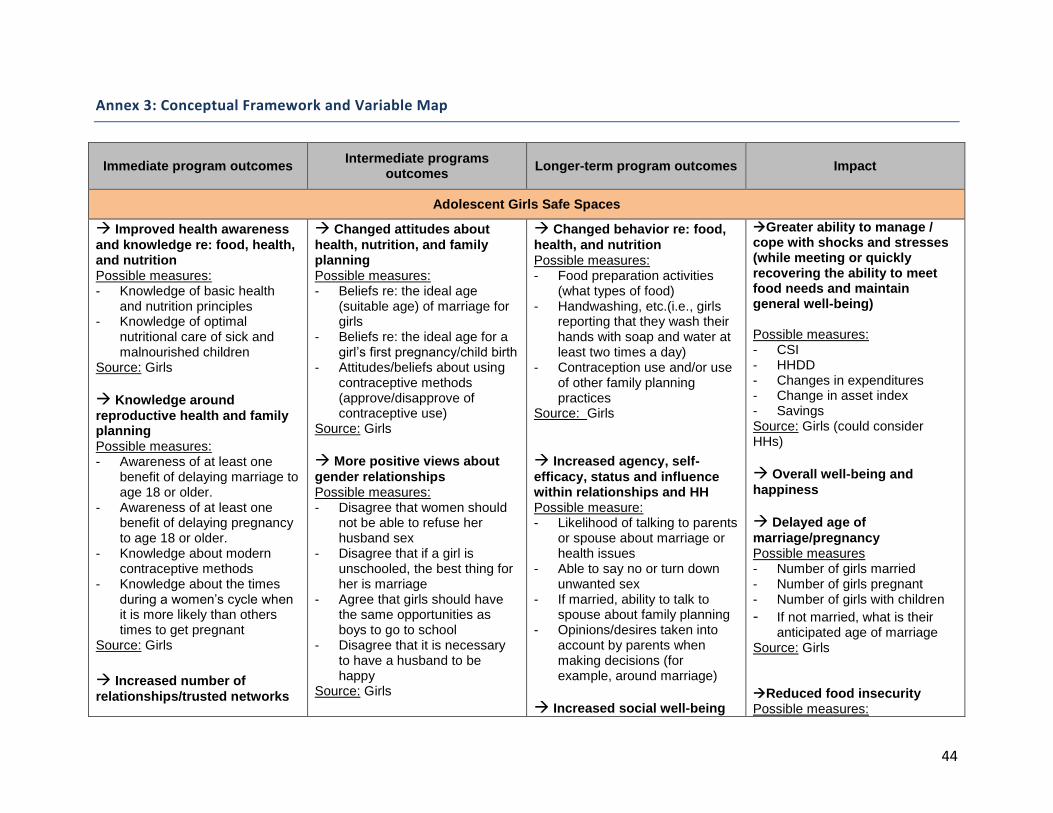
44
Annex 3: Conceptual Framework and Variable Map
Immediate program outcomes Intermediate programs
outcomes Longer-term program outcomes
Impact
Adolescent Girls Safe Spaces
Improved health awareness
and knowledge re: food, health, and nutrition Possible measures: - Knowledge of basic health
and nutrition principles - Knowledge of optimal
nutritional care of sick and malnourished children
Source: Girls
Knowledge around
reproductive health and family planning Possible measures: - Awareness of at least one
benefit of delaying marriage to age 18 or older.
- Awareness of at least one benefit of delaying pregnancy to age 18 or older.
- Knowledge about modern contraceptive methods
- Knowledge about the times during a women’s cycle when it is more likely than others times to get pregnant
Source: Girls
Increased number of
relationships/trusted networks
Changed attitudes about
health, nutrition, and family planning Possible measures: - Beliefs re: the ideal age
(suitable age) of marriage for girls
- Beliefs re: the ideal age for a girl’s first pregnancy/child birth
- Attitudes/beliefs about using contraceptive methods (approve/disapprove of contraceptive use)
Source: Girls
More positive views about
gender relationships Possible measures: - Disagree that women should
not be able to refuse her husband sex
- Disagree that if a girl is unschooled, the best thing for her is marriage
- Agree that girls should have the same opportunities as boys to go to school
- Disagree that it is necessary to have a husband to be happy
Source: Girls
Changed behavior re: food,
health, and nutrition Possible measures: - Food preparation activities
(what types of food) - Handwashing, etc.(i.e., girls
reporting that they wash their hands with soap and water at least two times a day)
- Contraception use and/or use of other family planning practices
Source: Girls
Increased agency, self-
efficacy, status and influence within relationships and HH Possible measure: - Likelihood of talking to parents
or spouse about marriage or health issues
- Able to say no or turn down unwanted sex
- If married, ability to talk to spouse about family planning
- Opinions/desires taken into account by parents when making decisions (for example, around marriage)
Increased social well-being
Greater ability to manage / cope with shocks and stresses (while meeting or quickly recovering the ability to meet food needs and maintain general well-being) Possible measures: - CSI - HHDD - Changes in expenditures - Change in asset index - Savings Source: Girls (could consider HHs)
Overall well-being and
happiness
Delayed age of
marriage/pregnancy Possible measures - Number of girls married - Number of girls pregnant - Number of girls with children
- If not married, what is their anticipated age of marriage
Source: Girls Reduced food insecurity Possible measures:
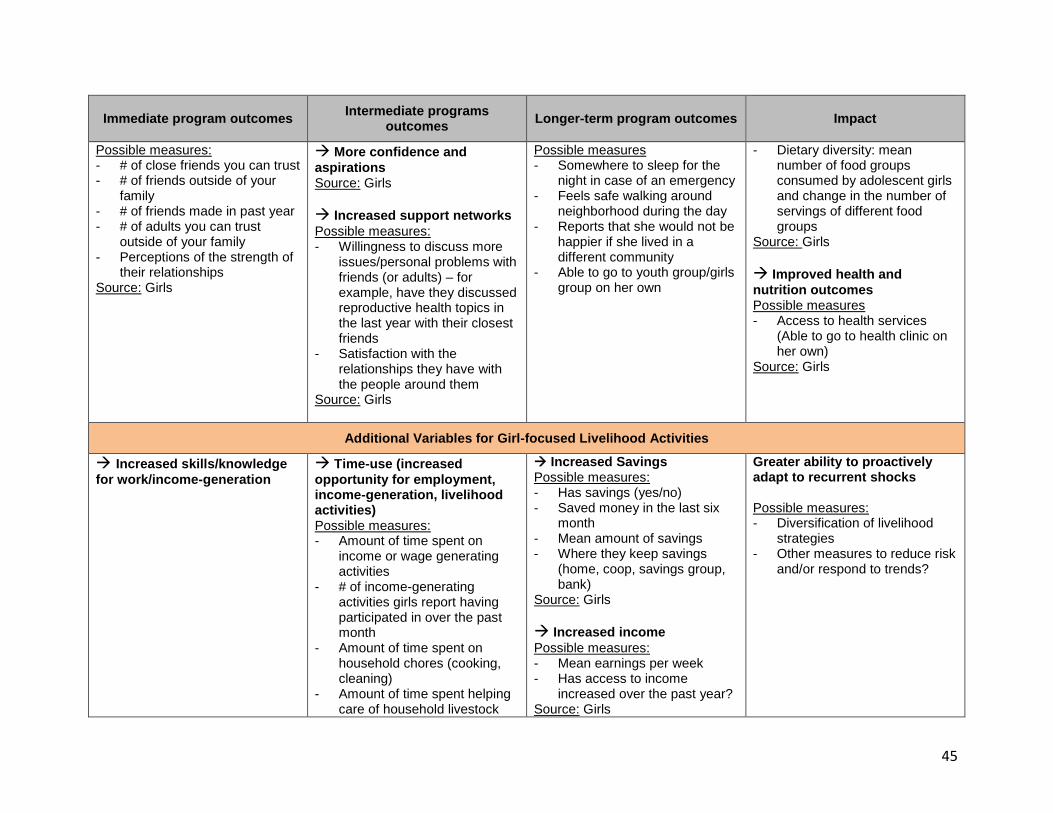
45
Immediate program outcomes Intermediate programs
outcomes Longer-term program outcomes
Impact
Possible measures: - # of close friends you can trust - # of friends outside of your
family - # of friends made in past year - # of adults you can trust
outside of your family - Perceptions of the strength of
their relationships Source: Girls
More confidence and
aspirations Source: Girls
Increased support networks
Possible measures: - Willingness to discuss more
issues/personal problems with friends (or adults) – for example, have they discussed reproductive health topics in the last year with their closest friends
- Satisfaction with the relationships they have with the people around them
Source: Girls
Possible measures - Somewhere to sleep for the
night in case of an emergency - Feels safe walking around
neighborhood during the day - Reports that she would not be
happier if she lived in a different community
- Able to go to youth group/girls group on her own
- Dietary diversity: mean number of food groups consumed by adolescent girls and change in the number of servings of different food groups
Source: Girls
Improved health and
nutrition outcomes Possible measures - Access to health services
(Able to go to health clinic on her own)
Source: Girls
Additional Variables for Girl-focused Livelihood Activities
Increased skills/knowledge
for work/income-generation
Time-use (increased
opportunity for employment, income-generation, livelihood activities) Possible measures: - Amount of time spent on
income or wage generating activities
- # of income-generating activities girls report having participated in over the past month
- Amount of time spent on household chores (cooking, cleaning)
- Amount of time spent helping care of household livestock
Increased Savings Possible measures: - Has savings (yes/no) - Saved money in the last six
month - Mean amount of savings - Where they keep savings
(home, coop, savings group, bank)
Source: Girls
Increased income
Possible measures: - Mean earnings per week - Has access to income
increased over the past year? Source: Girls
Greater ability to proactively adapt to recurrent shocks Possible measures: - Diversification of livelihood
strategies - Other measures to reduce risk
and/or respond to trends?

46
Immediate program outcomes Intermediate programs
outcomes Longer-term program outcomes
Impact
- Amount of time spent helping garden for household
- Amount of time spent socializing with friends
Change in savings behavior
Possible measures: - Has a specific reason for
saving money - Has a plan for saving money - Has a plan or budget for
spending money
Increased opportunities to
participate in income-generation activities
Increased asset accumulation Possible measures: - # of assets owned by girl
herself - Has access to assets
increased over the past year? Source: Girls
Increased agency, self-
efficacy, status, and influence within relationships and HH Possible measure: - Percentage of currently
married girls reporting that she makes decisions either by herself or jointly with her spouse
- Perception of the trust/responsibility given to them by parents or husband
- Access to resources and ability to make decisions about how resources are used