Improving agro-food chains performance for food security ... · Improving agro-food chains...
38
Food Systems & Integrated Agrologistics Improving agro-food chains performance for food security Prof dr Ruerd Ruben
Transcript of Improving agro-food chains performance for food security ... · Improving agro-food chains...

Food Systems & Integrated Agrologistics
Improving agro-food chains performance for food security
Prof dr Ruerd Ruben

Wageningen University & Research (WUR)
Plant Sciences
Animal & Marine Sciences
Environmental Sciences
Food & Biobiased
Social Sciences
Food Safety (RIKILT)
Training & Capacity Building (CDI)

Agrotech& food
research
Animal research
Plant research
Social research
Wageningen UR: an integrated perspective
3
Physical (hardware)
activities
Organisa-tional
(orgware) activities
Infor-mation
(software) activities
Scientific research & education: Wageningen University
Applied research: Institutes, e.g.
WEcR, FBR, WLR

Agrologistics for robust performance
4
Specific agrifoodfeatures
(complexity, dynamics,
uncertainty)
Robust perfor-mance
(costs, quality, sustainability, reliability, etc.)
Product quality
Resource Sustain-ability
Technology(ICT, transport,
processes, storage, etc.)
Wageningen UR works across this scope

Agrologistics: more than hardware
5
Physical (hardware)
activities
Organisa-tional
(orgware) activities
Infor-mation
(software) activities
Right product quality
Right volume
Right time
Right consumer
Minimal loss of product
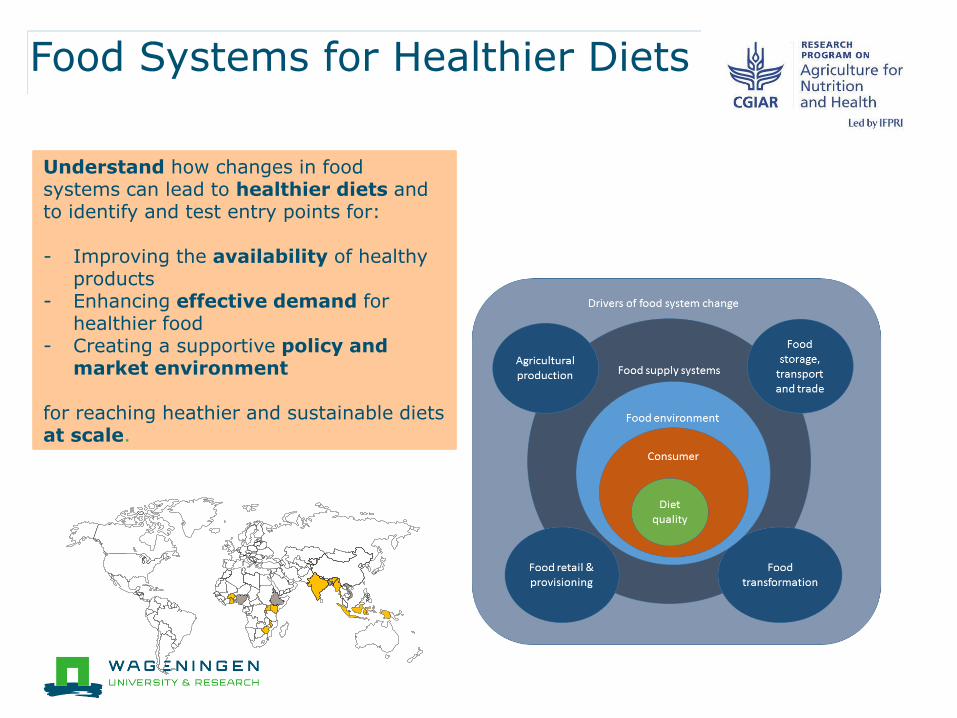
Food Systems for Healthier Diets
Understand how changes in food systems can lead to healthier diets and to identify and test entry points for:
- Improving the availability of healthy products
- Enhancing effective demand for healthier food
- Creating a supportive policy and market environment
for reaching heathier and sustainable diets at scale.

Triple burden of malnutrition
▪ 52% of children are Malnourished
(GNR 2015 – stunting & wasting)
▪ Micronutrient deficiencies (iron, zinc, Vit A)
▪ Overweight: 20-25% (adults); Obesity: 8-15% (adults)
▪ Investment to combat malnutrition: N188.3 billion ($837 million) to save 180,000 lives, and avert 3 million cases of stunting a year.
▪ GLOPAN for Nigeria: 40% stunting reduction results in GDP rise of 29.3 billion.
▪ in Africa, every dollar invested in reducing chronic undernutrition in children yields a US$ 16 return.
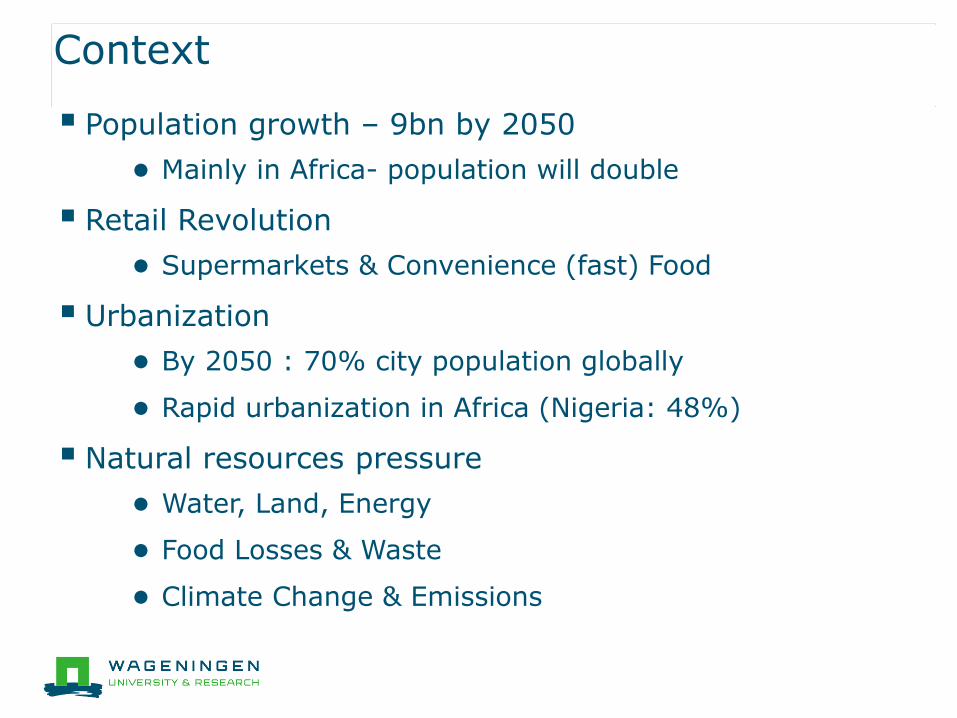
Context
▪ Population growth – 9bn by 2050
● Mainly in Africa- population will double
▪ Retail Revolution
● Supermarkets & Convenience (fast) Food
▪ Urbanization
● By 2050 : 70% city population globally
● Rapid urbanization in Africa (Nigeria: 48%)
▪ Natural resources pressure
● Water, Land, Energy
● Food Losses & Waste
● Climate Change & Emissions

Global challenges
0
200
400
600
800
1000
1 6 11 16 21 26
Gro
wth
(2
00
5 =
10
0)
Year (2005 = 1)
The Growing Wedge (forecast)
Year
Economicgrowth
GrowthAgiculturalProductivity

Urban middle class : shift consumption basket
-> higher quality & more convenience
Dairy, Meat, Fish, Fresh Fruit Juices, Beverages
Convenience
Foods
Diet/Functional/
Organic Foods
Snacks/Prepared
Meals
Carbohydrate Staples
Surviving Mass
Market
Convenience
Food Service
Snacking
Quality
Hygiene
High
Technology
Africa (Sub-
Sahara)
India, China,SE Asia Latin America
Eastern Europe
N. America, Japan, W. Europe, Australia
AVAILABILITYGovernment, laws, choice of suppliers
FOOD SAFETY
FOOD QUALITY
ETHICS
CHAIN QUALITY

Changing market & product characteristics
Period 1960s 1970s 1980s 1990s 2000s
Demands consumer
Performance company
Focus
of
company
PriceQuality Variety Lead time
Efficiency Quality Flexibility
Speed
Chain Chain NetworkCompany Bi-lateral Focus :
2010s
Su
sta
inability
Innovation
power
Uniqueness
Efficient Quality Flexible Innovative

-15%
-5%
5%
15%
25%
35%
45%
12
Nigeria - Frequency of food purchase by wealth index – difference between highest and lowest groups)
Base: All households, lowest (n=165), secondary (n=196), middle (n=198), fourth (n=198), highest (n=179))I8.1
>20% purchasing frequency difference between highest and lowest SEC groups
Increased purchase as
SEC decreases
% p
oin
t d
iffe
ren
ce b
etw
een
at
leas
t w
eekl
y p
urc
ha
sin
g am
on
g h
igh
est
an
d
low
est
SEC
gro
up
s
Water
Fruit juice/ soft drinks
Alcohol
Bananas
Chicken Milk, yoghurt, cheese
Snacks
Sweet snacks
Noodles/ pasta
Fresh eggs
All other vegetables
Bread
Fresh fish
Tea/ coffee
Orange/ yellow veg
(e.g. carrots)
Meat
Cocoa drinks
Dried fish
Meals away from home
Nuts
Green vegetables
Beans
Vegetables for soups
Tomato and
onion
Spices and herbs Mango/
papaya
Yam/ potato/ cassava
Vegetable/ groundnut oil
Stock cubes
Palm oil Rice
Ground maize
<20% purchasing frequency difference between highest and lowest SEC groups
All other fruitsThe difference in weekly
frequency of purchase between the highest and
the lowest groups
Purchased at least once a week
Q. I8.1. How often did you purchase any products from the following categories in the last 30 days?
13
DAILY DIET
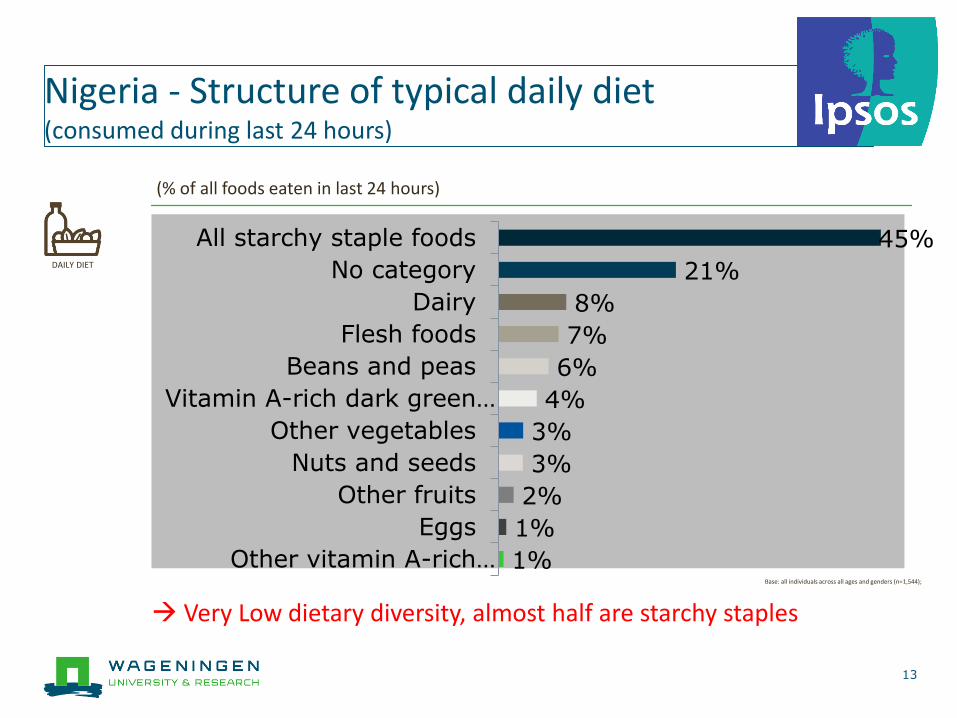
1%
1%
2%
3%
3%
4%
6%
7%
8%
21%
45%
Other vitamin A-rich…
Eggs
Other fruits
Nuts and seeds
Other vegetables
Vitamin A-rich dark green…
Beans and peas
Flesh foods
Dairy
No category
All starchy staple foods
Base: all individuals across all ages and genders (n=1,544);
(% of all foods eaten in last 24 hours)
Nigeria - Structure of typical daily diet (consumed during last 24 hours)
Very Low dietary diversity, almost half are starchy staples

14

Key decisions in Agro-Logistics
ProducerProcessor/
Middle menLSP Retail Consumer
- Inventorycontrol (which products, amounts, where and when …)
- Network design (factories; DC’s; Retailers)
- Transportation (collection; routing; loading ...)
- Production (planning; blending; scheduling …)
- Integral aspects (Supply Chain Management)

Key issues in Global Agro-Logistics Networks
▪ Cost reduction and increase of reliability/flexibility
● Efficient logistics: deliver right quantity at right time, place, condition, price
● Need for reliable and responsive supply of goods
▪ Food security, food quality and food losses
● Ensuring access to local markets and reduce losses (30-40%)
● Increasing consumer discern towards safe, healthy and quality food
▪ Request for traceability and sustainability
● Transparency in food chain “from farm gate to food plate”
● Sustainable supply chain strategies (water, carbon, energy footprints)
● Resource ue efficiency

Food Losses & Waste
Global food waste = 1.3bn Ton
Industrialized Countries
670 mln Ton
Developing Countries
630 mln Ton
Industrialized Countries
$680bn
Developing Countries
$310bn
Global food waste ≈ $1 trillion

Food loss reduction needed
Source: Lipinski et al., WRI 2013

Top 10 causes of postharvest losses
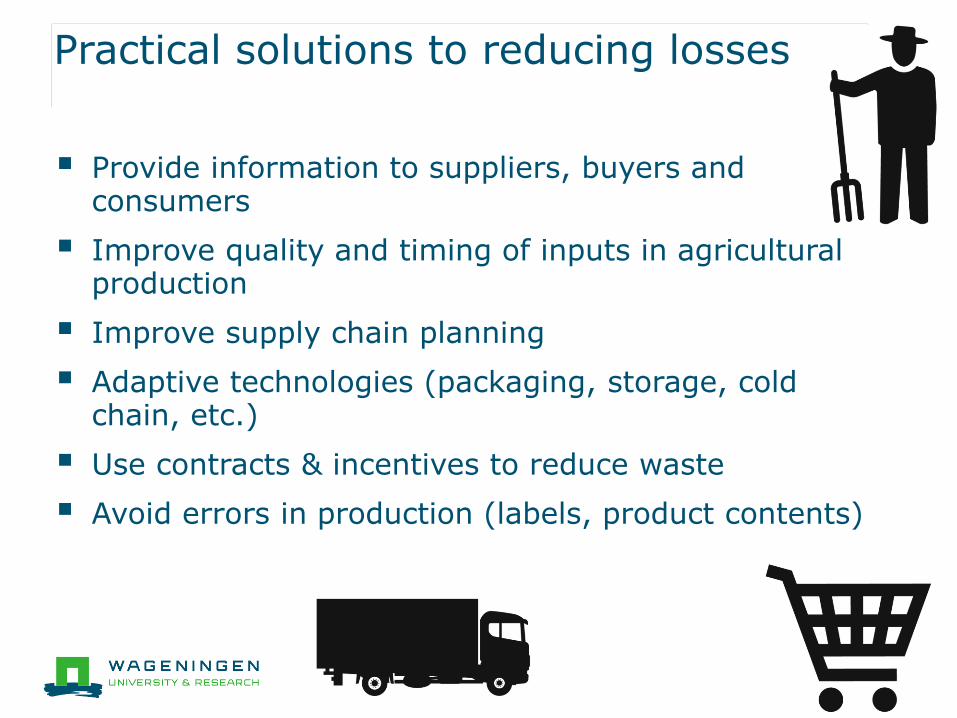
Practical solutions to reducing losses
▪ Provide information to suppliers, buyers and consumers
▪ Improve quality and timing of inputs in agricultural production
▪ Improve supply chain planning
▪ Adaptive technologies (packaging, storage, cold chain, etc.)
▪ Use contracts & incentives to reduce waste
▪ Avoid errors in production (labels, product contents)

Behavioural Solutions to reducing losses
▪ Raise consumer awareness, educate professionals,
▪ Adapt marketing standards
▪ Reduce margins of best-before dates when possible
▪ Customized meal/portion servings
▪ Innovations in promotion
▪ Finding alternative uses of secondary streams
▪ Increase awareness of consumers
▪ avoid buying too much (shopping lists)
▪ cook in correct quantities (measures)

Business realities & value chain dynamics
▪ Preventing/reducing loss may be (very) cost-effective
▪ But, investing in reducing losses:
● May involve too much risk
● May not lead to a net-benefit (waste = business)
● May involve a long payback time
● May not be possible due to constraints in resources, (e.g.
access to credit)
● May lead to benefits for other value chain actors
reducing the potential for costs recovery
▪ There may not be a ready market for the extra produce
● In the longer term: development new markets
● In the long term: change of production patterns
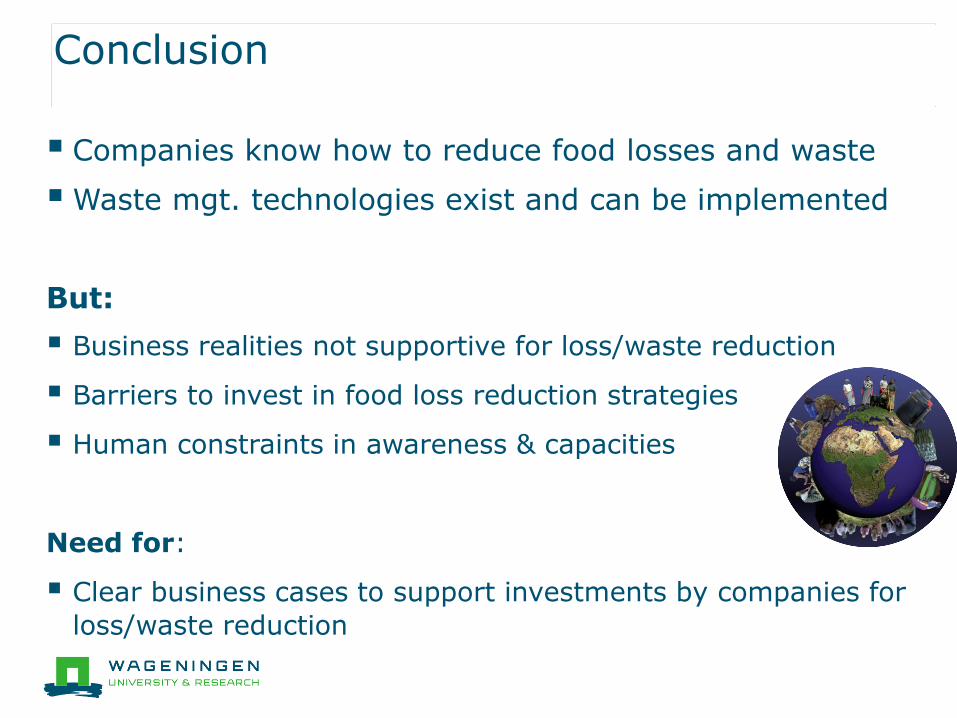
Conclusion
▪ Companies know how to reduce food losses and waste
▪Waste mgt. technologies exist and can be implemented
But:
▪ Business realities not supportive for loss/waste reduction
▪ Barriers to invest in food loss reduction strategies
▪ Human constraints in awareness & capacities
Need for:
▪ Clear business cases to support investments by companies for
loss/waste reduction


WG
1Governance
WG
2Regulatory framework
WG
3Infrastructure
WG
4Investment
WG
5Innovation
National Agrologistics Program (Mexico)
25
“Becoming a world leader in export of
agri-food products by the year 2030”
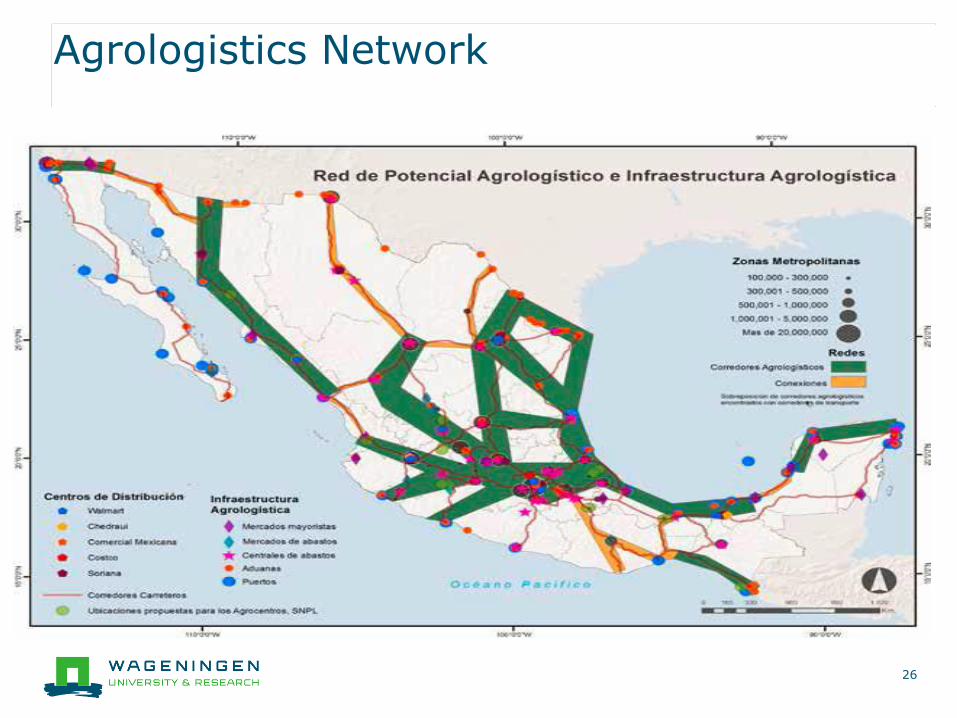
Agrologistics Network
26
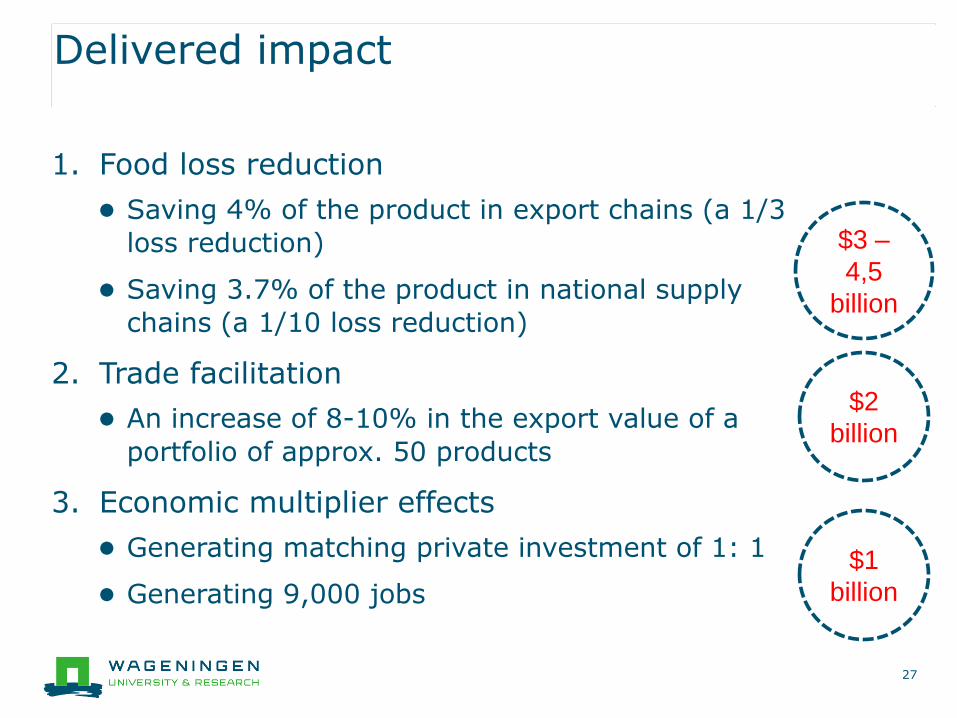
Delivered impact
1. Food loss reduction
● Saving 4% of the product in export chains (a 1/3
loss reduction)
● Saving 3.7% of the product in national supply
chains (a 1/10 loss reduction)
2. Trade facilitation
● An increase of 8-10% in the export value of a
portfolio of approx. 50 products
3. Economic multiplier effects
● Generating matching private investment of 1: 1
● Generating 9,000 jobs
$3 –
4,5
billion
$2
billion
$1
billion
27

DaVinc3i floriculture logistics
▪ Develop new logistics concepts for floriculture, to ensure the Dutch leadership position is strengthened
▪ Focus on:
● Quality Controlled Logistics
● Multimodal transport
● ICT for transparent supply chains
● New business models for cooperation
▪ Engage SMEs in (logistics) research
28

Integrating logistics networks
29
72
62
80
Kosten Tijd CO2
IMPACT ON

Warehouse Receipts (Cotton, Maize)
30
Temporal Arbitrage: Demand for storage if expected future price is high enough to compensate for costs of credit, time and risk

Fresh supply chain in Egypt
Bottlenecks:
▪ Lack of focus on product quality, bad roads, congestion, no cold chain
▪ High food waste (20% (e.g. in tomatoes) up to 80%)
▪ Shortage of water
Contract farming
▪ Large integrated farms
▪ use modern agricultural techniques,
▪ use patented varieties for specific
markets,
▪ well-organized supply chains that
include export (4-20x higher prices).
Traditional farming
▪ poor small farmers
▪ use basic agriculture
techniques,
▪ no access to new varieties,
▪ selling via middle man
▪ no incentive to innovate
First quality grade to Europe, second to Gulf States, rest local.

Dairy Collection in Asia
32
Milk collection & processing: generating added value, guaranteeing self sufficiency, creating sustainability & securing quality and safety

ICT system for quality logistics

34
Future Internet: Farming in the Cloud
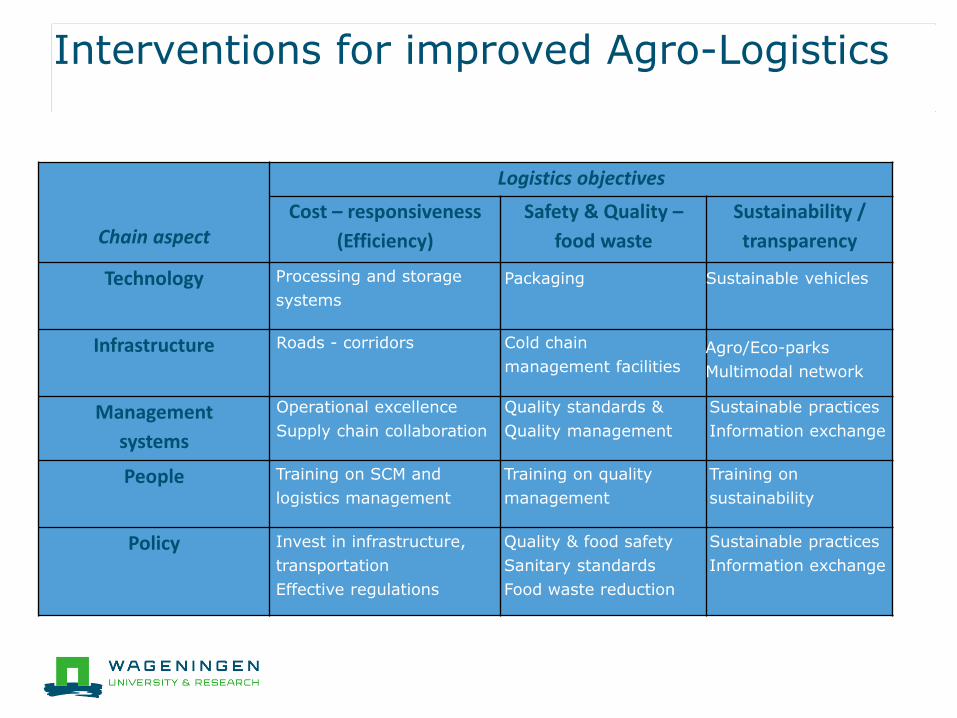
Interventions for improved Agro-Logistics
Chain aspect
Logistics objectives
Cost – responsiveness
(Efficiency)
Safety & Quality –
food waste
Sustainability /
transparency
Technology
Infrastructure
Management
systems
People
Policy
PackagingProcessing and storage
systems
Sustainable vehicles
Cold chain
management facilities
Roads - corridors Agro/Eco-parks
Multimodal network
Quality standards &
Quality management
Operational excellence
Supply chain collaboration
Sustainable practices
Information exchange
Training on quality
management
Training on SCM and
logistics management
Training on
sustainability
Quality & food safety
Sanitary standards
Food waste reduction
Invest in infrastructure,
transportation
Effective regulations
Sustainable practices
Information exchange
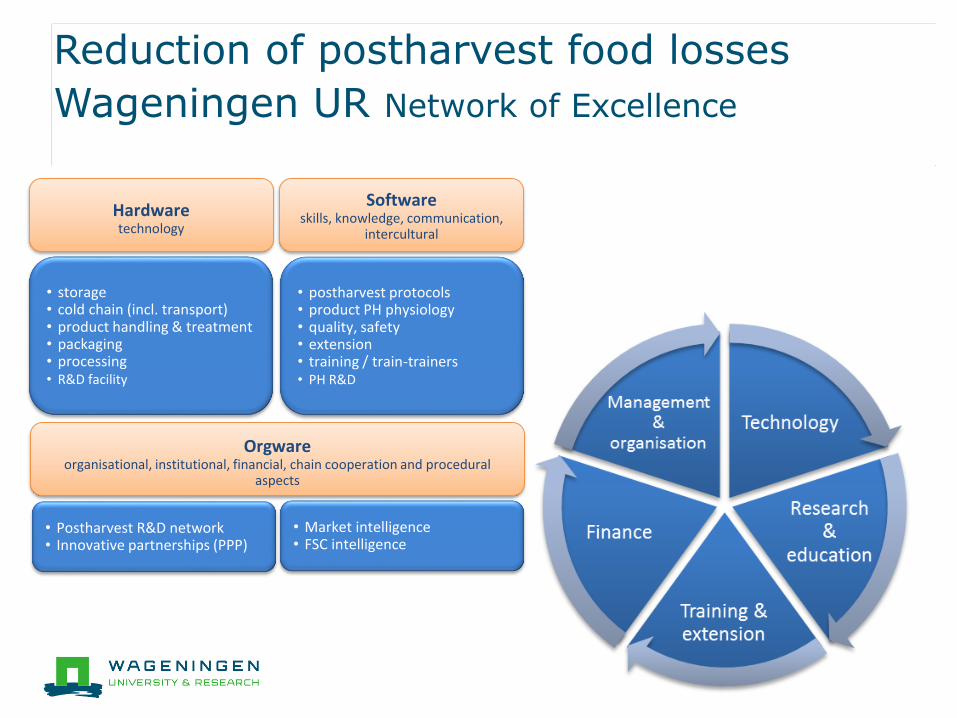
Reduction of postharvest food losses
Wageningen UR Network of Excellence
Hardwaretechnology
Softwareskills, knowledge, communication,
intercultural
Orgwareorganisational, institutional, financial, chain cooperation and procedural
aspects
• storage • cold chain (incl. transport)• product handling & treatment • packaging• processing• R&D facility
• postharvest protocols• product PH physiology• quality, safety • extension• training / train-trainers• PH R&D
• Postharvest R&D network • Innovative partnerships (PPP)
• Market intelligence • FSC intelligence
Outlook
1. Improving FULL logistics infrastructure
2. Enhancing quality management practices
3. Collaborative initiatives to increase (public & private)
investments for reducing postharvest losses
4. Encourage political willingness and good governance
5. Conduct extended Proof of Concept (PoC) studies
Key is to integrate all aspects into one vision.