
Improvements in Remote Cardio-Pulmonary Measurement Using...
8
1 Improvements in Remote Cardio-Pulmonary Measurement Using a Five Band Digital Camera Daniel McDuff, Student Member, IEEE, Sarah Gontarek, and Rosalind W. Picard, Fellow, IEEE Abstract—Remote measurement of the blood volume pulse via photoplethysmography (PPG) using digital cameras and ambient light has great potential for healthcare and affective computing. However, traditional RGB cameras have limited frequency res- olution. We present results of PPG measurements from a novel five band camera and show that alternate frequency bands, in particular an orange band, allowed physiological measurements much more highly correlated with an FDA approved contact PPG sensor. In a study with participants (n=10) at rest and under stress, correlations of over 0.92 (p<0.01) were obtained for heart rate, breathing rate and heart rate variability measurements. In addition, the remotely measured HRV spectrograms closely matched those from the contact approach. The best results were obtained using a combination of cyan, green and orange (CGO) bands; incorporating red and blue channel observations did not improve performance. In short, RGB is not optimal for this problem: CGO is better. Incorporating alternative color channel sensors should not increase the cost of such cameras dramatically. Index Terms—heart rate variability (HRV), blood volume pulse (BVP), photoplethysmography (PPG), remote sensing. I. I NTRODUCTION R EMOTE detection of physiological parameters holds great potential for healthcare and affective computing. Applications that would benefit from non-contact measurement of heart rate (HR) and heart rate variability (HRV) include: infant monitoring [1], detection of cardiac diseases [2] and stress monitoring [3]. The current gold standard methods of measuring HR and HRV involve obtrusive devices attached to the body, in some cases requiring sticky gels and/or uncom- fortable electrodes. Heart rate variability spectrograms are a useful non-invasive measure of phenomena such as the cardiac regulatory system response [4], anxiety [5], sleep patterns [6] or cognitive stress [7]. Mental arithmetic tasks can increase low frequency components and low frequency/high frequency ratios in power spectral analysis of the heart rate variability [7]. We use a mental arithmetic task to cause changes in HRV and show that these can be measured accurately using a digital camera. Photoplethysmography (PPG) is a low-cost and non-invasive technique for measuring the cardiovascular blood volume pulse (BVP) through variations in transmitted or reflected light [8]. Traditionally a dedicated light source and specialized sensor (e.g. IR light) are used to measure the PPG signal. D. J. McDuff is with the Media Laboratory, Massachusetts Institute of Technology, Cambridge, MA 02139 USA. (e-mail: [email protected]). S. Gontarek is. is with the Media Laboratory, Massachusetts Institute of Technology, Cambridge, MA 02139 USA (e-mail: [email protected]). R. W. Picard is a professor at the Media Laboratory, Massachusetts Institute of Technology, Cambridge, MA 02139 USA. (phone: 617-253-0611; e-mail: [email protected]). However, recent work has demonstrated the measurement of the pulse signal using ambient light [9]. Furthermore, it is possible to accurately measure cardio-pulmonary parameters (heart rate, breathing rate (BR) and high and low frequency components of the HRV) using ambient light and a low-cost camera [10]. However, it was not shown whether detailed information about the HRV spectrogram (HRVS) and subtle changes over time could be measured using this approach. In addition, participants were seated close to (⇠0.5m) the camera. We present results that show we can recover, with high accuracy, both physiological parameters and HRV spec- trograms from videos of the face taken using a digital camera placed 3m from the participant. This increased range opens up more potential applications in which remote PPG could be practically used. In addition, this new method shows performance improvements over the state of the art. As in our prior work the method works in ambient light, does not require a dedicated light source, and works well regardless of skin color. Most digital single-lens reflex (DSLR) cameras capture three color channels (RGB) with 16-bits/channel. We use a novel DSLR sensor that has the capability to capture five color channels (16-bits/channel): red, green, blue, cyan and orange (RGBCO). Each pixel on the camera sensor measures one color. The sensor we use has pixels for detecting light in the orange and cyan frequency bands as well as pixels for detecting light in the red, green and blue bands. Therefore, we are able to measure more specific frequency information. Previous work has shown the green channel in a traditional RGB camera to capture the strongest BVP signal [9]. We performed experiments with different combinations of color channels and show that the set of channels including the orange band signals perform much better than the green signal alone and much better than the set of RGB signals. Poh et al’s [10] method for recovering the BVP waveform from video uses independent component analysis (ICA). In its traditional form the number of source signals cannot exceed the number of observations. Therefore, by allowing for more observations (more color channels) we have greater flexibility in the number of source signals that may be present. Considering that there may be many sources of noise (e.g. lighting changes, rigid head motion, facial expressions, camera sensor noise) we test whether more observations will allow for more accurate recovery of the BVP. The contributions of this paper are: 1) to show that a five band digital camera allows highly accurate measurement of physiological parameters from a distance of 3m and outper- forms the traditional three color bands (RGB), 2) to show that alternative color bands (orange and cyan) between the red and
Transcript of Improvements in Remote Cardio-Pulmonary Measurement Using...
1
Improvements in Remote Cardio-PulmonaryMeasurement Using a Five Band Digital Camera
Daniel McDuff, Student Member, IEEE, Sarah Gontarek, and Rosalind W. Picard, Fellow, IEEE
Abstract—Remote measurement of the blood volume pulse viaphotoplethysmography (PPG) using digital cameras and ambientlight has great potential for healthcare and affective computing.However, traditional RGB cameras have limited frequency res-olution. We present results of PPG measurements from a novelfive band camera and show that alternate frequency bands, inparticular an orange band, allowed physiological measurementsmuch more highly correlated with an FDA approved contact PPGsensor. In a study with participants (n=10) at rest and understress, correlations of over 0.92 (p<0.01) were obtained for heartrate, breathing rate and heart rate variability measurements.In addition, the remotely measured HRV spectrograms closelymatched those from the contact approach. The best results wereobtained using a combination of cyan, green and orange (CGO)bands; incorporating red and blue channel observations did notimprove performance. In short, RGB is not optimal for thisproblem: CGO is better. Incorporating alternative color channelsensors should not increase the cost of such cameras dramatically.
Index Terms—heart rate variability (HRV), blood volume pulse(BVP), photoplethysmography (PPG), remote sensing.
I. INTRODUCTION
REMOTE detection of physiological parameters holdsgreat potential for healthcare and affective computing.
Applications that would benefit from non-contact measurementof heart rate (HR) and heart rate variability (HRV) include:infant monitoring [1], detection of cardiac diseases [2] andstress monitoring [3]. The current gold standard methods ofmeasuring HR and HRV involve obtrusive devices attached tothe body, in some cases requiring sticky gels and/or uncom-fortable electrodes.
Heart rate variability spectrograms are a useful non-invasivemeasure of phenomena such as the cardiac regulatory systemresponse [4], anxiety [5], sleep patterns [6] or cognitivestress [7]. Mental arithmetic tasks can increase low frequencycomponents and low frequency/high frequency ratios in powerspectral analysis of the heart rate variability [7]. We use amental arithmetic task to cause changes in HRV and showthat these can be measured accurately using a digital camera.
Photoplethysmography (PPG) is a low-cost and non-invasivetechnique for measuring the cardiovascular blood volumepulse (BVP) through variations in transmitted or reflectedlight [8]. Traditionally a dedicated light source and specializedsensor (e.g. IR light) are used to measure the PPG signal.
D. J. McDuff is with the Media Laboratory, Massachusetts Institute ofTechnology, Cambridge, MA 02139 USA. (e-mail: [email protected]).
S. Gontarek is. is with the Media Laboratory, Massachusetts Institute ofTechnology, Cambridge, MA 02139 USA (e-mail: [email protected]).
R. W. Picard is a professor at the Media Laboratory, Massachusetts Instituteof Technology, Cambridge, MA 02139 USA. (phone: 617-253-0611; e-mail:[email protected]).
However, recent work has demonstrated the measurement ofthe pulse signal using ambient light [9]. Furthermore, it ispossible to accurately measure cardio-pulmonary parameters(heart rate, breathing rate (BR) and high and low frequencycomponents of the HRV) using ambient light and a low-costcamera [10]. However, it was not shown whether detailedinformation about the HRV spectrogram (HRVS) and subtlechanges over time could be measured using this approach.In addition, participants were seated close to (⇠0.5m) thecamera. We present results that show we can recover, withhigh accuracy, both physiological parameters and HRV spec-trograms from videos of the face taken using a digital cameraplaced 3m from the participant. This increased range opensup more potential applications in which remote PPG couldbe practically used. In addition, this new method showsperformance improvements over the state of the art. As inour prior work the method works in ambient light, does notrequire a dedicated light source, and works well regardless ofskin color.
Most digital single-lens reflex (DSLR) cameras capturethree color channels (RGB) with 16-bits/channel. We use anovel DSLR sensor that has the capability to capture fivecolor channels (16-bits/channel): red, green, blue, cyan andorange (RGBCO). Each pixel on the camera sensor measuresone color. The sensor we use has pixels for detecting lightin the orange and cyan frequency bands as well as pixels fordetecting light in the red, green and blue bands. Therefore,we are able to measure more specific frequency information.Previous work has shown the green channel in a traditionalRGB camera to capture the strongest BVP signal [9]. Weperformed experiments with different combinations of colorchannels and show that the set of channels including theorange band signals perform much better than the green signalalone and much better than the set of RGB signals.
Poh et al’s [10] method for recovering the BVP waveformfrom video uses independent component analysis (ICA). Inits traditional form the number of source signals cannotexceed the number of observations. Therefore, by allowingfor more observations (more color channels) we have greaterflexibility in the number of source signals that may be present.Considering that there may be many sources of noise (e.g.lighting changes, rigid head motion, facial expressions, camerasensor noise) we test whether more observations will allow formore accurate recovery of the BVP.
The contributions of this paper are: 1) to show that a fiveband digital camera allows highly accurate measurement ofphysiological parameters from a distance of 3m and outper-forms the traditional three color bands (RGB), 2) to show thatalternative color bands (orange and cyan) between the red and

2
blue bands are particularly useful in recovering the BVP and3) to present the first examples of remotely measured HRVspectrograms from individuals in both relaxed conditions andunder cognitive stress that captures sympathetic modulation.The results presented suggest that subtle changes in the highand low frequency components of the HRV can be measuredusing this new approach.
II. RELATED WORK
Remote measurement of vital signs has been demonstratedusing a number of methods. HR and BR measurements havebeen shown using laser doppler [11], microwave doppler [12],milliwave doppler [13] and thermal imaging [14], [15] meth-ods. Verkruysse et al. [9] showed that PPG measurementscould be made using ambient light in the visual spectrum. Pohet al. [16] presented a practical method allowing the BVP to berecovered using a low-cost webcam, which can then be usedto calculate HR, BR and high and low frequency componentsof heart rate variability [10]. However, that work did notshow that it was possible to gain an accurate measurementof HRV changes over time (e.g. showing accurate recoveryof HRV spectrograms) and all measurements were taken withparticipants in a restful state (not under stress) at a distanceof 0.5m.
Motion [16] can impact the accuracy of PPG measurementsmade using ambient light and a digital camera. However,there are many applications in which remote measurementof physiology could be very useful where there is little rigidhead motion and slowly changing ambient lighting. Motioncompensation is also possible in cases where motion artifactsmay be problematic [17]. A method of magnifying the PPGsignal in a video of the face allows the signal to be visual-ized [18], although the filtering frequencies need to be setmanually. Balakrishnan et al. [19] presented a method forrecovering the BVP waveform from motion of the humanhead allowing the heart rate to be detected even if no skin isvisible. However, their system was outperformed by camera-based PPG measurements in some cases and is likely to besusceptible to noise due to rigid head motions. A pilot study ininfant monitoring has demonstrated accurate measurement ofHR using remote PPG measurements from a camera in realisticconditions [1], HRV measurements were not validated.
III. METHODS
A. Camera
The camera used to collect the video sequences for analysiswas a digital single-lens reflex (DSLR) camera. The lens usedwas a standard Zuiko 50mm lens. The camera’s sensor has thecapability of capturing five color bands including the typicalthree frequency band sensors (red, green and blue (RGB))and also cyan and orange frequency band sensors (RGBCO).Figure 1 shows the sensitivities for the five band camera. Inother respects it was a standard DSLR camera. Figure 2 showsthe five band camera sensor layout. The image shows thearrangement of the colors in a 4x4 pattern that repeats acrossthe sensor. Each pixel on the sensor measures one color as
Fig. 1. Five band camera light sensitivity profile. In addition to red, greenand blue light sensors this camera can measure orange and cyan bands.
Fig. 2. Five band camera sensor layout. The image shows the arrangementof the colors in a 4x4 pattern that repeats across the sensor. Each pixel onthe sensor measures one color as determined by its position.
determined by its position. Further details about the sensorand demosaicking can be found in [21].
The raw image values captured by the camera can becalculated using the following formulation:
m =X
�
e(�)s(�) (1)
Where e(�) is the energy of light at a given wavelength �and s(�) is the camera sensitivity profile for a certain colorchannel. We compare the performance recovering physiologi-cal parameters using all 31 possible combinations of the colorbands in Section IV. Custom image capture software was usedto record raw images of each frame of video. All the videoswere recorded with a frame rate of 30 frames per second (fps)and a resolution of 960 x 720. The recording were in color(80-bit image with five channels x 16 bits/channel).
B. Contact SensorsFor comparison of the camera measurements with a contact
sensor, BVP, respiration and electrodermal activity (EDA) sig-nals were measured using FDA-approved sensors (FlexcompInfiniti by Thought Technologies, Inc.). BVP was calculatedvia the PPG signal from the index finger tip on the left hand.EDA was measured with finger sensors on the middle andring fingers of both hands and respiration was measured usinga chest strap. For the validation and analysis here we onlyconsider the BVP and respiration measurements.
C. ExperimentsThis study was approved by the Institutional Review Board
of the Massachusetts Institute of Technology (COUHES).All experiments were conducted indoors and with a varyingamount of ambient light, provided by a changing combination
3
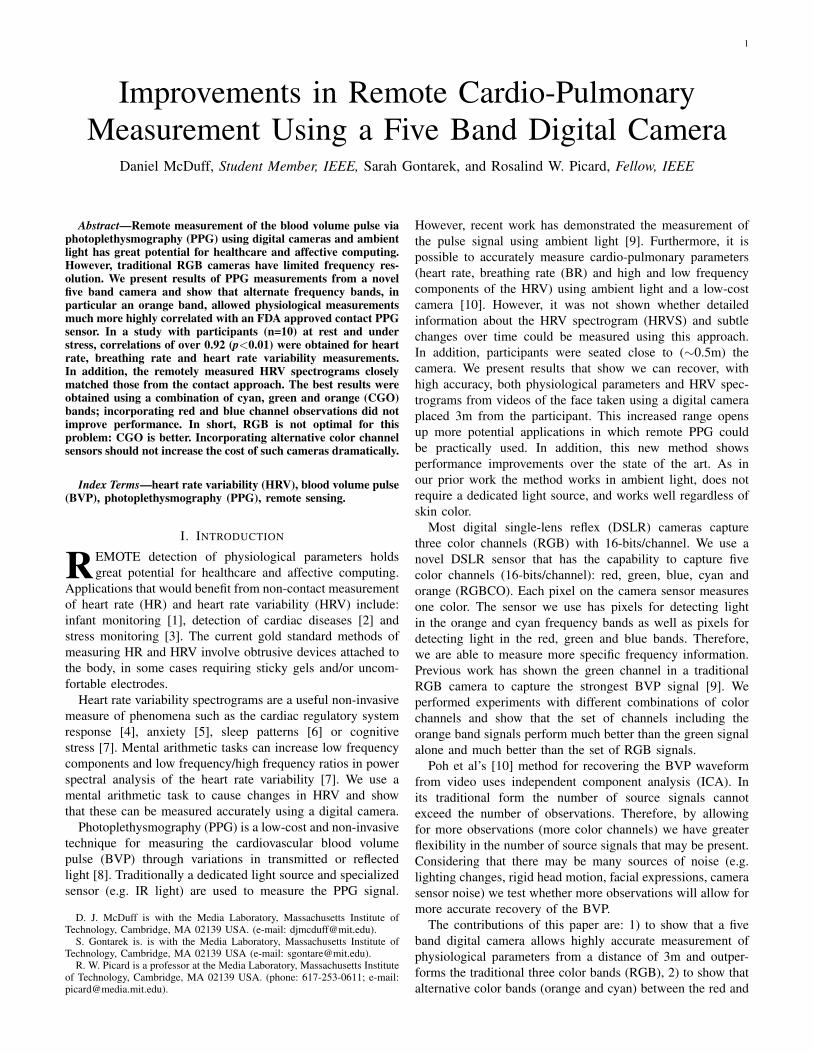
Fig. 3. Overview of the automated method used to recover the HRV spectrogram from videos of a human face. 1) Facial landmarks are detected using [20]and the face region of interest (ROI) segmented (excluding the region around the eyes), 2) spatial averages of each color channel in the ROI over time arecalculated, 3) source signals, calculated via ICA, are filtered, 4) the channel with the estimated strongest BVP signal are selected and inverted if necessary,5) BVP signal is interpolated to 256Hz, peaks detected, and IBIs calculated, 6) spectrogram are calculated with a moving window (window length 60s, stepsize 1s).
of sunlight through a nearby window and indoor illumination.Participants were seated and the data were recorded on a laptop(Toshiba laptop running Windows 7).
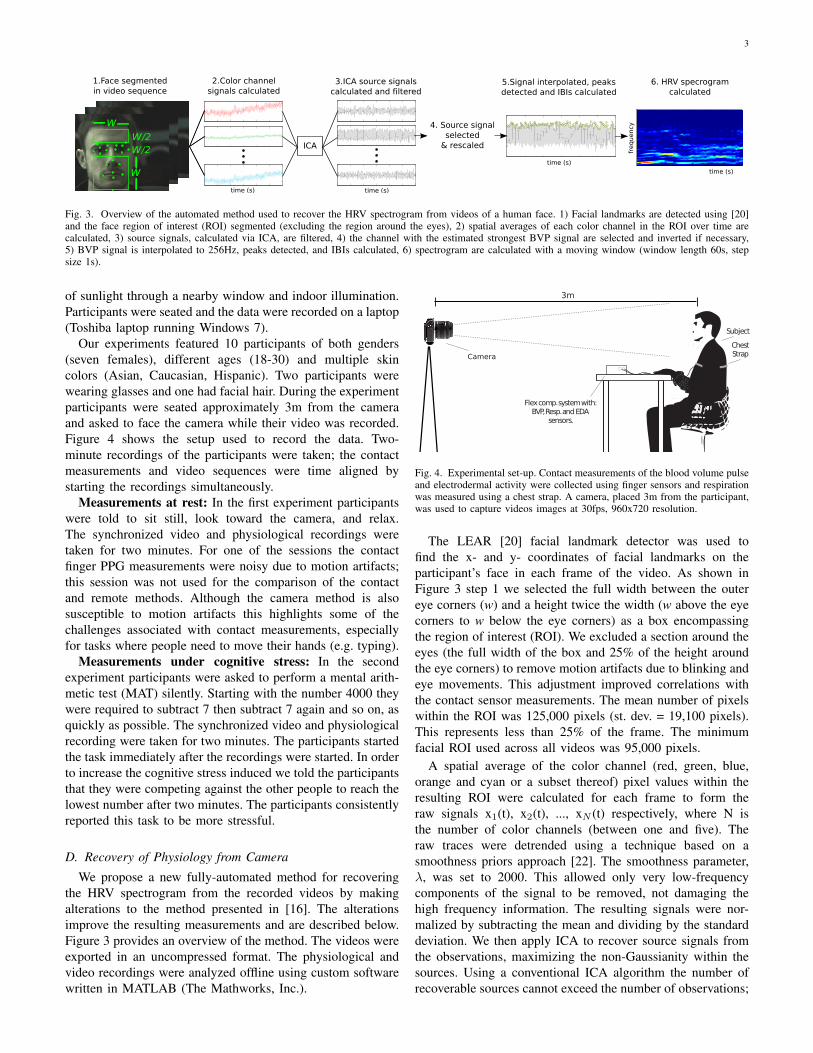
Our experiments featured 10 participants of both genders(seven females), different ages (18-30) and multiple skincolors (Asian, Caucasian, Hispanic). Two participants werewearing glasses and one had facial hair. During the experimentparticipants were seated approximately 3m from the cameraand asked to face the camera while their video was recorded.Figure 4 shows the setup used to record the data. Two-minute recordings of the participants were taken; the contactmeasurements and video sequences were time aligned bystarting the recordings simultaneously.
Measurements at rest: In the first experiment participantswere told to sit still, look toward the camera, and relax.The synchronized video and physiological recordings weretaken for two minutes. For one of the sessions the contactfinger PPG measurements were noisy due to motion artifacts;this session was not used for the comparison of the contactand remote methods. Although the camera method is alsosusceptible to motion artifacts this highlights some of thechallenges associated with contact measurements, especiallyfor tasks where people need to move their hands (e.g. typing).
Measurements under cognitive stress: In the secondexperiment participants were asked to perform a mental arith-metic test (MAT) silently. Starting with the number 4000 theywere required to subtract 7 then subtract 7 again and so on, asquickly as possible. The synchronized video and physiologicalrecording were taken for two minutes. The participants startedthe task immediately after the recordings were started. In orderto increase the cognitive stress induced we told the participantsthat they were competing against the other people to reach thelowest number after two minutes. The participants consistentlyreported this task to be more stressful.
D. Recovery of Physiology from CameraWe propose a new fully-automated method for recovering
the HRV spectrogram from the recorded videos by makingalterations to the method presented in [16]. The alterationsimprove the resulting measurements and are described below.Figure 3 provides an overview of the method. The videos wereexported in an uncompressed format. The physiological andvideo recordings were analyzed offline using custom softwarewritten in MATLAB (The Mathworks, Inc.).
Fig. 4. Experimental set-up. Contact measurements of the blood volume pulseand electrodermal activity were collected using finger sensors and respirationwas measured using a chest strap. A camera, placed 3m from the participant,was used to capture videos images at 30fps, 960x720 resolution.
The LEAR [20] facial landmark detector was used tofind the x- and y- coordinates of facial landmarks on theparticipant’s face in each frame of the video. As shown inFigure 3 step 1 we selected the full width between the outereye corners (w) and a height twice the width (w above the eyecorners to w below the eye corners) as a box encompassingthe region of interest (ROI). We excluded a section around theeyes (the full width of the box and 25% of the height aroundthe eye corners) to remove motion artifacts due to blinking andeye movements. This adjustment improved correlations withthe contact sensor measurements. The mean number of pixelswithin the ROI was 125,000 pixels (st. dev. = 19,100 pixels).This represents less than 25% of the frame. The minimumfacial ROI used across all videos was 95,000 pixels.
A spatial average of the color channel (red, green, blue,orange and cyan or a subset thereof) pixel values within theresulting ROI were calculated for each frame to form theraw signals x1(t), x2(t), ..., xN (t) respectively, where N isthe number of color channels (between one and five). Theraw traces were detrended using a technique based on asmoothness priors approach [22]. The smoothness parameter,�, was set to 2000. This allowed only very low-frequencycomponents of the signal to be removed, not damaging thehigh frequency information. The resulting signals were nor-malized by subtracting the mean and dividing by the standarddeviation. We then apply ICA to recover source signals fromthe observations, maximizing the non-Gaussianity within thesources. Using a conventional ICA algorithm the number ofrecoverable sources cannot exceed the number of observations;

4
thus, we assumed N underlying source signals, representedby s1(t), s2(t), ..., sN (t). We use the JADE implementationof ICA [23]. Each of the source signals was band-passfiltered using a Hamming window filter with low- and high-frequency cut-offs at 45 beats-per-minute (bpm) (0.75Hz) and180 bpm (3Hz) respectively. These cut-off frequencies reflectconservative lower and upper limits in heart rate.
ICA has two properties that make automated analysis chal-lenging. Firstly, the source signals are returned in a randomorder and therefore it is not always the same source which hasthe strongest BVP waveform. Secondly, the source signals canbe scaled arbitrarily (and subsequently flipped if scaled by anumber < 0). A flipped BVP signal is problematic when itcomes to peak detection as the calculated inter-beat intervals(IBI) are typically much less accurate. The following steps aredesigned to find the optimal source signal and invert it if theBVP component within the source has been flipped.
The appropriate source signal was selected by calculatingthe normalized fast Fourier transform (FFT) of each sourceand choosing the source signal with the greatest frequencypeak within the range 45 - 180 bpm (the same limits as thebandpass filter 3dB points above). The FFTs were normalizedto give a total power across all frequencies equal to one. Thisis similar to the method used by Poh et al. [10]. We verifiedthis approach by manually choosing the optimal source signalfor the five band signal case and the FFT method agreed on alloccasions. Figure 5a shows examples of source signals and thepower spectra of each source. Clearly, the power spectrum withthe highest peak corresponds to the signal with the strongestBVP; all other source signals have flatter spectra.
As mentioned above, when using ICA the BVP waveformmay be inverted. In order to automatically predict whetherthe selected source signal has an inverted BVP waveformwe calculate the mean absolute peak (µpeakamp) and trough(µtroughamp) amplitudes (the source signals are returned withzero mean). For an inverted BVP signal the mean troughamplitude is likely to be greater than the mean peak amplitudedue to the shape of the BVP waveform. Therefore, if µpeakamp< µtroughamp the selected source would be inverted (multipliedby -1). Figure 5 shows examples of a non-inverted and aninverted BVP signal. Poh et al. [10] did not propose anytechnique for detecting inverted BVP signals. In Section IV weshow that this addition improves the accuracy of the resultingphysiological parameters.
The estimated BVP signal was interpolated with a cubicspline function at a sampling frequency of 256Hz. Peakdetection was performed using a custom algorithm with amoving time window of length 0.25s. Within the movingwindow, if the signal maximum was greater than that in theprevious window the next window would be considered. Ifthe maximum within the window was less than that in theprevious window then the previous maximum was selected as apeak and the process would repeat. We tested different windowsizes and found that a window of 0.25s gave the results thatwere most closely correlated with the visually verified contactsensor measurements, results are shown in Table II. Figure 6shows a 30 second comparison of the PPG waveforms fromthe contact sensor and the remote method for one individual.
Fig. 5. a) ICA returns the source signals in a random order. Source signalselection is solved by choosing the signal with peak of greatest power in thenormalized FFT spectrum (between 40 and 180 bpm). In the above examplethis would mean selecting the second source signal. b) ICA returns sourcesignals with arbitrary scaling. Problems due to inverted signals are solved byfinding the mean absolute peak and trough heights and inverting the signal ifµpeakamp < µtroughamp.
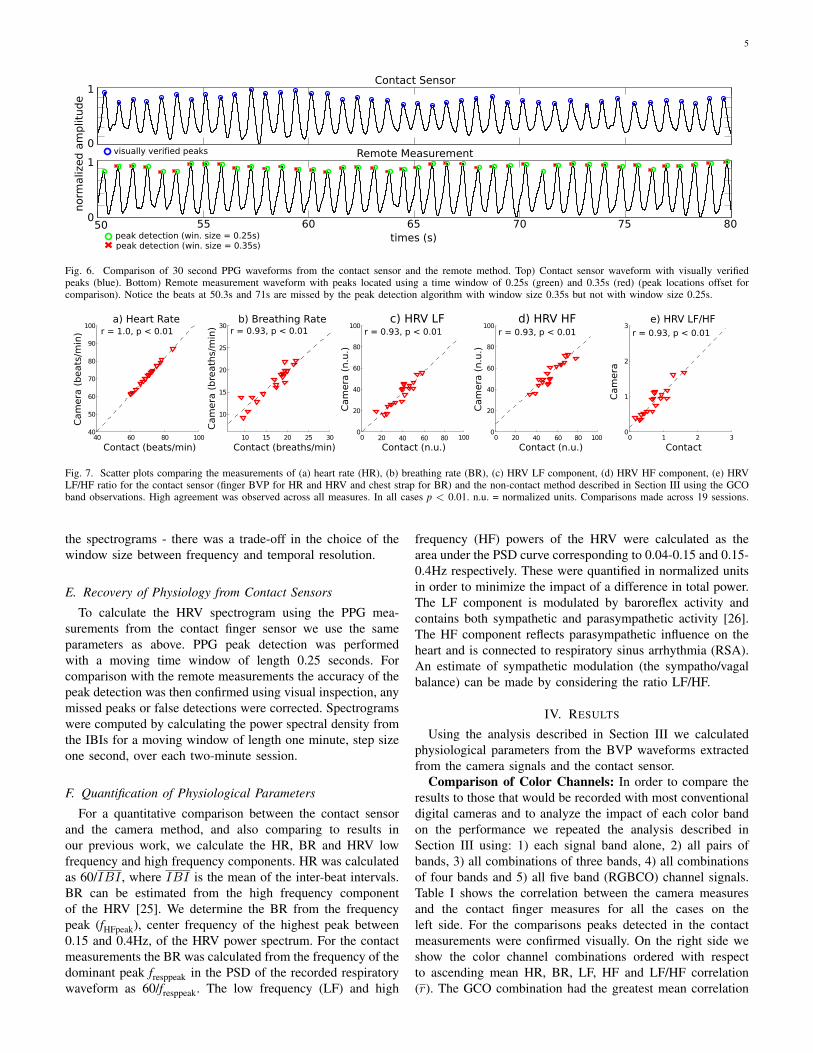
The visually verified peaks are shown on the contact waveformand the automatically detected peaks are shown on the remotewaveform. Notice how when using a window size of 0.35s thebeats at 50.3s and 71s are missed but with a window size of0.25s they are not.
To avoid artifacts (such as motion or ectopic beats) whichcan impact the HRV analysis, the resulting IBIs were filteredusing the non causal of variable threshold (NC-VT) algo-rithm [24] with a tolerance of 30% (Poh et al. [10] found 30%tolerance to be effective). Finally, inter-beat intervals werefiltered using a low pass filter with cut-off frequency 0.4Hz. Inthis analysis we were interested in measuring the high (0.15-0.4Hz) and low frequency (0.04-0.15Hz) components of theHRV power spectra and therefore we filtered with a cut-off at0.4Hz. We construct the HRV spectrograms by calculating thepower spectral density from the IBIs for sequential windows.For each window the power spectral density (PSD) of the inter-beat intervals was calculated using the Lomb periodogram. Inthis analysis we use a moving window of one minute and thesessions were two minutes in length, the step size was onesecond. We chose these parameters as we wanted to have alarge enough window to measure high and low frequency com-ponents of the IBIs (between 0.04-0.4Hz) accurately withineach window but also to capture the temporal dynamics in
5
Fig. 6. Comparison of 30 second PPG waveforms from the contact sensor and the remote method. Top) Contact sensor waveform with visually verifiedpeaks (blue). Bottom) Remote measurement waveform with peaks located using a time window of 0.25s (green) and 0.35s (red) (peak locations offset forcomparison). Notice the beats at 50.3s and 71s are missed by the peak detection algorithm with window size 0.35s but not with window size 0.25s.
Fig. 7. Scatter plots comparing the measurements of (a) heart rate (HR), (b) breathing rate (BR), (c) HRV LF component, (d) HRV HF component, (e) HRVLF/HF ratio for the contact sensor (finger BVP for HR and HRV and chest strap for BR) and the non-contact method described in Section III using the GCOband observations. High agreement was observed across all measures. In all cases p < 0.01. n.u. = normalized units. Comparisons made across 19 sessions.
the spectrograms - there was a trade-off in the choice of thewindow size between frequency and temporal resolution.
E. Recovery of Physiology from Contact SensorsTo calculate the HRV spectrogram using the PPG mea-
surements from the contact finger sensor we use the sameparameters as above. PPG peak detection was performedwith a moving time window of length 0.25 seconds. Forcomparison with the remote measurements the accuracy of thepeak detection was then confirmed using visual inspection, anymissed peaks or false detections were corrected. Spectrogramswere computed by calculating the power spectral density fromthe IBIs for a moving window of length one minute, step sizeone second, over each two-minute session.
F. Quantification of Physiological ParametersFor a quantitative comparison between the contact sensor
and the camera method, and also comparing to results inour previous work, we calculate the HR, BR and HRV lowfrequency and high frequency components. HR was calculatedas 60/IBI , where IBI is the mean of the inter-beat intervals.BR can be estimated from the high frequency componentof the HRV [25]. We determine the BR from the frequencypeak (fHFpeak), center frequency of the highest peak between0.15 and 0.4Hz, of the HRV power spectrum. For the contactmeasurements the BR was calculated from the frequency of thedominant peak fresppeak in the PSD of the recorded respiratorywaveform as 60/fresppeak. The low frequency (LF) and high
frequency (HF) powers of the HRV were calculated as thearea under the PSD curve corresponding to 0.04-0.15 and 0.15-0.4Hz respectively. These were quantified in normalized unitsin order to minimize the impact of a difference in total power.The LF component is modulated by baroreflex activity andcontains both sympathetic and parasympathetic activity [26].The HF component reflects parasympathetic influence on theheart and is connected to respiratory sinus arrhythmia (RSA).An estimate of sympathetic modulation (the sympatho/vagalbalance) can be made by considering the ratio LF/HF.
IV. RESULTS
Using the analysis described in Section III we calculatedphysiological parameters from the BVP waveforms extractedfrom the camera signals and the contact sensor.
Comparison of Color Channels: In order to compare theresults to those that would be recorded with most conventionaldigital cameras and to analyze the impact of each color bandon the performance we repeated the analysis described inSection III using: 1) each signal band alone, 2) all pairs ofbands, 3) all combinations of three bands, 4) all combinationsof four bands and 5) all five band (RGBCO) channel signals.Table I shows the correlation between the camera measuresand the contact finger measures for all the cases on theleft side. For the comparisons peaks detected in the contactmeasurements were confirmed visually. On the right side weshow the color channel combinations ordered with respectto ascending mean HR, BR, LF, HF and LF/HF correlation(r). The GCO combination had the greatest mean correlation

6
TABLE ICOMPARISON OF THE CORRELATIONS BETWEEN THE CONTACT FINGER
SENSOR MEASUREMENTS AND CAMERA MEASUREMENTS FOR ALLCOMBINATIONS OF THE CAMERA COLOR CHANNEL SIGNALS. FOR ALL
CORRELATIONS p < 0.01. ON THE RIGHT ARE THE CHANNELCOMBINATIONS ORDERED FROM LOWEST MEAN CORRELATION TO
HIGHEST MEAN CORRELATION. THE GCO CHANNEL COMBINATIONPERFORMED BEST. COMPARISONS MADE ACROSS 19 SESSIONS.
HR BR LF HF LF/HFR 0.99 0.95 0.60 0.60 0.57G 0.99 0.91 0.63 0.63 0.63B 0.99 0.93 0.68 0.68 0.70C 0.85 0.44 0.64 0.64 0.64O 0.83 -0.02 0.43 0.43 0.34
RG 0.97 0.66 0.72 0.72 0.74RB 0.95 0.89 0.47 0.47 0.47RC 0.99 0.67 0.69 0.69 0.73RO 1.00 0.93 0.88 0.88 0.89GB 0.89 0.75 0.44 0.44 0.44GC 0.99 0.83 0.82 0.82 0.82GO 1.00 0.98 0.88 0.88 0.88BC 0.99 0.68 0.61 0.61 0.65BO 1.00 0.92 0.87 0.87 0.87CO 0.99 0.67 0.40 0.40 0.48
RGB 0.85 0.67 0.45 0.45 0.46RGC 0.99 0.75 0.67 0.67 0.71RGO 1.00 0.92 0.83 0.83 0.86RBC 0.99 0.69 0.71 0.71 0.68RBO 1.00 0.92 0.83 0.83 0.83RCO 1.00 0.90 0.91 0.91 0.89GBC 0.99 0.77 0.80 0.80 0.78GBO 1.00 0.93 0.84 0.84 0.83GCO 1.00 0.93 0.93 0.93 0.93BCO 0.99 0.84 0.69 0.69 0.77
RGBC 0.99 0.89 0.72 0.72 0.68RGBO 1.00 0.81 0.79 0.79 0.81RGCO 1.00 0.90 0.87 0.87 0.86RBCO 1.00 0.90 0.81 0.81 0.77GBCO 1.00 0.72 0.83 0.83 0.80
RGBCO 1.00 0.74 0.81 0.81 0.79
Lowest rO
RGBCOGBC
RBBCR
RCRBC
GRGCRG
BCOB
RGBCGBC
RGBCOGBCORGBO
GCRBCORBOGBORGO
RGCOBORO
RCOGO
GCOHighest r
TABLE IICOMPARISON OF THE CORRELATIONS BETWEEN THE CONTACT FINGER
SENSOR MEASUREMENTS AND CAMERA MEASUREMENTS FOR THE GCOCHANNEL COMBINATION - WITH DIFFERENT PEAK DETECTION WINDOW
SIZES. WIN. SIZE: 0.25S SHOWS THE HIGHEST CORRELATION.Win. Size HR BR LF HF LF/HF
0.15s 0.95 0.92 0.68 0.68 0.610.20s 1.00 0.88 0.94 0.94 0.920.25s 1.00 0.93 0.93 0.93 0.930.30s 1.00 0.83 0.88 0.88 0.860.35s 0.96 0.63 0.83 0.83 0.83
across all measures. Interestingly, the O band alone had thelowest mean correlation across all measures, but is present inall of the 10 top-performing combinations.
Figure 7 shows the correlations between the non-contact andcontact measurements for the a) HR, b) Breathing Rate (BR),c) HRV LF, d) HRV HF and e) HRV LF/HF measurements.The camera values were computed using the GCO channels.These results show high agreement between the remote methodand the finger PPG measures and are improved over thosepresented by Poh et al. [10] despite the camera being muchfurther from the subject here (3m compared to 0.5m).
HRV Spectrograms: We calculated the HRV spectrogramsfrom the two minute sessions using a one minute sliding win-dow with one second increments. This is the first example weare aware of that shows the HRV spectrograms calculated from
TABLE IIICOMPARISON OF THE CORRELATIONS BETWEEN THE CONTACT FINGER
SENSOR MEASUREMENTS AND CAMERA MEASUREMENTS FOR THE GCOCHANNEL COMBINATION - WITH AND WITHOUT INVERSION CORRECTIONOF THE SELECTED SOURCE SIGNAL AFTER ICA. FOR ALL CORRELATIONS
p < 0.01.
HR BR LF HF LF/HFwithout inversion correction 1.00 0.90 0.86 0.86 0.88
with inversion correction 1.00 0.93 0.93 0.93 0.93
non-contact video sequences. Figure 8 shows a comparisonof spectrograms recovered from the three band (RGB) andthree band (GCO) recordings next to those from the contactfinger measurements. On the left are examples from sessionsin which the participants were at rest and on the right areexamples in which the participants were under cognitive stress.
Impact of Inversion Correction Step: Table III showsthe impact of inverting the source signal output from ICA.Without this step some of the source signals have an invertedBVP and in these cases calculation of the IBIs is problematic.Our new method of detecting and correcting for inversiongives a closer estimation of the HRV spectra and subsequentparameters when compared to the contact measures.
Performance in Rest and Stress Conditions: Figure 7shows the correlations between the non-contact and contactmeasurements for all the data. Here we compare the per-formance of the algorithm for the rest and stress conditionsseparately. In the rest condition the HR, BR, HRV LF, HF andLF/HF correlations with the contact sensor were: 1.0, 0.90,0.87, 0.87, 0.86 respectively. In the stress condition the HR,BR, HRV LF, HF and LF/HF correlations with the contactsensor were: 1.0, 0.91, 0.97, 0.97, 0.95 respectively. Theresults show good performance in both conditions. Althoughthe correlations were slightly lower in the rest conditionperhaps due to the slower breathing rates which may be harderto estimate within the time window.
V. DISCUSSION
Our results in Table I show high correlation between thecontact measures and the camera measures, despite the camerabeing placed 3m from the participant. The best performingcombination of channels was GCO, which was only outper-formed by other combinations for the BR correlation. Theorange band featured in the top ten combinations of channels:This suggests it is capturing significant information. However,other observations are also needed to help boost the signal tonoise ratio. The orange band is close to the green band and thissupports previous work that showed strong measurement of theBVP in the green frequency range [9]. In order to improveremote PPG measurements using digital cameras these resultssuggest one should include color channel sensors closer to theorange, green and cyan frequencies.
Heart rate measurements were highly correlated acrossalmost all of the channels. This is because the dominantfrequency measurement is not highly susceptible to poor peakdetection on the BVP. However, the correlations of othermeasures - which all rely on accurate BVP peak detection -varied greatly. The benefit of the additional color bands standsout as they allow for the recovery of a much cleaner BVP

7
Fig. 8. Heart rate variability spectrograms calculated using: Top) RGB camera signals, middle) GCO camera signals and bottom) contact finger sensor.Qualitatively the measurements from the GCO channels more closely match those from the contact sensor (reinforcing the quantitative comparisons inTable I). On the left are sessions in which participants 5 and 10 were at rest and on the right are sessions in which participants 5 and 10 were under cognitivestress. There are stronger low frequency components in the latter as we would expect less parasympathetic nervous system activity. The measurements forparticipant 5, under cognitive stress, made using the camera suggest that the camera (using GCO bands) may have been more accurate than the finger sensors.
signal and therefore more accurate source signal selection,scaling and peak detection.
Interestingly, the RGB combination of color channels, usedin today’s standard digital cameras, was one of the worst per-forming combinations of channels. The measurements usingthe GCO combination of color channels show high agreementbetween the remote method and the finger PPG measures andare greater than those presented by Poh et al. [10] despite thecamera being much further from the subject (3m compared to0.5m) and our inclusion of variable lighting, different colors ofskin and subjects wearing glasses. The spectrogram calculatedfrom the five band observations is closer to that of the fingermeasurements and in example P5 of Fig. 8 actually seems tobe more accurate than the finger measurements - perhaps dueto motion artifacts as a result of the fingers moving. However,we cannot be certain that this is the case - we will investigatethe impact of motion more in future work.
We can see from the spectrograms that there is greater lowfrequency power in the HRV spectra for those individualsunder cognitive stress, this is what we would expect dueto less parasympathetic activity. Across all participants themean HRV LF/HF ratio in the stress condition (0.81) wassignificantly higher (p<0.005) than in the rest condition (0.51).Eight of ten participants had a higher HRV LF/HF ratio duringthe stress condition compared to the rest condition. HigherEDA response was also observed in eight of ten participantsin the stress condition relative to the rest condition (sevenparticipants had higher HRV LF/HF ratio and higher EDAresponse in the stress condition).
VI. CONCLUSIONS AND FUTURE WORK
We have presented physiological measurements (HR, BR,HRV LF and HF components) from camera images of thehuman face. Using a novel five band camera sensor we showthat an orange color channel helps boost the performance of
physiological measurement using a digital camera. A com-bination of cyan, green and orange color channels was thebest performing. The RGB channel combination was oneof the poorest performing. The GCO channel combinationoutperformed the RGB channels for all individuals showingthat the best performance occurred across a range of skin tonesand under varying ambient lighting conditions. We comparedthe camera measurements with those from traditional contactmeasurements. The agreement between the contact and camerameasurements was very high. The measurements were madewith a digital camera placed 3m from the face of the partici-pant, a greater distance than in results presented previously.
We present the first examples of HRV spectrograms calcu-lated from videos of the human face. Qualitative comparisonsbetween the spectrograms measured using the camera and thecontact sensors show close agreement.
There are certain limitations that should be noted whenconsidering these results. In these experiments the participantswere free to move; however, they were seated and did notturn away from the camera. A real-time system would needto address issues such as artifacts due to incorrect/missingface tracking results, rigid head motions and dramatic ambientlight changes. We have tested the system against data from10 individuals and demonstrated very strong performance.However, for certain applications - such as infant monitoring- testing would need to be performed on a representativepopulation. Future work will consider measurements as peopleperform computer tasks and investigation of whether cognitivestress can be predicted from remotely measured changes incardio-pulmonary activity. Comparisons between the measure-ments made by the camera and electro-cardiogram (ECG)measurements of HR and HRV components would also be auseful extension. In this work all the analysis was performedoff-line. We leave a real-time implementation of the approachto future work.

8
ACKNOWLEDGMENT
This work was funded by the MIT Media Lab Member Con-sortium. Daniel McDuff was supported by an NEC fellowship.
REFERENCES
[1] L. A. Aarts, V. Jeanne, J. P. Cleary, C. Lieber, J. S. Nelson, S. Bam-bang Oetomo, and W. Verkruysse, “Non-contact heart rate monitoringutilizing camera photoplethysmography in the neonatal intensive careunita pilot study,” Early human development, vol. 89, no. 12, pp. 943–948, 2013.
[2] R. E. Kleiger, J. P. Miller, J. T. Bigger Jr, and A. J. Moss, “Decreasedheart rate variability and its association with increased mortality afteracute myocardial infarction,” The American journal of cardiology,vol. 59, no. 4, pp. 256–262, 1987.
[3] J. Delaney and D. Brodie, “Effects of short-term psychological stresson the time and frequency domains of heart-rate variability,” Perceptualand motor skills, vol. 91, no. 2, pp. 515–524, 2000.
[4] M. V. Kamath, D. N. Ghista, E. L. Fallen, D. Fitchett, D. Miller,and R. McKelvie, “Heart rate variability power spectrogram as apotential noninvasive signature of cardiac regulatory system response,mechanisms, and disorders,” Heart and vessels, vol. 3, no. 1, pp. 33–41,1987.
[5] P. Jonsson, “Respiratory sinus arrhythmia as a function of state anxiety inhealthy individuals,” International journal of psychophysiology, vol. 63,no. 1, pp. 48–54, 2007.
[6] C. C. Yang, C.-W. Lai, H. Y. Lai, and T. B. Kuo, “Relationship betweenelectroencephalogram slow-wave magnitude and heart rate variabilityduring sleep in humans,” Neuroscience letters, vol. 329, no. 2, pp. 213–216, 2002.
[7] A. Moriguchi, A. Otsuka, K. Kohara, H. Mikami, K. Katahira, T. Tsune-toshi, K. Higashimori, M. Ohishi, Y. Yo, and T. Ogihara, “Spectralchange in heart rate variability in response to mental arithmetic beforeand after the beta-adrenoceptor blocker, carteolol,” Clinical AutonomicResearch, vol. 2, no. 4, pp. 267–270, 1992.
[8] J. Allen, “Photoplethysmography and its application in clinical physio-logical measurement,” Physiological measurement, vol. 28, no. 3, p. R1,2007.
[9] W. Verkruysse, L. O. Svaasand, and J. S. Nelson, “Remote plethysmo-graphic imaging using ambient light,” Optics express, vol. 16, no. 26,pp. 21 434–21 445, 2008.
[10] M.-Z. Poh, D. J. McDuff, and R. W. Picard, “Advancements in non-contact, multiparameter physiological measurements using a webcam,”Biomedical Engineering, IEEE Transactions on, vol. 58, no. 1, pp. 7–11,2011.
[11] S. S. Ulyanov and V. V. Tuchin, “Pulse-wave monitoring by meansof focused laser beams scattered by skin surface and membranes,” inOE/LASE’93: Optics, Electro-Optics, & Laser Applications in Science&Engineering. International Society for Optics and Photonics, 1993, pp.160–167.
[12] E. Greneker, “Radar sensing of heartbeat and respiration at a distancewith applications of the technology,” in Radar 97 (Conf. Publ. No. 449).IET, 1997, pp. 150–154.
[13] S. Bakhtiari, T. W. Elmer, N. M. Cox, N. Gopalsami, A. C. Raptis,S. Liao, I. Mikhelson, and A. V. Sahakian, “Compact millimeter-wave sensor for remote monitoring of vital signs,” Instrumentation andMeasurement, IEEE Transactions on, vol. 61, no. 3, pp. 830–841, 2012.
[14] M. Garbey, N. Sun, A. Merla, and I. Pavlidis, “Contact-free measurementof cardiac pulse based on the analysis of thermal imagery,” BiomedicalEngineering, IEEE Transactions on, vol. 54, no. 8, pp. 1418–1426, 2007.
[15] J. Fei and I. Pavlidis, “Thermistor at a distance: unobtrusive measure-ment of breathing,” Biomedical Engineering, IEEE Transactions on,vol. 57, no. 4, pp. 988–998, 2010.
[16] M.-Z. Poh, D. J. McDuff, and R. W. Picard, “Non-contact, automatedcardiac pulse measurements using video imaging and blind sourceseparation,” Optics Express, vol. 18, no. 10, pp. 10 762–10 774, 2010.
[17] Y. Sun, S. Hu, V. Azorin-Peris, S. Greenwald, J. Chambers, and Y. Zhu,“Motion-compensated noncontact imaging photoplethysmography tomonitor cardiorespiratory status during exercise,” Journal of BiomedicalOptics, vol. 16, no. 7, pp. 077 010–077 010, 2011.
[18] H.-Y. Wu, M. Rubinstein, E. Shih, J. Guttag, F. Durand, and W. Freeman,“Eulerian video magnification for revealing subtle changes in the world,”ACM Transactions on Graphics (TOG), vol. 31, no. 4, p. 65, 2012.
[19] G. Balakrishnan, F. Durand, and J. Guttag, “Detecting pulse from headmotions in video,” in Computer Vision and Pattern Recognition (CVPR),2013 IEEE Conference on. IEEE, 2013, pp. 3430–3437.
[20] B. Martinez, M. F. Valstar, X. Binefa, and M. Pantic, “Local evidenceaggregation for regression-based facial point detection,” IEEE Transac-tions on Pattern Analysis and Machine Intelligence, vol. 35, no. 5, pp.1149–1163, 2013.
[21] Y. Monno, M. Tanaka, and M. Okutomi, “Multispectral demosaickingusing guided filter,” in IS&T/SPIE Electronic Imaging. InternationalSociety for Optics and Photonics, 2012, pp. 82 990O–82 990O.
[22] M. P. Tarvainen, P. O. Ranta-aho, and P. A. Karjalainen, “An advanceddetrending method with application to hrv analysis,” Biomedical Engi-neering, IEEE Transactions on, vol. 49, no. 2, pp. 172–175, 2002.
[23] J.-F. Cardoso and A. Souloumiac, “Blind beamforming for non-gaussiansignals,” in IEE Proceedings F (Radar and Signal Processing), vol. 140,no. 6. IET, 1993, pp. 362–370.
[24] J. Vila, F. Palacios, J. Presedo, M. Fernandez-Delgado, P. Felix, andS. Barro, “Time-frequency analysis of heart-rate variability,” Engineer-ing in Medicine and Biology Magazine, IEEE, vol. 16, no. 5, pp. 119–126, 1997.
[25] T. E. Brown, L. A. Beightol, J. Koh, and D. L. Eckberg, “Importantinfluence of respiration on human rr interval power spectra is largelyignored,” Journal of Applied Physiology, vol. 75, no. 5, pp. 2310–2317,1993.
[26] S. Akselrod, D. Gordon, F. A. Ubel, D. C. Shannon, A. Berger, and R. J.Cohen, “Power spectrum analysis of heart rate fluctuation: a quantitativeprobe of beat-to-beat cardiovascular control,” science, vol. 213, no. 4504,pp. 220–222, 1981.
Daniel McDuff received the bachelor’s degree, withfirst-class honors and master’s degree in engineeringfrom Cambridge University. He is a PhD candidatein the Affective Computing Group at the MIT MediaLab. He is interested in computer vision and machinelearning to enable the automated recognition ofaffect. He is also interested in technology for remotemeasurement of physiology. He is a student memberof the IEEE.
Sarah Gontarek is an electrical engineering andcomputer science student at MIT, and a politicalscience student at Wellesley College. She is inter-ested in signal processing, neuroscience, and ma-chine learning. She enjoys work in the AffectiveComputing Group in the Media Lab, because she isespecially interested in biomedical applications forcommon digital communications technology.
Rosalind W. Picard received the ScD degree inelectrical engineering and computer science fromMIT. She is a professor of Media Arts and Sciencesat the MIT Media Lab, founder and director ofthe Affective Computing Group at the MIT MediaLab. She is also a co-founder of Affectiva, Inc. Hercurrent research interests focus on the developmentof technology to help people comfortably and re-spectfully measure and communicate affective in-formation, as well as on the development of modelsof affect that improve decision-making and learning.
She is a fellow of the IEEE and member of the IEEE Computer Society.