Cardio-Respiratory Pulmonary System - SFU.caleyland/Kin143 Files/Cardiorespiratory.pdf ·...
9
9/25/08 1 Cardio-Respiratory System Pulmonary Systemic External Respiration Internal Respiration Arteries Arterioles Capillaries Venules Veins Colour coding for the the systemic system only Blood Vessels Skeletal Muscle Pump
Transcript of Cardio-Respiratory Pulmonary System - SFU.caleyland/Kin143 Files/Cardiorespiratory.pdf ·...

9/25/08
1
Cardio-Respiratory System
Pulmonary
Systemic
External Respiration
Internal Respiration
Arteries Arterioles Capillaries Venules Veins Colour coding for the the systemic system only
Blood Vessels
Skeletal Muscle Pump

9/25/08
2
Cardiac Output = Heart Rate x Stroke Volume
Cardiac Output (Q) = the amount of blood pumped in one minute by either the right or left ventricle of the heart.
Stroke Volume (SV) = the amount of blood pumped by the left or right ventricle of the heart per beat.
Heart Rate (HR) = the number of heart beats per minute/
L/min = litres of blood per minute bpm = beats per minute ml/b = millilitres of blood per beat
Q = HR x SV
Rest 5.6 L/min
= 70 bpm x 80 ml/b
Heavy Exercise
23 L/min
= 200 bpm x 115 ml/b
Respiratory System
Conducting Zone
Lungs 4-6 litres - very large moist surface alveoli - more than 300 million thin walled, elastic hollow sacs vital surface for gas exchange millions of short, thin walled capillaries
beside alveoli respiration maintains a fairly constant
favorable pressure gradient for exchange of O2 and CO2 between the capillaries and alveoli

9/25/08
3
Respiratory Zone
O2
CO2
PulmonaryVentilation
ExternalRespiration
Air
Alveoli
Ventilation (breathing) Air molecules move from an area of higher
pressure to an area of lower pressure Inspiration - diaphragm and external
intercostals contract increase volume in thoracic cavity reduce pressure in lungs air flows in
Ventilation (breathing)
Expiration - predominantly passive relaxation of inspiratory muscles decrease volume of cavity air pressure higher in lungs air moves out heavy exercise - abdominal muscles and
internal intercostals aid in expiration
Action of Diaphragm Minute Ventilation = Tidal Volume x Respiratory Frequency Minute ventilation (VE) = the volume of
air inspired or expired in one minute. Tidal volume (VT) = volume of air
ventilated per breath. Respiratory frequency (FR) = number of
breaths per minute.

9/25/08
4
VE = VT x FR
Litres/min
Litres/breath
Breaths/min
Rest 6-8 = 0.5 x 12-16
Heavy Exercise
125-180 = 2.5-3.0 x 50-60
Values for average size young male
Ventilation During Exercise
Oxygen Uptake (L/min)
VE (L/min)
Where would you begin to fail the talk test?
Composition of Blood
Gas Exchange
Internal Respiration

9/25/08
5
Gas Transport
Haemoglobin + oxygen ⇔ oxyhaemoglobin
Hb + O2 ⇔ HbO2
Normal values for haemoglobin: Men - 15.5 grams/100 ml blood Women - 13.5 grams/100 ml blood
Blood Pressure Pressure exerted on the walls of the arteries by
blood Systolic Blood Pressure - pressure on walls when the
left ventricle contracts and pushes bolus of blood through arteries normal range 100-140 mmHg
Diastolic Blood Pressure - pressure between contractions normal range - 60 - 90 mmHg
Hypertension - high blood pressure heart works harder greater risk of arterial damage
BP During Exercise During rhythmic dynamic exercise
running, cycling systolic BP increases as exercise intensity
increases (170-200 mmHg) diastolic BP remains constant or increases
slightly (can even decrease slightly) During static exercise (weight lifting)
significant increase in resistance to blood flow large rise in both systolic and diastolic BP
(more significant with arms overhead for similar effort)
33
Oxygen Uptake (VO2 max) Fick Equation
Arterial minus mixed venous oxygen difference {(a-v)O2 difference} is a measure of how much oxygen is extracted from the blood by the systemic system €
˙ V O2 = Q× (a − v )O2diff˙ V O2 = SV ×HR × (a − v )O2diff

9/25/08
6
35
rest arterial - 20 ml / 100ml venous - 14 ml / 100ml
Cross-sectional comparison of variables that contribute to aerobic capacity in untrained and trained persons and elite athletes
37
Acute Exercise HR usually increases linearly with increasing
workload to Max HR Cardiac output required for a given workload is
similar for trained and untrained subjects since training increases stroke volume, trained athletes
can perform a given workload at a lower heart rate Max SV at ≈ 40 % VO2 maximum changes during acute exercise accomplished by
increased filling of ventricles increased strength of contraction
hormonal response ejection fraction
39
Stroke Volume vs Oxygen Uptake
Rest 40% maximum
Stroke Volume (ml)
110
70
Oxygen Uptake
Recovery from maximal effort
9/25/08
7
Interval Training above VO2 max
During interval training stroke volume reaches higher levels more often because of the numerous relief intervals. Stroke volume is highest during the recovery period from exercise (Cummings 1972).
Stroke Volume (ml/beat) Rest 78 Exercise 93 Recovery 107.5
http://www.exrx.net/Aerobic/IntervalTraining.html
Blood Flow and Exercise Rest - approximately 15-20% of systemic blood
flow to skeletal muscles Max exercise ≈ 85 % of total blood flow to
working skeletal muscles results from
increased blood pressure dilation of arterioles in working muscles constriction of arterioles to non-working
muscles and viscera (liver, stomach, intestines...)
maintain blood flow to brain and heart skin blood flow for heat dissipation
43
Maximal Oxygen Uptake the ability of the heart to pump blood (Q) the oxygen carrying capacity of the blood
(haemoglobin content) the ability of the working muscles to accept
a large blood supply (amount of capillarization within a muscle)
the ability of the muscle cells (fibres) to extract oxygen from the capillary blood and use it to produce energy (number of mitochondria and aerobic enzymes).
46
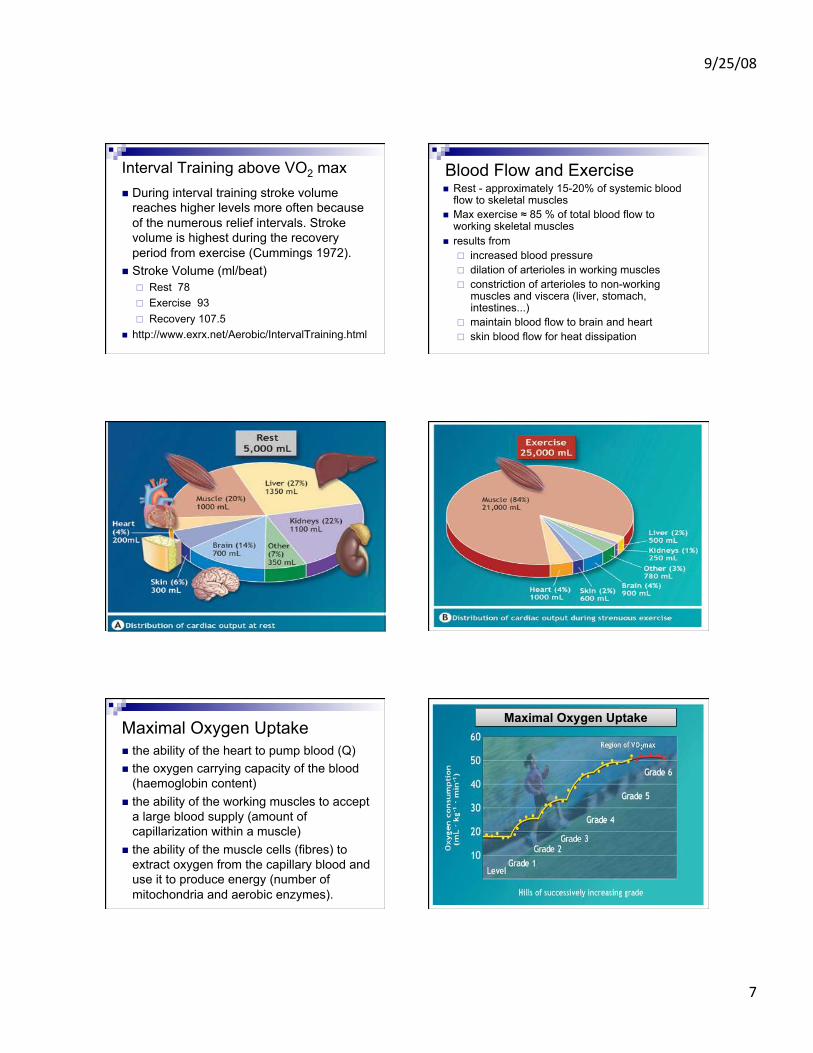
Maximal Oxygen Uptake

9/25/08
8
Maximal Oxygen Uptake vs. Workrate
Workrate Rest
VO2max
A graph for a less trained individual would show a peak at a lower workrate. Can you draw this curve?
Oxygen Uptake
(ml/kg.min)
Typical Canadian Values for VO2 max (ml/kg.min)
Male (20-29) 40-49 (5.5-6.8 laps) Male (50-59) 30-35 (4.5-5 laps) Female (20-29) 34-38 (5-5.5 laps) Female (50-59) 24-28 (4-4.3 laps)
Values in Cardiorespiratory lecture notes
Average VO2 max (ml/kg.min) for Non-Athletes and Athletes Group or Sport Age Male Female
Non-athletes 10-19 47-56 38-46 20-29 43-52 33-42 60-69 31-38 22-30
Baseball 18-32 48-56 Cycling 18-26 62-74 47-57 Football 20-36 42-60 - Gymnastics 18-22 52-58 36-50 Ice Hockey 10-30 50-63 - Rowing 20-35 60-72 58-65
Average VO2 max (ml/kg.min) for Non-Athletes and Athletes
Group or Sport Age Male Female Skiing – Alpine 18-30 57-68 50-55 Skiing – Cross-country
20-28 65-95 60-75
Soccer 22-28 54-64 - Speed Skating 18-24 56-73 44-55 Swimming 10-25 50-70 40-60 Weight Lifting 20-30 38-52 - Wrestling 20-30 52-65
VO2 and Gender
-9.3%58.853.3Max VO2 (ml/kg LBM/min)
-20%5040Max VO2 (ml/kg/min)
-37%59.737.5Lean Body Mass [LBM] kg
+67%1525Percent Fat
-29%7050Body Mass (kg
-43%3.52Max VO2 (L/min)
DifferenceMaleFemaleLactate Threshold
”The point during exercise of increasing intensity at which blood lactate begins to accumulate above resting levels, where lactate clearance is no longer able to keep up with lactate production.”
Many of you will have heard of it and realize it is relevant to aerobic endurance performance.
However, a basic understanding of energy metabolism during exercise is helpful to appreciate some of the current issues surrounding lactate and muscle fatigue so we will discuss this during the “energy systems” lecture.

9/25/08
9
Is VO2 max the Sole Determinant of Endurance Performance Answer = No Why? Mechanical Efficiency Lactate Threshold Motivation State of Training
(Fatigue). Daily variation
Midterm Question? Describe the systemic cardiorespiratory
effects you would observe in an individual who undergoes 4 months of aerobic conditioning. at rest during sub-maximal exercise during maximal exercise
Changes at Rest Systemic refers to changes in the delivery of oxygen to the
muscles rather than changes at the cellular level in the muscles. E.g an increase in stroke volume is a systemic change whereas an increase in mitochondrial enzymes concentration is a biochemical or cellular change.
The weight and volume of the heart generally increase with long-term aerobic training.
Decrease in heart rate and an increase in stroke volume with no change in cardiac output
Increase in blood volume (up to 20%) and total body haemoglobin content. Haemoglobin concentration, however, does not increase.
Changes During Sub-maximal Exercise Decrease in heart rate and an increase in stroke
volume for a given sub-maximal workload. Slight decrease in cardiac output for a given sub-
maximal workload (better a-vO2diff and less work for the heart).
No change or slight decrease in oxygen consumption at a given sub-maximal workload. Any decrease is probably due to an increase in mechanical efficiency.
Decrease in the amount of air breathed at a particular rate of sub-maximal oxygen consumption.
Changes During Maximal Exercise No change or more likely a slight decrease in maximal
heart rate. Increase in maximum stroke volume. Increase in maximum cardiac output. Increase in maximal difference. Hence if the two factors above increase, there must also be
an increase in maximum oxygen consumption. Refer to the Fick equation discussed above if you are not sure about this statement.
Increase in endurance performance. Increase in maximum minute ventilation.
Multiple Choice
One result of developing cardiovascular fitness is to a) decrease stroke volume b) decrease resting heart rate c) decrease blood volume d) decrease maximum breathing capacity e) increase haemoglobin concentration