Improvement Operation of Interconnected Power System · Improvement Operation of Interconnected...
17
Journal of Babylon University/Engineering Sciences/ No.(5)/ Vol.(25): 2017 1593 Improvement Operation of Interconnected Power System Hayder Jasim Kareem Department of electrical techniques, Al- mussaib Technical Institute, Al-Furat Al-Awast Technical University [email protected] Abstract This paper contains a design of transmission lines, transformers and appropriate compensators for a 31-bus interconnected power system. It identifies a new pattern used to improve voltage stability and exposes several key issues that had remained as research challenges in this area. Preliminary data such as bus data, load schedule, standard transformer sizes, line distances and information associated to transmission line including type of conductors and towers has been discussed. Reorganizing the conductors of transmission lines using parallel transformers and utilizing appropriate compensators are some techniques to improve the capacity of network in order to satisfy the assigned load with a good quality of power and increase the stability and reliability of the network. Different power flows has been run accordingly to every changes in the network by using Power World Simulator software (PWS) and used the Full-Newton method power flow. Matlab software has been used to calculate the values of the line inductance and line capacitance. Keywords: Transmission Line, Parallel Transformers, Compensators, Stability. Nomenclature: GMD = Geometric Mean Distance or (D), d is the distance between the centre of adjacent conductor D AB , D BC , D AC = is the geometric distance between conductors a, b and c GMR = Geometric Mean Radius or (D S ), d is the distance between two conductors in the group. D SA , D SB , D SC = is the distance between two conductors of the same phase. L= the inductance of each phase mH/Km XL= the inductive reactance km per phase for the line B = capacitive susceptance per phase in mho per meter for the line. r A , r B , r C = is the radius of a conductor in the group 1. Introduction A salient option in upgrading transmission systems instead of constructing new overhead lines due to the increasing demand is to examine the possible capacity on present sites and to use the maximum capacity of existing transmission systems. The reason is that the lead-times and costs are less than constructing new lines. In this design we tried to use more capacity of the lines by utilizing appropriate compensators
Transcript of Improvement Operation of Interconnected Power System · Improvement Operation of Interconnected...

Journal of Babylon University/Engineering Sciences/ No.(5)/ Vol.(25): 2017
1593
Improvement Operation of Interconnected Power System
Hayder Jasim Kareem
Department of electrical techniques, Al- mussaib Technical Institute, Al-Furat Al-Awast
Technical University
Abstract This paper contains a design of transmission lines, transformers and appropriate compensators for a
31-bus interconnected power system. It identifies a new pattern used to improve voltage stability and
exposes several key issues that had remained as research challenges in this area. Preliminary data such as
bus data, load schedule, standard transformer sizes, line distances and information associated to
transmission line including type of conductors and towers has been discussed. Reorganizing the conductors
of transmission lines using parallel transformers and utilizing appropriate compensators are some
techniques to improve the capacity of network in order to satisfy the assigned load with a good quality of
power and increase the stability and reliability of the network. Different power flows has been run
accordingly to every changes in the network by using Power World Simulator software (PWS) and used the
Full-Newton method power flow. Matlab software has been used to calculate the values of the line
inductance and line capacitance.
Keywords: Transmission Line, Parallel Transformers, Compensators, Stability.
Nomenclature:
GMD = Geometric Mean Distance or (D), d is the distance between the centre of adjacent
conductor
DAB, DBC, DAC = is the geometric distance between conductors a, b and c
GMR = Geometric Mean Radius or (DS), d is the distance between two conductors in the
group.
DSA, DSB , DSC = is the distance between two conductors of the same phase.
L= the inductance of each phase mH/Km
XL= the inductive reactance km per phase for the line
B = capacitive susceptance per phase in mho per meter for the line.
rA, rB, rC = is the radius of a conductor in the group
1. Introduction A salient option in upgrading transmission systems instead of constructing new
overhead lines due to the increasing demand is to examine the possible capacity on
present sites and to use the maximum capacity of existing transmission systems. The
reason is that the lead-times and costs are less than constructing new lines. In this design
we tried to use more capacity of the lines by utilizing appropriate compensators

Journal of Babylon University/Engineering Sciences/ No.(5)/ Vol.(25): 2017
1594
(capacitors) and using parallel transformers to prevent transformers from overload
situation (Pundir et.al., 2016). Using capacitors and other compensators in power systems
have many advantages, capacitors especially as compensators are fast acting, reliable and
have low maintenance in comparison to the other types of compensators (Ibe, et.al., 2013;
Tyll et.al., 2009). Low losses in these equipment’s also play big role on increasing use of
them in the network. They also increase the capacity and transient stability of the network
(Murugan et.al., 2013). A particular interest is taken to the development of control
schemes to avoid so-called voltage collapse, which can result in widespread outages. In
order to achieve efficient and reliable operation of power system, the control of voltage
and reactive power should satisfy the following objectives (Ibe et.al., 2013):
1. Voltages at all terminals of all equipment in the system are within acceptable limits
2. System stability is enhanced to maximize utilization of the transmission system
3. The reactive power flow is minimized so as to reduce R I2 and X I
2 losses.
Then the types of towers and conductors have been chosen through the calculations
and among the given values (Preeti et.al., 2013). Calculation of line characteristics has
been done with MATLAB software, after calculating the initial values we need the first
power flow results to investigate the possible design problems. Initial results show that
we need to rearrange different parts of the network. In the first step of this design the
network has been divided into two parts Area1 and Area2 and the last step adding
compensators to the model by using bundle arrangement, adding parallel transformers
and executing the last simulation, it can be seen that the system works in a stable
situation.
2. Overall Single Line Diagram Interconnected electrical power system contains 31- buses have been introduced for
transmission line for upgrading analysis. Single line diagram shows electrical system
configuration figure 1 and all component and their parameters have illustrated in this
system.
Figure 1: Overall single line diagram.
This system consists of transmission line in three voltage levels which are 69KV,
115KV, and 230KV. Four generators are installed as power generation in bus No. 03, 12,
17, and 30. Several transformers have been used for voltage step down / up of
transmission lines and load substations supply in verity of MVAR.

Journal of Babylon University/Engineering Sciences/ No.(5)/ Vol.(25): 2017
1595
3. Given Data 3.1. Generators data
Four generators have been used in this system, maximum output power and
related power factor has been given in table 1. As it shown bus no. 30 has been
considered as Slack bus in the power system (Parul et.al., 2013). Slack bus is a P.U (per
unit) bus in the power system, this connected to a generator and has constant voltage
value.
Table 1: Generators Specification
3.2. Transmission lines data
Transmission lines are divided into the three voltage level. H-Frame, single circuit,
and double circuit steel towers have been suggested for tower configuration of
transmission line in 69Kv figure (2-a), the same configuration also introduced for 115Kv
transmission line tower configurations figure (2-b), finally double circuit steel tower has
been suggested for 230Kv tower configurations of overhead transmission lines figure (2-
c) (Appendix ,2011; Al Salameh et.al., 2010). Several conductors and their parameters
were given to choose the best and minimum acceptable conductor size in several voltage
levels (Al Salameh et.al., 2010; Molburg et.al., 2007). Table 2 illustrates aluminum
conductor parameter [Catalogue as a guide to standards of Aluminium Rods Bare
Conductors And Cables].
Figure 2: Tower configuration of transmission line.

Journal of Babylon University/Engineering Sciences/ No.(5)/ Vol.(25): 2017
1596
Table 2: Electrical Characteristics of Bare Aluminum Conductors, Steel-Reinforced
(ACSR)
3.3. Transformers data
There are three voltage levels in the interconnected power system which is required
to connect. In order to step voltage down/up, 3 sizes of transformer have been given
which are chosen based on transformer loads. Minimum and maximum impedance limit
in percentage of each transformer with related efficiency in appropriate voltage is the data
which is shown in table 3 (Russell et.al., 2000; Transformer Handbook from ABB Co.,
Switzerland]. Each transformer is equipped with ON-load tap changer with 2.5% steps
for voltage regulating from 0.90 to 1.10 in the high voltage side of transformer.
Table 3: Transformer Specification
3.4. Equations and Parameter Calculations
All parameters like transformer and transmission lines, current and voltage must
fulfill margins based on the power system criteria which is between 0.95 ≤ V ≤ 1.05 P.U
(Zhang et.al., 2004). Some actions must be taken to change all equipment which is out of
the margin.
According to the design criteria several configuration for transmission have been
given to choose the best solution for transmission lines. First step has been taken to
choose 69Kv transmission line configurations and the simplest configuration (horizontal
configuration). Based on this configuration, all the transmission line parameters have
been calculated like Gradient Mean Distance (GMD) and Gradient Mean Radius (GMR)
to calculate the line reactance and capacitance is depending on types of conductors (Al
Salameh et.al., 2010). Equations (1-16) were prepared for the mentioned calculation.
Equations 3 6 use for GMD calculation:

Journal of Babylon University/Engineering Sciences/ No.(5)/ Vol.(25): 2017
1597
Equations 7 - 10 use GMR calculation:
A 69Kv transmission line has been examined by hand calculation and other lines
have been calculated by Matlab software due to the calculation accuracy. Therefore
calculation for two circuit transmission line between buses 7 and 24 has been done at
230Kv voltage level (Al Salameh et.al., 2010). Based on conductors table 2 the last
conductor has been used for calculation and appropriate data has been entered to formula
(1-16). Table 4 shows parameters of all transmission line have been entered in three
voltage levels.

Journal of Babylon University/Engineering Sciences/ No.(5)/ Vol.(25): 2017
1598
Table 4: Transmission line parameters
Available data for generators such as active power and power factor, we need also
reactive power for this system. Equation below was used for calculation of generator’s
reactive power (Hamidreza et.al., 2012):
By using equation above we can calculate the sample reactive power for one of the
generators. For instance, generator 1 works at maximum active power 300MW at power
factor 0.95 then maximum reactive power of generator would be:
Given data related to transformer has nominal power, percentage of impedance, tap
changer rating and their efficiency. Power World software version 14 needs also series
reactance as same as series resistance, by taking some information from manufacturer
catalogue and specifications and also using given data we can get required information

Journal of Babylon University/Engineering Sciences/ No.(5)/ Vol.(25): 2017
1599
for calculation [Cahiers Techniques], also load loss of the transformer can be used in this
case. Equations (18 and 19) show relation between load loss of transformer and series
resistance.
By calculating equations above, real parameters of resistance could be calculated
based on equations below and series reactance could be calculated by equations 3 and 4.
4. Input Data
According to load specification and single line configuration, transformer size,
transmission conductor and tower configuration have been chosen, initial data has been
entered in (PWS). Based on given data, generators parameters have been entered,
required data for generators are maximum, minimum, nominal, active and reactive power.
Other generator parameter data has been entered based on hand calculation same as
generator 1. It must be mentioned that maximum output active and reactive power equals
to nominal generator name plate. Also after finding transmission line parameters option
by eqs. (1-16) and transformer parameter by eqs. (18-21), now could be filled in program.
5. Simulation Results 5.1. Preliminary design
After sketching the sample plan of paper in Power World software version 14 the
first run was done and the output files obtained, figure 3 illustrates the designed network.
As it can be seen some transmission lines and transformers are out of rating and so need
to be correct, in addition the majority of the bus bars are out of desired voltage as
mentioned before the voltages must be in the range of 0.9 to 1.05P.U. The data in table 5
depicts the status of the generators, nominal output MW/ MVAR and the limits of these
amounts. For instance, the generator on bus 3 can deliver 300 MW active power plus 145
MVAR reactive power. However, the minimum margin to generate the reactive power is
in the range of -145 to 145 MVAR. The minimum active power output is set for 50% of
the generator nominal output because the efficiency of the generator under this ratio is
determined that is not economic in this design. In addition, bus 30 was selected as a slack
bus; generator connected to this bus manages the extra required or excess energy in the
power system.

Journal of Babylon University/Engineering Sciences/ No.(5)/ Vol.(25): 2017
1600
Table 5: Generator records before revision
Figure 3: The single-line diagram with determined areas in preliminary design

Journal of Babylon University/Engineering Sciences/ No.(5)/ Vol.(25): 2017
1601
Table 6 presents the summary of the load in this system; the interconnected buses,
area, and the active and reactive power of the loads are collected in this table Similarly,
bus records summary in table 7 shows the nominal, per unit, and the angle of the voltage
of each bus.
Table 6: Load summary records of the plan
Table 7: Area summary records before revision
As it is known; the large interconnected systems usually have a number of control
areas, each control area responsible for the operation of a particular part of the system,
often a single control area corresponds to a single owner (such as an investor-owned
utility), but it is usual for a single control area to have more than one owner (McCalley,
2000). Control areas are connected to neighboring areas through tie lines. A tie line is a
transmission line that has one end in one control area and the other end in another one
(Suman et.al., 2016). Lines between buses 8-11 and 15-26 shown these system tie
lines.The total amount of power flowing out of a control area is the algebraic sum of the
power flowing out on all the area’s tie lines (Sundaram et.al., 2011). Each control area is
responsible for procuring enough power to meet its own load plus losses. The control area

Journal of Babylon University/Engineering Sciences/ No.(5)/ Vol.(25): 2017
1602
can get this power either by generating it itself or by buying it from another area, this
ability to buy and sell power (i.e., power transactions) is one of the principal advantages
of interconnected operation (Casazza et.al., 2003). Therefore, for this plan, two areas
were considered and the required setting for this purposed area was done the dotted are as
in figure 4 show the selected area 1 and 2. Table 8 presents the status of the
circumstances of each area, in area 1&2 the Automatic Generating Control (AGC) and
Automatic Control Energy (ACE) are activated also the summary of the generating,
consumption and the losses as well.
Table 8: The records of the bus bars in the first running
In the relation of the amount of losses and lack of co-ordination to comply with the
demand, the primary design is not acceptable However, it is anticipated by compensation
and clearing the mismatches in transmission lines and transformers in the first simulation,
the design is to be satisfactory. Therefore, the compensation is needed to prepare the
acceptable quality of power and voltage delivery.
5.2. Revision Steps
Correcting the mismatches in preliminary design need to increase the size of
conductors in transmission lines and changing the tower arraignments in some cases. In
addition, according to the overload percentages in transformers some of them must be re-

Journal of Babylon University/Engineering Sciences/ No.(5)/ Vol.(25): 2017
1603
rated. However, in relation to the limitation of selecting transformers among 2 to 50
MVA capacities some considerations must be attended.
5.2.1. Transmission Line
Table 4 presents the transmission lines parameters that must be re-rated; line MVA
is shown in light red rows and the transformers is highlighted in light green. For more
stability, the lines that are close to over capacity also regarded. For instance, the
interconnected transmission line between buses 3-4 faced to 174% overload. In
accordance with the conductor list and with regarding to the percentage of overcapacity
and overdesign for future development the conductors were changed to 900A [Catalogue
as a guide to standards of Aluminium Rods Bare Conductors And Cables]. Therefore, by
the help of Matlab, the value of the line inductance and line capacitance are obtained and
set in table 9. In the first step transmission lines capacities are increased by using the
higher current conductors without changing the tower configuration. This measure was
helpful for lines between buses 3-4, 8-19, by two –step and 19-21 by four-step increasing.
However, in lines between busses 8-11, 11-12 the single circuit replaced by double circuit
by increasing two and four step respectively. Moreover, the 2-conductor bundle circuit
with the previous current is used for the line between buses 15-17, also line between 13-
14, 4-8, 8-29 and 29-30 were corrected by the changes spontaneously. After calculation
and setting the new values in Power World software the new layout is obtained in figure
4, it illustrates the new single line. Meanwhile, the new record of the line and transformer
capacity is presented in table 9.

Journal of Babylon University/Engineering Sciences/ No.(5)/ Vol.(25): 2017
1604
Table 9: Transmission lines and transformer’s capacity after revision
5.2.2. Transformers
In accordance with the limitation for selecting the transformers more than 50 MVA
capacity, the number of transformers should increase. Therefore, added transformers must
work in parallel case and the parallel considerations should be regarded. In addition, the
transformers that worked less than about 50% of their nominal capacities were placed by
down size transformers. For example, the transformer between buses 23-24 is working in
4.7% of capacity by referring to table 4 then; it should be replaced with a 10MVA
transformer. After replacement the used capacity is changed to 25.3% this measure is
taken for transformers between 14-15, 16-18, 24-23, and 27-28 buses, the objects are
marked in light blue color in table 9. For temporary overloads and more stability,
transforms are designed to work in 80% of their nominal capacity.
5.2.3. Voltage Regulation
According to the table 4 the buses which faced to under voltage should be
improved. The usual device for this case is capacitors. In Power World both variable and
fixed capacitors are available [Power World Simulator Version 14, 2007]. Then, by
setting the control regulation settings in desired value and adjust the control mode he
buses are equipped by capacitors. On the base of table 10, on the buses 7, 8,10,14,22, and
31 the continuous shunt capacitors were embedded, and the fixed shunt reactor to control

Journal of Babylon University/Engineering Sciences/ No.(5)/ Vol.(25): 2017
1605
the generator on bus 17. By this reactor the MVAR absorption of generator is decrease
and generator works on steady-state. The continuous mode only adds the -71.5 MVAR to
grid that causes the transformer between buses 14-15 encounters to overload and the
capacity of Generator on bus 17 changes to -135 MVAR.
Table 10: The compensation records after installing the shunt switches
6. Final Design Records
In this section the final design and records are presented and discussed. Figure 4
illustrates the single line layout of the plan after revision. Table 11 presents the generator
records after revision.
Table 11: Generator records after revision
Table 12 depicts the area records after revision according to the figure 4 area one
receives 352.58 MW from area two. If the connected generator to bus 12 suddenly trips
then other generators in area one feed the loads in area two.
Table 12: Area records after revision
Journal of Babylon University/Engineering Sciences/ No.(5)/ Vol.(25): 2017
1606
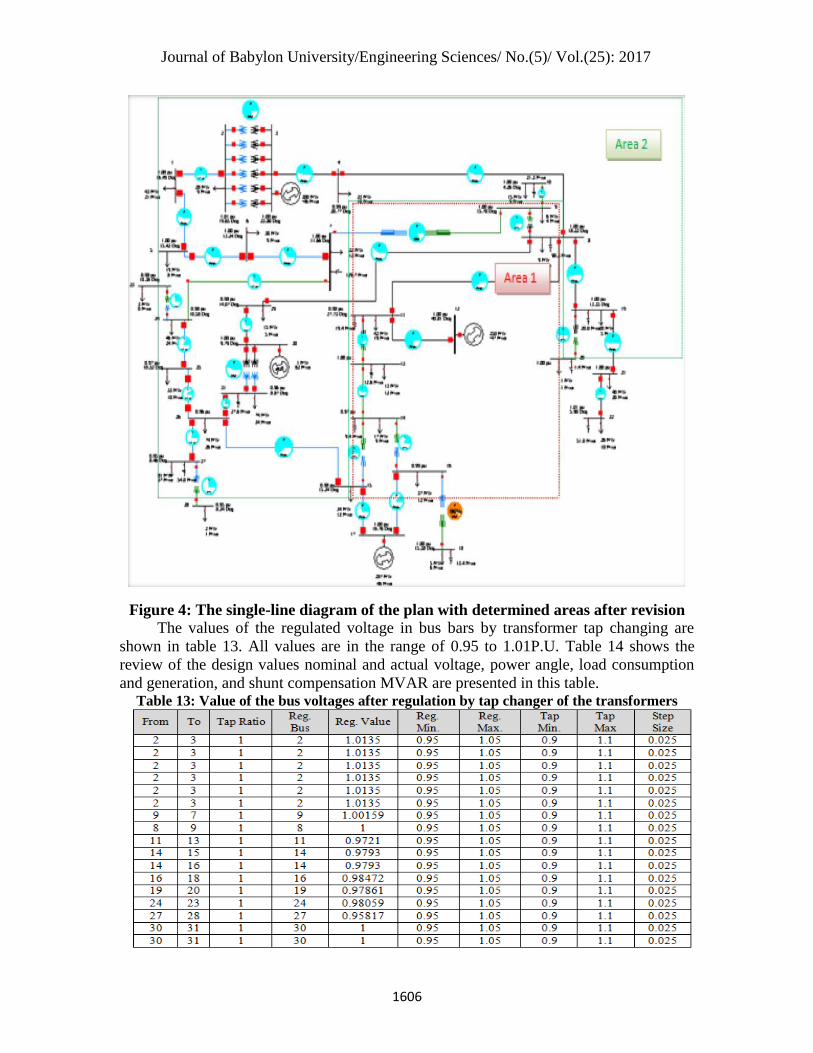
Figure 4: The single-line diagram of the plan with determined areas after revision
The values of the regulated voltage in bus bars by transformer tap changing are
shown in table 13. All values are in the range of 0.95 to 1.01P.U. Table 14 shows the
review of the design values nominal and actual voltage, power angle, load consumption
and generation, and shunt compensation MVAR are presented in this table. Table 13: Value of the bus voltages after regulation by tap changer of the transformers

Journal of Babylon University/Engineering Sciences/ No.(5)/ Vol.(25): 2017
1607
Table 14: The summary of grid values after revision
7. Conclusion
Generally, reactive power compensation requires a perfect system analysis for the
optimization of compensator sizes and their location in the power system. Accomplishing
this goal takes numerous steps in the specified 31 interconnected bus; taking which into
account the system has been simulated for examining the best power system
configuration. The first step is to look for component data and parameters, for instance by
choosing the transformer size and finding its parameter from famous manufacturer like
Siemens and ABB, transformer data as per unit of resistance and reactance have been
collected and analysed. Another step was associated to the transmission line parameter
which required the transmission configuration and all parameters have been calculated
after transmission line obtaining. By simulation and strengthen of design were discussed
for improvements. Established on calculation tables, voltage of some busses failed to
fulfill design criteria margins and also some transformers and transmission lines were
faced with overload. In this cases minimum size of capacitors bank and also reactor have
been chosen and several parallel transformer, two circuits, and bundle transmission line
have been introduced with required changes in the critical points also used of tap
changing transformer in terms of automatic voltage regulator (AVR) is to varies the tap

Journal of Babylon University/Engineering Sciences/ No.(5)/ Vol.(25): 2017
1608
until meet the specification of certain requirement to regulate bus voltage. In addition
interconnected power system which was divided into the two areas works properly with
these modification and desired responses have been taken from last simulation which was
reported on detailed simulation result at index after which a precise and accurate system
is presented in the end.
8. References: Al Salameh, M. S., & Hassouna, M. A. S. ,2010. Arranging overhead power
transmission line conductors using swarm intelligence technique to
minimize electromagnetic fields. Progress in electromagnetics research B, 26,
.213-236
Appendix B—Transmission Line and Substation Components Prepared by: Idaho
Power Company, available in: :
http://www.boardmantohemingway.com/documents/2011_Nov_POD_AppB.pdf.
Cahiers Techniques no. 158 Calculation of short-circuit currents collection is part of
the Schneider Electric’s "Collection technique", available in:
http://eduscol.education.fr/sti/sites/eduscol.education.fr.sti/files/ressources/techniqu
es/3 57/3357-ect158.pdf.
Casazza, J., Casazza, J., & Delea, F. ,2003. Understanding electric power systems: an
overview of the technology and the marketplace (Vol. 13). John Wiley &
Sons.
Catalogue as a guide to standards of Aluminium Rods Bare Conductors And Cables,
available
in::http://www.ucable.com.my/images/products/UC%20Aluminium%20Catalogue.
pdf.
Hamidreza, Z. & Javad, N., 2012. Method for Reactive Power Cost Allocation Among
Participants in a Restructured Market. interdisciplinary journal of
contemporary research in business, 4(5), 314-329.
Ibe, O. G., & Onyema, A. I. ,2013. Concepts of reactive power control and voltage
stability methods in power system network. IOSR Journal of Computer
Engineering, 11(2), 15-25.
McCalley, J. D. Introduction to System Operation, Optimization, and Control.
Molburg, J. C., Kavicky, J. A., & Picel, K. C.,2007. The Design Construction, and
Operation of Long-distance High-voltage Electricity Transmission
Technologies Argonne National Laboratory, Environmental Science
Division. ANL/EVSTM/08-4.
Murugan, K. A., & Prabu, R. R. ,2013. Improvement of Transient Stability of Power
System using Solid State Circuit Breaker. American Journal of Applied
Sciences 10 (6), 563- 569.
Parul, A. U., & Satish, K. J. ,2013. Voltage stability analysis through reactive power
reserve and voltage sensitivity factor. Journal of Scientific and Engineering
Research, 2014,1(2), 76-84.
Power World Simulator Version 14 User’s Guide – 26 September, 2007 (217) 384
6330, available in: https://www.powerworld.com/knowledge-base-term/tutorial
Preeti, C., & Mohan, K. J. ,2013. Analysis of Transmission Towers with Different
Configurations. Jordan Journal of Civil Engineering, 7(4), 450-460.

Journal of Babylon University/Engineering Sciences/ No.(5)/ Vol.(25): 2017
1609
Pundir, A., & Yadav, G. D. ,2016. Comparison of Different types of Compensating
Devices in Power System. International Research Journal of Engineering
and Technology (IRJET), 3(11), 420-426.
Russell, M. J., Engineer, C. E., & Power Lines, P. O.,2000, October. The impact of
mains impedance on power quality. In Power Quality. Originally Presented at
Power Quality 2000 (Boston, MA), 1 (203) 757-790.
Suman, S. K., & Giri, V. K. ,2016. Automatic Generation Control of Multi-Area
Power System- A ANN Approach. International Journal of Scientific
Research in Computer Science, Engineering and Information Technology
IJSRCSEIT, 2(5) 115 119.
Sundaram, V. S., & Jayabarathi, T. ,2011. An Intelegent Self Tune Adptive Based PID
Controllers using Load Frequency Control in Multi Area Power System.
International Journal on Power System Optimization and Control, 3 (1), 39–
46.
Transformer Handbook from ABB Co., SWITZERLAND, available in:
http://new.abb.com/docs/librariesprovider27/default-document
library/abb_transfo_handbk.pdf?sfvrsn=2
Tyll, H. K., & Schettle, F. ,2009, March. Historical overview on dynamic reactive
power compensation solutions from the begin of AC power transmission
towards present applications. In Power Systems Conference and Exposition,
2009. PSCE'09. IEEE/PES (pp. 1-7). IEEE.
Zhang, J., Dobson, I., & Alvarado, F. L. ,2004. Quantifying transmission reliability
margin. International Journal of Electrical Power & Energy Systems, 26(9), 697-
.702