
Dynamic Study Model for the Interconnected Power … documents/Regional...Dynamic Study Model for...
6
Dynamic Study Model for the Interconnected Power System of Continental Europe in Different Simulation Tools Anatoli Semerow, Sebastian H¨ ohn, Matthias Luther, Chair of Electrical Energy Systems, University of Erlangen-Nuremberg, Germany, [email protected] Walter Sattinger, Hans Abildgaard Agustin Diaz Garcia, Giorgio Giannuzzi, Subgroup System Protection and Dynamics (SP&D), 2 ENTSO-E, Belgium, [email protected] Abstract—This paper describes the development process of the Dynamic Study Model (DSM) for the synchronously intercon- nected power system of Continental Europe in different simula- tion tools 1 . The model was developed by the European Network of Transmission System Operators for Electricity (ENTSO-E) working group System Protection and Dynamics 2 and the Uni- versity of Erlangen-Nuremberg within a collaboration. The paper describes the DSM scope, input and necessary steps towards an adequate basis for the novel dynamic data enhancement process by means of standard dynamic models for generation units and allocation criteria. Through a parameter variation process the DSM has been successively tuned to match a frequency measurement of a system event with respect to system inertia, frequency containment reserve and one of the typical oscillation modes within Continental Europe. Finally, the DSM behavior has been verified by means of previous experience from operation. Index Terms—Dynamic Study Model, Power System Stability Studies, Standard Dynamic Models, Frequency Containment Reserves, Inter-Area Oscillation Modes. I. I NTRODUCTION Power systems have to be enhanced continuously in or- der to ensure a secure and sustainable electricity supply as a backbone of the modern technology society. Therefore, transmission system operators, which are responsible for the transmission layer of the power system, provide long-term development plans (e.g. in [1]) in order to have a common basis among each other and to inform third parties about their intentions. The plans are based on forecasts concerning changes in generation structure, electricity markets, transmis- sion projects etc. The operation and planning of the transmission system is supported by stability studies done by each TSO with different simulation tools to evaluate the dynamic impact of future 1 The Dynamic Study Models in different simulation tools are available for stability studies from ENTSO-E on request: https://www.entsoe.eu/publications/system-operations-reports/continental- europe/Initial-Dynamic-Model/Pages/default.aspx 2 The subgroup SP&D within ENTSO-E RGCE is convened by Hans Abildgaard (Energinet.dk), Giorgio Giannuzzi (Terna) and Walter Sattinger (Swissgrid). At the time the project was initialized, Eckhard Grebe (Amprion) was the convenor of the working group. changes. These kind of stability studies need to be done with consistent detailed models of generators. Depending on na- tional regulations the generator owner has different obligations to provide his TSO with data for this modelling task. Apart from that, the results of this kind of studies normally are affected by the modeling of the neighboring countries. At this point, data acquisition, reliability and confidentiality issues may arise. Therefore, new concepts for modeling of power system dynamics are needed to cope with these challenges. Fig. 1: Interconnected network of ENTSO-E 3 This paper presents a novel approach for dynamic modeling of large power systems with the focus on the synchronously interconnected power system of Continental Europe as shown in figure 1 as part of the entire ENTSO-E network. The concept and the development process of the Dynamic Study Model can also be applied to other power systems. 3 Map for 2013, provisioned by ENTSO-E (http://www.entsoe.eu)
Transcript of Dynamic Study Model for the Interconnected Power … documents/Regional...Dynamic Study Model for...

Dynamic Study Model for the InterconnectedPower System of Continental Europe in
Different Simulation ToolsAnatoli Semerow, Sebastian Hohn,
Matthias Luther,Chair of Electrical Energy Systems,
University of Erlangen-Nuremberg, Germany,[email protected]
Walter Sattinger, Hans AbildgaardAgustin Diaz Garcia, Giorgio Giannuzzi,
Subgroup System Protection and Dynamics (SP&D),2
ENTSO-E, Belgium,[email protected]
Abstract—This paper describes the development process of theDynamic Study Model (DSM) for the synchronously intercon-nected power system of Continental Europe in different simula-tion tools1. The model was developed by the European Networkof Transmission System Operators for Electricity (ENTSO-E)working group System Protection and Dynamics2 and the Uni-versity of Erlangen-Nuremberg within a collaboration. The paperdescribes the DSM scope, input and necessary steps towards anadequate basis for the novel dynamic data enhancement processby means of standard dynamic models for generation unitsand allocation criteria. Through a parameter variation processthe DSM has been successively tuned to match a frequencymeasurement of a system event with respect to system inertia,frequency containment reserve and one of the typical oscillationmodes within Continental Europe. Finally, the DSM behavior hasbeen verified by means of previous experience from operation.
Index Terms—Dynamic Study Model, Power System StabilityStudies, Standard Dynamic Models, Frequency ContainmentReserves, Inter-Area Oscillation Modes.
I. INTRODUCTION
Power systems have to be enhanced continuously in or-der to ensure a secure and sustainable electricity supply asa backbone of the modern technology society. Therefore,transmission system operators, which are responsible for thetransmission layer of the power system, provide long-termdevelopment plans (e.g. in [1]) in order to have a commonbasis among each other and to inform third parties abouttheir intentions. The plans are based on forecasts concerningchanges in generation structure, electricity markets, transmis-sion projects etc.
The operation and planning of the transmission system issupported by stability studies done by each TSO with differentsimulation tools to evaluate the dynamic impact of future
1The Dynamic Study Models in different simulation toolsare available for stability studies from ENTSO-E on request:https://www.entsoe.eu/publications/system-operations-reports/continental-europe/Initial-Dynamic-Model/Pages/default.aspx
2The subgroup SP&D within ENTSO-E RGCE is convened by HansAbildgaard (Energinet.dk), Giorgio Giannuzzi (Terna) and Walter Sattinger(Swissgrid). At the time the project was initialized, Eckhard Grebe (Amprion)was the convenor of the working group.
changes. These kind of stability studies need to be done withconsistent detailed models of generators. Depending on na-tional regulations the generator owner has different obligationsto provide his TSO with data for this modelling task. Apartfrom that, the results of this kind of studies normally areaffected by the modeling of the neighboring countries. At thispoint, data acquisition, reliability and confidentiality issuesmay arise. Therefore, new concepts for modeling of powersystem dynamics are needed to cope with these challenges.
Fig. 1: Interconnected network of ENTSO-E3
This paper presents a novel approach for dynamic modelingof large power systems with the focus on the synchronouslyinterconnected power system of Continental Europe as shownin figure 1 as part of the entire ENTSO-E network. Theconcept and the development process of the Dynamic StudyModel can also be applied to other power systems.
3Map for 2013, provisioned by ENTSO-E (http://www.entsoe.eu)
The main target was to set up a robust, transparent andeasily transferable dynamic model to reproduce the sameresults in different simulation tools. For this purpose a noveldevelopment process was applied. It includes a verified loadflow model, standard dynamic models for generation units andthe appropriate control as well as a parameter variation processto approach the model for the real system behavior. Since theEast-West oscillation mode is typically the dominant one inthe synchronously interconnected power system of ContinentalEurope [2], which implies the interaction of the two mostdistant borders and which is the one with the most oscillatoryenergy, the Dynamic Study Model is primarily tuned to aplant outage, which excites such a power oscillation. Oncethis oscillation mode is tuned, it has been checked that theother known modes are also reproduced by the system model.
II. SCOPE OF THE DYNAMIC STUDY MODEL
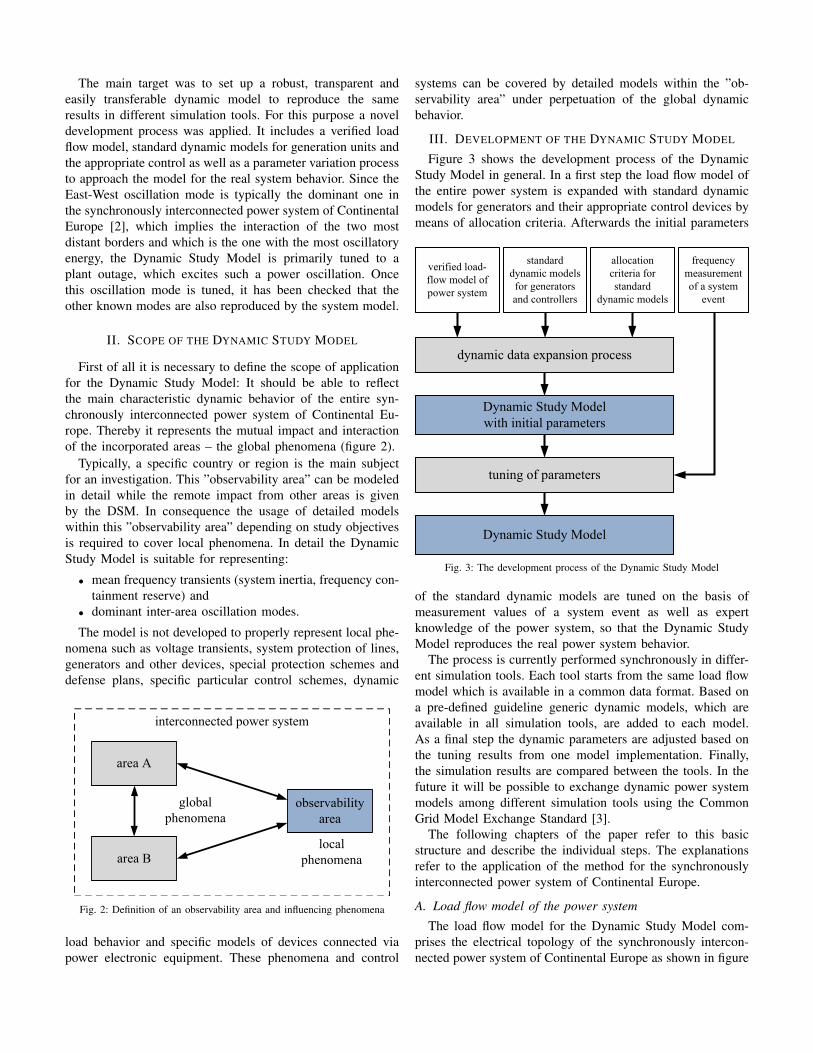
First of all it is necessary to define the scope of applicationfor the Dynamic Study Model: It should be able to reflectthe main characteristic dynamic behavior of the entire syn-chronously interconnected power system of Continental Eu-rope. Thereby it represents the mutual impact and interactionof the incorporated areas – the global phenomena (figure 2).
Typically, a specific country or region is the main subjectfor an investigation. This ”observability area” can be modeledin detail while the remote impact from other areas is givenby the DSM. In consequence the usage of detailed modelswithin this ”observability area” depending on study objectivesis required to cover local phenomena. In detail the DynamicStudy Model is suitable for representing:
• mean frequency transients (system inertia, frequency con-tainment reserve) and
• dominant inter-area oscillation modes.
The model is not developed to properly represent local phe-nomena such as voltage transients, system protection of lines,generators and other devices, special protection schemes anddefense plans, specific particular control schemes, dynamic
Fig. 2: Definition of an observability area and influencing phenomena
load behavior and specific models of devices connected viapower electronic equipment. These phenomena and control
systems can be covered by detailed models within the ”ob-servability area” under perpetuation of the global dynamicbehavior.
III. DEVELOPMENT OF THE DYNAMIC STUDY MODEL
Figure 3 shows the development process of the DynamicStudy Model in general. In a first step the load flow model ofthe entire power system is expanded with standard dynamicmodels for generators and their appropriate control devices bymeans of allocation criteria. Afterwards the initial parameters
Fig. 3: The development process of the Dynamic Study Model
of the standard dynamic models are tuned on the basis ofmeasurement values of a system event as well as expertknowledge of the power system, so that the Dynamic StudyModel reproduces the real power system behavior.
The process is currently performed synchronously in differ-ent simulation tools. Each tool starts from the same load flowmodel which is available in a common data format. Based ona pre-defined guideline generic dynamic models, which areavailable in all simulation tools, are added to each model.As a final step the dynamic parameters are adjusted based onthe tuning results from one model implementation. Finally,the simulation results are compared between the tools. In thefuture it will be possible to exchange dynamic power systemmodels among different simulation tools using the CommonGrid Model Exchange Standard [3].
The following chapters of the paper refer to this basicstructure and describe the individual steps. The explanationsrefer to the application of the method for the synchronouslyinterconnected power system of Continental Europe.
A. Load flow model of the power system
The load flow model for the Dynamic Study Model com-prises the electrical topology of the synchronously intercon-nected power system of Continental Europe as shown in figure
1 and steady-state data for all generation units for a peak-demand case in 2020. The model information basis descendsfrom the Network Modeling Database (NMD) of ENTSO-Eand serves as the planning basis. The use of this databasehas the advantages of an agreement between TSOs for systemplanning purposes and detailed information about generationmix and corresponding energy sources for steady-state anal-ysis. The model is structured into 26 areas corresponding tothe included countries. It comprises 21,382 nodes and 10,829generators.
In order to prepare the model for dynamic studies andavoid sharing confidential information, the load flow modelunderwent some adaptation steps, before it was distributed:
• adding of step-up transformers for generators directlyconnected to the transmission level,
• reduction of parallel lines,• reduction of coupled busbars,• aggregation of multiple loads at busbars and• aggregation of multiple generation blocks at busbars.All these adjustments were done without influencing the
load flow result.
B. Standard dynamic models
The representation of system dynamics is accomplished byusing standard dynamic models for synchronous machines andtheir control devices. Table I gives an overview and referencesfor the used standard dynamic models for all generation units,which fulfill the defined criteria. The choice is based onprinciples with the aim to use commonly-used models withsimple structure in order to facilitate the tuning process. Thetable also specifies the variable model parameters, that will betuned at a later step to get the desired system behavior.
TABLE I: Standard dynamic models for generation units and controllers
element model variable parameter for tuning
synchronousmachine (SM)
standard model,as defined in [4]
acceleration time constant TAfor complete rotating units
governor (GOV) TGOV1,as defined in [5]
droop R,time constants TG2, TG3
automatic voltageregulator (AVR)
SEXS,as defined in [6]
gain K
power systemstabilizer (PSS)
PSS2A,as defined in [7]
gain KS1
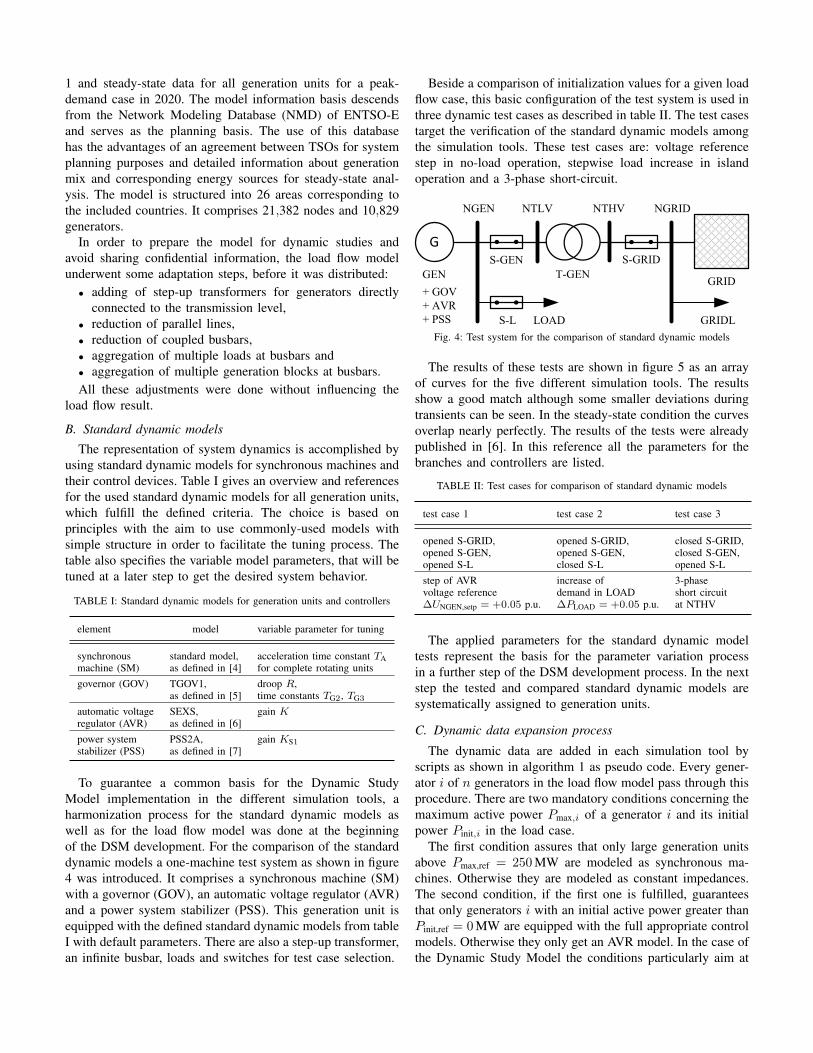
To guarantee a common basis for the Dynamic StudyModel implementation in the different simulation tools, aharmonization process for the standard dynamic models aswell as for the load flow model was done at the beginningof the DSM development. For the comparison of the standarddynamic models a one-machine test system as shown in figure4 was introduced. It comprises a synchronous machine (SM)with a governor (GOV), an automatic voltage regulator (AVR)and a power system stabilizer (PSS). This generation unit isequipped with the defined standard dynamic models from tableI with default parameters. There are also a step-up transformer,an infinite busbar, loads and switches for test case selection.
Beside a comparison of initialization values for a given loadflow case, this basic configuration of the test system is used inthree dynamic test cases as described in table II. The test casestarget the verification of the standard dynamic models amongthe simulation tools. These test cases are: voltage referencestep in no-load operation, stepwise load increase in islandoperation and a 3-phase short-circuit.
Fig. 4: Test system for the comparison of standard dynamic models
The results of these tests are shown in figure 5 as an arrayof curves for the five different simulation tools. The resultsshow a good match although some smaller deviations duringtransients can be seen. In the steady-state condition the curvesoverlap nearly perfectly. The results of the tests were alreadypublished in [6]. In this reference all the parameters for thebranches and controllers are listed.
TABLE II: Test cases for comparison of standard dynamic models
test case 1 test case 2 test case 3
opened S-GRID,opened S-GEN,opened S-L
opened S-GRID,opened S-GEN,closed S-L
closed S-GRID,closed S-GEN,opened S-L
step of AVRvoltage reference∆UNGEN,setp = +0.05 p.u.
increase ofdemand in LOAD∆PLOAD = +0.05 p.u.
3-phaseshort circuitat NTHV
The applied parameters for the standard dynamic modeltests represent the basis for the parameter variation processin a further step of the DSM development process. In the nextstep the tested and compared standard dynamic models aresystematically assigned to generation units.
C. Dynamic data expansion process
The dynamic data are added in each simulation tool byscripts as shown in algorithm 1 as pseudo code. Every gener-ator i of n generators in the load flow model pass through thisprocedure. There are two mandatory conditions concerning themaximum active power Pmax,i of a generator i and its initialpower Pinit,i in the load case.
The first condition assures that only large generation unitsabove Pmax,ref = 250 MW are modeled as synchronous ma-chines. Otherwise they are modeled as constant impedances.The second condition, if the first one is fulfilled, guaranteesthat only generators i with an initial active power greater thanPinit,ref = 0 MW are equipped with the full appropriate controlmodels. Otherwise they only get an AVR model. In the case ofthe Dynamic Study Model the conditions particularly aim at

Fig. 5: Selected results from the comparison of standard dynamic models in three test cases
Algorithm 1 Dynamic data expansion process1: for generator i = 1→ n do2: if Pmax,i ≥ Pmax,ref then3: assign synchronous machine model to generator i4: if Pinit,i ≥ Pinit,ref then5: assign GOV, AVR and PSS models to generator i6: else7: assign AVR model to generator i8: end if9: else
10: model generator i as negative constant impedance11: end if12: end for
generators with negative initial power, to avoid deviations asa result of standard model choice for the governor for thermalpower plants. For instance it concerns pumped-storage hydropower plants or synchronous condensers. The machines wereidentified by maximum active power rather than rated apparentpower due to insufficient information in the load flow model.
Executing this procedure, one obtains 1,013 synchronousmachine models out of 10,829 generators in the load flowmodel. Just 17 of them have only an AVR model. Theremained 9,816 generators are modeled as negative constantimpedances. The obtained Dynamic Study Model with initial
parameters for the standard dynamic models was checked forcontrol limitation violations and stable time-domain simulationwithout any system event. In the next step, the parameters aretuned to influence the model behavior.
D. Parameter variation process
For the next step the parameters from the tests of thestandard dynamic models were used as default [6]. The pa-rameter variation process is merely done in one simulationtool. Therefore frequency measurements of the Wide AreaMeasurement System (WAMS) for a plant outage in Spainin October 2011 are used, see the black curves in figure 6.The outage was a loss of active power P ≈ 1 GW. Themeasured steady-state frequency deviation is ∆f ≈ 26 mHz,before the frequency restoration reserves are activated. Thegradient of the frequency immediately after the outage variesup to the maximum of |∆f/∆t| ≈ 63 mHz/sec in WesternEurope and |∆f/∆t| ≈ 9 mHz/sec in Central Europe. Theelectromechanical wave propagation from Western to EasternEurope needs approximately two seconds. In consequence ofthe outage electromechanical oscillations occur in the East-West axis of the power system with Central Europe as non-swinging area.
The parameter variation process is primarily based on a
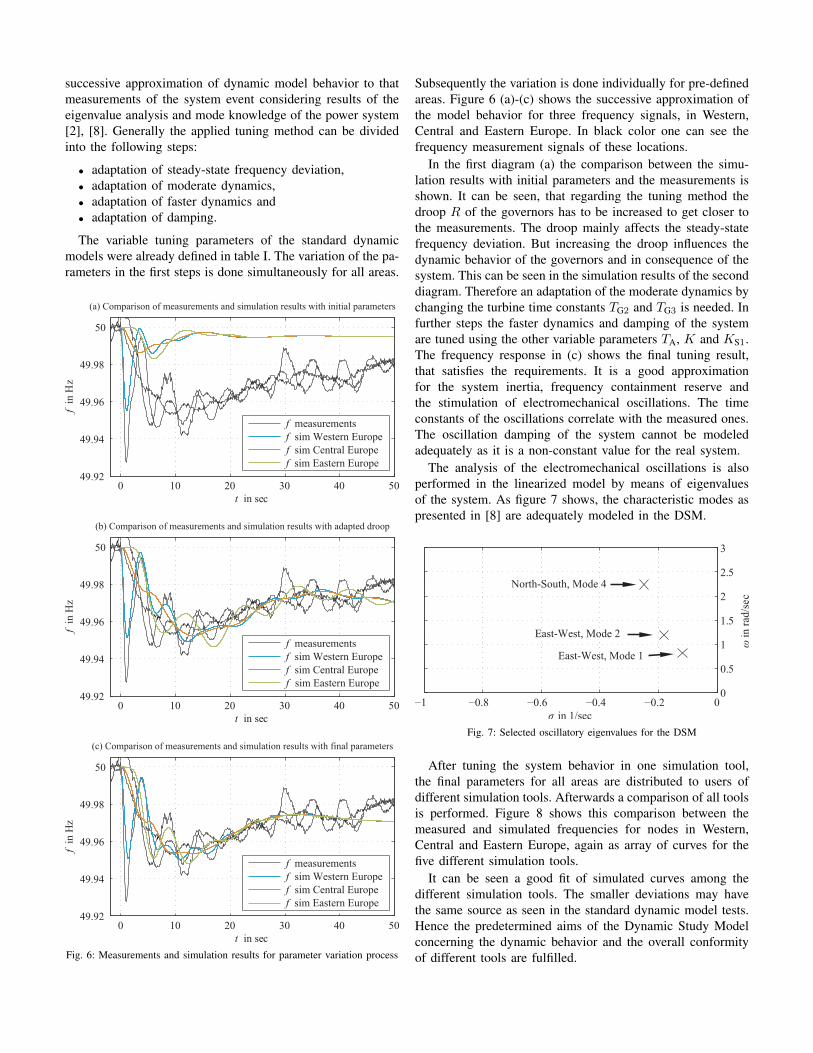
successive approximation of dynamic model behavior to thatmeasurements of the system event considering results of theeigenvalue analysis and mode knowledge of the power system[2], [8]. Generally the applied tuning method can be dividedinto the following steps:
• adaptation of steady-state frequency deviation,• adaptation of moderate dynamics,• adaptation of faster dynamics and• adaptation of damping.
The variable tuning parameters of the standard dynamicmodels were already defined in table I. The variation of the pa-rameters in the first steps is done simultaneously for all areas.
Fig. 6: Measurements and simulation results for parameter variation process
Subsequently the variation is done individually for pre-definedareas. Figure 6 (a)-(c) shows the successive approximation ofthe model behavior for three frequency signals, in Western,Central and Eastern Europe. In black color one can see thefrequency measurement signals of these locations.
In the first diagram (a) the comparison between the simu-lation results with initial parameters and the measurements isshown. It can be seen, that regarding the tuning method thedroop R of the governors has to be increased to get closer tothe measurements. The droop mainly affects the steady-statefrequency deviation. But increasing the droop influences thedynamic behavior of the governors and in consequence of thesystem. This can be seen in the simulation results of the seconddiagram. Therefore an adaptation of the moderate dynamics bychanging the turbine time constants TG2 and TG3 is needed. Infurther steps the faster dynamics and damping of the systemare tuned using the other variable parameters TA, K and KS1.The frequency response in (c) shows the final tuning result,that satisfies the requirements. It is a good approximationfor the system inertia, frequency containment reserve andthe stimulation of electromechanical oscillations. The timeconstants of the oscillations correlate with the measured ones.The oscillation damping of the system cannot be modeledadequately as it is a non-constant value for the real system.
The analysis of the electromechanical oscillations is alsoperformed in the linearized model by means of eigenvaluesof the system. As figure 7 shows, the characteristic modes aspresented in [8] are adequately modeled in the DSM.
Fig. 7: Selected oscillatory eigenvalues for the DSM
After tuning the system behavior in one simulation tool,the final parameters for all areas are distributed to users ofdifferent simulation tools. Afterwards a comparison of all toolsis performed. Figure 8 shows this comparison between themeasured and simulated frequencies for nodes in Western,Central and Eastern Europe, again as array of curves for thefive different simulation tools.
It can be seen a good fit of simulated curves among thedifferent simulation tools. The smaller deviations may havethe same source as seen in the standard dynamic model tests.Hence the predetermined aims of the Dynamic Study Modelconcerning the dynamic behavior and the overall conformityof different tools are fulfilled.
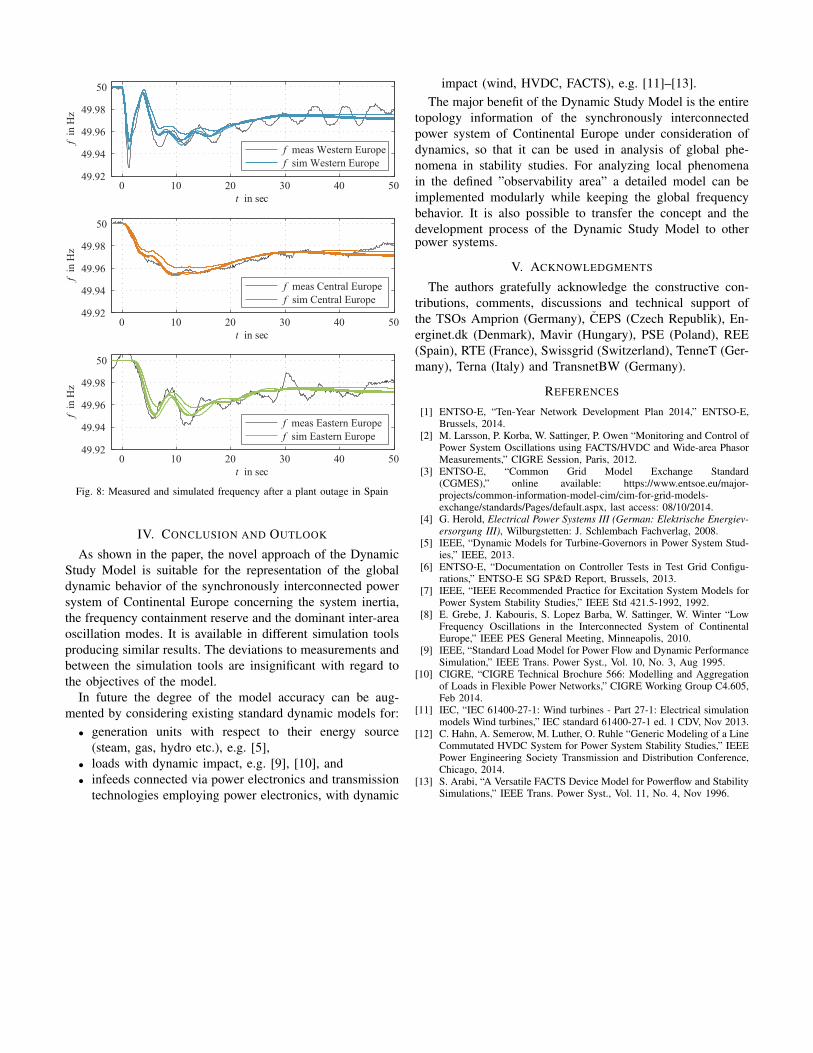
Fig. 8: Measured and simulated frequency after a plant outage in Spain
IV. CONCLUSION AND OUTLOOK
As shown in the paper, the novel approach of the DynamicStudy Model is suitable for the representation of the globaldynamic behavior of the synchronously interconnected powersystem of Continental Europe concerning the system inertia,the frequency containment reserve and the dominant inter-areaoscillation modes. It is available in different simulation toolsproducing similar results. The deviations to measurements andbetween the simulation tools are insignificant with regard tothe objectives of the model.
In future the degree of the model accuracy can be aug-mented by considering existing standard dynamic models for:
• generation units with respect to their energy source(steam, gas, hydro etc.), e.g. [5],
• loads with dynamic impact, e.g. [9], [10], and• infeeds connected via power electronics and transmission
technologies employing power electronics, with dynamic
impact (wind, HVDC, FACTS), e.g. [11]–[13].The major benefit of the Dynamic Study Model is the entire
topology information of the synchronously interconnectedpower system of Continental Europe under consideration ofdynamics, so that it can be used in analysis of global phe-nomena in stability studies. For analyzing local phenomenain the defined ”observability area” a detailed model can beimplemented modularly while keeping the global frequencybehavior. It is also possible to transfer the concept and thedevelopment process of the Dynamic Study Model to otherpower systems.
V. ACKNOWLEDGMENTS
The authors gratefully acknowledge the constructive con-tributions, comments, discussions and technical support ofthe TSOs Amprion (Germany), CEPS (Czech Republik), En-erginet.dk (Denmark), Mavir (Hungary), PSE (Poland), REE(Spain), RTE (France), Swissgrid (Switzerland), TenneT (Ger-many), Terna (Italy) and TransnetBW (Germany).
REFERENCES
[1] ENTSO-E, “Ten-Year Network Development Plan 2014,” ENTSO-E,Brussels, 2014.
[2] M. Larsson, P. Korba, W. Sattinger, P. Owen “Monitoring and Control ofPower System Oscillations using FACTS/HVDC and Wide-area PhasorMeasurements,” CIGRE Session, Paris, 2012.
[3] ENTSO-E, “Common Grid Model Exchange Standard(CGMES),” online available: https://www.entsoe.eu/major-projects/common-information-model-cim/cim-for-grid-models-exchange/standards/Pages/default.aspx, last access: 08/10/2014.
[4] G. Herold, Electrical Power Systems III (German: Elektrische Energiev-ersorgung III), Wilburgstetten: J. Schlembach Fachverlag, 2008.
[5] IEEE, “Dynamic Models for Turbine-Governors in Power System Stud-ies,” IEEE, 2013.
[6] ENTSO-E, “Documentation on Controller Tests in Test Grid Configu-rations,” ENTSO-E SG SP&D Report, Brussels, 2013.
[7] IEEE, “IEEE Recommended Practice for Excitation System Models forPower System Stability Studies,” IEEE Std 421.5-1992, 1992.
[8] E. Grebe, J. Kabouris, S. Lopez Barba, W. Sattinger, W. Winter “LowFrequency Oscillations in the Interconnected System of ContinentalEurope,” IEEE PES General Meeting, Minneapolis, 2010.
[9] IEEE, “Standard Load Model for Power Flow and Dynamic PerformanceSimulation,” IEEE Trans. Power Syst., Vol. 10, No. 3, Aug 1995.
[10] CIGRE, “CIGRE Technical Brochure 566: Modelling and Aggregationof Loads in Flexible Power Networks,” CIGRE Working Group C4.605,Feb 2014.
[11] IEC, “IEC 61400-27-1: Wind turbines - Part 27-1: Electrical simulationmodels Wind turbines,” IEC standard 61400-27-1 ed. 1 CDV, Nov 2013.
[12] C. Hahn, A. Semerow, M. Luther, O. Ruhle “Generic Modeling of a LineCommutated HVDC System for Power System Stability Studies,” IEEEPower Engineering Society Transmission and Distribution Conference,Chicago, 2014.
[13] S. Arabi, “A Versatile FACTS Device Model for Powerflow and StabilitySimulations,” IEEE Trans. Power Syst., Vol. 11, No. 4, Nov 1996.