Improvement of Drinking Water Properties Using a Novel ...
12
MANSOURA ENGINEERING JOURNAL, (MEJ), VOL. 45, ISSUE 3, SEPTEMBER 2020 C: 21 Mansoura University Faculty of Engineering Mansoura Engineering Journal Received: (10 October, 2019) - revised: (19 January, 2020) - accepted: (31 August, 2020) Hisham Kh. El-Etriby, Assoc. Prof., Head of Public Works Dept., Faculty of Engineering, Mansoura University. E-mail: [email protected] Mohamed Gar-Alalm, Dr., Lecturer at Public Works Department, Faculty of Engineering, Mansoura University. E-mail: [email protected] Mohammed Hussein, M.Sc. Student, Public Works Department, Faculty of Engineering, Mansoura University. E-mail: [email protected] I. INTRODUCTION HE existence of turbidity and natural organic matter (NOM) in drinking water has received considerable attention in recent decades because it can lead to odor, color and taste problems in addition to formation of disinfection by-products (DBPs) [1]. NOM is widely detected in most water sources such as lakes and rivers [2]. It has been reported that most of NOM in surface and ground water is in the form of humic and fulvic acids [3]. Humic and fulvic acids react with chlorine-based materials during the disinfection process and hence DBPs are formed. DBPs are carcinogenic Improvement of Drinking Water Properties Using a Novel Biosorbent Material Mohammed Hussein, Mohamed Gar-Alalm and Hisham Kh. El-Etriby KEYWORDS: Coagulation, Adsorption, Modified flaxseed husk (MFH), Flaxseed husk ash (FHA), Turbidity, Natural organic matter, Iron kinetics Isotherm Abstract— In the present study, a new material has been discovered in the world of natural coagulants and adsorbents to improve drinking water properties. Flaxseed husk was used as a natural coagulant and adsorbent to remove turbidity, natural organic matter and iron from underground water for several wells in Al-Jouf region in the north of the Kingdom of Saudi Arabia. To remove turbidity and natural organic matter, modified flaxseed husk (MFH) was prepared by addition of aluminum sulfate (AS) to flaxseed husk (FH) after removing mucilage and oil. The characterization of FH shows high specific surface area (125.18 m2/g) with average pore diameter of 26.28 μm. Moreover, FTIR spectra analysis indicated existence of large number of amino groups and another functional group indicated that FH efficiency about removal of turbidity and natural organic matter. The optimum ratio MFH:AS for removal was (80%:40%). Batch experiments were performed as function of process parameters such as slow mixing time, FH dosage and Initial NOM. The removal of turbidity and natural organic matter (NOM) by modified flaxseed husk (MFH) were investigated using a FH dosage of 40 mg.l-1 and 10 mg.l-1 AS which attained a removal efficiency of 98.0 % for turbidity and 99.3 % for NOM at the highest NOM concentration. Also, reduce the iron concentration in drinking water by flaxseed husk ash (FHA) which prepared by burning flaxseed husk at certain temperature was investigated. Batch experiments were performed as function of process parameters such as FHA type, contact time (CT), FHA dosage and initial Fe concentration. The FHA showed a high removal of Fe3+ from aqueous solution. The maximum Fe removal was 90% at FHA200, FHA dose 0.75 g/l and contact time 45 min, The pH value from 7 to 7.8 and the temperature value from 20 to 24 0C. The adsorption equilibrium has been studied by the pseudo first order kinetics model, the pseudo second order kinetics model, Langmuir and Freundlich isotherm, all these models demonstrated the adsorption efficiency of the adsorbent surface behaved in a favorable manner for Fe adsorption. T
Transcript of Improvement of Drinking Water Properties Using a Novel ...

MANSOURA ENGINEERING JOURNAL, (MEJ), VOL. 45, ISSUE 3, SEPTEMBER 2020 C: 21
Mansoura University
Faculty of Engineering
Mansoura Engineering Journal
Received: (10 October, 2019) - revised: (19 January, 2020) - accepted:
(31 August, 2020)
Hisham Kh. El-Etriby, Assoc. Prof., Head of Public Works Dept., Faculty of Engineering, Mansoura University. E-mail: [email protected]
Mohamed Gar-Alalm, Dr., Lecturer at Public Works Department, Faculty
of Engineering, Mansoura University. E-mail: [email protected] Mohammed Hussein, M.Sc. Student, Public Works Department, Faculty of
Engineering, Mansoura University. E-mail: [email protected]
I. INTRODUCTION
HE existence of turbidity and natural organic matter
(NOM) in drinking water has received considerable
attention in recent decades because it can lead to
odor, color and taste problems in addition to formation of
disinfection by-products (DBPs) [1]. NOM is widely detected
in most water sources such as lakes and rivers [2]. It has been
reported that most of NOM in surface and ground water is in
the form of humic and fulvic acids [3]. Humic and fulvic acids
react with chlorine-based materials during the disinfection
process and hence DBPs are formed. DBPs are carcinogenic
Improvement of Drinking Water Properties
Using a Novel Biosorbent Material
Mohammed Hussein, Mohamed Gar-Alalm and Hisham Kh. El-Etriby
KEYWORDS:
Coagulation,
Adsorption,
Modified flaxseed husk
(MFH),
Flaxseed husk ash
(FHA),
Turbidity,
Natural organic matter,
Iron
kinetics
Isotherm
Abstract— In the present study, a new material has been discovered in the world of
natural coagulants and adsorbents to improve drinking water properties. Flaxseed
husk was used as a natural coagulant and adsorbent to remove turbidity, natural
organic matter and iron from underground water for several wells in Al-Jouf region in
the north of the Kingdom of Saudi Arabia. To remove turbidity and natural organic
matter, modified flaxseed husk (MFH) was prepared by addition of aluminum sulfate
(AS) to flaxseed husk (FH) after removing mucilage and oil. The characterization of FH
shows high specific surface area (125.18 m2/g) with average pore diameter of 26.28 μm.
Moreover, FTIR spectra analysis indicated existence of large number of amino groups
and another functional group indicated that FH efficiency about removal of turbidity
and natural organic matter. The optimum ratio MFH:AS for removal was (80%:40%).
Batch experiments were performed as function of process parameters such as slow
mixing time, FH dosage and Initial NOM. The removal of turbidity and natural organic
matter (NOM) by modified flaxseed husk (MFH) were investigated using a FH dosage
of 40 mg.l-1 and 10 mg.l-1 AS which attained a removal efficiency of 98.0 % for
turbidity and 99.3 % for NOM at the highest NOM concentration. Also, reduce the iron
concentration in drinking water by flaxseed husk ash (FHA) which prepared by
burning flaxseed husk at certain temperature was investigated. Batch experiments were
performed as function of process parameters such as FHA type, contact time (CT),
FHA dosage and initial Fe concentration. The FHA showed a high removal of Fe3+
from aqueous solution. The maximum Fe removal was 90% at FHA200, FHA dose 0.75
g/l and contact time 45 min, The pH value from 7 to 7.8 and the temperature value
from 20 to 24 0C. The adsorption equilibrium has been studied by the pseudo first
order kinetics model, the pseudo second order kinetics model, Langmuir and
Freundlich isotherm, all these models demonstrated the adsorption efficiency of the
adsorbent surface behaved in a favorable manner for Fe adsorption .
T

C: 22 MOHAMMED HUSSEIN, MOHAMED GAR-ALALM AND HISHAM KH. EL-ETRIBY
and cause many health and environmental problems to human
and aquatic life [4,5].
Chemical coagulation using aluminum sulphate followed
by sedimentation and filtration is the most prevalent sequence
in water treatment plants. These basic processes are efficient
for the removal of colloidal or suspended particles, but the
removal of NOM is limited [6]. Some researches have
addressed improving the coagulation process to remove
turbidity and NOM by adjusting the pH of the water and
increasing the amount of coagulant, but the high amount of
chemical addition was a concern [7]. Lieknes et al. (2004)
investigated the micro-filtration by metal membranes as a post
process after coagulation for NOM removal [8]. However, the
cost of micro-filtration was not considered.
Many researchers have used the adsorption by activated
carbon and advanced oxidation processes for removing or
degradation of different organics from water [9–12]. While,
other researchers have developed low cost adsorbent materials
that prepared from agricultural residues such as wheat straw
[13], rice husk [14], peanut hull, coconut husk [15], black
gram husk [16], Sawdust [17], sugarcane bagasse [14], banana
pith [18], and pine grape stalk [16].
Globally, surface water is the main source of water in the
world by up to 73 percent, followed by groundwater by up to
18 percent. While indirect sources represent the remaining
fraction of less than 9 percent [19]. The majority of freshwater
is already underground, represented by soil moisture and
aquifers. Humans can use both ground and surface water.
Groundwater accounts for 19.3 percent of the world's human
consumption [20]. While in some countries such as Saudi
Arabia, groundwater represents 40% of drinking water after
seawater desalination, which represents the highest percentage
[21,22].
Underground water contains mineral substances. The
presence of these minerals in groundwater varies from place to
another depending on the nature of the soil and the depth of the
aquifers extracted from it. Some of these minerals are iron.
Some of these subterranean sources contain iron ions with
values in excess of what is allowed in drinking water or human
use [23]. There is a need for the emergence of many ways to
remove the minerals in this water, including: Sedimentation or
precipitation processes, ion exchange, membrane techniques,
biological methods, electrochemical processes as well as
adsorption [24]. The threshold values for iron are set by the
Saudi Arabian government regulation according to Gulf
Standard Specification for unbottled drinking water No.
149 / 2000 is 0.3 mg.l-1 which specifying the requirements on
water for human consumption and the quality of water for
human consumption and match with United States
Environmental Protection Agency (EPA) [25-27], while the
requirements of the Standardization Organization of the Gulf
Cooperation Council states that the health value of iron in
bottled water is zero [27,28]. Iron occurs in the binary form or
occurs as single ions (Fe2+) when it is in a dissolved form, but
mainly as Fe (OH)3 in undissolved forms. It can also be
occurred bound to humic substances in a colloid form. The
form in which iron is occurred and its composition in nature
depends on water temperature, pH value, hydrolysis, the
oxygen concentration in the aqueous solution (probability of
oxidation or not), the solubility of iron compounds in water
and iron binding to organic compounds or non-binding [29].
According to the EPA, the presence of iron ions at high
levels in water carries bacteria into stomach, causing severe
damage during digesting including fatigue, weight loss,
stomach problems, nausea, vomiting and joint pain. Advanced
symptoms include hemochromatosis which can lead to liver,
heart and pancreatic damage, as well as diabetes [30]. In water
supply system, iron (II) ion is oxidized to higher forms and the
result of this oxidation leads to the formation of hydroxide
suspensions causing water discoloration and undesirable
turbidity. In well water, when Fe(II) occurs at concentrations
up to be more specific milligrams per liter in anaerobic
groundwater, color change or turbidity does not occur in the
water when pumped directly from a well, but this develops
overtime to produce color and turbidity in distribution pipe
system at iron level above 0.05-0.1 mg.l-1 [31].
One of the damages caused by the association of bacteria
with iron in the distribution pipes over time causes the growth
of bacteria and a large change in the water smell. This causes
the formation of a thin layer coating the inside pipes. Iron is at
the point of consumption, in washing machines and boilers
oxidized to the triple state when conditions are favorable in the
presence of oxygen [29-31]. All of the previous problems
cause a reduction in the cross-section of water flow in pipes,
corrosion and deterioration of water quality. This leads to
failure of operation of water supply systems [29].
In this paper, first: Chemically modified flaxseed husk
(MFH) was used for drinking water treatment. MFH was
prepared by addition of aluminum sulfate to flaxseed husk
(FH) after removing the mucilage and oil. The removal of
turbidity and NOM by coagulation and adsorption using MFH
was deeply investigated. Second: Reduce the concentration of
iron in drinking water by flaxseed husk ash (FHA) prepared by
burning flaxseed husk at certain temperature to achieve the
specifications in accordance with the specifications of the Gulf
Cooperation Council Water No. 149 / 2000. The study was
conducted on a group of wells for drinking water in several
fields in Al-Jowf region in the north of Saudi Arabia. The by-
product of the flaxseed husk ash after removing oil was used
as an absorbent material for the iron element. However, it was
found that the measurements of manganese ratios in the
studied wells are 0.1 mg. l-1, i.e. within the permissible range
according to the World Health Organization, which specified
that manganese should not exceed 5 mg per liter.

MANSOURA ENGINEERING JOURNAL, (MEJ), VOL. 45, ISSUE 3, SEPTEMBER 2020 C: 23
II. Materials and methods
A. Materials and raw water
Flaxseed was purchased from a local market and stored at
room temperature, the by-product which is the result of
pressing flaxseed from an Oil refinery in Jeddah city, Saudi
Arabia. (Al2(SO4)3.16H2O, n-hexane, Whatman filter paper
grad 1 and NaHCO3 were purchased from SOMAT-CO, El-
Riyadh City. The raw water was collected from different wells
in Skaka, Al Jowf, Saudi Arabia. The characteristics of raw
water are illustrated in Table 1. All the experiments were
conducted without prior modifications of samples.
TABLE.1
PHYSICOCHEMICAL CHARACTERISTICS OF RAW WATER.
Temperature ◦C pH Turbidity
(NTU) UV254(cm 1)
20 - 24 7.0 - 7.8 4.0 - 9.5 0.05 - 0.44
Fe (mg. l-1) T.D.S (mg. l-1)
Mn mg. l-1 Conductivity
(μs.cm−1)
0.13 - 1.72 975 - 989 0.1 1400 - 1408
B. Apparatuses and instruments
Stirrer 1: AGIMATIC AD-C magnetic Stirrer, Stirrer 2:
ARE Heating magnetic Stirrer VELP scientific, Refrigerator
Deodorizer SAMSUNG, Blender GEEPAS, Whatman filter
paper grad 1 and Packers of different sizes from 200 ml to 1
liter. Digit heat JP Selecta serial 0494926 was used to burn
samples. HACH SENSION3 pH meter was used to measure
pH. Ultra-meter П 6P MYRON L company was used to
measure Conductivity (μs.cm-1), T.D.S (mg. l-1) and
Temperature (0C). Analytical Balance GR-120 MODEL A&D
company was used to determine weight, 2100 P turbidimeter
HACH company was used to measure turbidity (NTU). The
bandgap of synthesized MFH was determined by using
Spectrophotometer DR 5000 HACH company. A Brunauer-
Emmett-Teller (BET) analysis was performed to determine the
surface area and pore size for flaxseed husk (FH), which is
done using the automatic Belsorp-max device using liquid
adsorption N2 at a temperature of 77 K (-196.15 ° C). Fourier
transform infrared spectrometry (FTIR) was used to determine
the functional group. On A PerkinElmer "Spectrum BX"
spectrometer in the range of 4000-400 cm-1 was used KBr
pellets for sample preparation.
III. Extraction and Experimental procedure
In this section, the process of the preparation modified
flaxseed husk (MFH) from raw flaxseed was illustrated,
including the removing of mucilage and oil and improving the
flaxseed husk characteristic by blending it with aluminum
sulphate (AS). The preparation of the flaxseed husk ash (FHA)
by burning flaxseed husk at certain temperatures
(75,100,150,200 ° C). and experimental procedures which
were used to remove turbidity, natural organic matter and iron
were illustrated.
A. Preparation of modified flaxseed husk (MFH)
1) Remove mucilage and oil from seeds
To remove the flaxseed mucilage, first, 50 milligrams of
flaxseed were weighed and washed with distilled water to
remove dust. Then, half a mole (0.5 M) of sodium bicarbonate
Na HCO3 (1:8 w/v, 40 ° C) was put in a half-liter baker. Then,
the washed seeds were added to the sodium bicarbonate. After
that, the baker was placed on the magnetic stirrer, set at 40 ° C
for an hour, then filtered with a cloth filter to separate the
liquid (mucilage) for disposal. The solid which is left (flaxseed
without mucilage) washed several times with distilled water,
dried and kept at room temperature (24 ° C) for 24 hours. This
new product (flaxseed without mucilage) is called (F-OUT m)
[32].
After removing the mucilage, the oil was removed from the
flaxseed (F-OUT M) by the following steps: The seeds (F-
OUT M) were crushed by a laboratory mill and the n-hexane
was added in a 1-liter baker (1:5, w/v) and placed on the
magnetic stirrer for 6 hours. Regeneration of n-hexane every 2
hours by paper filters. After final filtration the resulting
material is left in the dark to dry at room temperature exposed
to air and then stored at 4 ° C and called (FH-OUT M, O) [32].
To determine the functional group, FITR Fourier transform
infrared spectrometry test performed on A PerkinElmer
"Spectrum BX" spectrometer in the range of 4000-400 cm-1
using KBr pellets for sample preparation was used. A
Brunauer-Emmett-Teller (BET) analysis was performed to
determine the surface area and pore size for flaxseed husk
(FH), which was done using the automatic Belsorp-max device
using liquid adsorption N2 at a temperature of 77 K [32].
2) Modification of (FH-OUT M, O)
(FH-OUT M, O) was then used with aluminum sulphate
(AS), as a mixed coagulant with a certain dosage. 25 mg. l-1
for (AS) and 50 mg. l-1 for (FH-OUT M, O) were used as a
coagulants dosages specified on (Table 2) [33-35].
Operational conditions of the coagulation / flocculation and
sedimentation process was used in seed correlation (FH-OUT
M, O) and alum coagulants were presented in (Table 3). After
the coagulation / flocculation and sedimentation process was
completed, samples which were taken 3 cm under the water
surface was filtered by Whatman paper filter grad 1 (pore size
of 0.6 μm). Finally, the residual turbidity and NOM were
quantified by 2100 P Turbidimeter Hach Co, and
spectrophotometer DR 5000 Hach Co respectively [36,37].

C: 24 MOHAMMED HUSSEIN, MOHAMED GAR-ALALM AND HISHAM KH. EL-ETRIBY
Fig. 1. The FTIR analysis of FH
TABLE. 2
COAGULANTS DOSAGE COMBINATION.
POINT
% Coagulant
(Al2(SO4)3.16H2O/
FH-OUTM, O)
Coagulant dosage (mg. l-1)
Al2(SO4)3.16H2O FH-OUTM, O
1 0%, 100% 0 50
2 20%, 80% 5 40
3 40%, 60% 10 30
4 60%, 40% 15 20
5 80%, 20% 20 10
6 100%, 0% 25 0
B. Experimental procedure and the analytical measurements
of (MFH)
The hybrid process including coagulation and adsorption
was carried out as follows: first: coagulation followed by
adsorption, second: adsorption followed by coagulation.
Coagulation and subsequent adsorption tests were
performed after collection of samples after sedimentation, and
then different doses of MFH were added. Adsorption followed
by coagulation experiments were executed by adding a certain
dosage of coagulants with mixing stirring similar to
coagulation experiments. Then, a sample was taken using the
same procedure [38].
1000 ml of raw water was transferred into a beaker with a
certain dosage of MFH. The process included 3 min of the
rapid mix at 350 rpm, 30 min of slow mixing at 60 rpm for
flocculation, and 30 min for settling. Adsorption experiments
were executed by mixing MFH with raw water using a
magnetic stirrer at 150 rpm for 120 min without heat.
Subsequently, MFH was removed by filtration through a what
man filter paper grad 1 (pore size of 0.6 μm) for
measurements.
TABLE.3
OPERATIONAL CONDITIONS OF COAGULATION/FLOCCULATION
AND SEDIMENTATION PROCESS FOR POINT 3,4 - RMV: RAPID
MIXING VELOCITY; RMT: RAPID MIXING TIMES; SMV: SLOW
MIXING VELOCITY; SMT: SLOW MIXING TIMES; ST:
SEDIMENTATION TIMES.
ASSAY 1 2 3 4 5 6
RMV (rpm) 200 300 350 250 300 350
RMT (min) 1 1 1 3 3 3
SMV (rpm) 60 60 60 60 60 60
SMT (min) 15 20 30 15 20 30
ST (min) 15 15 15 30 30 30
IV. Preparation of flaxseed husk ash (FHA)
A. Preparation of flaxseed husk ash (FHA)
C. The sample of by-product flaxseed oil removal was
dried in direct sunlight for one week, then washed with
distilled water, dried, ground and taken to burn at 75,100,150
and 200 °C for 2 hours.
B. Experimental procedure and the analytical measurements of
(FHA)
Adsorption experiment was carried out by agitating FHA
with raw water at the room temperature in a stirrer operating at
300 rpm for certain time at a different dose of FHA having
different concentrations of Fe. Subsequently, FHA was
removed by filtration through a Whatman filter paper grad1
(pore size of 0.6 μm) for measurements, according to [39 ,40]
with modification.
V. Results and discussion
A. Characterization of the flaxseed husk (FH)
The specific surface area of FH was 125.18 m2/g. The
average pore diameter of FH was 26.28 μm indicating
reasonable adsorption capacity [41].
Fig. 1. shows the functional groups which were done by
FTIR spectrometry test, detected by the band intensity. Ketone
and alkane groups (C-H) are at band intensity 2850 cm-1 and
2925 cm-1, and aromatic cyclic groups are at band intensity
1650 cm-1 and 1750 cm-1. The intense vibration at 1350 cm-1
gives evidence of a large number of amino groups in flaxseed
husk (FH) structure [38].
B. Characterization of the (FHA)
Fig. 2. shows the functional groups which were done by
FTIR Fourier transform infrared spectrometry analysis point
out several main peaks at 3420, 2920, 1750 and 1170 cm-1
were associated with -OH groups, -CH, C O bands and -OCH3
groups [42]. The presence of these active groups on the
surface of flax seeds indicates their participation in the
removal and absorption of iron from drinking water.

MANSOURA ENGINEERING JOURNAL, (MEJ), VOL. 45, ISSUE 3, SEPTEMBER 2020 C: 25
Fig. 2. FTIR spectra of fresh FHA200
C. Removal of Turbidity and NOM
1) Effect of different concentration of AS / FH-OUTM, O
The removal efficacies of turbidity and NOM at different
percentages of AS / FH- OUTM, O are shown in Fig. 3. The
higher percentage of AS leads to a better turbidity removal due
to the abundance of dissolved positively charged aluminum
ions which neutralize the suspended particulates and increase
the potential of agglomeration and floc formation [43]. On the
other hand, the optimal ratio of (AS/FH-OUTM, O) for NOM
removal was (40/60) achieved a removal efficiency of 81%.
The higher percentage of AS leads to smaller surface area of
coagulant/polymer which inhibit the adsorption of NOM on
FH-OUTM, O. In addition, the lower percentage of AS decreases
the efficiency of agglomeration and precipitation of suspended
particulates which reduces the NOM removal.
2)Effect of slow mixing time
The effect of slow mixing time on the removal of turbidity
and NOM is shown in Fig. 4. It is clear that increasing the
slow mixing time improved the removal of both turbidity and
NOM. This improvement was achieved because the particles
have adequate time to agglomerate and form stable flocs [44].
The maximum removal efficiency of turbidity was achieved
after about 20 min of slow mixing, and additional time did not
improve the removal of turbidity because the coagulant dose
may be consumed at this stage and additional dosage may be
required [45].
The optimum removal of NOM was achieved after 30 min of
mixing, while additional time did not significantly improve the
removal. Such a trend could be attributed to the consumption
of aluminum ions and the occupation of all active sites on FH-
OUTM, O surface [46]. Accordingly, the optimum slow mixing
time is considered 30 min in this study. The adsorption of
organic molecules may be attributed to the electrostatic
attraction forces with amino groups of flaxseed husk which
have been detected in FTIR spectra [47].
3) Effect FH-OUT M, O Dosage
Different dosages of FH-OUTM, O were tested to investigate
the optimum dosage for NOM and turbidity removal as shown
in Fig. 5. It is clear that increasing the dosage of more than 40
mg. l-1 slightly improve both turbidity and NOM removal. This
result is due to agglomeration of most of suspended
particulates and/or adsorption of dissolved organic matter on
MFH particles [48]. Accordingly, excess FH-OUTM, O amount
didn't achieve significantly efficiency improving.
4)Effect of Initial NOM
The removal efficiency of NOM at different initial
concentrations was investigated and exhibited in Fig. 6. The
removal efficiency results ranged from 98.4% to 100% using
the optimum dosage of MFH. The removal efficiency was
between 98.4 % and 100 % for initial concentration of UV254
between 0.05 to 0.18 cm-1, and between 98.4 % and 99.3 % for
Fig. 3. Removal of turbidity and NOM using different ratios of (AS / FH-
OUTM, O).
0
10
20
30
40
50
60
70
80
90
100
(0% / 100%) (20% / 80%) (40% / 60%) (60% / 40%) (80% / 20%) (100% / 0%)
Re
mo
val%
AS/FH-OUTMO
Turbidity removal % NOM removal %
Fig. 4. The effect of slow mixing time at optimal condition, initial turbidity = 9.0
NTU, initial UV254 = 0.35 cm-1, and MFH: (40% AS, 60% FH-OUTM, O).
0
10
20
30
40
50
60
70
80
90
100
0 10 20 30 40 50
% R
em
ova
l
TIME (min)
turbidity %
UV254 %
93%
81%
1750
–OH groups
–CH groups
C = O groups
–OCH3 groups
3420 2920
1170

C: 26 MOHAMMED HUSSEIN, MOHAMED GAR-ALALM AND HISHAM KH. EL-ETRIBY
Fig. 5. The effect of different FH dose, initial turbidity = 9.5 NTU, initial
UV254 = 0.4 cm-1, and MFH: (40% AS, variable FH-OUTM, O).
97.5
98.0
98.5
99.0
99.5
100.0
25 30 35 40 45 50 55
eff
icie
ncy
re
mo
val %
FH-OUTM,O dose (mg.l-1)
efficiency removal tur
efficiency removal UV254
99.3%
99.5%
98% 98%
initial concentration of UV254 between 0.19 and 0.44 cm-1.
The high removal efficiency was achieved due to the attractive
of NOM functional groups for the high surface area of MFH
which suggests a high adsorption capacity [49]. This finding
indicates that the MFH could be used for removal of high
concentration of NOM from water.
D. Removal of Iron
1)Effect of FHA different types on iron removal (Fe).
Fig. 7 and table 4. show the effectiveness of FHA150 and
FHA 200 on iron removal, which were 72% and 85%
respectively. The removal process was accomplished by
adding 250 mg of FHA with 250 ml of fresh raw water sample
which was taken from EL Taleem well, after 30 min stirrer
operating.
2)Effect of FHA200 dosage.
In order to study the effect of the burned dose on iron
removal efficiency, doses ranging from 0.1 to 1 g and the
concentration of iron in the raw water sample of the well 0.4
mg.l-1 liter were used. The results of these experiments were
represented in Fig. 8., and the different values were expressed.
From Fig. 8. several conclusions can be read. At first: the
removal efficiency was increased rapidly up to dose 0.4 g,
whereas the removal efficiency was increased slightly from
dose 0.4 g to 0.75 g until reaches a roughly constant value
begging from dose 0.75 g to 1 g.
Fig. 7. Effect different types of FHA in removal iron (Fe).
TABLE. 4
EFFECT OF FHA TYPES IN REMOVAL IRON AFTER 30 MIN, TALEEM
WELL S˳ (0.4) mg. l-1
FHA FHA 75 FHA 100 FHA150 FHA 200
Fe values (mg.l-1)
0.49 0.32 0.11 0.06
% Removal ــ %86 %72 %20 ـ
This trend was expected due to the increased number of
particles that have been absorbed with an increased dose of
FHA200 which results in more iron attached to the surface
area of FHA200. It has been observed that the largest removal
efficiency is 90% starting from the dose 0. 75 g of the burner
(FHA200). Any other FHA200 dose was added more than
0.75-0.8 gm. l-1 did not cause any significant change in
removal efficiency.
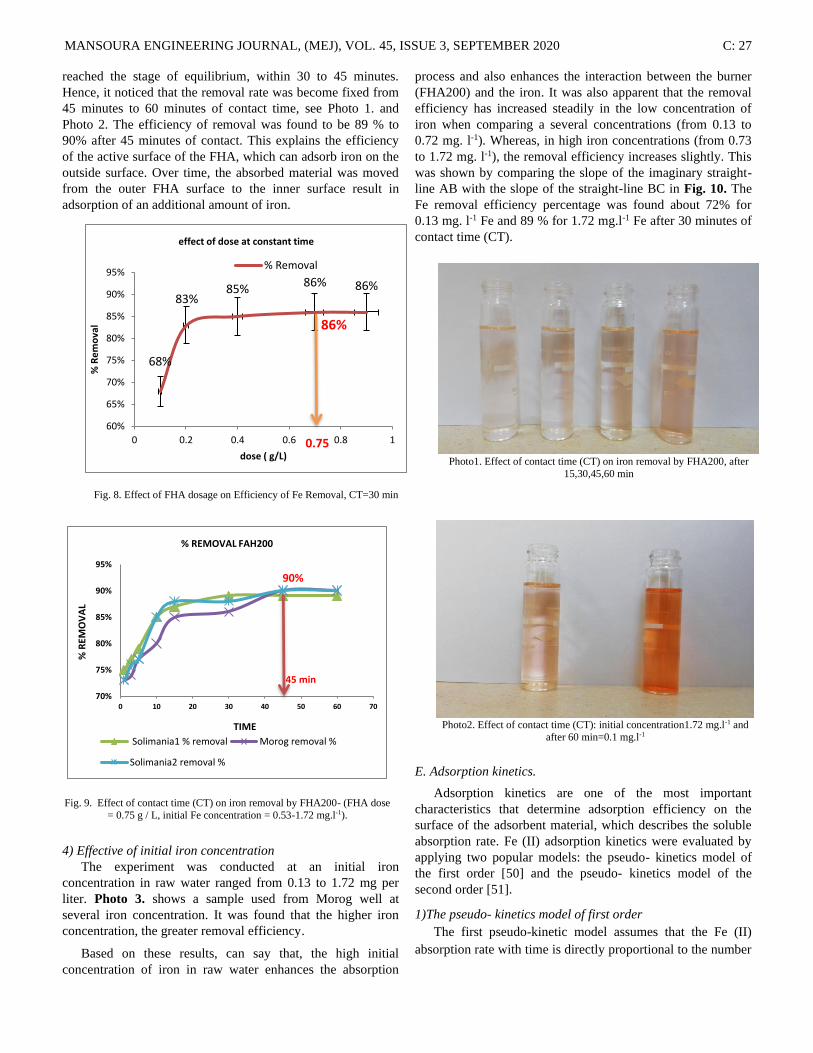
3) Effect of contact time.
The efficiency of iron removal efficiency was measured, to
samples of several concentrations which were taken from
different wells. After studying the results shown in Fig. 9.
specifically, from one minute to 60 minutes, it was founded a
several explanations, at the beginning of contact, the rate of
iron removal increased, which gradually decreased until it
Fig. 6. The effect of different concentrations at optimal condition, MFH:
(40% AS 60% FH-OUT M, O).
y = -1.8815x + 99.553
96
97
98
99
100
0.05 0.1 0.15 0.2 0.25 0.3 0.35 0.4 0.45
eff
icie
ncy
of
rem
ova
l %
Initial Conc. UV254 ( cm-1)
99.3%
98.4 %
0.19 cm-1 0.44 cm-
1
100 %
0.09 cm-1
MANSOURA ENGINEERING JOURNAL, (MEJ), VOL. 45, ISSUE 3, SEPTEMBER 2020 C: 27
Fig. 9. Effect of contact time (CT) on iron removal by FHA200- (FHA dose
= 0.75 g / L, initial Fe concentration = 0.53-1.72 mg.l-1).
70%
75%
80%
85%
90%
95%
0 10 20 30 40 50 60 70
% R
EMO
VA
L
TIME
% REMOVAL FAH200
Solimania1 % removal Morog removal %
Solimania2 removal %
90%
45 min
reached the stage of equilibrium, within 30 to 45 minutes.
Hence, it noticed that the removal rate was become fixed from
45 minutes to 60 minutes of contact time, see Photo 1. and
Photo 2. The efficiency of removal was found to be 89 % to
90% after 45 minutes of contact. This explains the efficiency
of the active surface of the FHA, which can adsorb iron on the
outside surface. Over time, the absorbed material was moved
from the outer FHA surface to the inner surface result in
adsorption of an additional amount of iron.
4) Effective of initial iron concentration
The experiment was conducted at an initial iron
concentration in raw water ranged from 0.13 to 1.72 mg per
liter. Photo 3. shows a sample used from Morog well at
several iron concentration. It was found that the higher iron
concentration, the greater removal efficiency.
Based on these results, can say that, the high initial
concentration of iron in raw water enhances the absorption
process and also enhances the interaction between the burner
(FHA200) and the iron. It was also apparent that the removal
efficiency has increased steadily in the low concentration of
iron when comparing a several concentrations (from 0.13 to
0.72 mg. l-1). Whereas, in high iron concentrations (from 0.73
to 1.72 mg. l-1), the removal efficiency increases slightly. This
was shown by comparing the slope of the imaginary straight-
line AB with the slope of the straight-line BC in Fig. 10. The
Fe removal efficiency percentage was found about 72% for
0.13 mg. l-1 Fe and 89 % for 1.72 mg.l-1 Fe after 30 minutes of
contact time (CT).
E. Adsorption kinetics.
Adsorption kinetics are one of the most important
characteristics that determine adsorption efficiency on the
surface of the adsorbent material, which describes the soluble
absorption rate. Fe (II) adsorption kinetics were evaluated by
applying two popular models: the pseudo- kinetics model of
the first order [50] and the pseudo- kinetics model of the
second order [51].
1)The pseudo- kinetics model of first order
The first pseudo-kinetic model assumes that the Fe (II)
absorption rate with time is directly proportional to the number
Fig. 8. Effect of FHA dosage on Efficiency of Fe Removal, CT=30 min
68%
83%85%
86% 86%
60%
65%
70%
75%
80%
85%
90%
95%
0 0.2 0.4 0.6 0.8 1
% R
em
ova
l
dose ( g/L)
effect of dose at constant time
% Removal
0.75
86%
Photo1. Effect of contact time (CT) on iron removal by FHA200, after
15,30,45,60 min
Photo2. Effect of contact time (CT): initial concentration1.72 mg.l-1 and
after 60 min=0.1 mg.l-1

C: 28 MOHAMMED HUSSEIN, MOHAMED GAR-ALALM AND HISHAM KH. EL-ETRIBY
of active sites available on the surface of the adsorbents. The
first pseudo-kinetic model is given to the equation as follow:
ln (qe – qt) = ln qe – k1t, (1)
Where qe and qt represent the amount of absorption (mg/g)
at equilibrium case and t (time) respectively, and k1 is the
adsorption rate constant the pseudo- kinetics model of the first
order (min-1). The k1 values can be specified empirically by ln
(qe – qt) against t.
Fig. 11 shows the linear segment of ln (qe – qt) versus the
pseudo- kinetics model of the first order for the absorption of
Fe (II) ions on the FHA. The correlation coefficients of
adsorption using FHA for the pseudo- kinetics model of the
first order (R2=0.7987) are closer to the unity.
2) The pseudo- kinetics model of second order
The pseudo- kinetics model of the second order assumes
that chemical absorption represents the phase of limiting
absorption rate, which involves the forces of equivalence by
exchanging or transferring electrons between adsorbate and
absorbent materials. pseudo- kinetics model of the second
order equation is expressed as follow:
t /qt = 1/ (k2. qe2) + (t / qe), (2)
Where: k2 (g / mg min) is the rate constant of the second-
order equation, qt (mg / g) is the absorption time t (time)
amount and qe is the absorption equilibrium amount (mg / g).
The results showed that the most suitable model for
expressing the absorption rate of Fe (II) is the pseudo- kinetics
model of the second order. The correlation coefficients of
adsorption using FHA for the pseudo- kinetics model of the
second order (R2=0.9999) are closer to the unity than those for
the pseudo- kinetics model of the first order. Fig. 12 shows the
linear segment of t /qe versus the pseudo- kinetics model of the
second order for the absorption of Fe (II) ions on the FHA.
The theoretical qe values of the FHA correspond well to the
experimental values as compared to those of the pseudo-
kinetic model of the first order. While the theoretical values of
the absorption of flaxseed husk for both ends of the two
movements are well correlated with the experimental qe
values, kinetic models are well suited to the absorption process
and Fe (II) chemisorption assay emphasizes by flaxseed husks.
F. Adsorption isotherm studies
The adsorption process is described by Adsorption
isotherms and also describe the interaction between adsorbates
and bio-sorbent. For analysis and design of adsorption systems
Photo 3. sample from Morog well Fe = 0.4 mg.l-1
Fig. 10. Effect of initial concentration on the Fe removal by FHA200,
(dose = 0.75 gm. per liter and CT = 45 min)
60
65
70
75
80
85
90
95
0 0.5 1 1.5 2
Re
mo
val e
ffic
ien
cy (
%)
Initial Fe concentration (mg.l-1)
Removal efficiency (%)
Removal efficiency (%)
Fig. 11. pseudo-first-order kinetic plots on FHA200 for Fe (II) (metal
concentration: 1.72 mg.l-1; adsorption dose: 0.1 g / 100 ml; contact time: 60
min; pH: 7.8).
y = 0.0092x + 1.016R² = 0.7987
0
0.2
0.4
0.6
0.8
1
1.2
1.4
1.6
1.8
0 20 40 60 80Ln
(qe/
qt)
Ln(qe/qt)
Linear ( Ln(qe/qt))
t (min)

MANSOURA ENGINEERING JOURNAL, (MEJ), VOL. 45, ISSUE 3, SEPTEMBER 2020 C: 29
must establish the most acceptable correlations for the batch
equilibrium data, or at equilibrium solution and constant
temperature, the Adsorption isotherms used to describe the
correlation between the number of species/ions adsorbed onto
the solid phase.
Langmuir and Freundlich models are the most frequently
used models to describe the equilibrium data of adsorption. in
this paper, applied the two model Langmuir and Freundlich in
section 8 and 9 to study adsorption isotherm system as
following down [52].
1) Langmuir isotherm
This model assumes that absorption occurs on a
homogeneous surface of the adsorbent without any interaction
between adsorbed ions and assumes that the absorptive sites
are equal in size and shape, i.e., identical, this absorption is
monolayer. During the adsorption process a constant amount
of heat energy is released as the number of vacant sites is
constant [53,54]. The following equation expresses the non-
linear form of the Langmuir model:
Ce / qe = (1/ qmKL) + (Ce / qm) (3)
Where: kL is a constant that expresses the Convergence of
the obligated sites towards the adsorbent, called the Langmuir
constant (L mg-1), qm known as the monolayer uptake capacity
or the quantity of absorbed pores per unit mass of adsorbents
that form a complete monolayer on the outward surface (mg.g-
1), qe is equilibrium concentration of Fe(II) on the bio-sorbent
(mg.g-1) and Ce is the concentration of adsorbed substance at
equilibrium or adsorbate concentration (mg.l-1).
Langmuir isotherm plots for the bio-sorption of Fe (II)
showed in Fig. 13. which demonstrate the degradation plot of
Ce /qe versus Ce. the Langmuir isotherm curve shows R2:
0,998 which represent a high coefficient of sorption
determination data which used to describe the adsorption
isotherm of iron onto FHA, this value points out the adsorption
equilibrium constant (R) was suitable for describing the
adsorption isotherm. observed that, there was not interaction
happened between the adsorbed Fe molecules, and the uptake
positions formed a homogenous distribution. the monolayer
converged by adsorbed iron at the outer surface of FHA was
6.2 mg. g-1.
To represent the type of Langmuir isotherm, proposed the
separation factor (RL) showed in equation 4.
RL = 1 / (1 + KL Co) (4)
where, RL is a factor describing the isotherm shape called
separation factor. according to the RL value, the shape of
Langmuir isotherm could be determined. AT RL= 1 means
linear isotherm, at RL= 0 means irreversible, RL between 0 and
1 means favorable isotherm and unfavorable at RL > 1. In this
study RL value indicating that favorable adsorption of iron into
FHA.
2)Freundlich isotherm
Freundlich model differs from Langmuir's predecessor in
that it is an empirical model used to describe the process of
heterogeneous adsorption (heterogeneous adsorption surface
and active sites with different energies) [55,56].
It can be expressed in the following equation:
qe = Kf * Ce1/n (5)
The linearized logarithmic form of the equation is
ln(qe) = ln)KF( + 1/n ln(Ce) (6)
where KF is Freundlich distribution coefficient or
Freundlich constant, represent uptake capacity of iron onto
FHA ((mg. g-1) (L.mg-1)1/n). Can express about uptake
intensity by empirical coefficient 1/n, according to the 1/n
value, can determine the favorability of adsorption. At 1/n
Fig. 12. Pseudo-second-order kinetic plots onto FHA200 for Fe (II) bio-sorption (metal concentration: 1.72 mg.l-1, adsorbent dosage: 0.1 g/100 mL;
contact time: 60 min; pH: 7.8).
y = 0.64x + 0.3884R² = 0.9999
0
5
10
15
20
25
30
35
40
45
0 10 20 30 40 50 60 70
t /
qe
( m
in g
/mg)
t (min)
t/qt Linear (t/qt )
Fig. 13. Langmuir isotherm plots for the bio-sorption of Fe(II) onto FHA200
(adsorbent dosage: 0.1 g/100 mL; contact time: 45 min; pH: 7.8
y = 0.874x - 0.0429R² = 0.9982
0.10
0.15
0.20
0.25
0.30
0.35
0.40
0.17 0.27 0.37 0.47 0.57
Ce
/qe
(g/
l)
Ce (gm/l)

C: 30 MOHAMMED HUSSEIN, MOHAMED GAR-ALALM AND HISHAM KH. EL-ETRIBY
between 0 and 1 means favorable isotherm, at 1/n= 0 means
irreversible, at 1/n > 1 means unfavorable uptake. the smaller
value of 1/n means stronger interaction occurs between FHA
and iron [57].
A Freundlich regression plot of ln(qe) versus ln (Ce) is
shown in Fig. 14. in which the slope of the line (1/n) and the
other value associated with it (KF) is shown. From the figure it
turns out that the slope value is 0.264 less than the correct one,
so the absorption is classified as preferred (favorable
isotherm). The slope value (1/n) also illustrates several
considerations: 26.4% of the active adsorption sites retained
the same energy level [58], and the smaller the slope value, the
more effective the adsorption, the higher the adsorption
strength and the heterogeneity of hard surfaces as well. [59]
G. Comparison study
The (Table 5) gives a comparison between metal ions
sorbents, including iron, in terms of adsorption capacity,
contact time, dissolved ions concentration and temperature
rang [60].
The table gives different and varied indicators on the
capacity of adsorbents according to the type of adsorbent and
metal ions concentration in the aqueous solution. The
adsorption capacity depends on the adsorbent dosage, the
physical and chemical composition of the adsorbent. This topic
was discussed during the FTIR analysis of flaxseed husk ash.
From above table, it is also evident that the flaxseed husk ash
has a similar absorption capacity compare with other sorbents
mentioned in the attached references. [60].
VI. Conclusion
flaxseed husk was modified and used for removal of
turbidity and NOM from drinking water. The characterization
of FH reveals high adsorption capacity due to the high surface
area and the existence of a large number of amino groups.
TABLE. 5
COMPARISON OF MAXIMUM ADSORPTION CAPACITIES OF
DIFFERENT ADSORBENTS FOR FE (II) IONS.
No Adsorbe
nts
Adsorption
capacity
(mg/g)
Contact
time
(min)
Concen
tration
range
)1-(mg.l
Temp.
range
(K)
Ref.
1 Cross-linked
chitosan
64.1 60 3–9 — [61]
2 Chitosan 57.5 40 3–9 — [61]
3 Modifie
d coir
fibres
7.49 120 73.50–
83.9 308 [62]
4 Rice
husk ash 6.21 60 2–40 298 [63]
5 Flaxseed
husk ash 6.19 45
0.4-
1.72 296
Present
study
6 Coir
fibres 2.84 120
73.50–
83.9 308 [62]
7 Pine
bark
wastes
2.03 30 55.6–
111.2
303–
333 [64]
The optimal ratio of (AS / FH-OUTM, O) for removing both
NOM and turbidity was (40% / 80%). The removal efficiency
for NOM and turbidity at ratio (40% / 60%) was 81% and
93%. Increasing the dosage of MFH to (40% / 80%),
significantly improved the removal efficiency to 98.0% for
turbidity and 99.3% for NOM. Moreover, the MFH revealed a
high removal efficiency at a higher initial NOM value which
suggests the favorability for treatment of raw water
contaminated with NOM.
In this study, many experiments have been carried out to
investigate the performance of FHA to remove iron from
aqueous solutions under various operational conditions. The
removed iron by flaxseed husk ash was found to be depending
on different types of FHA, Initial iron concentration, contact
time, and dosage of the FHA. The initial pH values ranged
between 7.0 to 7.8, Which did not cause any significant change
in the pH after adding of the FHA200. It may be noted that the
efficiency of de-iron removal of water solution is directly
proportional to increase of adsorbent material, initial iron
concentration and contact time. Maximum removal efficiency
of 86-90 % was observed at adsorbent dosage 0.75 gm.l-1. The
FTIR spectra of FHA shows effective groups on the surface of
FHA involved in iron removal from drinking water.
Adsorption kinetics was used to analyze the equilibrium data.
The experimental data of biosorption isotherms for the
biosorbent yielded fitted well with the kinetics order, the
pseudo- kinetics model of the first order and the pseudo-
kinetics model of the second order. The results of the
adsorption equilibrium by Langmuir and Freundlich model
showed FHA's ability to absorb iron ions at a high degree,
hence, this was expressed in favorable. On the other hand, the
correlation coefficient of the Langmuir and Freundlich models
were 0.998 and 0.897, respectively, shows that the relationship
between the absorbed iron ions and the FHA concentration in
this study with the Langmuir model is better than that of the
Freundlich model because the correlation coefficient in the
Fig. 14. Freundlich isotherm plots for the bio-sorption of Fe(II) onto
FHA200 adsorbent dosage: 0.1 g/100 mL; contact time: 45 min; pH: 7.8
ln(qe) = -0.264ln(Ce)R² = 0.897
0.00
0.05
0.10
0.15
0.20
0.25
0.30
0.35
0.40
0.45
0.50
-2.0-1.5-1.0-0.50.0
ln(q
e)
( m
g /g
)
ln(Ce) ( mg.l-1)

MANSOURA ENGINEERING JOURNAL, (MEJ), VOL. 45, ISSUE 3, SEPTEMBER 2020 C: 31
Langmuir model is greater than the correlation coefficient in
the Freundlich model.
REFERENCES
[1]. T. K. Trinh and L. S. Kang, (2011) Response surface methodological
approach to optimize the coagulation–flocculation process in drinking water treatment, Chem. Eng. Res., Des. vol. 89, no. 7, pp. 1126–1135.
[2]. P. C. Singer, (1994) Control of disinfection by-products in drinking
water, J. Environ. Eng., Vol. 120, no. 4, pp. 727–744. [3]. M. H. Cho, C. H. Lee, and S. Lee, Effect of flocculation conditions on
membrane permeability in coagulation-microfiltration, Desalination, Vol.
191, no. (1–3), pp. 386–396, 2006. [4]. G. Hua and D. A. Reckhow, (2007) Comparison of disinfection
byproduct formation from chlorine and alternative disinfectants, Water
Res., Vol. 41, no. 8, pp. 1667–1678. [5]. A. Ashery, K. Radwan and M. Gar Alalm, (2010) The effect of pH
control on turbidity and NOM removal in conventional water treatment,"
Int. Water Technol. J., vol. 1, no. 2, pp. 1–16. [6]. W. Chu, D. Yao, N. Gao, T. Bond and M. R. Templeton, (2015) The
enhanced removal of carbonaceous and nitrogenous disinfection by-
product precursors using integrated permanganate oxidation and
powdered activated carbon adsorption pretreatment, Chemosphere, vol.
141, pp. 1–6. [7]. M. Yan, D. Wang, J. Ni, J. Qu, W. Ni and J. Van Leeuwen, (2009)
Natural organic matter (NOM) removal in a typical North-China water
plant by enhanced coagulation: Targets and techniques, Sep. Purif. Technol., vol. 68, no. 3, pp. 320–327.
[8]. T. Leiknes, H. Ødegaard and H. Myklebust, (2004) Removal of natural
organic matter (NOM) in drinking water treatment by coagulation-microfiltration using metal membranes, J. Memb. Sci. 242 (1–2): 47–55.
[9]. M. Gar Alalm, A. Tawfik, and S. Ookawara, (2015) Combined Solar
advanced oxidation and PAC adsorption for removal of pesticides from industrial wastewater, J. Mater. Environ. Sci. 6 (3): 800–809.
[10]. M. Gar Alalm, A. Tawfik, and S. Ookawara, (2016) Enhancement of
photocatalytic activity of TiO2 by immobilization on activated carbon for degradation of pharmaceuticals, J. Environ. Chem. Eng. 4 (2): 1929–
1937.
[11]. M. Gar Alalm, S. Ookawara, D. Fukushi, A. Sato, and A. Tawfik, (2016) Improved WO 3 photocatalytic efficiency using ZrO 2 and Ru for the
degradation of carbofuran and ampicillin, J. Hazard. Mater. 302 225–
231. [12]. M. Gar Alalm, A. Tawfik, S. Ookawara, (2014) Investigation of
optimum conditions and costs estimation for degradation of phenol by
solar photo-Fenton process, Appl. Water Sci. [13]. T. Robinson, B. Chandran, P. Nigam, (2002) Removal of dyes from a
synthetic textile dye effluent by biosorption on apple pomace and wheat
straw, Water Res. 36 (11): 2824–2830. [14]. A. Gupta, S.R. Vidyarthi, N. Sankarakrishnan, (2015) Concurrent
removal of As (III) and As (V) using green low cost functionalized
biosorbent - Saccharum officinarum bagasse, J. Environ. Chem. Eng. 3 (1): 113–121.
[15]. Ş. Taşar, F. Kaya, A. Özer, (2014) Biosorption of lead (II) ions from
aqueous solution by peanut shells: Equilibrium, thermodynamic and kinetic studies, J. Environ. Chem. Eng. 2 (2): 1018–1026.
[16]. A. Saeed, M. Iqbal, (2003) Bioremoval of cadmium from aqueous
solution by black gram husk (Cicer arientinum), Water Res. 37 (14): 3472–3480.
[17]. A. H. Khan, S. Ahmad, A. Ahmad, (1998) Role of Sawdust in the
Removal of Copper (II) From Industrial Wastes, Water Res. 32 (10): 3085–3091.
[18]. C. Namasivayam, D. Prabha, M. Kumutha, (1998) Removal of direct red
and acid brilliant blue by adsorption on to banana pith, Bioresour. Technol. 64 (1): 77–79.
[19]. http://www.aleqt.com/2015/08/02/article_978203.html
[20]. http://www.ngwa.org/Fundamentals/teachers/Pages/information-on-earth-water.aspx
[21]. http://www.ordemengenheiros.pt/fotos/editor2/areainternacional/201509
24.pdf, "Water supply and sanitation in Saudi Arabia Source: updated in March 2015"
[22]. https://en.wikipedia.org/wiki/Water_supply_and_sanitation_in_Saudi_Ar
abia?oldid=672037079 [23]. B. Renata, K. Tomáš, (2016) Efficacy of sorption materials for nickel,
iron and manganese removal from water, International Conference on
Efficient & Sustainable Water Systems Management toward Worth Living Development, 2nd EWaS, Procedia Engineering 162 56 – 63
[24]. J. Ilavský, D. Barloková, K. Munka, (2015) Antimony removal from
water by adsorption to iron-based sorption materials, Water Air Soil Pollut. 226:1 1-8.
[25]. Gulf Standard Specification for Unsaturated Drinking Water No. 149 /
2000 [26]. Journal of King Abdulaziz University: Engineering Sciences, vol. 14,
No. 2, (2002), pp. 81-104
[27]. Water quality standards, Presidency of Meteorology and Environmental (PME), Saudi Arabia
[28]. GCC STANDARDIZATION ORGANIZATION (GSO), GSO5/ FDS / 2012, Bottled drinking water
[29]. D. Barloková, J. Ilavský, (2010) Removal of Iron and Manganese from
Water Using Filtration by Natural Materials, Polish J. of Environ. Stud. Vol. 19, No. 6, 1117-1122
[30]. http://www.pbwatersoftening.com/5-harmful-effects-high-levels-iron-
water/ [31]. Iron in Drinking-water, background document for development of WHO
Guidelines for Drinking water Quality,
http://www.who.int/water_sanitation_health/dwq/chemicals/iron.pdf,
2003
[32]. M. Tehrani, R. Batal, M. Kamalinejad, A. Mahbubi, (2014) Extraction
and purification of flaxseed proteins and studying their antibacterial activities. J Plant Sci 2(1): 70-76.
[33]. A. Baghvand, N. Mehrdadi and A. Karbassi, Optimizing coagulation
process for low to high turbidity waters using aluminum and iron salts, American Journal of Environmental Sciences, vol.6, No.5, pp.442–
448,2010.
[34]. H. Makki, A. Al-Alawy, N. Abdul-Razaq and M. Mohammed, (2010) Using Aluminum Refuse as a Coagulant in the Coagulation and
Flocculation Processes, Iraqi Journal of Chemical and Petroleum
Engineering, vol. 11, no. 3, pp. 15–22. [35]. R. Joshua and V. Vasu, (2013) Characteristics of Stored Rain Water and
its Treatment Technology Using Moringa seeds, International J ournal of
Life science and Pharma Research, vol. 2, no. 1, pp. 154–175. [36]. G. Madrona, I. Branco, V. Seolin, B. Filho, M. Fagundes-Klen, and R.
Bergamasco, (2012) Evaluation of extracts of moringa oleifera lam seeds
obtained with NaCl and their effects on watert reatment, Acta Scientiarum-Technology, vol. 34, no. 3, pp. 289–293.
[37]. K. Cordeiro R. Cardoso, E. Bergamasco, S. Cossich, and L. Moraes,
optimizing mixture and decantation times in the process of coagulation/flocculation of raw water using Moringa oleifera Lam,
(2008) Acta Scientiarum. Technology, vol. 30, no. 2.
[38]. X. Zhan, B. Gao, Q. Yue, B. Liu, X. Xu and Q. Li, Removal natural organic matter by coagulation–adsorption and evaluating the serial effect
through a chlorine decay model, Journal of Hazardous Materials 183
(2010) 279–286. [39]. APHA, (2005) Standard Methods for the Examination of Water and
Wastewater, American Public Health Association, Washington DC.
[40]. G. Qian et al., (2014) Removal of Fe3+ from Aqueous Solution by Natural Apatite, Journal of Surface Engineered Materials and Advanced
Technology, 4, 14-20
[41]. G. Jain, et al., (2010) Heat Shock Proteins and Plants book, chapter 5: 106-132.
[42]. M. Tehrani, R. Batal, M. Kamalinejad, A. Mahbubi, (2014) Extraction
and Purification of Flaxseed Proteins and Studying their Antibacterial Activities. Journal of Plant Sciences. Vol. 2, No. 1, pp. 70-76.
[43]. A. Ashery, K. Radwan, M. Gar Alalm (2010) The effect of pH control on
turbidity and NOM removal in conventional water treatment. Int Water Technol J 1(2): 1-16.
[44]. M. Gar Alalm, M. Nasr, S. Ookawara, (2016) Assessment of a novel spiral hydraulic flocculation/sedimentation system by CFD simulation,
fuzzy inference system, and response surface methodology. Sep Purif
Technol 169: 137-150. [45]. H. Lotfy, I. Rashed (2002) A method for treating wastewater containing
form aldehyde. Water Res 36(3): 633-637.
[46]. M. Gar Alalm, M. Nasr (2018) Artificial intelligence, regression model, and cost estimation for removal of chlorothalonil pesticide by activated
carbon prepared from casuarina charcoal. Sustain Environ Res.
[47]. M. Gar Alalm, A. Tawfik, S. Ookawara (2015) Combined Solar advanced oxidation and PAC adsorption for removal of pesticides from
industrial wastewater. J Mater Environ Sci 6(3): 800-809.
[48]. A. Ashry, K. Radwan, M. Gar Alalm (2012) Enhanced coagulation using a spiral clari-flocculator. Int Water Technol J 2(2): 145-164.

C: 32 MOHAMMED HUSSEIN, MOHAMED GAR-ALALM AND HISHAM KH. EL-ETRIBY
[49]. M. Gar Alalm, S. Ookawara, D. Fukushi, A. Sato, A. Tawfik (2016)
Improved WO 3 photo catalytic efficiency using ZrO2 and Ru for the
degradation of carbofuran and ampicillin. J Hazard Mater 302: 225-231.
[50]. K. Bhattacharyya, A.Sharma, (2004) Azadirachta indica leaf powder as an effective biosorbent for dyes: a case study with aqueous Congo Red
solutions, Journal of Environmental Management, vol. 71, no. 3, pp.
217–229. [51]. Y. Ho, G. McKay, (1999) Pseudo-second order model for sorption
processes, Process Biochemistry, vol. 34, no. 5, pp. 451–465.
[52]. Z. Yue, S. Bender, J. Wang, J. Economy, (2009) Removal of chromium Cr (VI) by low cost chemically activated carbon materials from water. J
Hazard Mater, 166:74-8. [53]. I. Langmuir, (1918) The adsorption of gases on plane surfaces of glass,
mica and platinum, The Journal of the American Chemical Society, vol.
40, no. 9, pp. 1361–1403. [54]. A. Mittal, D. Kaur, A. Malviya, J. Mittal, V. Gupta, (2009) Adsorption
studies on the removal of coloring agent phenol red from wastewater
using waste materials as adsorbents. J Colloid Interface Sci, 337:345-54 [55]. H. Freundlich, (1906) Uber die adsorption in losungen,” Zeitschrift für
Physikalische Chemie, vol. 57, pp. 385–470.
[56]. B. Hameed, J. Salman, A. Ahmad, (2009) Adsorption isotherm and
kinetic modeling of 2,4-D pesticide on activated carbon derived from
date stones.J Hazard Mater,163:121-6.
[57]. A. Delle, (2001) Factors affecting sorption of organic compounds in natural sorbent/water systems and sorption coefficients for selected
pollutants. A review, Journal of Physical and Chemical Reference Data,
vol. 30, no. 1, pp. 187–439. [58]. A. Kumar, B. Prasad, I. Mishra, (2008) Adsorptive removal of
acrylonitrile by commercial grade activated carbon: kinetics, equilibrium
and thermodynamics. J Hazard Mater, 152:589-600. [59]. A. El Nemr, O. Abdelwahab, A. El-Sikaily, A. Khaled, (2009) Removal
of direct blue-86 from aqueous solution by new activated carbon
developed from orange peel. J Hazard Mater, 161:102-10. [60]. B. Singha, S. Das, (2012) Removal of Pb (II) ions from aqueous solution
and industrial effluent using natural biosorbents, Environmental Science
and Pollution Research, vol. 19, no. 6, pp. 2212–2226. [61]. W. Ngah, S. Ghani, A. Kamari, (2005) Adsorption behaviour of Fe (II)
and Fe (III) ions in aqueous solution on chitosan and cross-linked
chitosan beads, Bioresource Technology, vol. 96, no. 4, pp. 443–450. [62]. S. Shukla, R. Pai, A. Shendarkar, (2006) Adsorption of Ni (II), Zn (II)
and Fe (II) on modified coir fibres,” Separation and Purification
Technology, vol. 47, no. 3, pp. 141–147. [63]. Y. Zhang, J. Zhao, Z. Jiang, D. Shan, Y. Lu, (2014) Biosorption of Fe
(II) and Mn (II) Ions from Aqueous Solution by Rice Husk Ash, Bio
Med Research International Volume 2014, Article ID 973095, 10 pages.
[64]. B. Acemioǧlu, (2004) Removal of Fe (II) ions from aqueous solution by Calabrian pine bark wastes, Bioresource Technology, vol. 93, no. 1, pp.
99–102.
Title Arabic:
تحسين خصائص مياه الشرب باستخدام مادة مازة حيوية مبتكرة
Arabic Abstract:
المازة في هذه البحث كشفنا عن مادة جديدة في عالم المخثرات والمواد
الطبيعية لتحسين خصائص مياه الشرب وقد أثبتت فعاليتها مقارنة بالمروبات
الطبيعية الشائعة. تم استخدام قشر بذور الكتان كمخثر طبيعي وكمادة مازة لإزالة
التعكر والمواد العضوية الطبيعية والحديد من المياه الجوفية لعدة آبار بمنطقة
لسعودية. لإزالة التعكر والمواد العضوية الطبيعية الجوف شمال المملكة العربية ا
(AS) بإضافة كبريتات الألومنيوم (MFH) تم تحضير قشر بذور الكتان المعدل
بعد إزالة المادة الصمغية والزيت. يظُهر توصيف (FH) إلى قشر بذور الكتان
/ جم( بقطر مسام يبلغ2م 125.18مساحة سطح عالية ) (FH) قشر بذور الكتان
إلى وجود عدد (FTIR) ميكرون. علاوة على ذلك أشار تحليل أطياف 26.28
((FH كبير من المجموعات الأمينية ومجموعات وظيفية أخرى تدل على كفاءة
حيال إزالة العكارة والمواد العضوية الطبيعية. وكانت نسبة الخلط المثلى للإزالة
(80( ٪40 ٪AS : MFH جرعة تمت دراسة وقت الخلط البطيء ، FH
والتركيز الاولى للمواد العضوية الطبيعية لإثبات فعالية المادة. تم التحقيق في إزالة
مع (MFH) العكارة والمواد العضوية الطبيعية باستخدام قشر بذور الكتان المعدل
٪ 98.0، وكانت كفاءة الإزالة AS ملغ / لتر 10ملغ / لتر و FH 40 جرعة
اد العضوية الطبيعية في أعلى تركيز للمادة العضوية في ٪ للمو 99.3للعكارة و
مياه الشرب. أيضا تم تخفيض نسبة الحديد في مياه الشرب عن طريق رماد قشر
الناتج من حرق قشر بذور الكتان عند درجات حرارة (FHA) بذور الكتان
إلى وجود عدد كبير من المجموعات (FTIR) متفاوتة. أشار تحليل أطياف
في إزالة الحديد. تمت دراسة تأثير نوع FHA ة المختلفة تدل على كفاءةالوظيفي
FHA وقت الاتصال ، (CT) جرعة ، FHA وتركيز Fe الأولي على كفاءة
من المحلول المائي. كان الحد Fe+3 أداء عالياً لإزالة FHA200 الازالة. أظهر
FHA200 جرام / لتر من 0.75% باستخدام جرعة 90الأقصى للإزالة
وقيمة 7.8إلى 7دقيقة ، وقيمة رقم الاس الهيدروجيني من 45ووقت التلامس
درجة مئوية. أظهرت حركية وحرارية الامتزاز أن 24إلى 20درجة الحرارة من
كفاءة الامتزاز على سطح المادة الممتزة تتصرف بطريقة مواتية لامتصاص
.الحديد