Improved EBITDA and increasing margins - … · MIDSONA AB (PUBL) *CORPORATE REGISTRATION NUMBER...
19
MIDSONA AB (PUBL) *CORPORATE REGISTRATION NUMBER 556241-5322 INTERIM REPORT, JANUARY–SEPTEMBER 2017 1 Improved EBITDA and increasing margins July–September 2017 (third quarter) ● Net sales amounted to SEK 579 million (522). ● Operating profit before depreciation and amortisation, EBITDA, amounted to SEK 52 million (42), before non-recurring items, corresponding to a margin of 9.0 percent (8.0). ● Profit for the period amounted to SEK 11 million (7), corre- sponding to earnings per share of SEK 0.25 (0.25) before and after dilution. ● Cash flow from operating activities amounted to SEK 32 million (13). ● Midsona took control of the acquired Bringwell AB (publ) on 4 July, a company with a leading position in the Nordic region in personal care products and OTC drugs. January–September 2017 (nine months) ● Net sales amounted to SEK 1,594 million (1,223). ● Operating profit before depreciation and amortization, EBITDA, amounted to SEK 131 million 131 (88), before non-recurring items, corresponding to a margin of 8.2 percent (7.2). ● Profit for the period amounted to SEK 50 million (29), corre- sponding to earnings per share of SEK 1.15 (1.02) before and aſter dilution. ● Cash flow from operating activities amounted to SEK 98 million (11). INTERIM REPORT, JANUARY–SEPTEMBER 2017 Key figures ¹ July–Sept 2017 July–Sept 2016 Jan–Sept 2017 Jan–Sept 2016 Rolling 12-months Full year 2016 Net sales growth, % 10.9 42.2 30.3 48.8 34.3 48.6 Gross margin, % 35.4 33.3 33.8 35.4 34.1 35.4 EBITDA margin before non-recurring items, % 9.0 8.0 8.2 7.2 8.4 7.7 EBITDA margin, % 5.2 4.4 6.8 5.6 7.0 6.1 Operating profit before non-recurring items, % 7.4 6.7 6.6 5.7 6.9 6.3 Operating margin, % 3.6 3.1 5.3 4.1 5.5 4.7 Profit margin, % 2.8 1.5 4.1 2.7 4.3 3.3 Average capital employed, SEK million 2,175 1,684 2,184 1,663 2,210 1 636 Return on capital employed, % 5.2 5.1 Return on equity, % 5.4 4.0 Net debt, SEK million 703 1,085 703 1,085 703 662 Net debt/EBITDA, multiple 4.8 6.2 Net debt/equity ratio, multiple 0.5 1.2 0.5 1.2 0.5 0.5 Interest coverage ratio, multiple 4.2 1.9 4.7 2.8 4.6 3.3 Equity/assets ratio, % 52.0 35.1 52.0 35.1 52.0 51.5 ¹ Midsona presents certain financial measures in the Interim Report that are not defined under IFRS. For definitions and checks against IFRS, please refer to page 15 of this Interim Report and to the 2016 Annual Report. Note: This is information such that Midsona AB (publ) is required to publish under the EU Market Abuse Regulation. The information was submied under the auspices of Lennart Svensson for publication on 20 October 2017 at 08:00 a.m. CET. For further information Peter Åsberg, CEO +46 730 26 16 32 Lennart Svensson, CFO +46 767 74 33 04 SPORTS NUTRITION
Transcript of Improved EBITDA and increasing margins - … · MIDSONA AB (PUBL) *CORPORATE REGISTRATION NUMBER...

M I DSONA AB (PUBL) *CORPORATE REGISTRATION NUM BER 556241 -5322 I NTERI M REPORT, JANUARY–SEPTEM BER 2017 1
Improved EBITDA and increasing margins July–September 2017 (third quarter)● Net sales amounted to SEK 579 million (522).
● Operating profit before depreciation and amortisation, EBITDA, amounted to SEK 52 million (42), before non-recurring items, corresponding to a margin of 9.0 percent (8.0).
● Profit for the period amounted to SEK 11 million (7), corre-sponding to earnings per share of SEK 0.25 (0.25) before and after dilution.
● Cash flow from operating activities amounted to SEK 32 million (13).
● Midsona took control of the acquired Bringwell AB (publ) on 4 July, a company with a leading position in the Nordic region in personal care products and OTC drugs.
January–September 2017 (nine months)● Net sales amounted to SEK 1,594 million (1,223).
● Operating profit before depreciation and amortization, EBITDA, amounted to SEK 131 million 131 (88), before non-recurring items, corresponding to a margin of 8.2 percent (7.2).
● Profit for the period amounted to SEK 50 million (29), corre-sponding to earnings per share of SEK 1.15 (1.02) before and after dilution.
● Cash flow from operating activities amounted to SEK 98 million (11).
I N T E R I M R E P O R T , J A N U A R Y – S E P T E M B E R 2 0 1 7
Key figures ¹
July–Sept 2017
July–Sept 2016
Jan–Sept 2017
Jan–Sept 2016
Rolling 12-months
Full year 2016
Net sales growth, % 10.9 42.2 30.3 48.8 34.3 48.6
Gross margin, % 35.4 33.3 33.8 35.4 34.1 35.4
EBITDA margin before non-recurring items, % 9.0 8.0 8.2 7.2 8.4 7.7
EBITDA margin, % 5.2 4.4 6.8 5.6 7.0 6.1
Operating profit before non-recurring items, % 7.4 6.7 6.6 5.7 6.9 6.3
Operating margin, % 3.6 3.1 5.3 4.1 5.5 4.7
Profit margin, % 2.8 1.5 4.1 2.7 4.3 3.3
Average capital employed, SEK million 2,175 1,684 2,184 1,663 2,210 1 636
Return on capital employed, % 5.2 5.1
Return on equity, % 5.4 4.0
Net debt, SEK million 703 1,085 703 1,085 703 662
Net debt/EBITDA, multiple 4.8 6.2
Net debt/equity ratio, multiple 0.5 1.2 0.5 1.2 0.5 0.5
Interest coverage ratio, multiple 4.2 1.9 4.7 2.8 4.6 3.3
Equity/assets ratio, % 52.0 35.1 52.0 35.1 52.0 51.5
¹ Midsona presents certain financial measures in the Interim Report that are not defined under IFRS. For definitions and checks against IFRS, please refer to page 15 of this Interim Report and to the 2016 Annual Report.
Note: This is information such that Midsona AB (publ) is required to publish under the EU Market Abuse Regulation. The information was submitted under the auspices of Lennart Svensson for publication on 20 October 2017 at 08:00 a.m. CET.
For further informationPeter Åsberg, CEO +46 730 26 16 32Lennart Svensson, CFO +46 767 74 33 04
SPORTS NUTRITION

M I DSONA AB (PUBL) *CORPORATE REGISTRATION NUM BER 556241 -5322 I NTERI M REPORT, JANUARY–SEPTEM BER 2017 2
Comment by the CEOContinued improved sales and earningsMidsona’s sales for the third quarter increased by 11 percent and amounted to SEK 579 million (522). The underlying operating profit, measured as EBITDA before non-recurring items, amounted to SEK 52 million (42) and is the best ever in the Group’s history. The EBITDA margin increased to 9.0 percent (8.0). The margin improvement is mainly a result of the Group’s long-term change process.
The acquisition of Bringwell is strategically importantMidsona gained control of the acquired company Bringwell at the start of the third quarter. This is strategically important as it significantly strengthens the company’s position within personal care products. Bringwell has a number of its own strong brands such as Eskimo-3, Mivitotal and Kan Jang. In addition, they represent ProbiMage and Membrasin. Midsona sees great opportunities to develop Bringwell’s strong brands. The integration of Bringwell into Midsona’s operations began in the third quarter. Already in the third quarter, integration has come a long way and all related restructuring ex-penses are taken. The acquisition is expected to realise, as previously announced, cost synergies from efficiency enhancements in sales, marketing and administration. The synergies are estimated at SEK 50–60 million annually and are expected to be fully realised by the end of 2018. There are also opportuni-ties for growth synergies through increased sales, because the companies have complementary prod-ucts and sales channels.
Consolidation of the Nordic market through acquisitionsMidsona’s vision is to become a leader in health and well-being in the Nordic region. When this vision was launched, it was based on the realisation that the market was fragmented, with few strong brands. In recent years, Midsona has acquired one to two companies a year in the Nordic region and thereby had an active role in the consolidation of the market. The acquired companies have been integrated into Midsona, resulting in important synergies. The acquired brands have been refined and launched in new channels and new geographic markets. Midsona is currently a leader in health and well-being in the Nordic region. We see continued opportunities for additional acquisitions, but the main focus in the Nordic region will be to create organic growth for our prioritised brands in the future. In addition, cost-effectiveness will gradually be improved through a long-term change process.
Setting sights on EuropeNow that we have created a market-leading platform in the Nordic region, it is a natural step to set our sights on Europe. During the spring, we conducted an analysis of the health and well-being market in Europe. We were able to determine that the European market is fragmented in the same way as the Nordic market was when we began our acquisition journey. The market chiefly consists of privately owned companies with positions in one or more niches. We have identified a number of interesting acquisition targets and will now begin exploring those acquisition opportunities.
Continued opportunities for sales growth and earnings improvementIn spite of the strong development, our assessment is that there are opportunities for continued sales growth and earnings improvement through accelerating the growth of our brands, continued long-term change efforts, integrating the acquired Bringwell and further acquisitions. We have achieved our vision of becoming the leader in the health and well-being in the Nordic region. It has been a successful journey that has continuously created shareholder value. The next natural step is to raise our level of ambition. We are preparing for new acquisitions outside the Nordic region, with the vision of eventually become one of the leading companies in health and well-being in Europe.
Peter ÅsbergPresident and CEO
Peter Åsberg, President and CEO
THIRD QUARTER
SEK 579 millionSales
SEK 52 millionEarnings before depreciation and amorti-sation (EBITDA), before non-recurring items

M I DSONA AB (PUBL) *CORPORATE REGISTRATION NUM BER 556241 -5322 I NTERI M REPORT, JANUARY–SEPTEM BER 2017 3
0
200
400
600
800
500
1000
1500
2000
2500
Financial information Net sales
July–SeptemberNet sales amounted to SEK 579 million (522), an increase of 11 percent. Adjusted for structural changes, net sales decreased by 2 percent. Overall, sales were weak in July in all geographic markets to then recover favourably in August and September. The Group’s eight prioritised brands showed growth of 2 percent.
Sales increased for Sweden, Finland and Denmark, while sales in Norway were in line with the previous year. For Sweden, sales growth was partly driven by acquired business volume. The Swedish market for organic products is still experiencing growth, although at a lower rate than previously. Sales also continued to be negatively affected by certain delivery problems to customers as a result of both pro-duction disturbances at suppliers and internal alignment processes linked to acquisitions. The issues should be fully resolved in the fourth quarter. In Norway, several brands strengthened their position in retail with good sales growth, despite ongoing repositioning efforts in sales to the Norwegian FMCG segment. Sales growth for Finland was strong, with several brands strengthening their position in retail, despite increased competition from the retailer’s own, private label, brands in certain categories. There arepositive growth signals coming from the Finnish retail segment, following a period of negative development. Sales development for Denmark was partly driven by acquired business volume. Sales in the Danish market were stable, as well as in the brand Urtekram’s export business. During the period, a smaller distribution and sales assignment in Denmark was discontinued due to poor profitability.
January–SeptemberNet sales amounted to SEK 1,594 million (1,223), an increase of 30 percent. Adjusted for structural changes, net sales decreased by 1 percent. The Group’s eight prioritised brands showed growth of 3 percent*.
Sales increased significantly in both Sweden and Norway, mainly driven by acquired sales volumes.
Gross profit
July–SeptemberGross profit amounted to SEK 205 million (174), corresponding to a gross margin of 35.4 percent (33.3). The gross margin was positively affected by the incorporation of Bringwell in the period, with its primary focus in categories with generally higher gross margins. In addition, the customer- and product mix were beneficial in some geographic markets.
January–SeptemberGross profit amounted to SEK 538 million (433), corresponding to a gross margin of 33.8 percent (35.4). The gross margin was affected negatively, primarily by the increased proportion of sales to the FMCG segment, with lower overall margins related to the acquisition of Internatural. A somewhat unfavourable currency development during the first half of the year also put pressure on the gross margin. The incorporation of Bringwell will gradually improve the gross margin.
Operating profit
July–SeptemberOperating profit before depreciation/amortisation and impairment, EBITDA, amounted to SEK 30 million (23), corresponding to a margin of 5.2 percent (4.4). EBITDA, before non-recurring items, amounted to SEK 52 million (42), corresponding to a margin of 9.0 percent (8.0). Amortisation and depreciation for the period amounted to SEK 9 million (7), divided between SEK 6 million (4) in amortisation of intangible fixed assets and depreciation of SEK 3 million (3) on tangible fixed assets. Operating profit amounted to SEK 21 million (16), with an operating margin of 3.6 percent (3.1).
The improved operating profit, before non-recurring items, and operating margin were mainly attributable to Sweden due to higher sales volumes, realised synergies from acquisitions, as planned, and good cost control. Norway had an operating profit, before non-recurring items, in line with the pre-vious year. Changed market conditions in the Norwegian FMCG segment along with certain additional expenses negatively affected operating profit. Finland improved operating income and operating mar-gin mainly through higher sales volume with a favourable customer- and product mix as well as good cost control. For Denmark, operating income was lower compared with the previous year due to higher
Net sales
Quarter Rolling, 12 months
* Acquired brands, Kung Markatta and Helios, are compared in the period January–September with sales in the corresponding period the previous year, although Midsona did not yet own the brands in the period January–June.
0
10
20
30
40
50
0
40
80
120
160
200
EBITDA, before non- recurring items
Quarter Rolling, 12 months
SEK mSEK m
M I DSONA AB (PUBL) *CORPORATE REGISTRATION NUM BER 556241 -5322 I NTERI M REPORT, JANUARY–SEPTEM BER 2017 4
fixed sales cost in the Danish market, which were not fully absorbed by corresponding sales growth, and temporary additional expenses relating to the operations’ own production unit as well as to a change of subcontractors in order to ensure continued high product quality.
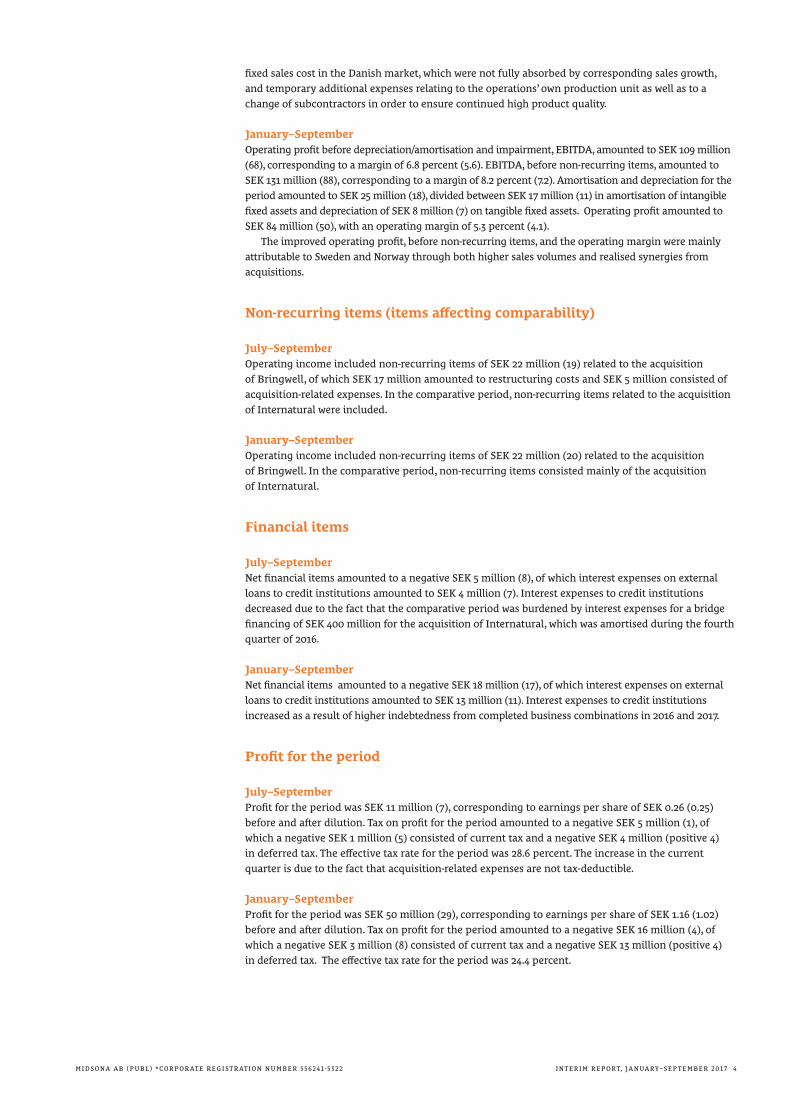
January–SeptemberOperating profit before depreciation/amortisation and impairment, EBITDA, amounted to SEK 109 million (68), corresponding to a margin of 6.8 percent (5.6). EBITDA, before non-recurring items, amounted to SEK 131 million (88), corresponding to a margin of 8.2 percent (7.2). Amortisation and depreciation for the period amounted to SEK 25 million (18), divided between SEK 17 million (11) in amortisation of intangible fixed assets and depreciation of SEK 8 million (7) on tangible fixed assets. Operating profit amounted to SEK 84 million (50), with an operating margin of 5.3 percent (4.1).
The improved operating profit, before non-recurring items, and the operating margin were mainly attributable to Sweden and Norway through both higher sales volumes and realised synergies from acquisitions.
Non-recurring items (items affecting comparability)
July–SeptemberOperating income included non-recurring items of SEK 22 million (19) related to the acquisition of Bringwell, of which SEK 17 million amounted to restructuring costs and SEK 5 million consisted of acquisition-related expenses. In the comparative period, non-recurring items related to the acquisition of Internatural were included.
January–SeptemberOperating income included non-recurring items of SEK 22 million (20) related to the acquisition of Bringwell. In the comparative period, non-recurring items consisted mainly of the acquisition of Internatural.
Financial items
July–SeptemberNet financial items amounted to a negative SEK 5 million (8), of which interest expenses on external loans to credit institutions amounted to SEK 4 million (7). Interest expenses to credit institutions decreased due to the fact that the comparative period was burdened by interest expenses for a bridge financing of SEK 400 million for the acquisition of Internatural, which was amortised during the fourth quarter of 2016.
January–SeptemberNet financial items amounted to a negative SEK 18 million (17), of which interest expenses on external loans to credit institutions amounted to SEK 13 million (11). Interest expenses to credit institutions increased as a result of higher indebtedness from completed business combinations in 2016 and 2017.
Profit for the period
July–SeptemberProfit for the period was SEK 11 million (7), corresponding to earnings per share of SEK 0.26 (0.25) before and after dilution. Tax on profit for the period amounted to a negative SEK 5 million (1), of which a negative SEK 1 million (5) consisted of current tax and a negative SEK 4 million (positive 4) in deferred tax. The effective tax rate for the period was 28.6 percent. The increase in the current quarter is due to the fact that acquisition-related expenses are not tax-deductible.
January–SeptemberProfit for the period was SEK 50 million (29), corresponding to earnings per share of SEK 1.16 (1.02) before and after dilution. Tax on profit for the period amounted to a negative SEK 16 million (4), of which a negative SEK 3 million (8) consisted of current tax and a negative SEK 13 million (positive 4) in deferred tax. The effective tax rate for the period was 24.4 percent.

M I DSONA AB (PUBL) *CORPORATE REGISTRATION NUM BER 556241 -5322 I NTERI M REPORT, JANUARY–SEPTEM BER 2017 5
0
20
40
60
0
50
100
150
–50–20
Cash flow
July–SeptemberCash flow from operating activities amounted to SEK 32 million (13), mainly due to a significantly stronger cash flow from operating activities before changes in working capital. Cash flow from investing activities amounted to a negative SEK 79 million (805), consisting of business acquisitions for SEK 64 million (800) and investments in tangible and intangible fixed assets of SEK 15 million (5). Cash flow from financing activities amounted to SEK 49 million (836) due to issue expenses, from an issue in kind, of SEK 1 million, loans raised of SEK 60 million (800) and amortisation of loans and lease liabilities of 10 million (11). In the comparative period, a change in the use of an existing overdraft facility amounted to SEK 47 million.
January–SeptemberCash flow from operating activities improved to SEK 98 million (11), due to both stronger operating activities and less capital tied up in inventories and operating receivables compared with the corre-sponding period the previous year. Cash flow from investing activities amounted to a negative SEK 86 million (813), while cash flow from financing activities amounted to SEK 1 million (836).
Liquidity and financial positionCash and cash equivalents amounted to SEK 74 million (101) and there were unused credit facilities of SEK 100 million (39) at the end of the period. Net debt amounted to SEK 703 million (1,085) at the end of the period and increased during the quarter by SEK 51 million, mainly attributable to loans in con-nection with the acquisition of Bringwell. The net debt/equity ratio was a multiple of 0.5 (1.2). The net debt to EBITDA ratio on a rolling 12-month basis was a multiple of 4.8 (11.2). At the end of the preceding quarter, the net debt to EBITDA ratio on a rolling 12-month basis was a multiple of 4.6.
Shareholders’ equity amounted to SEK 1,514 million (943). At the end of the preceding quarter, share-holders’ equity was SEK 1,331 million. The changes consisted of profit for the period of SEK 11 million, exchange differences on translation of foreign operations of a negative SEK 6 million, a new share is-sue, SEK 179 million, and new issue expenses, 1 SEK million. The equity/assets ratio was 52 percent (35) at the end of the period.
Investments
July–SeptemberInvestments in intangible and tangible fixed assets amounted to SEK 15 million (5). Investments in software increased as a result of an ongoing project for a new Group-wide business system scheduled for implementation in 2018.
January–SeptemberInvestments in intangible and tangible fixed assets amounted to SEK 22 million (13) and consisted mainly of production-related investments and investments in software. In the Danish production facility, several smaller capacity- and efficiency-enhancing investments were made in the first half of the year.
Other informationFuture prospects Consumer demand for products in the areas of health and well-being in general, and organic produce in particular, is expected to increase. Midsona is well-positioned in attractive growth segments and the assessment is that the Group will grow over the year with improved EBITDA.
Personnel The average number of employees was 343 (302), while the number of employees at the end of the period was 386 (341). The increased number of employees at the end of the period was mainly related to the acqui-sition of Bringwell AB in July 2017. During the current quarter, the number of employees increased by 57.
Cash flow from operating activities
Quarter Rolling, 12 months
SEK mSEK m

M I DSONA AB (PUBL) *CORPORATE REGISTRATION NUM BER 556241 -5322 I NTERI M REPORT, JANUARY–SEPTEM BER 2017 6
Parent CompanyGroup-wide management, administration and IT are operated as Group functions in the Parent Company Midsona AB (publ).
Net sales amounted to SEK 24 million (17), and related primarily to invoicing of services provided internally within the Group. Profit before tax amounted to a loss of SEK 7 million (loss 6). Profit before tax included dividends from subsidiaries of SEK 65 million and impairment of shares in subsidiaries by SEK 51 million. Financial expenses increased due to negative currency translation differences on financial investments and higher interest expenses for higher debt to credit institutions. Cash and cash equivalents, including unused credit facilities, amounted to SEK 163 million (48). At the end of the period, borrowing from credit institutions amounted to SEK 775 million (1,177). In the comparative period, loans totalling SEK 400 million were granted for bridge financing for the acquisition of Inter-natural during the third quarter of 2016, which was amortised during the fourth quarter of 2016. On the balance sheet date, there were 11 employees (9).
For the Parent Company, SEK 24 million (17), equivalent to 100 percent (100) of sales for the period and SEK 3 million (2), corresponding to 8 percent (9) of purchases for the period pertained to subsidiaries within the Group. Sales to subsidiaries pertained mainly to administrative services, while purchases from subsidiaries mainly pertained to consultancy services and other reimbursements for expenses. All pricing is conducted on market terms.
Three of the Board Members invoice Board remunerations via their own companies. Beyond that, there have been no loans, purchases or sales involving members of the Board or senior executives.
The shareMidsona’s Series A and B shares are listed on Nasdaq Stockholm’s Small Cap List under the symbols MSON A and MSON B, respectively.
The total number of shares at the end of the period was 46,008,064 (28,430,987) distributed as 539,872 Series A shares (359,915) and 45,468,192 Series B shares (28,071,072). The number of votes at the end of the period was 50,866,912 (31,670,222), whereby one Series A share corresponds to ten votes and one Series B share to one vote. During July 2017, the number of shares and votes increased as a result of the issue in kind in connection with the acquisition of Bringwell AB.
During the period January–September 2017, 7,105,455 shares (6,280,906) were traded. The highest price paid for Series B shares was SEK 58.25 (43.90), and the lowest was SEK 42.40 (24.40). On 29 Sep-tember, the most recent price paid for the share was SEK 48.00 (42.50). For the comparison year, the share price has been adjusted for the new share issue.
There was a 2016/2019 option programme outstanding at the end of the period, which could provide a maximum of 390,000 new Series B shares at full conversion (see Annual Report 2016). The subscription price for outstanding warrants exceeded the average share price of Series B shares on the closing date, which is why earnings per share after dilution were not calculated.
0
250
500
750
1 000
1 250
1 500
1 750
2 000
2 250
2 500
2 750
3 000
Number of shares traded per month, thousands
SAJJMAMFJDNOSAJJMAMFJDNO0
5
10
15
20
25
30
35
40
45
50
55
60
OMX Stockholm Consumer Goods_PI
OMX Stockholm PI
Midsona B2015 2016
Price Turnover
2017
Source: SIX Financial Information

M I DSONA AB (PUBL) *CORPORATE REGISTRATION NUM BER 556241 -5322 I NTERI M REPORT, JANUARY–SEPTEM BER 2017 7
OwnershipStena Adactum AB was the largest shareholder with 23.8 percent of the capital and 28.4 percent of the voting rights on 30 September 2017. The ten largest shareholders in Midsona AB (publ) are shown in the table.
The ten largest shareholders in Midsona AB (publ) Number of shares
Share of capital, %
Share of votes, %
Stena Adactum AB 10,973,169 23.8 28.4
Handelsbanken Funds 3,720,258 8.1 7.3
The Second AP Fund 2,521,257 5.5 5.0
LINC AB 2,083,482 4.5 4.1
Nordea Investment Funds 2,031,905 4.4 4.0
Cliens Funds 1,844,900 4.0 3.6
BPSS PAR/FCP ECHIQUIER 1,785,514 3.9 3.5
Peter Wahlberg and companies 1,534,568 3.3 3.0
Humle Kapitalförvaltning AB 1,169,055 2.5 2.3
Insurance company Avanza Pension 1,004,973 2.2 2.2
Total 28,669,081 62.2 63.4Other shareholders 17,338,983 37.8 36.6
Total 46,008,064 100.0 100.0Source: Euroclear
The total number of shareholders (including nominee-registered) was 6,547 (5,106). In the current quarter, the number of shareholders increased by 533. Foreign ownership amounted to 20.7 percent (18.6) of the shares in the market. More information on the shareholder structure is available at www.midsona.com.
Risks and uncertaintiesIn its operations, the Group is subject to both operational and financial risks that may affect profits to a greater or lesser extent. The assessment is that no new significant risks or uncertainties have arisen. For a detailed discussion of risks and uncertainties, please refer to the 2016 Annual Report.
Public takeover bidOn 15 May, Midsona AB (publ) made a public takeover bid to the shareholders in Bringwell AB (publ) to transfer all shares to Midsona. The Bringwell share was traded on First North, OMX Nasdaq Stockholm. Midsona considered there to be a strong industrial and financial motive for the transaction. Bringwell’s product portfolio and sales channels complemented Midsona well. For full terms of the public offer, see the press release on 15 May 2017 and published prospectus on 12 June 2017, available at www.midsona.com.
Midsona announced on 4 July that all terms of the offer to the shareholders of Bringwell AB were fulfilled, which meant that the offer was being completed. When the initial acceptance period expired on 4 July, shareholders in Bringwell had agreed to transfer a total of 243,625,709 shares due to the offer, corresponding to approximately 94.4 percent of the total number of outstanding shares and votes in Bringwell. Midsona also extended the acceptance period for the offer until 18 July. When the extended acceptance deadline expired, shareholders in Bringwell had agreed to transfer an additional 9,926,059 shares due to the offer, corresponding to approximately 3.8 percent of the total number of shares out-standing and votes in Bringwell. In total, 61.1 percent has been transferred for payment in the form shares and 37.1 percent in the form of cash payment. After the extended acceptance period, Midsona requested forced redemption of the remaining shares. In connection with taking possession of the shares in Bringwell AB, the share was delisted from First North, OMX Nasdaq Stockholm.
For the complete acquisition analysis of Bringwell, see Note 7 Acquisition of operations.
Malmö, 20 October 2017Midsona AB (publ)
BOARD OF DIRECTORS

M I DSONA AB (PUBL) *CORPORATE REGISTRATION NUM BER 556241 -5322 I NTERI M REPORT, JANUARY–SEPTEM BER 2017 8
Report of Review of Interim Financial InformationIntroductionWe have reviewed the Interim Report of Midsona AB (publ) for the period 1 January 2017 to 30 September 2017. The Board of Directors and the CEO are responsible for the preparation and presentation of the Interim Report in accordance with IAS 34 and the Swedish Annual Accounts Act. Our responsibility is to express a conclusion regarding the Interim Report based on our review.
Scope and focus of reviewWe conducted our review in accordance with the International Standard on Review Engagements ISRE 2410, Review of Interim Report Performed by the Independent Auditor of the Entity. A review consists of making inquiries, primarily of persons responsible for financial and accounting matters, and applying analytical and other review procedures. A review has a different focus and is considerably smaller in scope than an audit conducted in accordance with ISA and other generally accepted auditing standards. The procedures performed in a review do not enable us to obtain assurance that we would become aware of all significant matters that might be identified in an audit. Consequently, the conclusion based on a review does not give the same level of assurance as a conclusion based on an audit.
ConclusionBased on our review, nothing has come to our attention that causes us to believe that the Interim Report is not prepared, in all material respects, in accordance with IAS 34 and the Swedish Annual Accounts Act, regarding the Group, and with the Swedish Annual Accounts Act, regarding the Parent Company.
Malmö, 20 October 2017Deloitte AB
Per-Arne PetterssonAUTHORISED PUBLIC ACCOUNTANT
Urtekram launched a new organic series of 18 different superfood pro-ducts on the Danish market, which are abundant in natural nutrients.

M I DSONA AB (PUBL) *CORPORATE REGISTRATION NUM BER 556241 -5322 I NTERI M REPORT, JANUARY–SEPTEM BER 2017 9
Financial statementsSummary consolidated income statement
SEK million Note July–Sept 2017
July–Sept 2016
Jan–Sept2017
Jan–Sept 2016
Rolling 12-month
Full year 2016
Net sales 3 579 522 1,594 1,223 2,115 1,744
Expenses for goods sold –374 –348 –1,056 –790 –1,393 –1,127
Gross profit 205 174 538 433 722 617Selling expenses –118 –107 –313 –269 –421 –377
Administrative expenses –62 –44 –137 –107 –179 –149
Other operating income 0 0 2 2 5 5
Other operating expenses –4 –7 –6 –9 –11 –14
Operating profit 3 21 16 84 50 116 82Financial income 0 1 0 1 0 1
Financial expenses –5 –9 –18 –18 –25 –25
Profit before tax 16 8 66 33 91 58Tax on profit for the period –5 –1 –16 –4 –25 –13
Profit for the period 11 7 50 29 66 45
Profit for the period is divided between:
Parent Company shareholders (SEK million) 11 7 50 29 66 45
Earnings per share before and after dilution attributable to Parent Company shareholders (SEK) 0,25 0,25 1,15 1,02 1,54 1,42
Number of shares (thousands)
On the balance sheet date 46,008 28,431 46,008 28,431 46,008 42,646
Average during the period 45 261 28 431 43 518 28 431 42 863 31 547
Summary consolidated statement of comprehensive income
SEK million July–Sept 2017
July–Sept 2016
Jan–Sept2017
Jan–Sept 2016
Rolling 12-month
Full year 2016
Profit for the period 11 7 50 29 66 45
Items that have or can be reallocated to profit for the year
Translation differences for the period on translation of foreign operations –6 49 –16 68 –28 56
Other comprehensive income for the period –6 49 –16 68 –28 56
Comprehensive income for the period 5 56 34 97 38 101
Comprehensive income for the period is divided between:
Parent Company shareholders (SEK million) 5 56 34 97 38 101
King Markatta expanded its product range with several new organic and Fairtrade-labelled products on the Swedish market.

M I DSONA AB (PUBL) *CORPORATE REGISTRATION NUM BER 556241 -5322 I NTERI M REPORT, JANUARY–SEPTEM BER 2017 10
Summary consolidated balance sheetSEK million Note 30 Sept
2017 30 Sept
2016 31 Dec
2016Intangible fixed assets 4 2,134 1,922 1,940Tangible fixed assets 59 55 55Non-current receivables 3 2 2Deferred tax assets 97 85 82Fixed assets 2,293 2,064 2,079Inventories 263 235 244Accounts receivable 254 246 209Tax receivables 2 – 1Other receivables 5 6 2 0Prepaid expenses and accrued income 20 37 22Cash and cash equivalents 74 101 65Current assets 619 621 541Assets 2,912 2,685 2,620
Share capital 230 142 213Additional paid-up capital 627 135 466Reserves 15 43 31Profit brought forward, including profit for the period 642 623 639Shareholders’ equity 1,514 943 1,349Non-current interest-bearing liabilities 676 716 696Other non-current liabilities 5 8 5 4Deferred tax liabilities 211 198 207Non-current liabilities 895 919 907Current interest-bearing liabilities 101 470 31Accounts payable 230 211 212Tax liabilities – 4 –Other current liabilities 5 61 39 38Accrued expenses and deferred income 111 99 83Current liabilities 503 823 364Liabilities 1,398 1,742 1,271Equity and liabilities 2,912 2,685 2,620
Summary consolidated changes in shareholders’ equity
SEK million Share capitalAdditional
paid-up capital
Reserves
Profit brought forward, incl.
profit for the period
Shareholders’ equity
Opening shareholders’ equity 1 January 2016 568 166 –25 168 877
Profit for the period – – – 29 29
Other comprehensive income for the period – – 68 – 68
Comprehensive income for the period – – 68 29 97Reduction of share capital as resolved at the Annual General Meeting 2016 –426 – – 426 –Dividend – –31 – – –31
Transactions with the Group’s owners –426 –31 – 426 –31
Closing shareholders’ equity 30 September 2016 142 135 43 623 943Opening shareholders’ equity 1 October 2016 142 135 43 623 943
Profit for the period – – – 16 16
Other comprehensive income for the period – – –12 – –12
Comprehensive income for the period – – –12 16 4New share issue 71 341 – – 412
Issue expenses – –10 – – –10
Transactions with the Group’s owners 71 331 – – 402
Closing shareholders’ equity 31 December 2016 213 466 31 639 1,349Opening shareholders’ equity 1 January 2017 213 466 31 639 1,349
Profit for the period – – – 50 50
Other comprehensive income for the period – – –16 – –16
Comprehensive income for the period – – –16 50 34New share issue 17 162 – – 179
Issue expenses – –1 – – –1Dividend – – – –47 –47
Transactions with the Group’s owners 17 161 – –47 131
Closing shareholders’ equity 30 September 2017 230 627 15 642 1,514

M I DSONA AB (PUBL) *CORPORATE REGISTRATION NUM BER 556241 -5322 I NTERI M REPORT, JANUARY–SEPTEM BER 2017 1 1
Summary consolidated cash flow statementSEK million July–Sept
2017July–Sept
2016Jan–Sept
2017Jan–Sept
2016Rolling
12-monthFull year
2016Profit before tax 16 8 66 33 91 58
Adjustment for items not included in cash flow 27 21 37 38 51 52
Income tax paid –1 –5 –3 –8 –2 –7
Cash flow from operating activities before changes in working capital 42 24 100 63 140 103Increase (+)/Decrease (–) in inventories –4 0 17 –11 6 –22
Increase (+)/Decrease (–) in operating receivables –1 –26 –15 –62 32 –15
Increase (+)/Decrease (–) in operating liabilities –5 15 –4 21 –22 3
Changes in working capital –10 –11 –2 –52 16 –34
Cash flow from current operations 32 13 98 11 156 69Acquisitions of companies or operations –64 –800 –64 –800 –64 –800
Acquisitions of intangible fixed assets –11 –1 –14 –5 –44 –35
Acquisitions of tangible fixed assets –4 –4 –8 –8 –13 –13
Divestments of tangible fixed assets 0 – 0 0 0 0
Cash flow from investing activities –79 –805 –86 –813 –121 –848
Cash flow after investing activities –47 –792 12 –802 35 –779New share issue – – – – 412 412
Issue expenses –1 – –1 – –11 –10
Loans raised 60 800 60 1,250 60 1,250
Amortisation of loans –10 36 –11 –383 –471 –843
Dividend paid – – –47 –31 –47 –31
Cash flow from financing activities 49 836 1 836 –57 778
Cash flow for the period 2 44 13 34 –22 –1Cash and cash equivalents at beginning of the period 75 53 65 61 101 61
Translation difference in cash and cash equivalents –3 4 –4 6 –5 5
Cash and cash equivalents at end of the period 74 101 74 101 74 65
Summary income statement, Parent Company SEK million July–Sept
2017July–Sept
2016Jan–Sept
2017Jan–Sept
2016Rolling
12-monthFull year
2016Net sales 8 6 24 17 35 28
Selling expenses 0 0 0 0 0 0
Administrative expenses –12 –9 –36 –28 –45 –37
Other operating income 0 0 0 3 0 3
Other operating expenses 0 –1 0 –4 0 –4
Operating profit –4 –4 –12 –12 –10 –10Profit from participations in subsidiaries – – 14 0 101 87
Financial income 6 12 17 18 18 19
Financial expenses –7 –7 –26 –12 –33 –19
Loss after financial items –5 1 –7 –6 76 77Allocations – – – – 166 166
Profit before tax –5 1 –7 –6 242 243Tax on profit for the period – – 0 – –32 –32
Profit for the period –5 1 –7 –6 210 211
Summary statement of comprehensive income, Parent Company SEK million July–Sept
2017July–Sept
2016Jan–Sept
2017Jan–Sept
2016Rolling
12-monthFull year
2016Profit for the period –5 1 –7 –6 210 211
Other comprehensive income for the period – – – – – –
Comprehensive income for the period –5 1 –7 –6 210 211

M I DSONA AB (PUBL) *CORPORATE REGISTRATION NUM BER 556241 -5322 I NTERI M REPORT, JANUARY–SEPTEM BER 2017 12
Summary balance sheet, Parent Company SEK million 30 Sept
2017 30 Sept
2016 31 Dec
2016 Intangible fixed assets 12 1 1
Tangible fixed assets 2 0 0
Participations in subsidiaries 1,659 1,486 1,405
Receivables from subsidiaries 782 396 742
Deferred tax assets 3 35 3
Financial fixed assets 2,444 1,917 2,150
Fixed assets 2,458 1,918 2,151Receivables from subsidiaries 18 10 462
Other receivables 9 11 8
Cash and bank balances 63 0 25
Current assets 90 21 495
Assets 2,548 1,939 2,646
Share capital 230 142 213
Statutory reserve 58 58 58
Profit brought forward, including profit for the period and other reserves 1,136 481 1,029
Shareholders’ equity 1,424 681 1,300Liabilities to credit institutions 675 715 695
Liabilities to subsidiaries 104 – 481
Non-current liabilities 779 715 1,176Liabilities to credit institutions 100 462 30
Liabilities to subsidiaries 229 73 133
Other current liabilities 16 8 7
Current liabilities 345 543 170
Equity and liabilities 2,548 1,939 2,646
Notes to the financial Statements Note 1 Accounting principles
The consolidated accounts have been prepared in accordance with International Financial Reporting Standards (IFRS) issued by the International Accounting Standards Board (IASB) and interpretations of the International Financial Reporting Interpretations Committee (IFRIC). Furthermore, recommendation RFR 1 Supplementary Accounting Rules for Groups, from the Swedish Financial Reporting Board, has been applied.
With regard to the Group, this Interim Report has been prepared in accord-ance with IAS 34 Interim Financial Reporting and the Annual Accounts Act (ÅRL). Disclosures in accordance with IAS 34 Interim Financial Reporting are provided throughout this document. The Parent Company’s accounts are prepared in accordance with the Annual Accounts Act (ÅRL) and recommendation RFR 2 Accounting for Legal Entities, from the Swedish Financial Reporting Board, . The statements published by the Swedish Financial Reporting Board concerning listed companies are also applied, meaning that the Parent Company must apply all EU-approved IFRS and state-ments as far as possible within the framework of the Annual Accounts Act, the Pension Protection Act and taking the relationship between accounting and taxation into account.
The ESMA Guidelines for Alternative Performance Measures (APM) are ap-plied, entailing expanded disclosures on key figures and performance measures.
The new standards and the amendments and revisions to standards and new interpretations (IFRIC) that came into effect on 1 January 2017 had no impact on the Group’s accounting for financial year of 2017. In other regards, the same accounting principles and calculation methods have been applied as in the latest annual report. For detailed information on the accounting
principles, please see Note 1 on page 62 of the 2016 Annual Report. A number of new standards, amendments and interpretations of standards
enter into force for fiscal years beginning after 1 January 2017 and are not applied when preparing these financial reports. One of these new standards, IFRS 15 Revenues from Contracts with Customers will replace existing standards for revenue recognition. IFRS 15 represents a revenue recognition model (five-step-model) based on when the control of a product or service is transferred to the customer. The standard is applicable for fiscal years commencing 1 January 2018 or later with earlier application allowed. The Group has initiated a project relating to IFRS 15 and identified the phases of impact assessment, implemen-tation and control and monitoring for this project. An impact assessment is currently being conducted of the impact of IFRS 15 on the Group’s revenue recognition principles, which includes a review of significant revenue streams based on an analysis of a number of customer contracts, which have been assessed to be both significant and representative of the respective revenue stream. In conjunction with this, an IT assessment of the IT environment is being conducted to ensure relevant additional information under IFRS 15 can be generated, as well as an evaluation of processes and controls. The actual effect on the Group’s financial statements has not yet been quantified at the time of the nine-month report, but based on the current status of the project, it is estimated that the adoption of IFRS 15 will not have any significant effects on the financial statements. By the latest point in time at the end of the fourth quarter, the company has determined that a final assessment of the effects of IFRS 15 can be presented. There is no intention to apply the standard in advance.
M I DSONA AB (PUBL) *CORPORATE REGISTRATION NUM BER 556241 -5322 I NTERI M REPORT, JANUARY–SEPTEM BER 2017 13
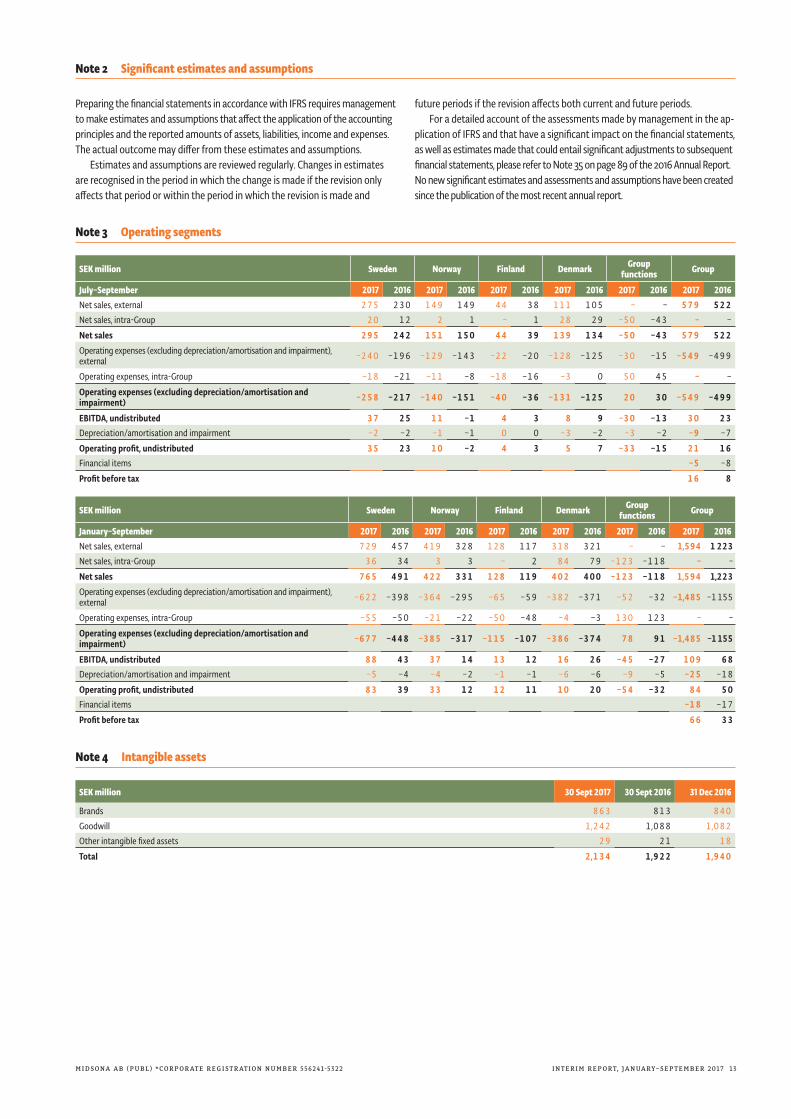
Note 2 Significant estimates and assumptions
Preparing the financial statements in accordance with IFRS requires management to make estimates and assumptions that affect the application of the accounting principles and the reported amounts of assets, liabilities, income and expenses. The actual outcome may differ from these estimates and assumptions.
Estimates and assumptions are reviewed regularly. Changes in estimates are recognised in the period in which the change is made if the revision only affects that period or within the period in which the revision is made and
future periods if the revision affects both current and future periods.For a detailed account of the assessments made by management in the ap-
plication of IFRS and that have a significant impact on the financial statements, as well as estimates made that could entail significant adjustments to subsequent financial statements, please refer to Note 35 on page 89 of the 2016 Annual Report.No new significant estimates and assessments and assumptions have been created since the publication of the most recent annual report.
Note 3 Operating segments
SEK million Sweden Norway Finland Denmark Group functions Group
July–September 2017 2016 2017 2016 2017 2016 2017 2016 2017 2016 2017 2016Net sales, external 275 230 149 149 44 38 111 105 – – 579 522Net sales, intra-Group 20 12 2 1 – 1 28 29 –50 –43 – –
Net sales 295 242 151 150 44 39 139 134 –50 –43 579 522
Operating expenses (excluding depreciation/amortisation and impairment), external –240 –196 –129 –143 –22 –20 –128 –125 –30 –15 –549 –499
Operating expenses, intra-Group –18 –21 –11 –8 –18 –16 –3 0 50 45 – –
Operating expenses (excluding depreciation/amortisation and impairment) –258 –217 –140 –151 –40 –36 –131 –125 20 30 –549 –499
EBITDA, undistributed 37 25 11 –1 4 3 8 9 –30 –13 30 23Depreciation/amortisation and impairment –2 –2 –1 –1 0 0 –3 –2 –3 –2 –9 –7
Operating profit, undistributed 35 23 10 –2 4 3 5 7 –33 –15 21 16Financial items –5 –8
Profit before tax 16 8
SEK million Sweden Norway Finland Denmark Group functions Group
January–September 2017 2016 2017 2016 2017 2016 2017 2016 2017 2016 2017 2016Net sales, external 729 457 419 328 128 117 318 321 – – 1,594 1 223Net sales, intra-Group 36 34 3 3 – 2 84 79 –123 –118 – –
Net sales 765 491 422 331 128 119 402 400 –123 –118 1,594 1,223
Operating expenses (excluding depreciation/amortisation and impairment), external –622 –398 –364 –295 –65 –59 –382 –371 –52 –32 –1,485 –1 155
Operating expenses, intra-Group –55 –50 –21 –22 –50 –48 –4 –3 130 123 – –
Operating expenses (excluding depreciation/amortisation and impairment) –677 –448 –385 –317 –115 –107 –386 –374 78 91 –1,485 –1 155
EBITDA, undistributed 88 43 37 14 13 12 16 26 –45 –27 109 68Depreciation/amortisation and impairment –5 –4 –4 –2 –1 –1 –6 –6 –9 –5 –25 –18
Operating profit, undistributed 83 39 33 12 12 11 10 20 –54 –32 84 50Financial items –18 –17
Profit before tax 66 33
Note 4 Intangible assets
SEK million 30 Sept 2017 30 Sept 2016 31 Dec 2016
Brands 863 813 840
Goodwill 1,242 1,088 1,082
Other intangible fixed assets 29 21 18
Total 2,134 1,922 1,940

M I DSONA AB (PUBL) *CORPORATE REGISTRATION NUM BER 556241 -5322 I NTERI M REPORT, JANUARY–SEPTEM BER 2017 14
Note 5 Fair value and reported in the balance sheet
SEK million 30 Sept 2017 30 Sept 2016 31 Dec 2016
Assets
Financial assets measured at fair value via the income statement
Forward exchange contracts, in foreign currency – 0 0
Financial instruments not measured at fair value
Other receivables 6 2 0
Total other receivables 6 2 0
LiabilitiesFinancial assets measured at fair value via the income statement
Forward exchange contracts, in foreign currency – – 0
Interest rate swaps 1 2 2
Financial instruments not measured at fair value
Other non-current and current liabilities 68 42 40
Total other non-current and current liabilities 69 44 42
The Group holds financial instruments such as forward currency contracts that are recorded at fair value in the balance sheet. For all contracts, fair value has been determined based directly or indirectly on observable market data, that is, level 2 in accordance with IFRS 13. Assets at fair value are recognised as other re-ceivables in the consolidated balance sheet. Liabilities at fair value are recognised
as other non-current liabilities and other current liabilities. In all material respects, the fair value of other financial instruments is consistent with their book value. For further information please refer to Note 32 on page 86 of the 2016 Annual Report.
Note 6 Pledged assets and contingent liabilities
SEK million 30 Sept 2017 30 Sept 2016 31 Dec 2016
Pledged assets
Chattel mortgages – 2 –
Blocked bank balances 2 2 4
Net assets in subsidiaries 1,728 1,434 1,394
Others 4 120 3
Total 1,734 1,558 1,401
Contingent liabilitiesGuarantees 27 – 15
Total 27 – 15
Note 7 Acquisitions of operations
On 4 July, a controlling influence over Bringwell AB and its subsidiaries was acquired, which have a leading position in personal care products (food supple-ments, health foods, skin care and herbal medicines) and OTC drugs (non-prescription drugs) in the Nordic countries, see section Public Takeover Bid, page 7. The acqui-sition strengthens Midsona’s position in the pharmacy and healthcare specialised retail trade in the Nordic market and creates significant synergies. The acquisition will provide Midsona with, among other things, access to the brands Eskimo-3, Kan Jang, Mivitotal and Movo.
The acquisition analysis was prepared such that 100 percent of the shares in Bringwell AB were acquired. The purchase consideration amounted to SEK 279 million, which was partly paid in cash at SEK 96 million, and partly with newly is-sued shares valued at SEK 179 million. The remaining consideration transferred of SEK 4 million comprises a debt to shareholders in Bringwell, which holds
shares subject to compulsory redemption. The acquisition was financed through existing credit facilities, an increase in existing credit facilities by SEK 60 million and a issue in kind of 3,361 584 Series B shares in Midsona at SEK 53.25 per share. Issue expenses amounting to SEK 1 million were offset by the increase in share-holders’ equity.
The acquired operations are consolidated in the Midsona Group as of 4 July 2017 and are included in all five operating segments in the segment reporting – Sweden, Norway, Finland, Denmark and Group-wide operations. From the acquisition date until 30 September 2017, the acquired business contributed SEK 70 million to the Group’s net sales. If the acquisition had occurred on 1 January 2017, estimated consolidated net sales would have amounted to SEK 1,735 million for the period January–September 2017.

M I DSONA AB (PUBL) *CORPORATE REGISTRATION NUM BER 556241 -5322 I NTERI M REPORT, JANUARY–SEPTEM BER 2017 15
Effects of acquisitions The acquired company’s net assets on the acquisition date, SEK million Fair
valueIntangible fixed assets 40
Tangible fixed assets 5
Financial fixed assets 0
Deferred tax assets 32
Inventories 39
Accounts receivable 32
Other receivables 4
Prepaid expenses and accrued income 4
Cash and cash equivalents 32
Deferred tax liabilities –10
Other non-current liabilities –2
Current interest-bearing liabilities –13
Accounts payable –31
Other current liabilities –4
Accrued expenses and deferred income –23
Total 105Consolidated goodwill 174
Total 279
Transferred consideration, SEK million Fair value
Cash 96
Shares 179
Debt for shares under compulsory redemption 4
Total 279
The fair value of identified assets and liabilities net amounted to SEK 205 million, of which SEK 40 million was attributed to brands, SEK 9 million to deferred tax liabilities and SEK 174 million to goodwill after the reduction of existing surplus values in Bringwell of SEK 201 million and a deferred tax liability of SEK 19 million. Brands valued at SEK 40 million are estimated to have a useful life of 20 years. The goodwill of SEK 174 million reported is not expected to be tax deductible. This corresponds to the acquired the company’s market position in the Nordic market for personal care products and OTC drugs, employee competence and experience in the industry as well as expected synergies of a total of approxi-
mately SEK 50–60 million annually. The fair value of accounts receivable amounted to SEK 32 million and was fully settled. Acquisition-related expenses amounted to SEK 5 million and are reported as other operating expenses in the period’s earnings for the third quarter of 2017.
The acquired operations will be integrated gradually with the Midsona Group’s existing businesses. The integration resulted in restructuring expenses of SEK 17 million, which affected the period’s earnings for the third quarter of 2017.
The acquisition analysis that has been prepared is preliminary.
DefinitionsMidsona presents certain financial measures in the Interim Report that are not defined under IFRS. Midsona considers these measures to provide useful supple-mental information to investors and the company’s management as they facili-tate the evaluation of the company’s performance. Because not all companies calculate financial measures in the same way, these are not always comparable to
the measures used by other companies. Accordingly, these financial measures should not be considered a substitute for measurements as defined under IFRS. For the definition and purpose each measure not defined under IFRS, please see page 108 in the 2016 Annual Report. The following table presents IFRS reconciliations.
IFRS reconciliations, Group
EBITDA – operating profit before amortisation/depreciation and impairment of tangible and intangible fixed assets1
SEK million July–Sept 2017
July–Sept 2016
Jan–Sept2017
Jan–Sept 2016
Rolling 12-month
Full year 2016
Operating profit 21 16 84 50 116 82
Amortisation of intangible assets 6 4 17 11 22 16
Depreciation of tangible fixed assets 3 3 8 7 10 9
EBITDA 30 23 109 68 148 107Non-recurring items² 22 19 22 20 29 27
EBITDA, before non-recurring items 52 42 131 88 177 134¹There were no impairments on tangible fixed assets and intangible fixed assets included in operating income for each period.
² Specification of non-recurring itemsSEK million July–Sept 2017 July–Sept 2016 Jan–Sept 2017 Jan–Sept 2016 Rolling 12-month Full year 2016Restructuring expenses 17 13 17 13 24 20Acquisition-related expenses 5 6 5 7 5 7Total 22 19 22 20 29 27

M I DSONA AB (PUBL) *CORPORATE REGISTRATION NUM BER 556241 -5322 I NTERI M REPORT, JANUARY–SEPTEM BER 2017 16
Net debt – interest-bearing provisions and interest-bearing liabilities less cash and cash equivalents, including short-term investments
SEK million 30 Sept 2017
30 Sept 2016
31 Dec 2016
Non-current interest-bearing liabilities 676 716 696
Current interest-bearing liabilities 101 470 31
Cash and cash equivalents¹ –74 –101 –65
Net debt 703 1,085 662¹ Some short-term investments, equivalent to cash and cash equivalents, were not available at the end of each period.
Average capital employed – Total equity and liabilities less interest-bearing liabilities and deferred tax liability at the end of the period plus total shareholders’ equity and liabilities less interest-bearing liabilities and deferred tax liability at the beginning of the period divided by 2
SEK million July–Sept 2017
July–Sept 2016
Jan–Sept2017
Jan–Sept 2016
Rolling 12-month
Full year 2016
Equity and liabilities 2,912 2,685 2,912 2,685 2,912 2,620
Other non-current liabilities –8 –5 –8 –5 –8 –4
Deferred tax liabilities –211 –198 –211 –198 –211 –207
Accounts payable –230 –211 –230 –211 –230 –212
Other current liabilities –61 –43 –61 –43 –61 –38
Accrued expenses and deferred income –111 –99 –111 –99 –111 –83
Capital employed 2,291 2,129 2,291 2,129 2 291 2,076Capital employed at the beginning of the period 2,058 1,238 2,076 1,196 2 129 1,196
Average capital employed 2,175 1,684 2,184 1,663 2,210 1,636
Return on capital employed – Profit before tax plus financial expenses in relation to average capital employed
SEK million Rolling 12-month
Full year 2016
Profit before tax 91 58Financial expenses 25 25
Profit before taxes, excluding financial expenses 116 83Average capital employed 2,210 1,636
Return on capital employed, % 5.2 5.1
Average shareholder’s equity – total shareholder’s equity at the end of the period plus total shareholder’s equity at the beginning of the period divided by 2
SEK million July–Sept 2017
July–Sept 2016
Jan–Sept2017
Jan–Sept 2016
Rolling 12-month
Full year 2016
Shareholders’ equity 1,514 943 1,514 943 1,514 1,349Shareholders’ equity at the beginning of the period 1,331 887 1,349 877 943 877
Average shareholder’s equity 1,423 915 1,432 910 1,229 1,113
Return on equity – profit for the period in relation to average shareholders’ equity
SEK million Rolling 12-month
Full year 2016
Profit for the period 66 45Average shareholder’s equity 1,229 1,113
Return on equity, % 5.4 4.0
One of Frigg’s product launches in Sweden is thin organic corn cakestopped with chocolate in two varieties –milk chocolate and dark chocolate sea salt.
M I DSONA AB (PUBL) *CORPORATE REGISTRATION NUM BER 556241 -5322 I NTERI M REPORT, JANUARY–SEPTEM BER 2017 17
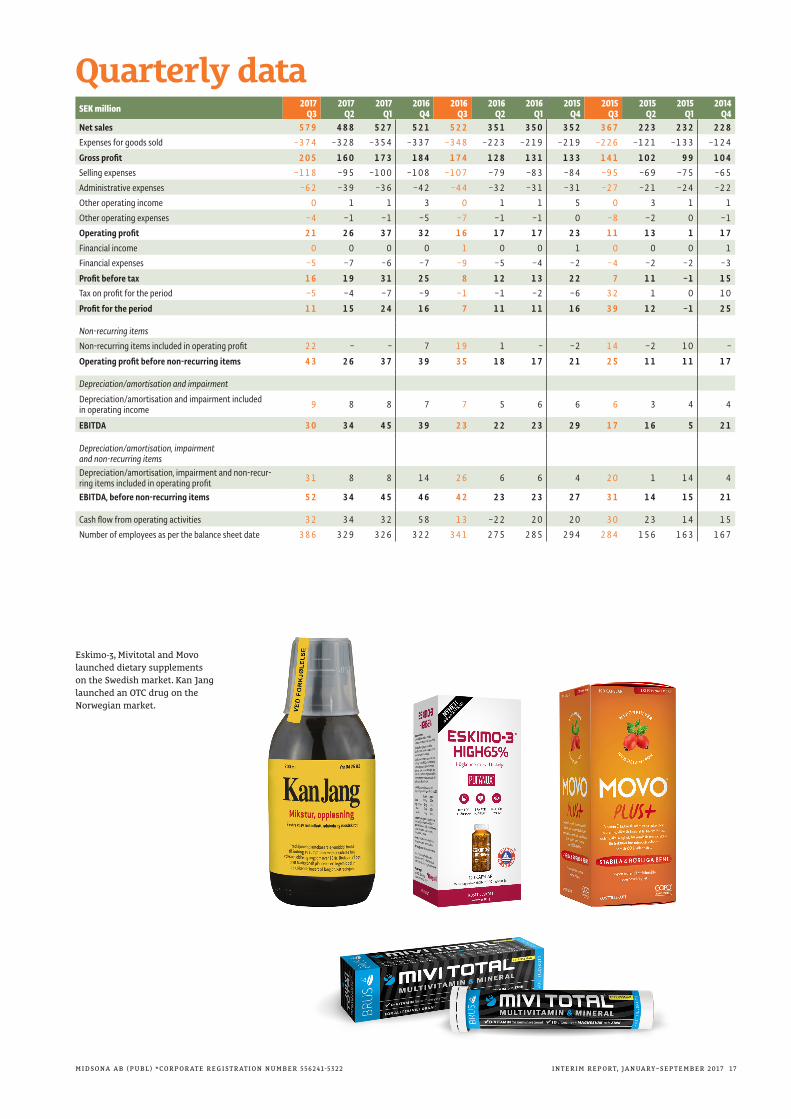
Quarterly data
SEK million 2017 Q3
2017 Q2
2017Q1
2016 Q4
2016 Q3
2016 Q2
2016 Q1
2015 Q4
2015 Q3
2015 Q2
2015 Q1
2014 Q4
Net sales 579 488 527 521 522 351 350 352 367 223 232 228Expenses for goods sold –374 –328 –354 –337 –348 –223 –219 –219 –226 –121 –133 –124
Gross profit 205 160 173 184 174 128 131 133 141 102 99 104Selling expenses –118 –95 –100 –108 –107 –79 –83 –84 –95 –69 –75 –65
Administrative expenses –62 –39 –36 –42 –44 –32 –31 –31 –27 –21 –24 –22
Other operating income 0 1 1 3 0 1 1 5 0 3 1 1
Other operating expenses –4 –1 –1 –5 –7 –1 –1 0 –8 –2 0 –1
Operating profit 21 26 37 32 16 17 17 23 11 13 1 17
Financial income 0 0 0 0 1 0 0 1 0 0 0 1
Financial expenses –5 –7 –6 –7 –9 –5 –4 –2 –4 –2 –2 –3
Profit before tax 16 19 31 25 8 12 13 22 7 11 –1 15Tax on profit for the period –5 –4 –7 –9 –1 –1 –2 –6 32 1 0 10
Profit for the period 11 15 24 16 7 11 11 16 39 12 –1 25
Non-recurring items
Non-recurring items included in operating profit 22 – – 7 19 1 – –2 14 –2 10 –
Operating profit before non-recurring items 43 26 37 39 35 18 17 21 25 11 11 17
Depreciation/amortisation and impairment
Depreciation/amortisation and impairment included in operating income 9 8 8 7 7 5 6 6 6 3 4 4
EBITDA 30 34 45 39 23 22 23 29 17 16 5 21
Depreciation/amortisation, impairment and non-recurring itemsDepreciation/amortisation, impairment and non-recur-ring items included in operating profit 31 8 8 14 26 6 6 4 20 1 14 4
EBITDA, before non-recurring items 52 34 45 46 42 23 23 27 31 14 15 21
Cash flow from operating activities 32 34 32 58 13 –22 20 20 30 23 14 15
Number of employees as per the balance sheet date 386 329 326 322 341 275 285 294 284 156 163 167
Eskimo-3, Mivitotal and Movo launched dietary supplements on the Swedish market. Kan Jang launched an OTC drug on the Norwegian market.

M I DSONA AB (PUBL) *CORPORATE REGISTRATION NUM BER 556241 -5322 I NTERI M REPORT, JANUARY–SEPTEM BER 2017 18
This report is available in Swedish and English. In case of any discrepancies between the Swedish and English versions, the Swedish version is considered the official version.
Financial calendarJAN FEB MAR APR MAY JUN JUL AUG SEP OC T NOV DEC
Interim Report, January–March 2018
25 April 2018
Interim Report, January–September 2018
25 October 2018
Interim Report, January–June 2018
20 July 2018
Year-end Report 20179 February, 2018
This is MidsonaStrong brands with a focus on organicMidsona is one of the leading consumer goods companies in the Nordic region operating in a growing market for health and well-being. Our attractive product portfolio, with well-known products, focuses on making it easier for all people to make their own contribution to a healthier everyday life. A growing proportion of the product portfolio has an organic profile. The business model is based on strong brands with good market positions, innovation and an effective marketing and distribution structure. Midsona series A and B share have been listed on the Nasdaq Stockholm exchange since 1999, in the FMCG sector.
Clear visionOur vision is to become the Nordic region’s leading company in health and well-being.
Clear strategies• We prioritise strong proprietary brands together with a select number
of licenced brands, on which we are focusing in the primary markets of Sweden, Denmark, Norway and Finland. Our brands are to hold the first or second position in their categories. The main reason for this is the existence of internal brands within the retail industry, private-label, which will have a leading brand that drives sales within a category.
• Cost-efficient value chain We work continuously to adapt and streamline the organisation. We continually evaluate our product range in terms of profitability. In recent years, the range has been reduced by a large number of products that do not fit into the Group’s strategy or that are not deemed able to meet the profitability requirements.
• Selective acquisitions }– Acquisitions are an integral part of our operations. In recent years, we have played a major role in con-solidating the market in the Nordic region – and we will continue to do so. We will continue to make acquisitions, and with those that we have made we have shown that we can integrate and develop them with great credibility.
• We offer products that contribute to helping people achieve a healthier life, and we strive to promote healthy ideals, both internally and externally. We want to further develop our position as the expert in the health and well-being in our markets. Our brands and products obviously play a key role in this work. Being sus-tainable is becoming increasingly important, and our consumers are continually placing increasing demands on us. There is a strong link between customers’ and consumers’ interest in organic products and their interest in sustainability and the environment. Effective from 2017, we will report on our sus- tainability efforts.
Long-term financial targetsLong-term financial targets set by the Board of Directors of Midsona AB (publ) in the second quarter of 2013. • Net sales growth of 10 percent through organic growth and
acquisitions. • Operating margin >10 percent. • A ratio between net debt/operating profit before amortisation/
depreciation of intangible and tangible fixed assets (EBITDA) of a multiple <2.
• A dividend over time of >30 percent of profit after tax.

Midsona AB (publ) · Corporate identity number: 556241-5322 · Visiting address: Dockplatsen 16, Malmö, Sweden · Postal address: Box 210 09, SE-200 21 Malmö, Sweden Telephone: +46 40 601 82 00 · [email protected] · www.midsona.com
SPORTS NUTRITION
UrtekramA leading brand in organic food and organically certified body care products, with a broad product portfolio, available primarily through supermarkets in the Nordic region.
Tri TolonenA series of high-quality dietary supple-ments, including vitamins, minerals and antioxidants – sold in supermarkets, healthfood shops and pharmacies in Finland.
FriggsA broad health products brand with a distinct FMCG profile, mainly available in supermarkets in the Nordic region.
Kung MarkattaA leading brand in organic foods, with a broad product portfolio, available prima-rily through supermarkets in Sweden.
DalbladsA series of sports-related products for those who train regularly, as well as elite athletes – sold primarily in supermarkets and by other specialist retailers in Sweden and Norway.
HeliosA leading brand in organic food, with a product portfolio, available primarily through supermarkets and healthfood retailers in Norway.
NaturdietA series of meal alternatives for a healthy lifestyle – sold mainly in supermarkets in Sweden, Finland and Norway. The products are full of vitamins and minerals that the body needs, but always have a low energy content.
MiwanaA series of natural products for the whole family for cold-related nose and throat problems – sold mainly through pharma-cies in Sweden and Norway.
Eight priority brandsMidsona’s operations are based on strong proprietary brands. Five of these play a very central role in the Group’s growth and account for a large portion of sales. These are Urtekram, Friggs, Dalblads, Naturdiet and Kung Markatta. The Tri Tolonen, Helios and Miwana brands are also prioritised.