iSelect FY17 Results Presentation · Diversified and scaled marketplace underpinning growth Health...
29
Investor Briefing Full Year 2017 Results 1
Transcript of iSelect FY17 Results Presentation · Diversified and scaled marketplace underpinning growth Health...

Investor BriefingFull Year 2017 Results
1

2
“Our focus on execution in FY17 clearly
demonstrated the business’ scale and
leverage, delivering strong growth in
earnings and shareholder returns.”Scott Wilson, Managing Director & CEO

FY17 – Growth across key business drivers
UNIQUE VISITORS
800kto 9.8 million
SALES UNITS
13%to 449k
OPERATING CASHFLOW
184%to $30.6 million
EBIT
50%to $22.5 million
*All metrics exclude Money business and financial figures shown are on a reported basis.
3
REVENUE
8%to $185.1 million
CUSTOMER LEADS
7%to 4.3 million
CONVERSION
0.6ppto 10.5%

FY17 Snapshot – Returning to growth, driven by operational leverage
FY17 delivered strong growth in key financial metrics
▪ Operating cashflow up 184% to $30.6m
▪ EBIT up 50% to $22.5m
▪ Revenue up 8% to $185.1m
▪ Strong cash position of $80.4m after returning $27.7m cash to
shareholders
Diversified and scaled marketplace underpinning growth
▪ Health now stabilised, with revenue and EBITDA increasing
▪ Energy & Telco now delivering scale benefits
Increased dividend demonstrates confidence in the Company’s outlook
▪ Increased total FY17 dividend by 120% to 5.5 cps fully franked
4
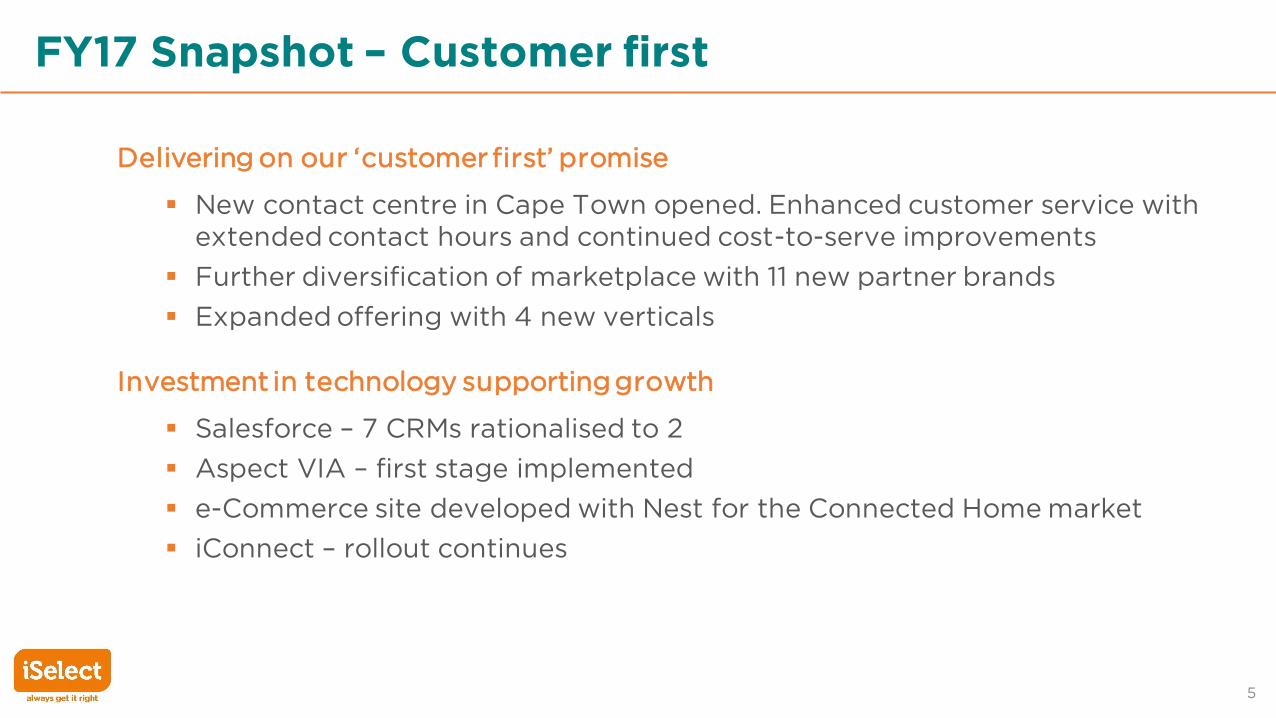
Delivering on our ‘customer first’ promise
▪ New contact centre in Cape Town opened. Enhanced customer service with
extended contact hours and continued cost-to-serve improvements
▪ Further diversification of marketplace with 11 new partner brands
▪ Expanded offering with 4 new verticals
Investment in technology supporting growth
▪ Salesforce – 7 CRMs rationalised to 2
▪ Aspect VIA – first stage implemented
▪ e-Commerce site developed with Nest for the Connected Home market
▪ iConnect – rollout continues
FY17 Snapshot – Customer first
5

Focused execution delivering strategic outcomes
Corporate
Strategy
DIVERSIFY
EFFICIENT
MARKET
PLACE
CUSTOMER
FIRST
EMPLOYER OF
CHOICE
PLATFORMS &
TECH
Initiatives & Outcomes
• Continued growth of non-health segments. 49% of revenue from non-Health;
with Energy & Telco now 27% up from 23% in FY16
• New verticals launched: Travel Insurance, Credit Cards, Mobiles, Pet Insurance
• 11 new partner brands added across Health, Energy, Telco, Homeloans, General
Insurance
• IBNA membership to broaden general insurance offering
• New Cape Town customer contact centre – providing extended contact hours
• Website refreshed and investment in brand
• #GetLifeRight Content Hub launched – guiding customers through their Life
Admin®
• iSelect Academy launched enhancing onboarding & continuous professional
development
• MyAcademy rolled out – online training portal where team members at all levels
can access 24x7 CPD facilities
• Salesforce CRM deployed across the business (ex-Health). Single view of
customer to be available to Consultants
• Aspect VIA – first phase implemented
• E-Commerce site launched for Nest sales
6

Growing the Marketplace – 11 new Partners/Brands
LifeTelco &
EntertainmentMoneyHome Loans
General Insurance
Health Energy
7

Customer First – Brand and Marketing
Sponsorships for Brand
enhancement, Social licence
Continued investment in marketing
& web engagement
Naming sponsor for Melbourne Football Club women’s and men’s teams
Supporting causesMajor Sponsor - iSelect
June 2017 Lifetime Health Cover (LHC) campaign targeted new-to-industry
Health Insurance customers
Launched #GetLifeRight:iSelect’s Content Hub for Life Admin® information
8

Customer First – Brand and Marketing
iSelect Net Promoter Score
0
10
20
30
40
50
60
H1 FY17 H2 FY17
46 46
iSelect NPSall core verticals*
* from H1 FY17 NPS i s measured for all core iSelect verticals, previously only Health
Marketing metrics
demonstrating success
*
* iSelect customers who said we made it “easy or very
easy to handle my request”, even if they didn’t buy a
product
82% EFFORTLESS
SCORE
30% say iSelect would be their first choice when purchasing
94% PROMPTED
BRAND AWARENESS
9

A history of growth
$0m
$50m
$100m
$150m
$200m
$250m
FY14 FY15 FY16 FY17
Revenue
0.0c
1.0c
2.0c
3.0c
4.0c
5.0c
6.0c
7.0c
8.0c
FY14 FY15 FY16 FY17
Earnings Per Share
$0m
$5m
$10m
$15m
$20m
$25m
FY14 FY15 FY16 FY17
EBIT
10
*Compound annual growth rate

11
“iSelect’s scalable platform
delivered enhanced returns in FY17.”Darryl Inns, Chief Financial Officer

5.0
10.0
15.0
20.0
FY14 FY15 FY16 FY17
0.0
10.0
20.0
30.0
FY14 FY15 FY16 FY17
0.0
10.0
20.0
30.0
FY14 FY15 FY16 FY17
50.0
100.0
150.0
200.0
FY14 FY15 FY16 FY17
FY17 earnings growing faster than revenues
▪ Solid revenue growth, underpinned by Non-Health verticals
▪ EBIT improved by 50%, due to benefits derived from cost
efficiencies and controlled levels of investment
▪ Focus on cost and operating efficiency has driven a strong
EBITDA result
▪ NPAT improvement of 27% with improved dividend payout ratio
REVENUE EBITDA
EBIT NPAT
8%33%
50% 27%
$m
$m
$m
$m
12
$185.1m$28.6m
$16.4m$22.5m

0.0
10.0
20.0
30.0
FY15 FY16 FY17
Health – now stabilised and returned to growth
REPORTED ($m)
Health FY17 FY16 Change
Revenue 94.0 90.0 4%
EBITDA 22.5 15.0 50%
Customer Leads (000s) 1,136 1,272 (11%)
Sales Units (000s) 108 117 (8%)
Avg RPS ($) 997 894 12%
Conversion 9.5% 9.2% 0.3pp
▪ Solid year-on-year growth in challenging market conditions
▪ Significant EBITDA growth due to contact centre operational
efficiencies – improved conversion rates and costs controlled
▪ Leads down on the prior period in line with the softening of the
Health market
▪ Continued growth in RPS and Gross Written Premium (GWP) as
focus shifted to changing customer mix
REVENUE
EBITDA
50.0
60.0
70.0
80.0
90.0
100.0
FY15 FY16 FY17
$m
$m
13

0.0
0.5
1.0
1.5
2.0
2.5
3.0
FY15 FY16 FY17
Energy & Telco – scale benefits beginning to flow
REPORTED ($m)
Energy & Telco FY17 FY16 Change
Revenue 50.4 40.2 25%
EBITDA 2.9 1.7 70%
Customer Leads (000s) 2,272 1,762 29%
Sales Units (000s) 286 230 24%
Avg RPS ($) 210 204 3%
Conversion 12.6% 13.1% (0.5pp)
▪ Strong revenue growth across both verticals
▪ Strong EBITDA growth as scale benefits begin to flow
▪ Significant lead growth as a result of increased marketing
investment
▪ Slight conversion decline as a result of Cape Town Contact Centre
upskilling and shift of mix towards Telco
▪ Steady RPS growth across both Energy and Telco
REVENUE
EBITDA
0.0
10.0
20.0
30.0
40.0
50.0
60.0
FY15 FY16 FY17
$m
$m
14

0.0
2.0
4.0
6.0
8.0
10.0
12.0
14.0
FY15 FY16 FY17
Life & General Insurance – growth in GI offsetting decline in Life
REPORTED ($m)
Life and General Insurance FY17 FY16 Change
Revenue 32.6 32.7 0%
EBITDA 9.9 11.9 (17%)
Customer Leads (000s) 710 778 (9%)
Sales Units (000s) 54 48 11%
Avg RPS ($) 503 578 (13%)
Conversion 7.6% 6.2% 1.4pp
▪ Revenue flat on prior year, with growth in the General Insurance
segment offsetting subdued Life business
▪ EBITDA decline due to the level of investment made within the
Life segment for future growth
▪ Solid sales unit growth in General Insurance as a result of
improved conversion and expansion of the product offerings
▪ Decline in RPS due to change in product mix towards General
Insurance
REVENUE
EBITDA
0.0
5.0
10.0
15.0
20.0
25.0
30.0
35.0
FY15 FY16 FY17
$m
$m
15

Exceptional growth in operating cash flow – supporting
growth investment and capital management
▪ Significant growth in operating cash flow at $30.6m as a
result of focus on working capital and cash collection
▪ Increase in free cash while also increasing capital expenditure
investment for future growth
▪ $27.7m cash returned to shareholder across buyback and
dividend
▪ 82% upfront revenue mix maintained
CASH FLOW STATEMENT - REPORTED
$m, Full Year FY17 FY16
Operating Cash flow 30.6 10.8
Capital Expenditure (10.1) (7.7)
Free Cash 20.5 3.1
Investing/Financing cash flow (27.7) 14.0
Net movement in cash (7.2) 17.1
Cash at beginning 87.6 70.5
Cash at end 80.4 87.6
▪ Reduction in receivables following a strong focus on cash
collection and working capital efficiencies
▪ Net asset reduction $9.4m, primarily driven by share buyback
▪ Loss on iMoney investment reduced by 40% as a result of
very strong revenue growth
▪ Strong cash position at $80.4m net of $37.8m in Capex and
capital management initiatives
30 JUNE 2017 BALANCE SHEET - REPORTED
$m FY17 FY16
Cash 80.4 87.6
Receivables 32.8 43.9
Trail commission receivable 112.8 103.7
Other 70.0 63.3
Total assets 296.0 298.5
Total liabilities 70.8 63.9
Net assets 225.2 234.6
16

Capital Management – initiatives enhancing shareholder value
The Dividend Policy has been increased – reflecting
robust cashflows and the Board’s confidence in cash
generation ability
▪ FY17 total fully franked dividend of 5.5 cps – $12.6 m
• Representing a payout ratio of 77% of NPAT in FY17
• Final FY17 dividend 4.0 cps
– Record date: 23 August 2017
– Payment date: 29 September 2017
▪ Dividend Policy: increased to 50% – 80% of reported NPAT
subject to availability of franking credits and cash reserves
On-market buyback
▪ On-market buyback continuing
• 11.1 million shares bought back in FY17 for $20.6m
• Total of 34.1 million shares bought back for $42.9m
0.0
1.0
2.0
3.0
4.0
5.0
6.0
7.0
FY15 FY16 FY17
2.5 cents
5.5 cents
iSelect LimitedDividends Declared
Cents
per
share
17

“iSelect is well positioned to leverage
the scale benefits of its platform to
drive the next phase of growth.”
Scott Wilson, Managing Director & CEO 18

Customer growth accelerating
▪ 16 years to reach 1 million customers,
400,000+ in past 18 months
0
200
400
600
800
1,000
1,200
1,400
1,600
Customer Numbers*
('000)
16 years
18 mths
0%
3%
6%
9%
12%
15%
18%
FY14 FY15 FY16 FY17 Jun-17
15%
Cross-Serve % of Revenue
▪ Cross-serve run rate of 15% at end FY17
* Individual customers who have purchased one or more
products from iSelect
19

Substantial cross-serve potential
1.0
1.2
1.4
1.6
FY14 FY15 FY16 FY17
1.4
iSelect GroupProducts per Customer
0.0
0.5
1.0
1.5
2.0
2.5
3.0
FY15 FY16 Jul-17
2.3
Movers Segment Products per Customer
20

Investing in Customer Contact Centres
Up 24%
Total Contact Centre FTE
Costs in-line with FY16
▪ Total iSelect FTE count in our three customer contact centres increased by 24% from FY16 to FY17
▪ The total staffing cost for our contact centres in FY17 remained in-line with FY16, with the cost per
FTE reducing by a corresponding 19%
▪ New contact centre in Cape Town, South Africa opened in February 2017 for a total investment in
FY17 of approx. $2.8m. Further investment expected for Cape Town in FY18.
▪ Performance of Cape Town contact centre improving and on track with plan
Down 19%
21

Further growth in financial services
HOME LOANS
▪ Growth in sales units of 14% in FY17 set to
continue
▪ Loan book value now over $1 billion
▪ Recognised at Australian Broking Awards 2017,
ranking No. 13 in the “Top 25 Brokerages”.
Finalist in two individual categories
MONEY - INFOCHOICE
▪ Investment being made to relaunch the
InfoChoice website
22

Technology investment to support next growth phase
Now Soon Future
Phase 1 rolled
out
Integrated customer experience
across voice, mobile, web and
messaging platforms
Voice search
Single view of
Customer
23

Nest Partnership – helping our customers stay safe
▪ iSelect is the exclusive launch partner for Nest in Australia
▪ Nest provides safer homes for our customers – reducing risks, increasing security
▪ Partnership enables iSelect to leverage substantial market opportunities across verticals
▪ Places iSelect at the forefront of the Internet of Things (IoT) revolution in Australia, with
potential market size exceeding $5 billion by 2021*
▪ iSelect e-Commerce Store developed to sell Nest products
*Telsyte IoT Home Market Study 201724

iSelect is well placed to continue growth trajectory
FY17: SCALE BENEFITS
▪ Earnings growing faster than revenues
▪ Energy & Telco the clear standout
▪ Exceptional growth in operating cash flow supporting growth investments, capital
management and increasing dividend
REVENUE DIVERSIFICATION SET TO CONTINUE
▪ Energy market dynamics conducive to out-performance
▪ Broadband and Nest Connected Home driving accelerating growth with nbn rollout
▪ Further expansion of new verticals and products
FY18: GROWTH TO CONTINUE
▪ Health expected to continue profitable growth
▪ Energy & Telco scale leverage
▪ Continued investment in marketing and technology to underpin further growth
25

QuestionsFull Year 2017 Results
26

AppendixFull Year 2017 Results
27

Corporate Strategy
Australia’s Life Admin Store®V
isio
nC
orp
ora
te
Str
ate
gy
Efficient
Market
Place
Customer
FirstEmployer
of Choice
Platforms
and TechDiversify
• Increase New Verticals
• Develop Leadership and Capability
• Diversify Customer Lead Sources
• Reduce Cost to Serve
• Expand Lifetime Value of Customer
• Investment in Best-in-class Platforms and Technologies
Init
iati
ve
sLevers
&
Tacti
cs
Cost
Efficiency
Strategic
PartnershipsOrganic
Growth
Inorganic
Growth
Increasing
Shareholder
Value
28

Any references to “Group” in this presentation refer
to iSelect Limited and its controlled entities.
This document is a presentation of general
background information about iSelect’s activities
current at the date of the presentation, 16 August,
2017. It is information in a summary form and does
not purport to be comprehensive.
It is to be read in conjunction with the iSelect
Limited annual report filed with the Australian
Securities Exchange on 16 August, 2017.
This presentation is not a recommendation to buy
iSelect shares. The information provided is not
financial product advice and has been prepared
without taking into account any investor or
potential investor’s investment objectives, financial
circumstances or particular needs and should not
be considered to be comprehensive or to comprise
all the information which a recipient may require in
order to make an investment decision regarding
iSelect shares. You should make your own
assessment and take independent professional
advice in relation to the information and any action
taken on the basis of the information.
The information in this presentation is of a general
nature and has been prepared by iSelect in good
faith and with due care but no representation or
warranty, express or implied, is provided in
relation to the accuracy or completeness of the
information.
Forward-looking statements
This presentation contains forward-looking
statements. The statements in this presentation
are based on an assessment of present economic
and operating conditions and on a number of
assumptions regarding future events and actions
that, at the date of this presentation, are expected
to take place. Such forward-looking statements
are not guarantees of future performance and
involve known and unknown risks, uncertainties,
assumptions and other important factors, many
of which are beyond the control of the Group,
the Directors and management.
The Group cannot and does not give any
assurance that the results, performance or
achievements expressed or implied by the
forward-looking statements contained in this
presentation will actually occur and investors are
cautioned not to place undue reliance on these
forward-looking statements. To the full extent
permitted by law, iSelect disclaims any obligation
or undertaking to release any updates or revisions
to the information contained in this presentation
to reflect any change in expectations or
assumptions.
Non-IFRS information
iSelect's results are reported under International
Financial Reporting Standards (IFRS). Throughout
this presentation, iSelect has included certain non-
IFRS financial information. The information is
presented to assist in making appropriate
comparisons with prior periods and to assess the
operating performance of the business. iSelect
uses these measures to assess the performance of
the business and believes that information is
useful to investors. EBITDA, EBIT, Operating Cash
Conversion and Revenue per Sale (RPS) have not
been audited or reviewed.
Any and all monetary amounts quoted in this
presentation are in Australian dollars (AUD)
except where indicated.
Important notice and disclaimer
29