Implications of the North American Oil Renaissance … · Implications of the North American Oil...
27
Implications of the North American Oil Renaissance on U.S. Refiners Presented by: Tod D. McGreevy Vice - President September 17-18, 2013 M U S E S T A N C I L
-
Upload
trinhkhanh -
Category
Documents
-
view
218 -
download
0
Transcript of Implications of the North American Oil Renaissance … · Implications of the North American Oil...

Implications of the North American Oil Renaissance on
U.S. Refiners
Presented by:
Tod D. McGreevy Vice - President
September 17-18, 2013 M U S E S T A N C I L
MUSE, STANCIL & CO.
▲ Economic and technical expertise combined with an in-depth understanding of the commercial aspects of the global downstream energy industry
• Without exception, our work effort is customized to address each client’s specific issues
▲ Independent energy consulting firm founded in 1984: www.musestancil.com • Offices in Dallas, Houston, and London
▲ Muse also owns 50 percent of OSIA, which develops and licenses software that
interfaces with linear programming (LP) models and other refining and petrochemical planning tools
Business Strategy
Transaction Due Diligence
Project Development
Market Analysis
Expert Services
Asset Valuation and Performance Optimization
E&P Refining Midstream Biofuels
Refining Midstream Biofuels
Refining Midstream Biofuels
International Arbitration Commercial Litigation Royalty and Contract Auditing Property Loss and Business Interruption Insurance
Crude Oil Natural Gas NGLs Biofuels
Refining Midstream Biofuels PIMS Licensee since 1986
-2-

OVERVIEW
▲ NORTH AMERICAN CRUDE OIL SUPPLY OUTLOOK – CURRENT AND FUTURE
▲ NORTH AMERICAN CRUDE OIL MARKET FORECAST • Disposition of North American Crude Oil Supply • Projected Crude Oil Prices
▲ NORTH AMERICAN REFINING OUTLOOK • Prices • Margins • Yield Effects • Light Product Supply
-3-

▲ Total North American crude oil supply is projected to grow by ~4,000 kb/d by 2020
▲ At a high level, the international border can be ignored and total crude oil supply can be partitioned into two key supply regions
• Southern Supply Region: West Texas; Eagle Ford; Gulf of Mexico offshore, plus onshore Gulf Coast
• Northern Supply Region: Western Canada; Bakken; and, Rockies
NORTH AMERICAN TOTAL CRUDE OIL SUPPLY
▲ The U.S. crude oil supply outlook has been generated via a joint effort by Muse Stancil and Crane Energy LLC, a Texas based reservoir engineering firm
▲ The Canadian crude oil outlook is
the very recent CAPP 2013 forecast
0
2,000
4,000
6,000
8,000
10,000
12,000
14,000
2012 2013 2014 2015 2016 2017 2018 2019 2020
kb/d
North American Total Crude Oil Supply
Southern Northern Central East/West Coast
-4-
Source: Muse, Crane Energy, CAPP

▲ Of the ~2,300 kb/d of incremental light crude oil supply, essentially all of it is in the U.S.
• The Bakken (+~600 kb/d), Eagle Ford (+~600 kb/d), and the Permian Basin (+~300 kb/d) are the key North American supply regions for light crude oil
• The new CAPP 2013 forecast has light synthetic supply (not production) falling over time, although conventional light is now growing by ~100 kb/d to 2020
• With additional contributions from the Gulf Coast onshore and offshore, Midcontinent, and the Rockies
▲ About 60 percent of the light
crude supply growth is in the “Southern Supply Region”
NORTH AMERICAN LIGHT CRUDE OIL SUPPLY
Source: Muse, Crane Energy, CAPP
▲ The Gulf of Mexico offshore will also add a significant contribution to medium sour crude oil supply
▲ The situation for the heavy crude oil supply is quite different
• Little of the incremental North American supply outside of Western Canada is heavy
01,0002,0003,0004,0005,0006,0007,0008,0009,000
10,000
2012 2013 2014 2015 2016 2017 2018 2019 2020
kb/d
North American Light and Medium Crude Oil Supply
Southern Northern Central East/West Coast
-5-

▲ Muse uses a highly detailed, LP-based distribution model of the North American crude oil markets to assess the implications of various forward scenarios
▲ The Muse Crude Market Optimization Model can be used to quantify the impact
of differing supply volumes, new pipeline and rail routes, and changing refinery capacities and capabilities over time
▲ The optimization model is seeking to maximize the aggregate netback for all Western Canadian crudes (conventional, synthetic, and heavy) and U.S. crudes
• Refining values are generated outside the optimization model for various grades of Canadian synthetic and heavy sour crudes for the individual demand nodes
• Muse uses the PIMS™ LP modeling system to develop the refining values for the various refineries accessible from Western Canada
• PIMS is the LP modeling system used by most North American refiners
▲ The market scenario presented herein is regarded as a reasonable Base Case • But there are many forward possibilities
FORECASTING THE FUTURE – MUSE APPROACH
-6-

▲ The U.S. Gulf Coast and Northeast Asia will join the Midwest to become key outlets for Canadian heavy crude
▲ Absent Northern Gateway and the Trans Mountain expansion, most of the Asia-bound volumes would be redirected to the U.S. Gulf Coast
• If the west-bound pipelines are not built, the required heavy crude market share on the Gulf Coast will reach very high levels by the middle of the next decade
• Raising substantive issues of a competitive response by the existing heavy crude suppliers
CANADIAN HEAVY CRUDE DISPOSITION
Source: Muse -7-
0
500
1,000
1,500
2,000
2,500
3,000
3,500
4,000
2012 2013 2014 2015 2016 2017 2018 2019 2020
kb/d
Canadian Heavy Crude Oil Disposition
Western Canada Eastern Canada/U.S. RockiesUpper Midwest Lower Midwest Mid-ContinentU.S. West Coast U.S. Gulf Coast Asia
0
200
400
600
800
1,000
1,200
1,400
2012 2013 2014 2015 2016 2017 2018 2019 2020
kb/d
Northern Light Crude to Southern Markets
U.S. Gulf Coast
0200400600800
1,0001,2001,4001,6001,8002,000
2012 2013 2014 2015 2016 2017 2018 2019 2020
kb/d
Northern Light Crude to Inland Markets
Rockies Upper Midwest Lower Midwest Mid-Continent
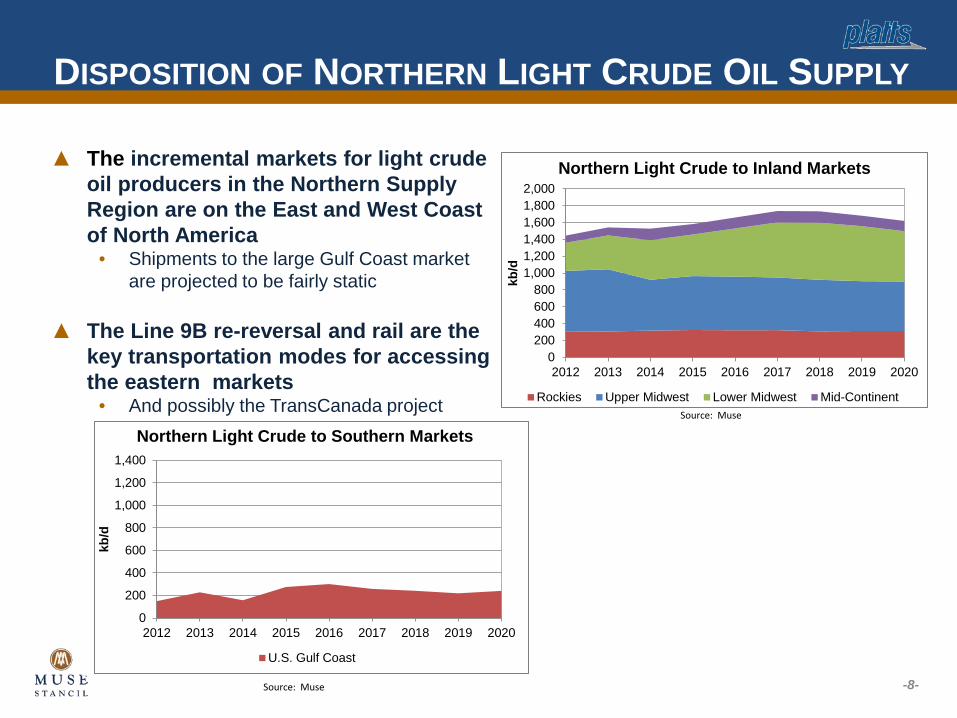
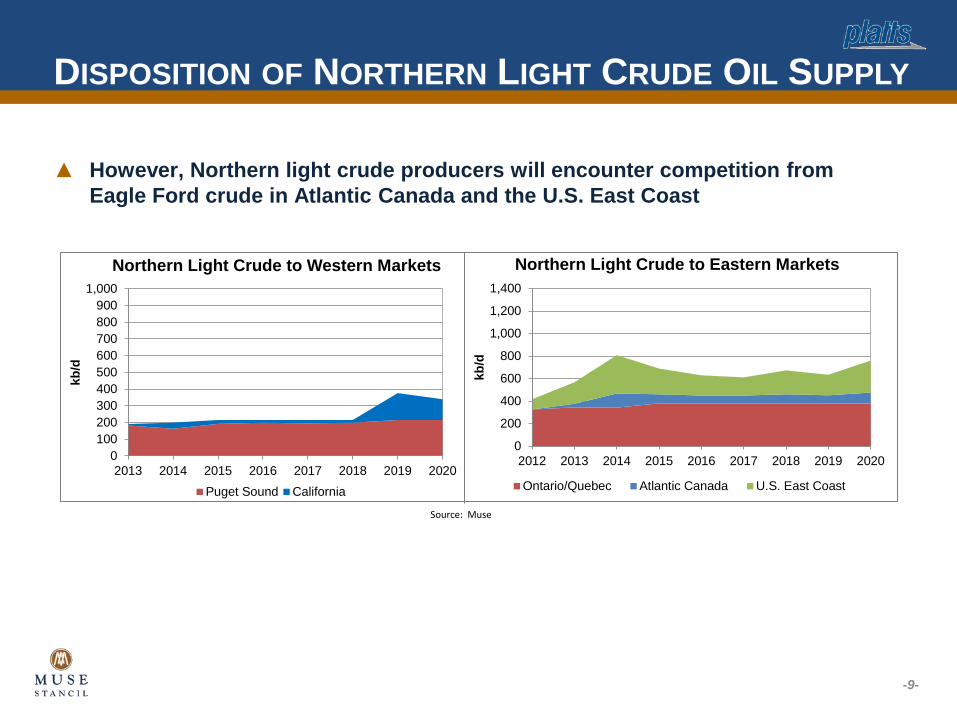
▲ The incremental markets for light crude oil producers in the Northern Supply Region are on the East and West Coast of North America
• Shipments to the large Gulf Coast market are projected to be fairly static
▲ The Line 9B re-reversal and rail are the key transportation modes for accessing the eastern markets
• And possibly the TransCanada project
DISPOSITION OF NORTHERN LIGHT CRUDE OIL SUPPLY
Source: Muse
-8- Source: Muse
0100200300400500600700800900
1,000
2013 2014 2015 2016 2017 2018 2019 2020
kb/d
Northern Light Crude to Western Markets
Puget Sound California
0
200
400
600
800
1,000
1,200
1,400
2012 2013 2014 2015 2016 2017 2018 2019 2020kb
/d
Northern Light Crude to Eastern Markets
Ontario/Quebec Atlantic Canada U.S. East Coast
DISPOSITION OF NORTHERN LIGHT CRUDE OIL SUPPLY
Source: Muse
▲ However, Northern light crude producers will encounter competition from Eagle Ford crude in Atlantic Canada and the U.S. East Coast
-9-

▲ As we’ve seen, total light crude oil supply from the Northern Supply Region to the inland markets is forecast to remain comparatively constant
• And the Midwest is the largest component of the inland market demand segment ▲ However, this masks a significant shift in the precise source of supply to
the inland market
TENSION IN THE MIDWEST
Source: Muse
-10-
0100200300400500600700800900
1,000
2012 2013 2014 2015 2016 2017 2018 2019 2020
kb/d
Bakken to Inland Markets
Rockies Upper Midwest Lower Midwest Mid-Continent
0100200300400500600700800900
1,000
2012 2013 2014 2015 2016 2017 2018 2019 2020
kb/d
Canadian Light/Medium to Inland
Rockies Upper Midwest Lower Midwest Mid-Continent

TENSION IN THE MIDWEST
Source: Muse
▲ The Canadian crude oil producers are projected to lose market share to the inland U.S. producers
• Creating a need to access other markets to the east and west
-11-
0100200300400500600700800900
1,000
2012 2013 2014 2015 2016 2017 2018 2019 2020
kb/d
Rockies Light to Inland Markets
Rockies Lower Midwest Mid-Continent

▲ Rail will remain an important transportation mode for the Williston Basin • Rail shipments of Bakken crude are projected for the entire forecast period • If the major outbound pipeline projects are further delayed, Canadian rail shipments will
continue
▲ A very recent development is the waterborne shipment of Eagle Ford crude to the U.S. East Coast and Atlantic Canada
• Much of the Eagle Ford production is pipelined into Corpus Christi, Texas, from which it must be further transshipped by barge or tanker to other markets
• Eagle Ford shipments to Atlantic Canada can be made on a lower cost, foreign-flagged tanker
NON-TRADITIONAL TRANSPORTATION MODES
Source: Muse
-12-
0
100
200
300
400
500
600
700
2012 2013 2014 2015 2016 2017 2018 2019 2020
kb/d
Rail Shipments
Bakken Canadian Light Canadian Heavy
0
50
100
150
200
250
2012 2013 2014 2015 2016 2017 2018 2019 2020
kb/d
Waterborne Eagle Ford Disposition
U.S. East Coast Atlantic Canada

NORTH AMERICAN CRUDE PRICE FORECAST
-13-

▲ As southbound pipeline capacity is added, WTI is expected to stabilize at about
$7.00/barrel under LLS • This is a combination of about a $4.50/barrel Cushing-Gulf Coast pipeline tariff and a
$2.50/barrel refining quality differential between LLS and WTI • The 2013 WTI price is overstated due to the use of annual average capacity for new pipelines • The 2012 values are a backcast using the model
CONVENTIONAL CRUDE PRICE FORECAST – LLS AND WTI
Source: Muse
-14-
-18.00-16.00-14.00-12.00-10.00-8.00-6.00-4.00-2.000.00
2012 2013 2014 2015 2016 2017 2018 2019 2020
$/bb
l
Key U.S. Benchmarks
LLS (versus Import Parity) WTI (Midland)
NORTH AMERICAN CRUDE OIL MARKET IMPLICATIONS
▲ The North American crude oil markets will remain in flux, particularly for the light crude oil segment, as the rapidly evolving supply picture promises to continue to reshape the crude oil distribution patterns within North America
▲ For the Canadian light oil producer, high capacity access to the eastern and western markets is important
• Rail will continue to play a vital role in transporting crude oil within North America, particularly from the Williston Basin
▲ Light crude on the Gulf Coast is expected to price under import parity for some
time to come
▲ The refiner response is something of a wild card for the light crude oil market – North American refiners will continue to re-configure their refineries to respond to changes in crude supply patterns
• Gulf Coast refiners have already announced plans to expand their Eagle Ford processing capacity
▲ A more difficult forecasting challenge is assessing the market response of the
existing heavy crude oil suppliers to the U.S. Gulf Coast • A resurgence of Venezuelan and Mexican heavy crude oil supply would be interesting
-15-

NORTH AMERICAN REFINING OUTLOOK
-16-

▲ The 3-2-1 crack which tracks a weighted spread between gasoline/diesel and crude oil is not expected to exhibit much growth in real terms over the rest of the decade
MARGIN DRIVERS: 3-2-1 CRACK
-17-
0.00
2.00
4.00
6.00
8.00
10.00
12.00
14.00
2000 2005 2010 2015 2020 2025
$ Pe
r Bar
rel
3-2-1 Crack vs. LLS
NominalReal
Source: Muse
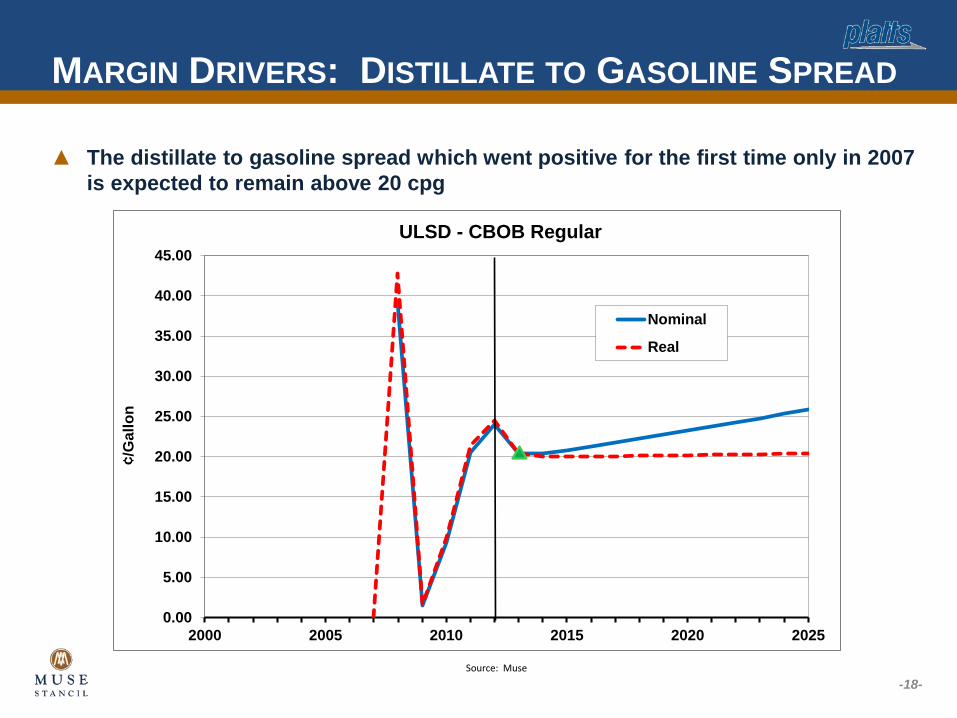
▲ The distillate to gasoline spread which went positive for the first time only in 2007 is expected to remain above 20 cpg
MARGIN DRIVERS: DISTILLATE TO GASOLINE SPREAD
-18-
0.00
5.00
10.00
15.00
20.00
25.00
30.00
35.00
40.00
45.00
2000 2005 2010 2015 2020 2025
¢/G
allo
n
ULSD - CBOB Regular
Nominal
Real
Source: Muse

▲ The chart at the lower right tracks average U.S. Gulf Coast margins for three primary refinery configurations found in the U.S.
• Distillation: Simplest operation that features little downstream conversion/upgrading • Cracking: Mostly finished products but little or no residual oil destruction • Coking: Highest complexity/significant residual oil destruction
REFINERY CONFIGURATION INFLUENCE ON MARGIN
-19-
▲ Coking historically generates the highest margin as the refiners exposure to the heavily discounted fuel oil market is mostly eliminated
▲ Distillation is a narrow margin operation dependent on niche markets and advantaged crude oil supply -5
0
5
10
15
20
25
30
35
$/B
bl
Configuration Margins
Distillation
Cracking
Coking
Source: Muse

▲ Comparing crude oil yields under different processing configurations helps explain the margin differentials on the previous slide
▲ Light Louisiana Sweet (LLS) in a cracking configuration yields a large percentage of gasoline and diesel with a relatively small residual oil cut
• This yield pattern boosts the value of the crude oil versus heavier crudes • Coking LLS however doesn’t provide much incremental value as there is little residual oil in need
of upgrading
CRUDE QUALITY VS. REFINED PRODUCT YIELD
▲ Maya, a heavy crude from Mexico, has a very large residual oil cut that discount its value relative to LLS
• Coking Maya however, changes the refinery’s yield to nearly match that of LLS in a cracking refinery
• The loss of saleable liquid product is typically offset by the market discount
-20-
0
20
40
60
80
100
120
LLS (Cracking) LLS (Coking) Maya (Cracking) Maya (Coking)
Perc
ent Y
ield
on
Cru
de
Heavy Oil Distillate Gasoline LPG
Source: Muse

▲ Cracking and coking configurations require processing to upgrade large volumes of heavy gas oils with FCC the most commonly utilized process in the U.S.
▲ Hydrocracking, however, maximizes the yield of highest valued products (Jet + diesel) vs. FCC upgrading which favors gasoline and olefins production
HEAVY OIL UPGRADING YIELD COMPARISON
-21-
FCCU HydrocrackingLPG 23% 6%Gasoline 58% 37%Distillate Heavy Oil 20% 71%Heavy Oil 8% 4%
0%
20%
40%
60%
80%
100%
120%
Volu
me
Perc
ent Y
ield
on
Feed
Yield Comparison: FCC vs Hydrocracking
Source: Muse
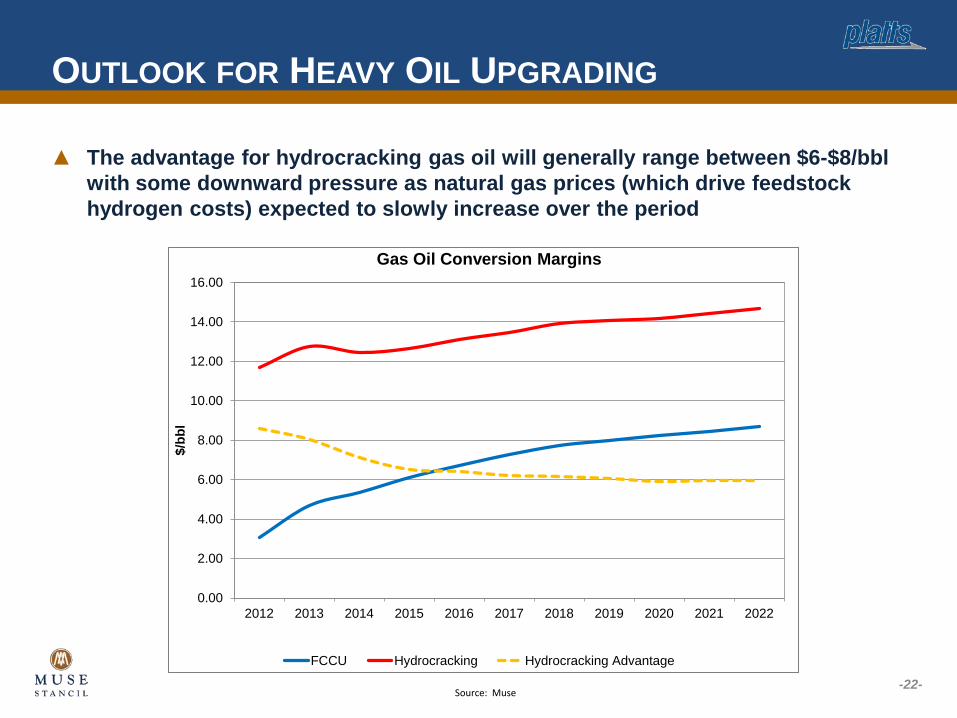
▲ The advantage for hydrocracking gas oil will generally range between $6-$8/bbl with some downward pressure as natural gas prices (which drive feedstock hydrogen costs) expected to slowly increase over the period
OUTLOOK FOR HEAVY OIL UPGRADING
-22-
0.00
2.00
4.00
6.00
8.00
10.00
12.00
14.00
16.00
2012 2013 2014 2015 2016 2017 2018 2019 2020 2021 2022
$/bb
l
Gas Oil Conversion Margins
FCCU Hydrocracking Hydrocracking Advantage
Source: Muse
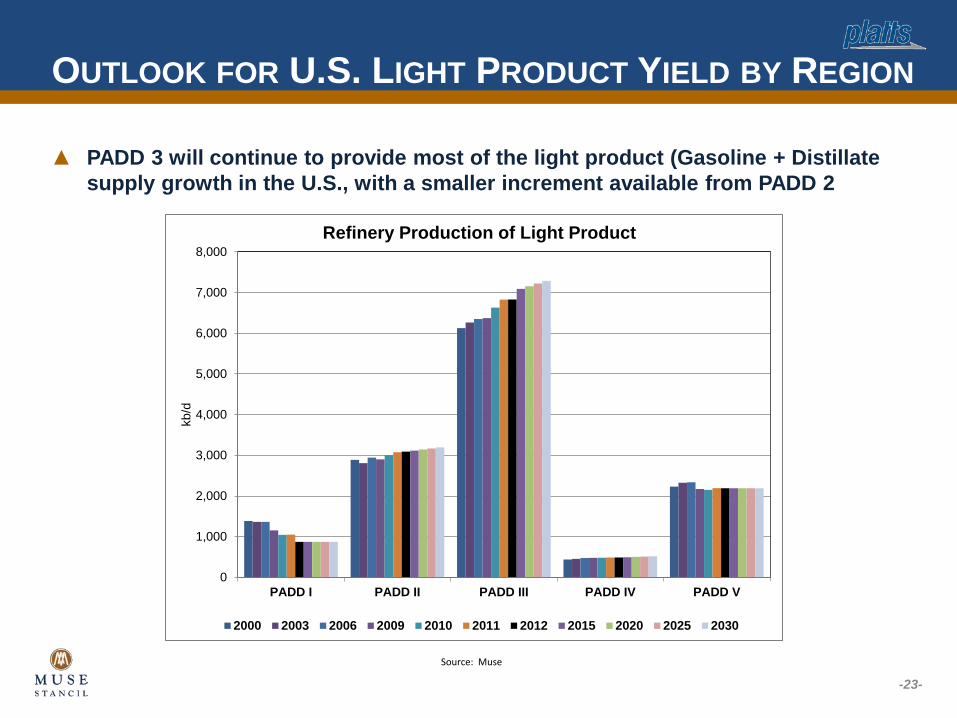
▲ PADD 3 will continue to provide most of the light product (Gasoline + Distillate supply growth in the U.S., with a smaller increment available from PADD 2
OUTLOOK FOR U.S. LIGHT PRODUCT YIELD BY REGION
-23-
0
1,000
2,000
3,000
4,000
5,000
6,000
7,000
8,000
PADD I PADD II PADD III PADD IV PADD V
kb/d
Refinery Production of Light Product
2000 2003 2006 2009 2010 2011 2012 2015 2020 2025 2030
Source: Muse

▲ Gasoline demand destruction will continue apace as driving habits change and CAFE standards increase
• Renewable fuel growth (mostly ethanol) will slow and fall well below the mandated volume later this decade
• Tier 3 gasoline regulations lowering sulfur to 15 ppm won’t be implemented before 2017
U.S GASOLINE OUTLOOK
-24-
0
1,000
2,000
3,000
4,000
5,000
6,000
7,000
8,000
9,000
10,000
RefineryProduction
Ethanol Imports Exports Demand Demand E-85
kb/d
U.S. Gasoline/E85 Supply/Demand
2000 2003 2006 2009 2010 2011 2012 2015 2020 2025 2030
Source: Muse

▲ Diesel is the growth story for U.S. refiners for the foreseeable future • Export growth could likely tail off as the U.S. economy picks up steam, encouraging more
demand growth at home
U.S. DIESEL OUTLOOK
-25-
0
1,000
2,000
3,000
4,000
5,000
6,000
Production Imports Exports Demand
kb/d
U.S. Diesel Supply/Demand Balance
2000 2003 2006 2009 2010 2011 2012 2015 2020 2025 2030
Source: Muse

▲ Diesel demand growth and exports are the story for refiners in an otherwise flat products market
U.S. LIGHT PRODUCT BALANCE OUTLOOK
-26-
0
2,000
4,000
6,000
8,000
10,000
12,000
14,000
16,000
Production Imports Exports Demand
kb/d
Light Product Supply/Demand Balance
2000 2003 2006 2009 2010 2011 2012 2015 2020 2025 2030
Source: Muse
MUSE CRANE STUDY
-27-
Evolving Light Liquids Markets – The Impact of Shale and Tight Sands Productivity on U.S. Midstream and Downstream
Segments and Beyond
▲ How Bakken, Eagle Ford, and other light liquid supplies are impacting midstream and downstream markets; key areas of focus include:
• Reservoir quality and productivity impacts on future light liquid supplies – Forecasting the Eagle Ford, Bakken, and other light liquids from evolving North America
plays – Crude quality mix
• Changing supply patterns impact disposition – Refining – Petrochemicals – Product exports