Implications of Biophysical Trajectory for policy Decision ... · BaU: Business as Usual, MS: More...
36
Munsur RAHMAN, Professor, Institute of Water and Flood Management, Bangladesh University of Engineering and Technology, Dhaka, Bangladesh (on behalf of the ESPA Deltas Full Consortium) Implications of Biophysical Trajectory for policy Decision in the Ganges‐ Brahmaputra‐Meghna Delta ESPA 2015 Annual Science Conference Wednesday, 25 th – Thursday, 26 th November 2015 London, UK ESPA Delta- ‘Assessing Health, Livelihoods, Ecosystem Services and Poverty Alleviation in Populous Deltas’ (NE-J002755-1)’
-
Upload
nguyenkhue -
Category
Documents
-
view
215 -
download
0
Transcript of Implications of Biophysical Trajectory for policy Decision ... · BaU: Business as Usual, MS: More...
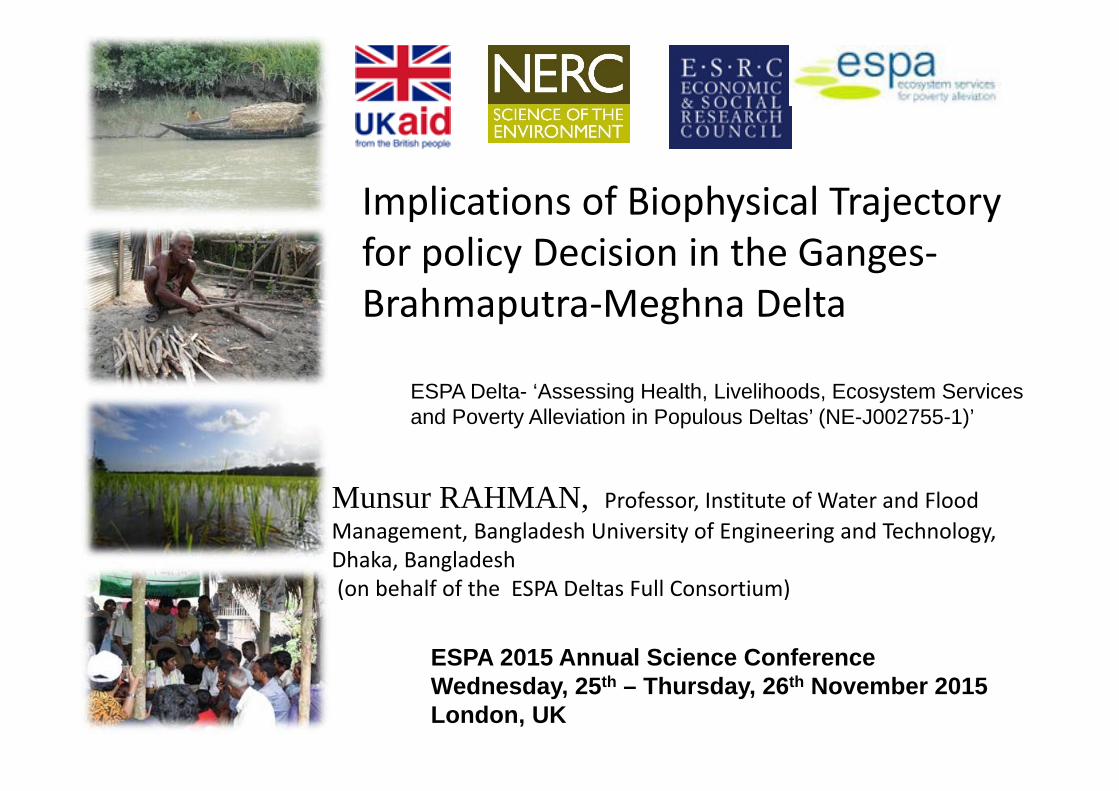
Munsur RAHMAN, Professor, Institute of Water and Flood Management, Bangladesh University of Engineering and Technology, Dhaka, Bangladesh(on behalf of the ESPA Deltas Full Consortium)
Implications of Biophysical Trajectory for policy Decision in the Ganges‐Brahmaputra‐Meghna Delta
ESPA 2015 Annual Science ConferenceWednesday, 25th – Thursday, 26th November 2015 London, UK
ESPA Delta- ‘Assessing Health, Livelihoods, Ecosystem Services and Poverty Alleviation in Populous Deltas’ (NE-J002755-1)’

Ecosystem Services in GBM Delta10
0 km
from
the coast a
ccom
mod
ate 1/4t
hPo
pulatio
n who
are often po
or and
live with
a high de
pend
ence on ES

Lecture 4. Climate change and the integrated coastal system. Wednesday
25 July 2007
Cyclones/ Marine Processes
River Floods/ Sediment Supply
Sedimentation,Tectonics, Subsidence, salinization, water logging, storm surges, polderization
NATURAL PROCESSES
ClimateVariability
Stresses in the GBM Delta

Lecture 4. Climate change and the integrated coastal system. Wednesday
25 July 2007
Cyclones/ Marine Processes
River Floods/ Sediment SupplyChanging Land Use/Catchment Management
Sedimentation,Tectonics, Subsidence, salinization, water logging, storm surges, polderizationGrowing Populationand Economy
NATURAL PROCESSES
HUMAN‘PROCESSES’
‘GlobalClimate Change’
ClimateVariability
Multiple Stresses in the GBM Delta

During the ESPA Deltas project activities (2012‐ 2015): Key Questions from policy makers and local community?
Sealevel rise?(… cm/100y)
Or diff time scale
More /extremeFloods/ storms?
More/intenserainfall?
Spatialdevelopments
Subsidence?
More summer Drought?
Salt Intrusion?
Decreasedriver
Discharge?
Increased river
Discharge?
Increased Erosion?
5
Potential Impact of those above on ES Resources (agriculture, fisheries,Forestry, fresh drinking water), infrastructure, disaster preparedness atdifferent time scale

To answer the above Questions and related issues:
What are the key drivers? How will these change with time and how do they interact?What are the consequences of these changes for the Ecosystem
System services of Delta? How will these affect the people, particularly the poor? How can policy processes use this science?

THE CONSORTIUM (around 100 members)
• University of Southampton‐Lead Robert Nicholls PI (Biophysical Modelling)
• University of Oxford (Scenario Development)
• Exeter University (Ecosystem Services and Poverty)
• Dundee University (Legal context)
• Hadley Centre MET office (Climate Change Modelling)
• Plymouth Marine Laboratories (Fisheries Modelling)
• National Oceanography Centre Liverpool (Marine Modelling)
• JadavpurUniversity (MangroveModelling): Indian Lead
• IIT Kanpur (Hydrological Modelling)
• Institute of Water and Flood Management, Bangladesh University of Engineering and Technology (BUET) – Prof Rahman Lead PI (Physical Modelling)
• Bangladesh Institute of Development Studies (BIDS) Institute of Livelihood Studies (ILS)
• Ashroy Foundation• Institute of International Centre for
Diarrhoeal Disease Research, Bangladesh (ICDDR,B)
• Center for Environmental and Geographic Information Services (CEGIS)
• Bangladesh Agricultural University• Bangladesh Agricultural Research Institute
(BARI)• Technological Assistance for Rural
Advancement (TARA)• International Union for Conservation of
Nature (IUCN) • University of Dhaka• Water Resources Planning Organization
(WARPO) Database/others
UK (7)
Bangladesh (12)India (2)
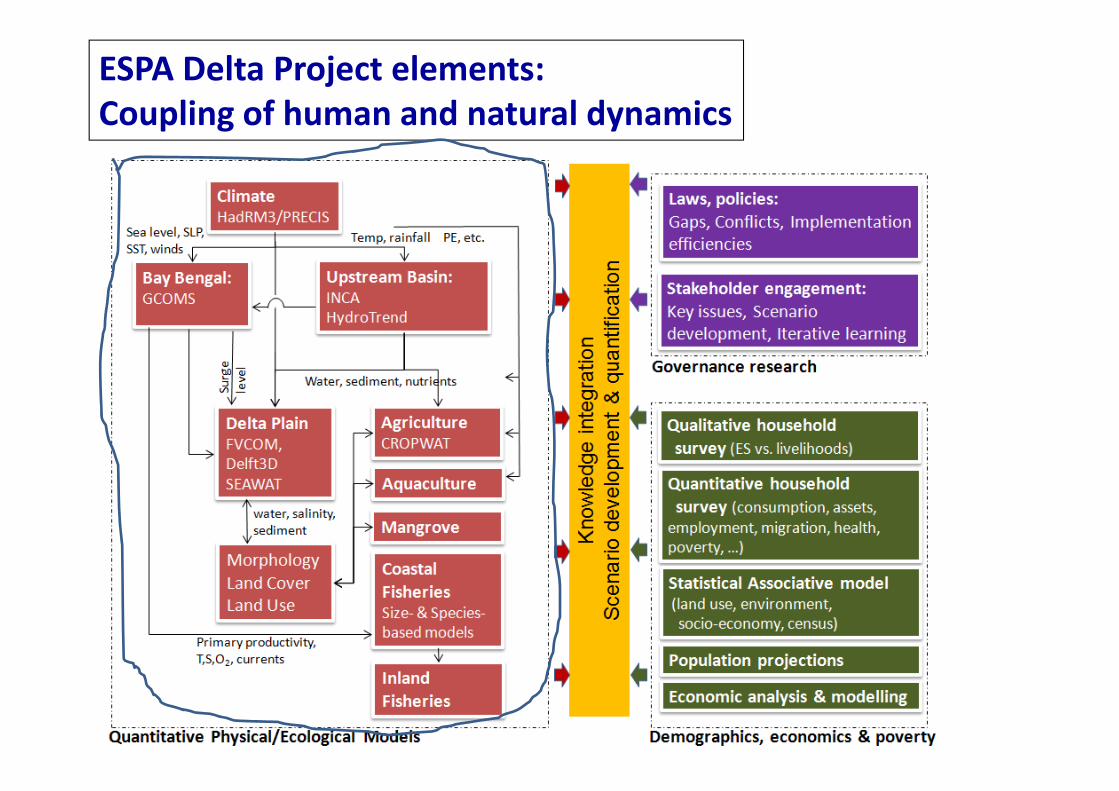
ESPA Delta Project elements: Coupling of human and natural dynamics

Hossain et al. (2014)
Since the 1950s, increasinggross domestic productand per capita incomemirror rising levels of foodand inland fish production(PS).
In contrast, non‐foodecosystem services (RS)such as water availability,water quality and landstability (RS) havedeteriorated.
Trade‐offs between use of environmental resources and development
Fact: Historical trends and trade‐offs
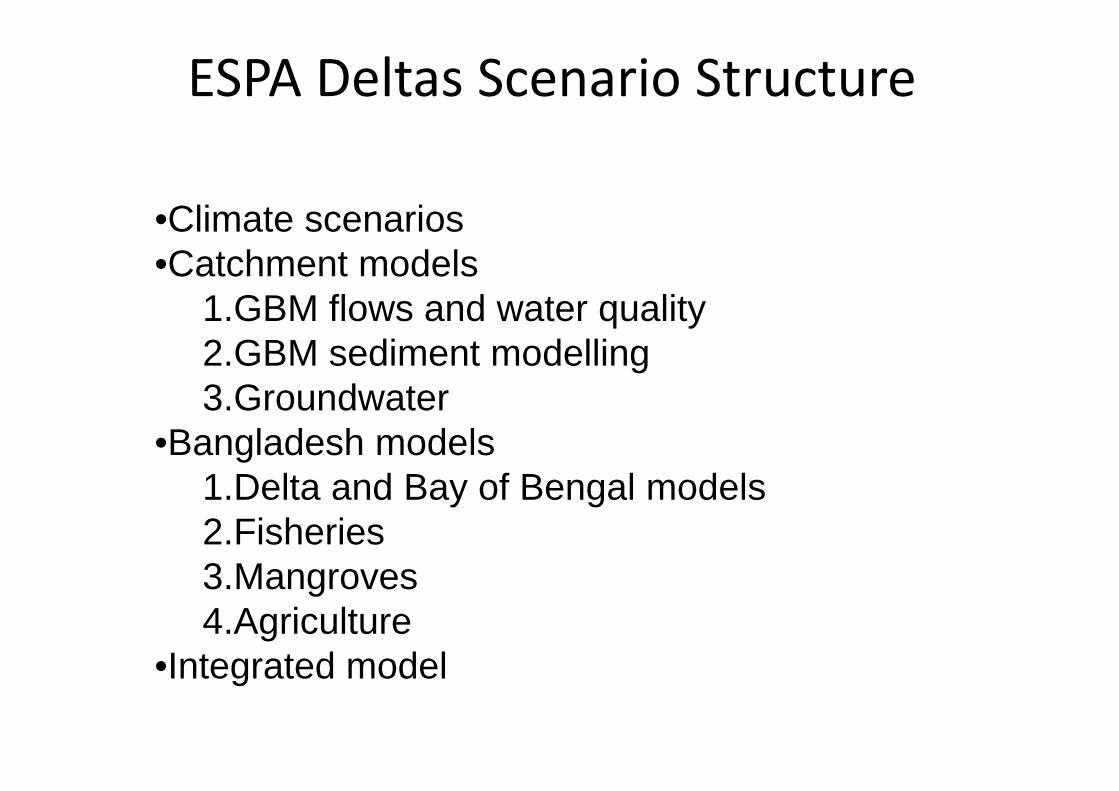
ESPA Deltas Scenario Structure
•Climate scenarios•Catchment models
1.GBM flows and water quality2.GBM sediment modelling3.Groundwater
•Bangladesh models1.Delta and Bay of Bengal models2.Fisheries3.Mangroves4.Agriculture
•Integrated model

Mid‐century
• There are 17 ensemble members of the regional climate model (called Q0‐Q16) for 1971‐2099.
• All ensemble members indicate warming over the region by end of 21stcentury (range from about 2.5°C to 5.0°C by 2080‐99).
• All ensemble members indicate increased annual rainfall by end of century (5‐30% increases by 2080‐99).
Sea Level RiseSea level rise of 0.25 to 1 m, with an upper extreme of 1.5 m
End of centuryClimate Scenario
Caesar et al. (2015)
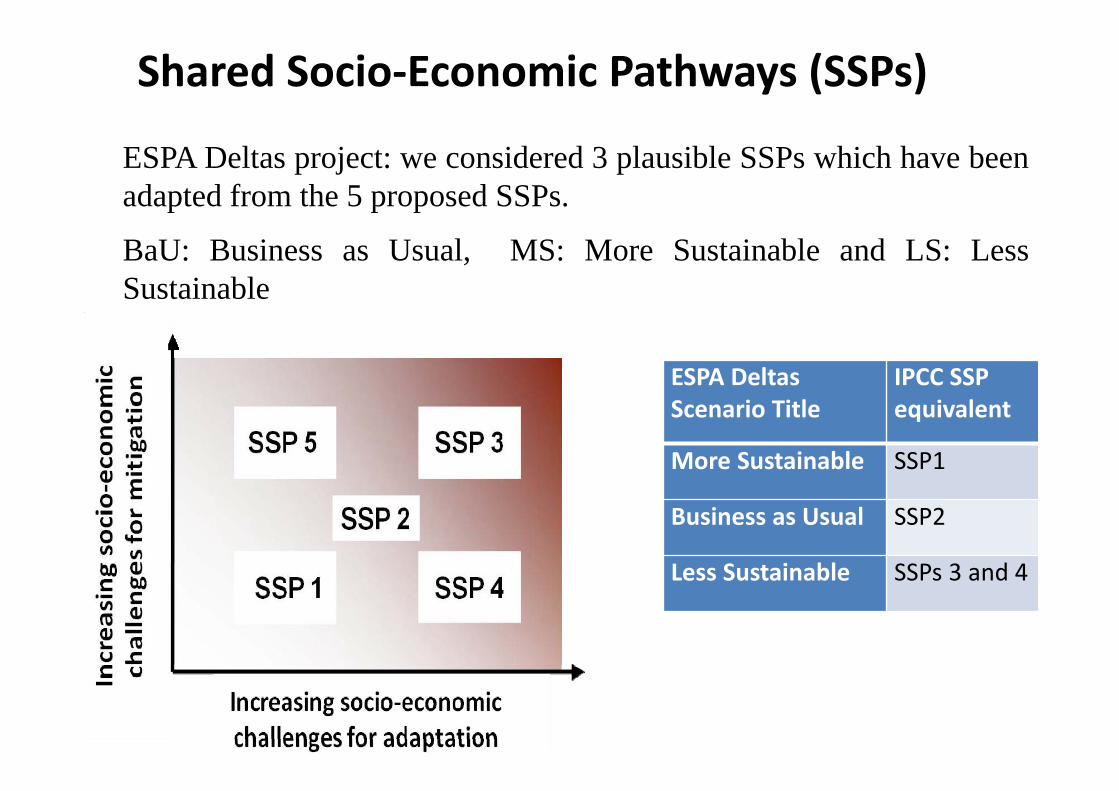
Shared Socio‐Economic Pathways (SSPs)
ESPA Deltas Scenario Title
IPCC SSP equivalent
More Sustainable SSP1
Business as Usual SSP2
Less Sustainable SSPs 3 and 4
ESPA Deltas project: we considered 3 plausible SSPs which have beenadapted from the 5 proposed SSPs.
BaU: Business as Usual, MS: More Sustainable and LS: LessSustainable
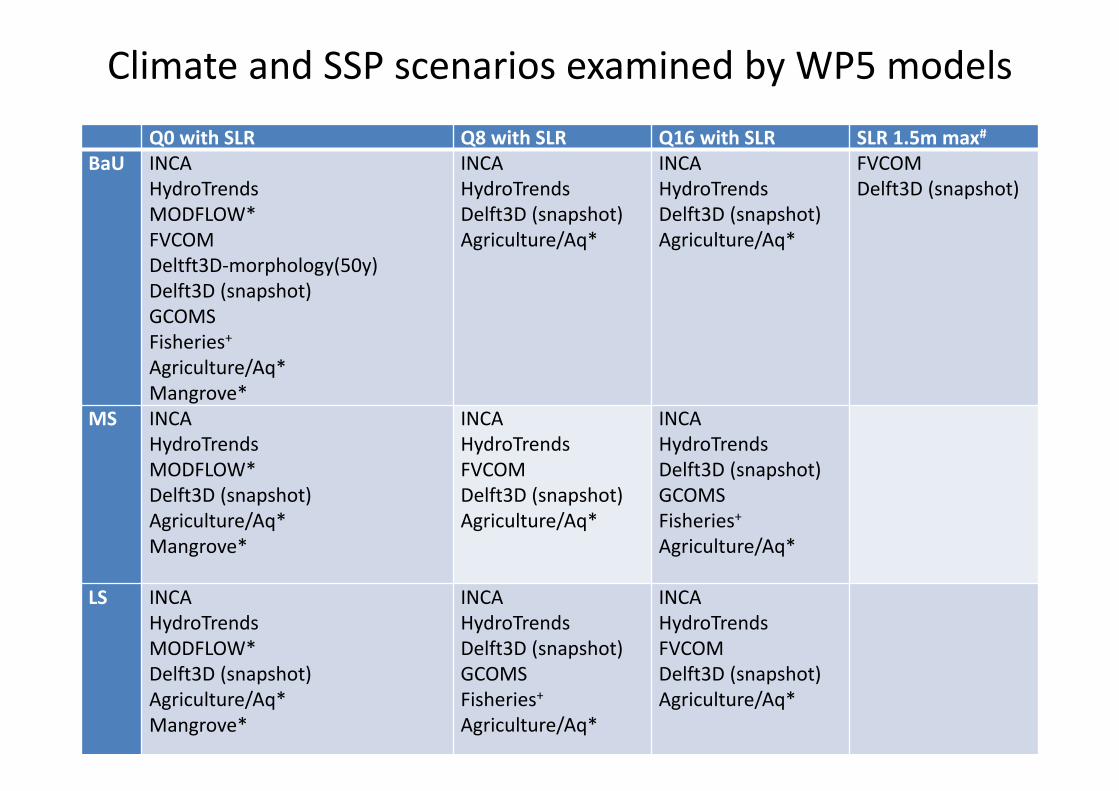
Climate and SSP scenarios examined by WP5 modelsQ0 with SLR Q8 with SLR Q16 with SLR SLR 1.5m max#
BaU INCAHydroTrendsMODFLOW*FVCOMDeltft3D‐morphology(50y)Delft3D (snapshot)GCOMSFisheries+Agriculture/Aq*Mangrove*
INCAHydroTrendsDelft3D (snapshot)Agriculture/Aq*
INCAHydroTrendsDelft3D (snapshot)Agriculture/Aq*
FVCOMDelft3D (snapshot)
MS INCAHydroTrendsMODFLOW*Delft3D (snapshot)Agriculture/Aq*Mangrove*
INCAHydroTrendsFVCOMDelft3D (snapshot)Agriculture/Aq*
INCAHydroTrendsDelft3D (snapshot)GCOMSFisheries+Agriculture/Aq*
LS INCAHydroTrendsMODFLOW*Delft3D (snapshot)Agriculture/Aq*Mangrove*
INCAHydroTrendsDelft3D (snapshot)GCOMSFisheries+Agriculture/Aq*
INCAHydroTrendsFVCOMDelft3D (snapshot)Agriculture/Aq*

Quantitative Scenario of Delta Model Scenario
Scenario No.
Scenario Description
Snapshots
Upstream Discharge Boundary(Has provided by Oxford Group)
Downstream Sea Level Boundary(Has provided by Met Office Group)
1 Q0 + BaU + A1B
Maximum discharge year (2040 –2060)
Q0 + BaUHourly time series data
SnapshotMaximum Discharge Year
Q0 + BaU + A1BHourly time series data
SnapshotMaximum Discharge Year
Snap shots of Catchment Models

Changes in river flows
• Increase in flow projected potential for increased flooding.
• Dry season flows projected to improve with climate change – but extreme low flow durations may increase.
• Impact of major infrastructure in neighbouringcountries may mean reduction in dry season flows
Climate change
Socio-economic change in the GBM Basin
Changes in river flows, water quality and sediment
Whitehead et al. (2015)
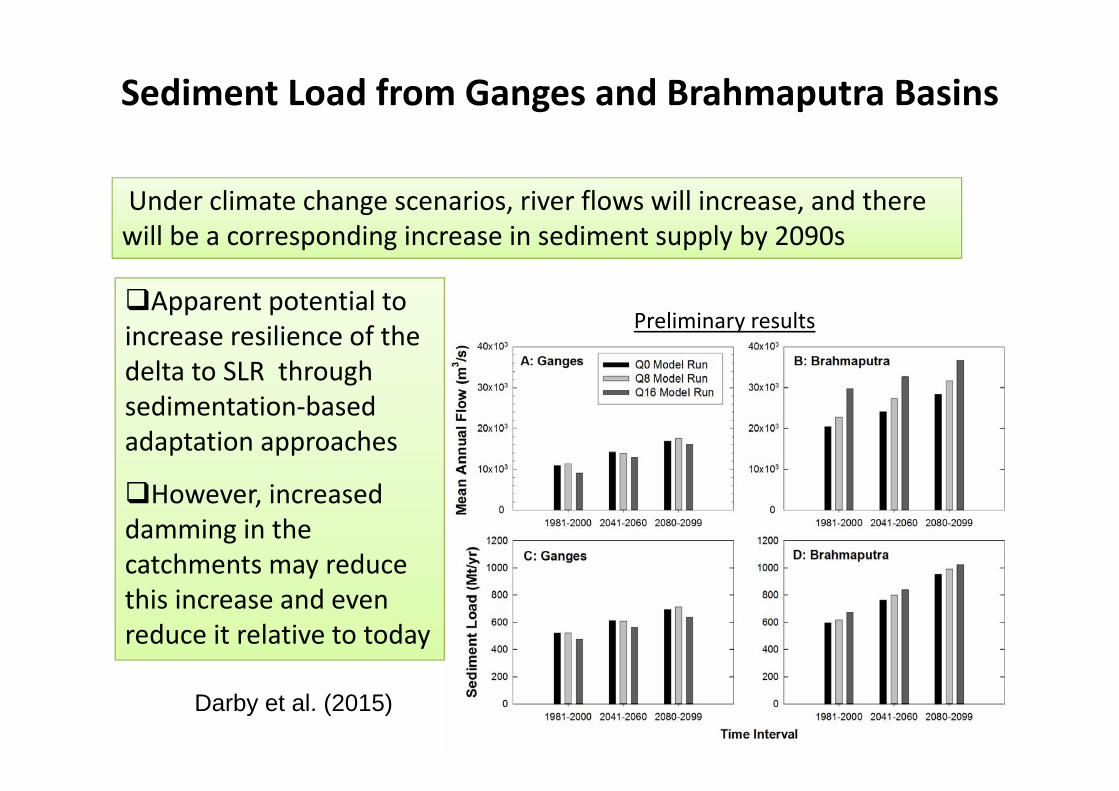
Sediment Load from Ganges and Brahmaputra Basins
Preliminary results
Under climate change scenarios, river flows will increase, and there will be a corresponding increase in sediment supply by 2090s
Apparent potential to increase resilience of the delta to SLR through sedimentation‐based adaptation approaches
However, increased damming in the catchments may reduce this increase and even reduce it relative to today
Darby et al. (2015)
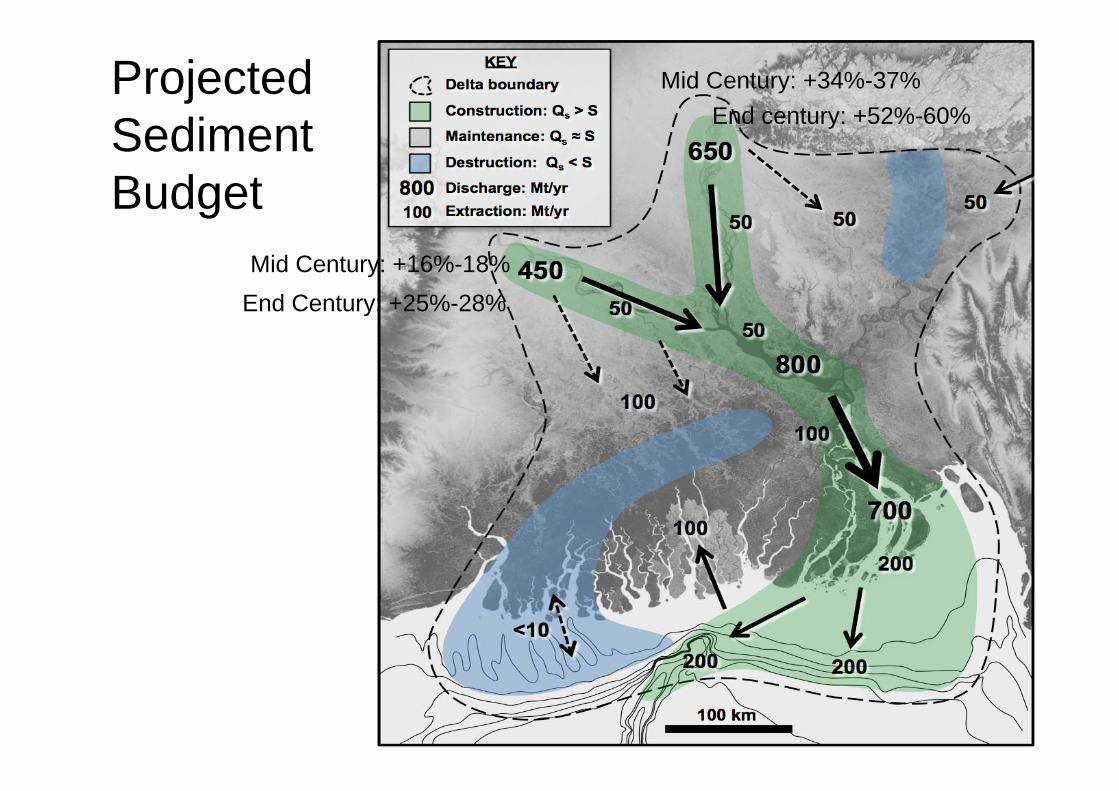
Mid Century: +16%-18%End Century: +25%-28%
Mid Century: +34%-37%End century: +52%-60%
Projected Sediment Budget

Salinisation of the Groundwater (2015)
Complex groundwater system represented by conceptual numerical model at regional scale
• Lateral sea water intrusion is an extremely slow process (thousands of years)• SLR will have little impact on increasing groundwater salinity over smaller time
scales (e.g. 100 years)• River salinity changes (via SLR and reduced u/s flow) is the major driver of
change for groundwater salinity in upper aquifer over most of coastal zone• Pumping is another potential driver of change for groundwater salinity
• Shallow GW pumping concentrated in northern areas
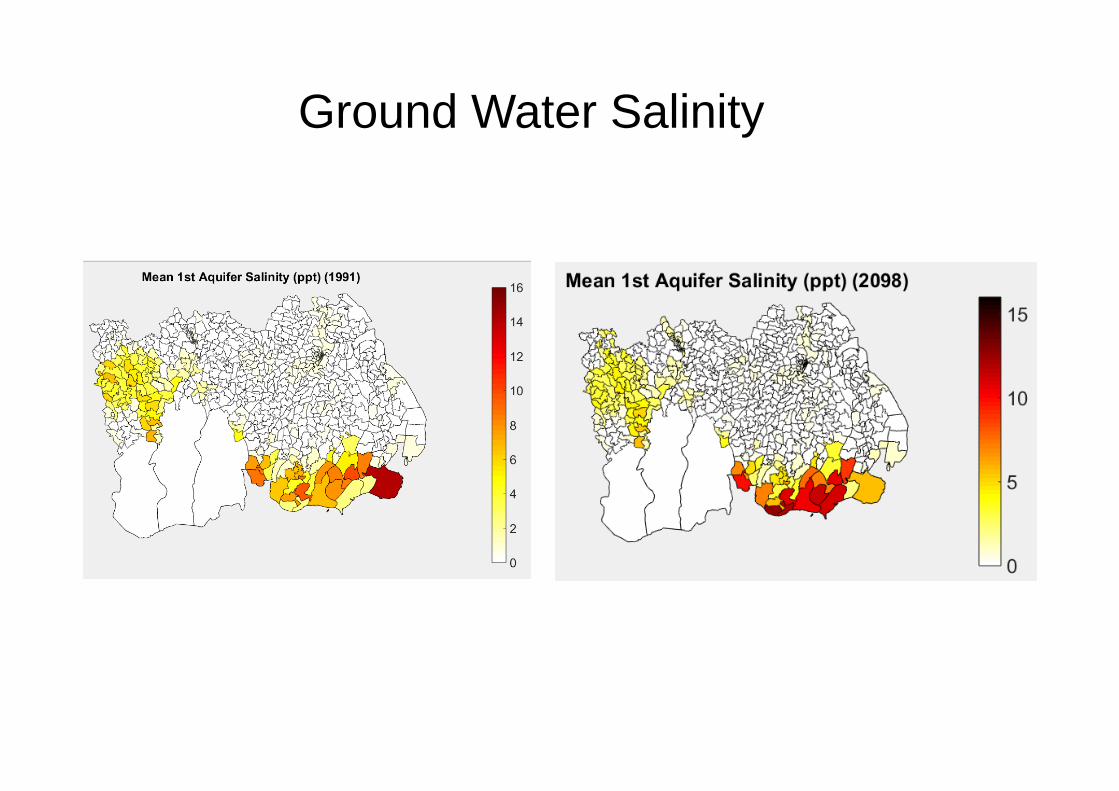
Ground Water Salinity

Snap Shots of Delta Scale Models
Examples of snap shots of Biophysical Trajectory
• Erosion‐ Sedimentation• Flooding• Cyclonic storm surges • SalinizationRelationships with ES• Agriculture • Fisheries and • Sundarban mangrove forest
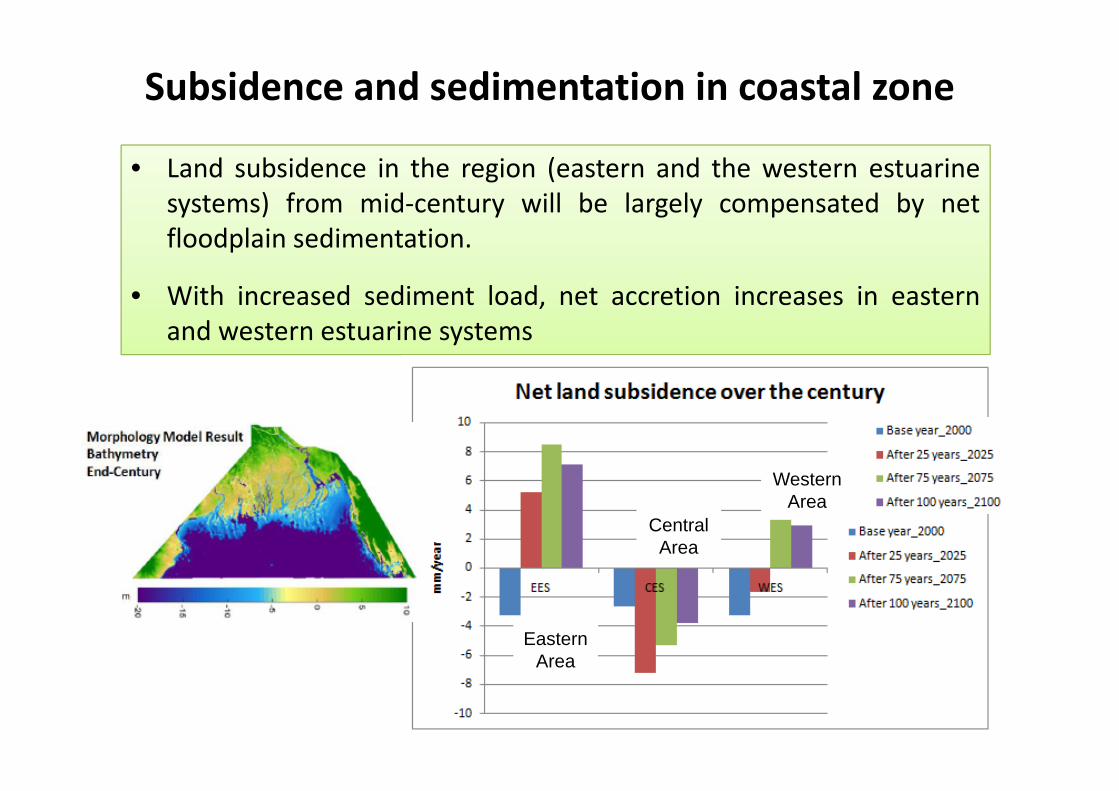
Subsidence and sedimentation in coastal zone
• Land subsidence in the region (eastern and the western estuarinesystems) from mid‐century will be largely compensated by netfloodplain sedimentation.
• With increased sediment load, net accretion increases in easternand western estuarine systems
Eastern Area
Central Area
Western Area


Changes in Coastal Flooding
• Coastal floods will start earlier than the present and will last longer.
• Some of the existing polders will be overtopped in mid‐century and end‐century for fluvio‐tidal flooding
Fluvio-tidal flooding 2100

Storm Surge Snap shot:Present Day Inundation
Inundated Area: 1445 km2
Maximum Inundation Depth: 5.03 m
Inundated Area: 1024 km2
Maximum Inundation Depth: 3.22 m

Mid Century Inundation Scenario for Sidr-like Cyclone
Inundated Area: 6190 km2
Maximum Inundation Depth: 5.04 m
Inundated Area: 7045 km2
Maximum Inundation Depth: 5.74 m
Inundated Area: 4677 km2
Maximum Inundation Depth: 5.74 m
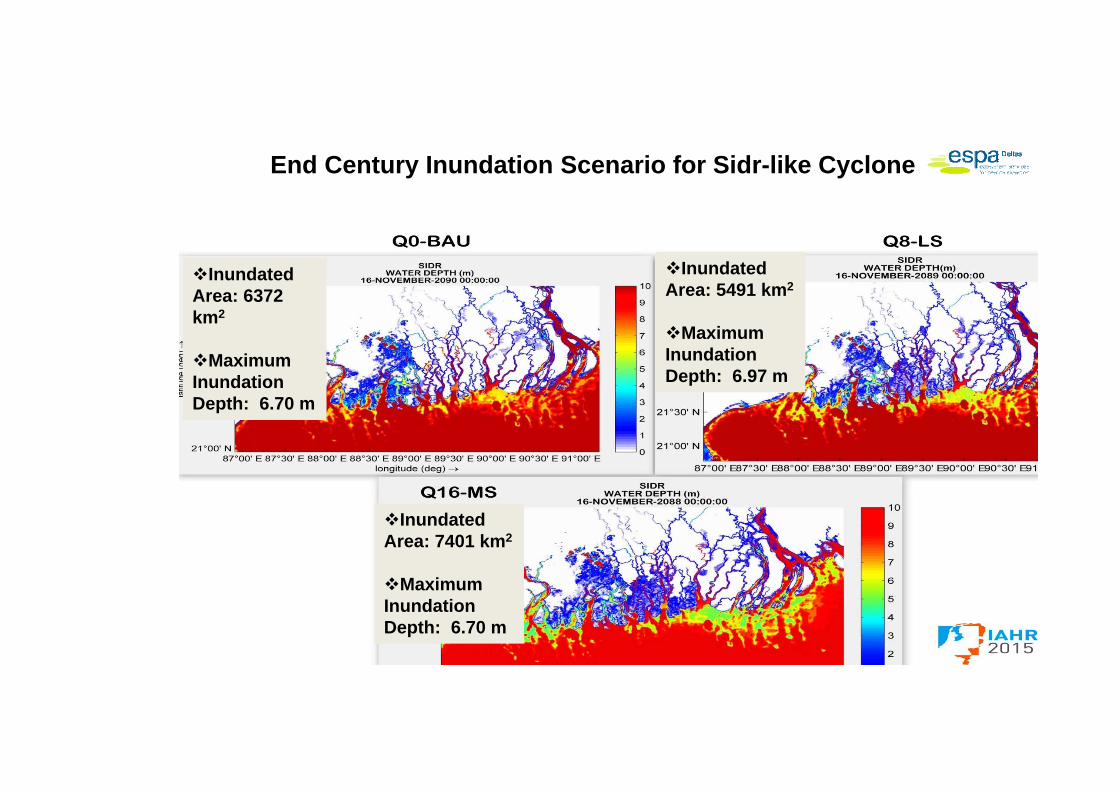
End Century Inundation Scenario for Sidr-like Cyclone
Inundated Area: 6372 km2
Maximum Inundation Depth: 6.70 m
Inundated Area: 5491 km2
Maximum Inundation Depth: 6.97 m
Inundated Area: 7401 km2
Maximum Inundation Depth: 6.70 m

River salinity to increase with SLR and changes in upstream flow: Implication to ES
Haque and others (2014, 2015, 2016)

Past TrendSalinity affected area has increased by about 27% during the last 4 decadesYield expected to decrease with soil salinity increaseCropping patterns have changed
Salinisation and climate change impacts on agriculture
Spatial distribution of increasing salinity impacts on dry season agricultural yields (2050)
Future climate change impactsBoro rice ‐ drastic reduction in yield (high heat stress during flowering)Wheat ‐ increase in yield (favourable temp. during flowering and CO2 fertilization)Mustard – No significant impact
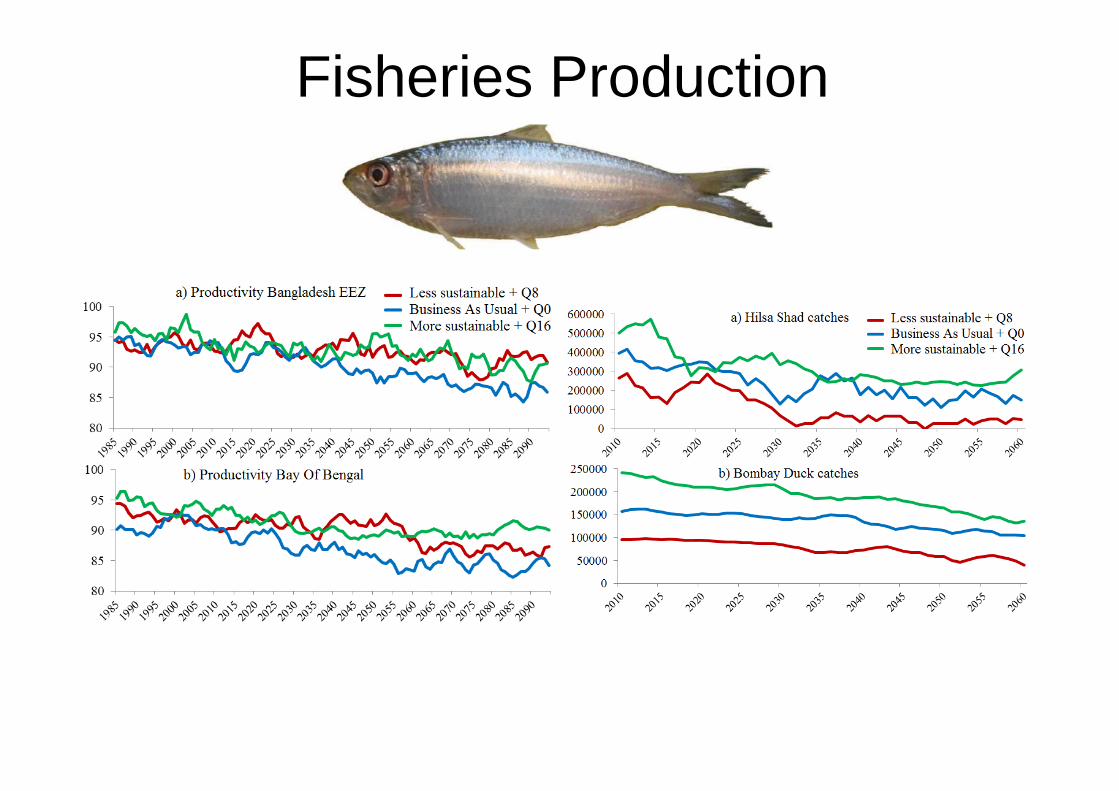
Fisheries Production

Sundarbans critical in providing ES to the poor• Sundarbans significant in providing a buffer to protect the region from
storm surge flooding.• Mangrove area projected to decrease moderately (13%) under moderate
SLR, but substantially (43%) under high SLR projections by 2100• Increasing dominance of salt tolerant species suggests salinisation of the
Sundarbans.
Anirban et al. (2015)
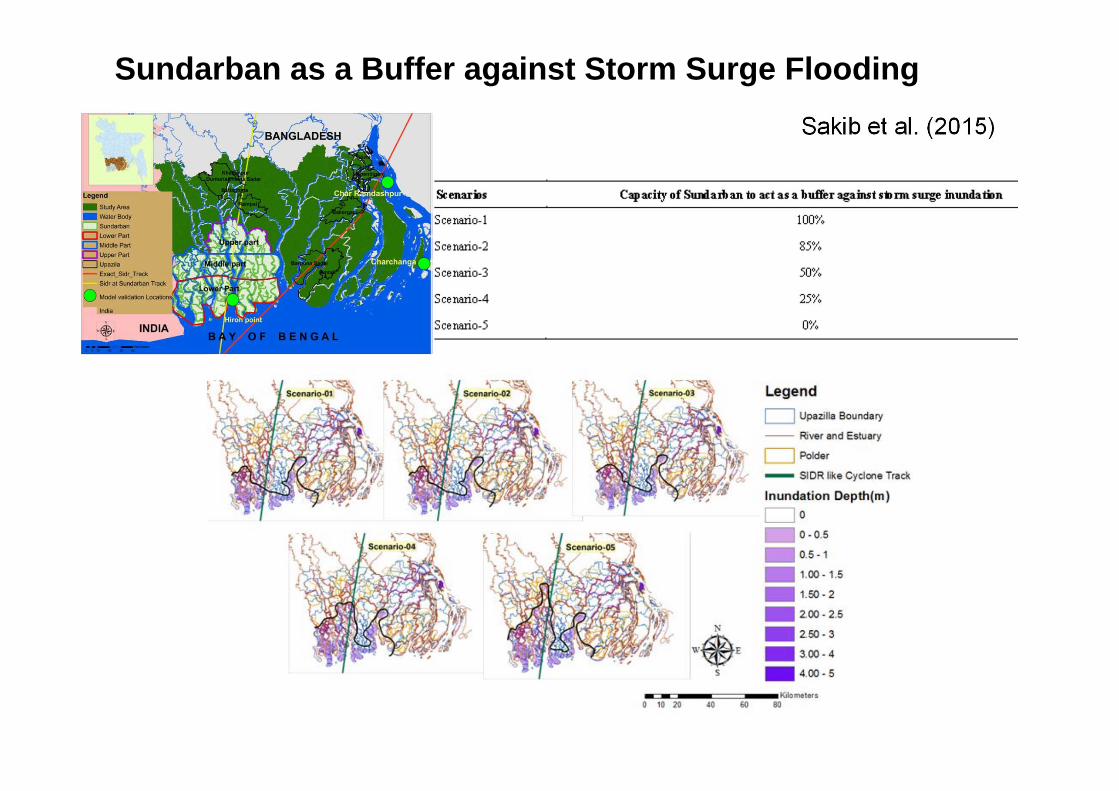
Sundarban as a Buffer against Storm Surge FloodingSakib et al. (2015)
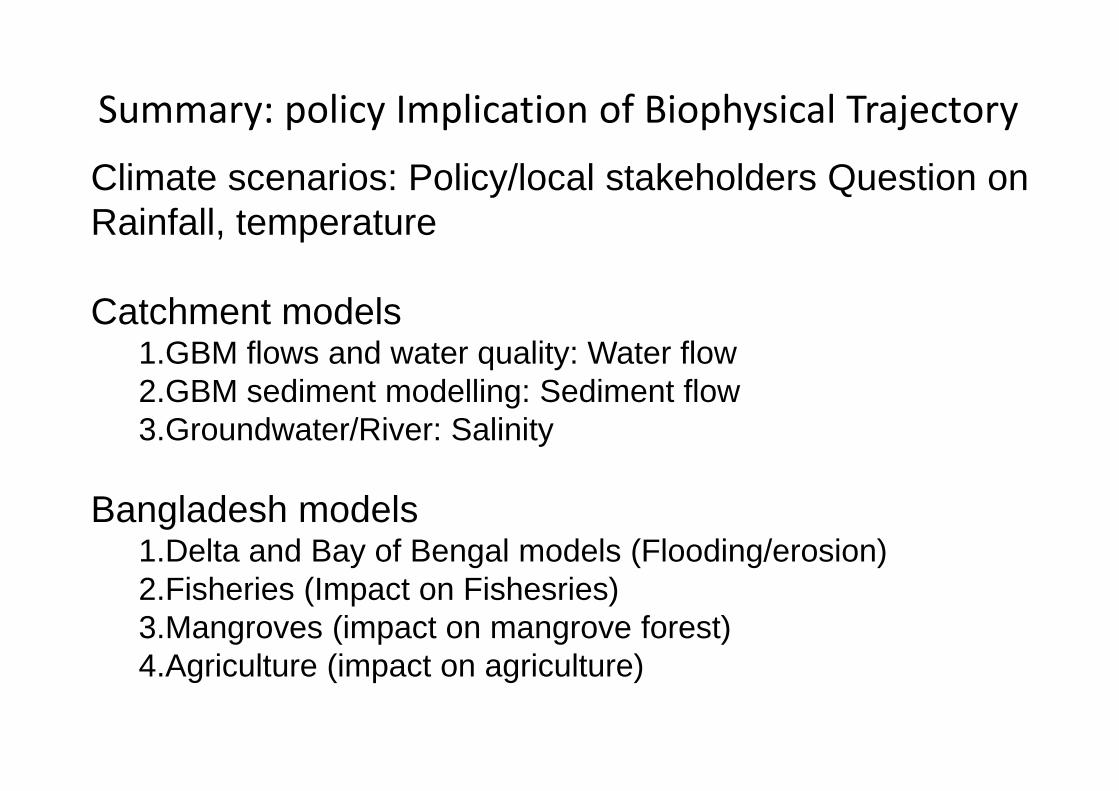
Summary: policy Implication of Biophysical Trajectory
Climate scenarios: Policy/local stakeholders Question onRainfall, temperature
Catchment models1.GBM flows and water quality: Water flow2.GBM sediment modelling: Sediment flow3.Groundwater/River: Salinity
Bangladesh models1.Delta and Bay of Bengal models (Flooding/erosion)2.Fisheries (Impact on Fishesries)3.Mangroves (impact on mangrove forest)4.Agriculture (impact on agriculture)